Ancestral reconstruction of duplicated signaling proteins reveals the evolution of signaling specificity
- Department of Biology, Massachusetts Institute of Technology, United States
- Howard Hughes Medical Institute, Massachusetts Institute of Technology, United States
Figures
Figure 1 with 2 supplements
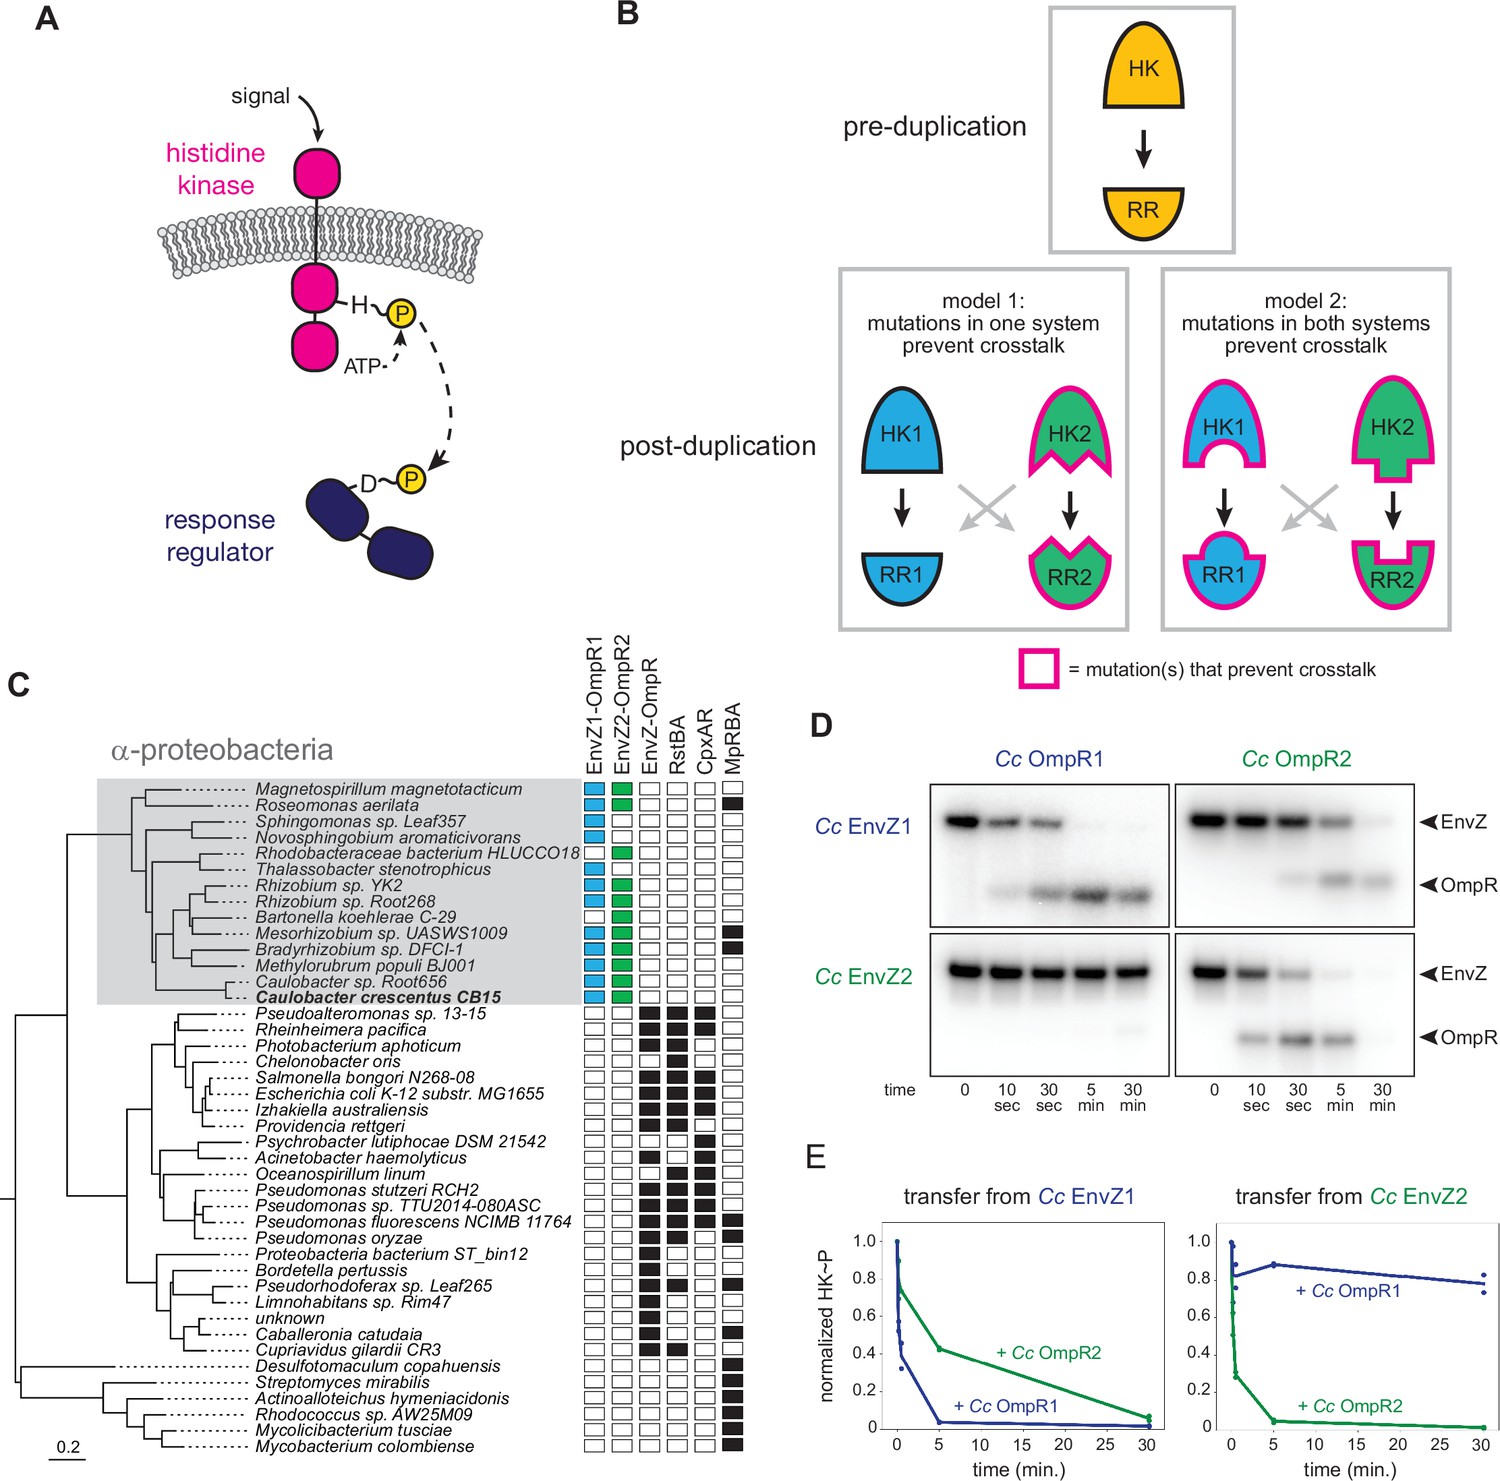
EnvZ-OmpR duplication and divergence in C. crescentus.
(A) Two-component signal transduction. A sensor histidine kinase autophosphorylates upon activation and transfers a phosphoryl group to a cognate response regulator to activate an intracellular response. (B) Two models for acquisition of paralog specificity after duplication of an interacting histidine kinase (HK) and response regulator (RR). Model 1: both proteins in one system acquire compensatory mutations that maintain their interaction while preventing interaction with the other system. Model 2: all four proteins acquire mutations that prevent crosstalk between systems. (C) Phylogenetic species tree of proteobacteria inferred from 27 ribosomal protein sequences showing distribution of EnvZ-OmpR homologs and related systems. Scale bar indicates substitutions per site. (D) In vitro phosphotransfer specificity of C. crescentus EnvZ and OmpR paralogs. Purified histidine kinase (cytoplasmic domain only) was autophosphorylated and then mixed with a given purified response regulator and incubated for the time indicated. At t=0 a single upper band corresponds to the autophosphorylated HK. At subsequent time points, a second, lower band corresponding to the RR appears as the kinase transfers its phosphoryl group leading to depletion of the autophosphorylated HK. At longer time points phosphatase activity of the HK can lead to disappearance of the phosphorylated RR. (E) Quantification of phosphorylated HK over time in (D). Values were normalized to t=0 for each HK-RR pair. Lines represent mean (n=2) and dots represent independent replicates.
-
Figure 1—source data 1
Quantified phosphotransfer values for Figure 1E.
- https://cdn.elifesciences.org/articles/77346/elife-77346-fig1-data1-v2.xlsx
Figure 1—figure supplement 1
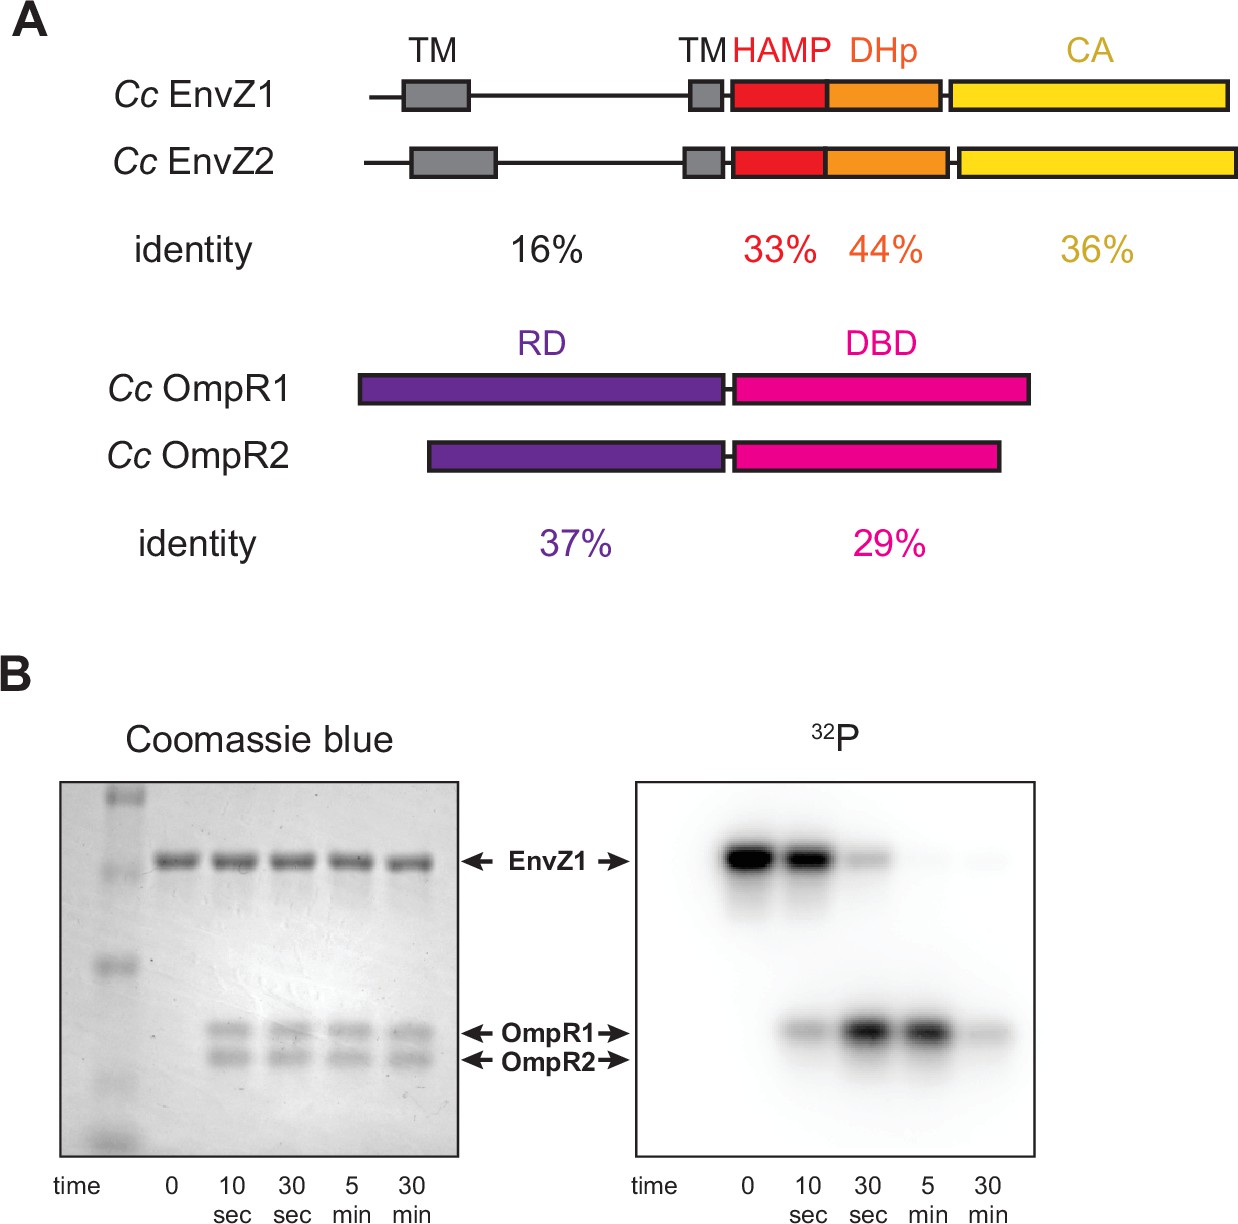
Comparison of extant EnvZ-OmpR paralogs.
(A) (Top) Comparison of C. crescentus EnvZ1 (CC1181) and EnvZ2 (CC2932) domain structure, with sequence identity indicated below each domain (TM=transmembrane domain, DHp=dimerization and histidine phosphotransfer domain, HAMP=histidine kinases, adenylyl cyclases, methyl-accepting chemotaxis proteins, and phosphatases domain, CA=catalytic and ATP binding domain). (Bottom) Comparison of C. crescentus OmpR1 (CC1182) and OmpR2 (CC2931) domain structure, with sequence identity indicated below each domain (RD=receiver domain, DBD=DNA-binding domain). (B) Coomassie blue stain (left) and autoradiograph image of SDS-PAGE showing phosphotransfer from C. crescentus EnvZ1 to mixed C. crescentus OmpR1 and OmpR2. Arrows indicate identity of each protein as determined by Coomassie stain.
Figure 1—figure supplement 2
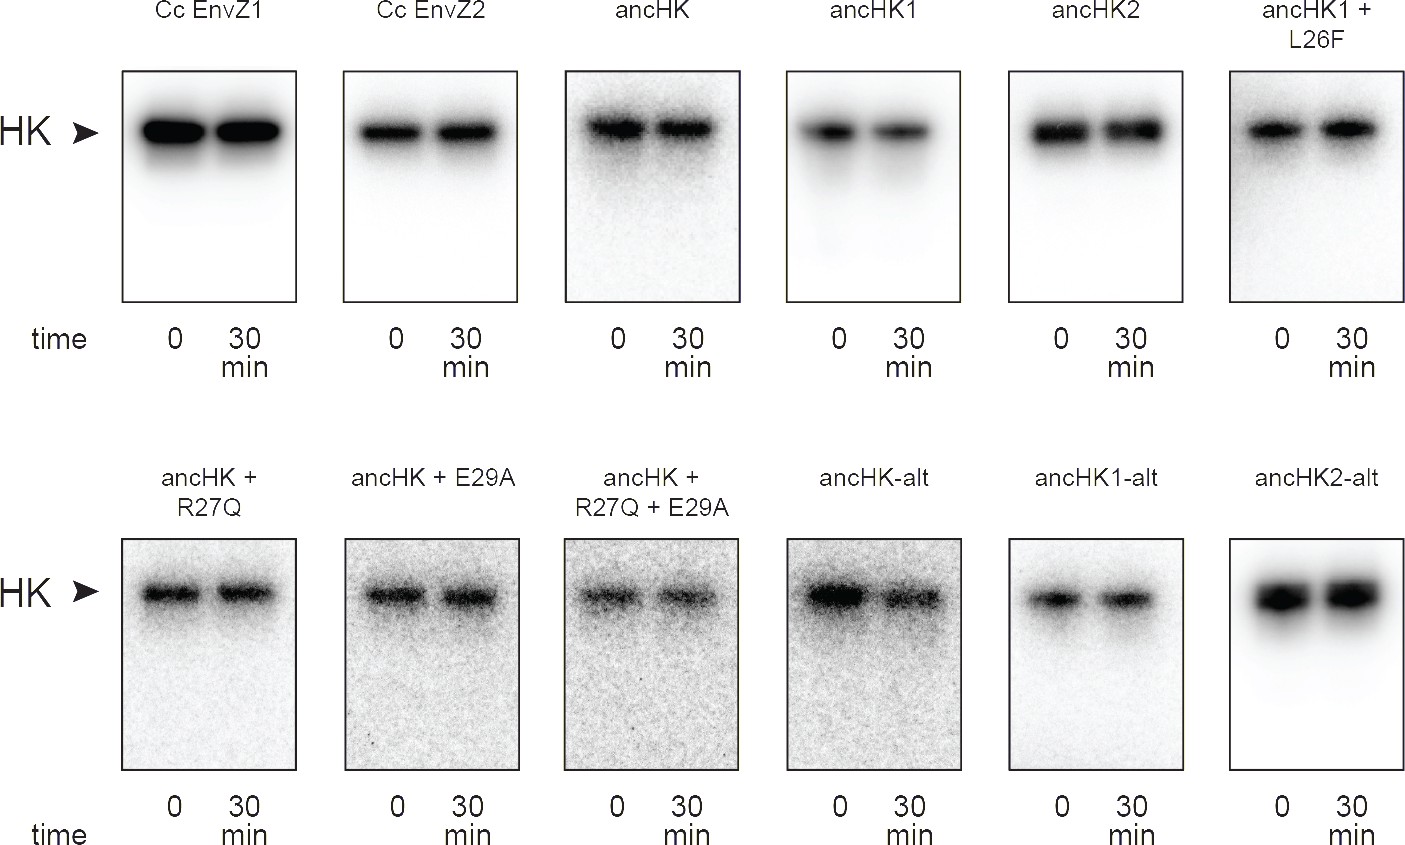
Phosphorylation of histidine kinases alone.
Phosphorylation of all described histidine kinases with no response regulator added for 30-min timecourse.
Figure 2 with 5 supplements

Inference of ancestral α-proteobacterial EnvZ-OmpR proteins.
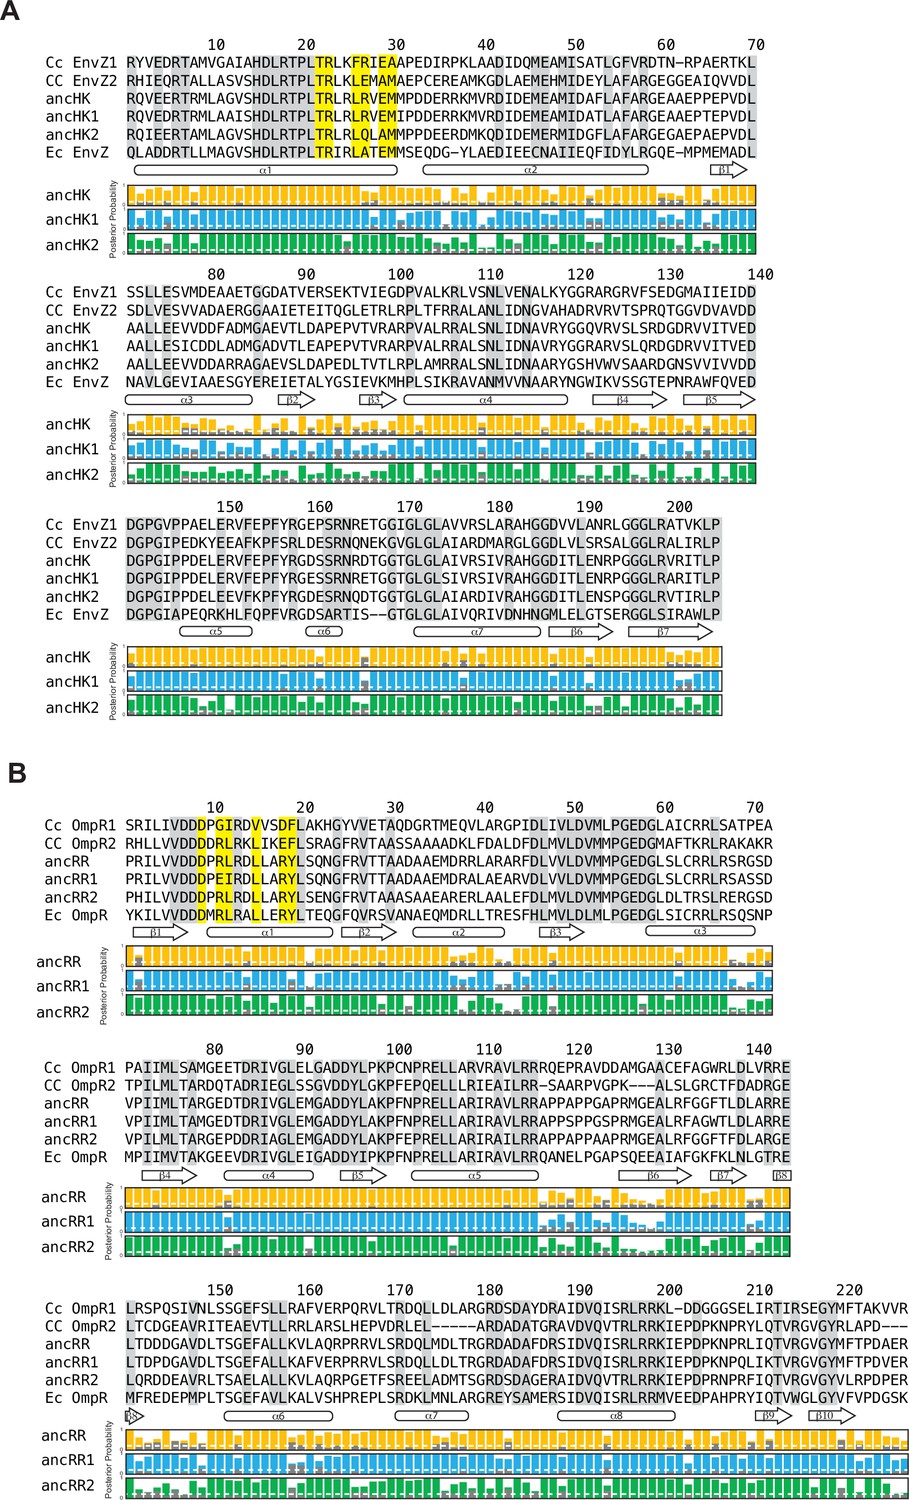
(A) Simplified phylogenetic tree of merged, matched EnvZ and OmpR sequences. Number of sequences in each clade indicated. Node support indicated by approximate likelihood ratio statistic (* indicates >10, ** indicates >100). Circles represent reconstructed ancestral protein pairs. Scale bar represents substitutions per site. For complete phylogeny, see Figure 2—figure supplement 1. (B–C) Multiple sequence alignment of EnvZ DHp domains (B) and OmpR receiver domains (C) from extant C. crescentus paralogs, ancHK-ancRR, ancHK1-ancRR1, ancHK2-ancRR2, and extant E. coli EnvZ-OmpR sequences. Residues conserved in both C. crescentus paralogs and all ancestors highlighted in grey; residues previously shown to strongly covary and dicatate specificity in E. coli EnvZ (Capra et al., 2010) highlighted in yellow. Secondary structure elements, based on AlphaFold prediction of the ancHK-ancRR complex shown below alignment. Posterior probabilities of reconstructed ancestral sequences at these positions shown for ancHK-RR (yellow), ancHK1-RR1 (blue), and ancHK2-RR2 (green) with most likely residue indicated by respective colors, and second most likely shown in grey. Dashed white line indicates posterior probability of 0.2, the threshold for identifying sites to be alternatively reconstructed (see Figure 2—figure supplement 4 and 5). (D) Phosphotransfer from autophosphorylated ancHK to ancRR.
Figure 2—figure supplement 1
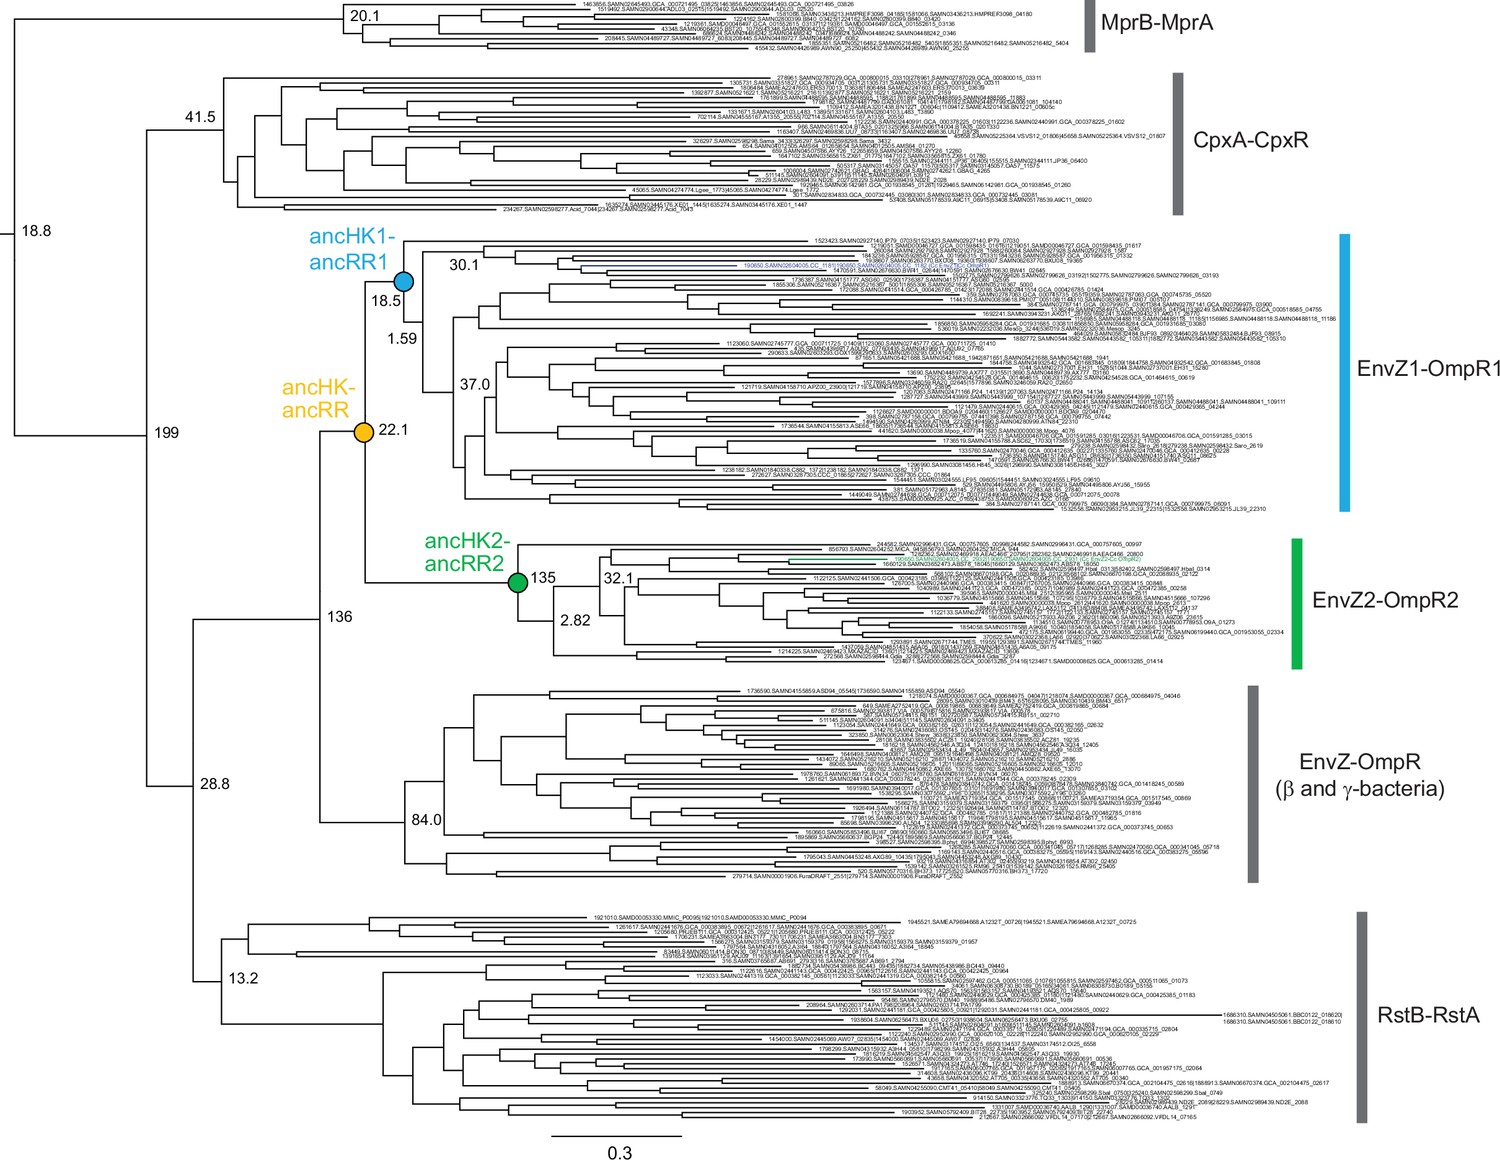
Phylogeny of EnvZ-OmpR paralogs and related systems.
Full phylogeny of matched, merged EnvZ and OmpR sequences and related two-component systems RstBA, CpxAR, and MprBA. Node support shown as approximate likelihood ratio statistic. Sequence identifiers from ProGenomes database (Mende et al., 2017). Reconstructed ancestral nodes indicated by colored circles. Scale bar represents substitutions per site.
Figure 2—figure supplement 2
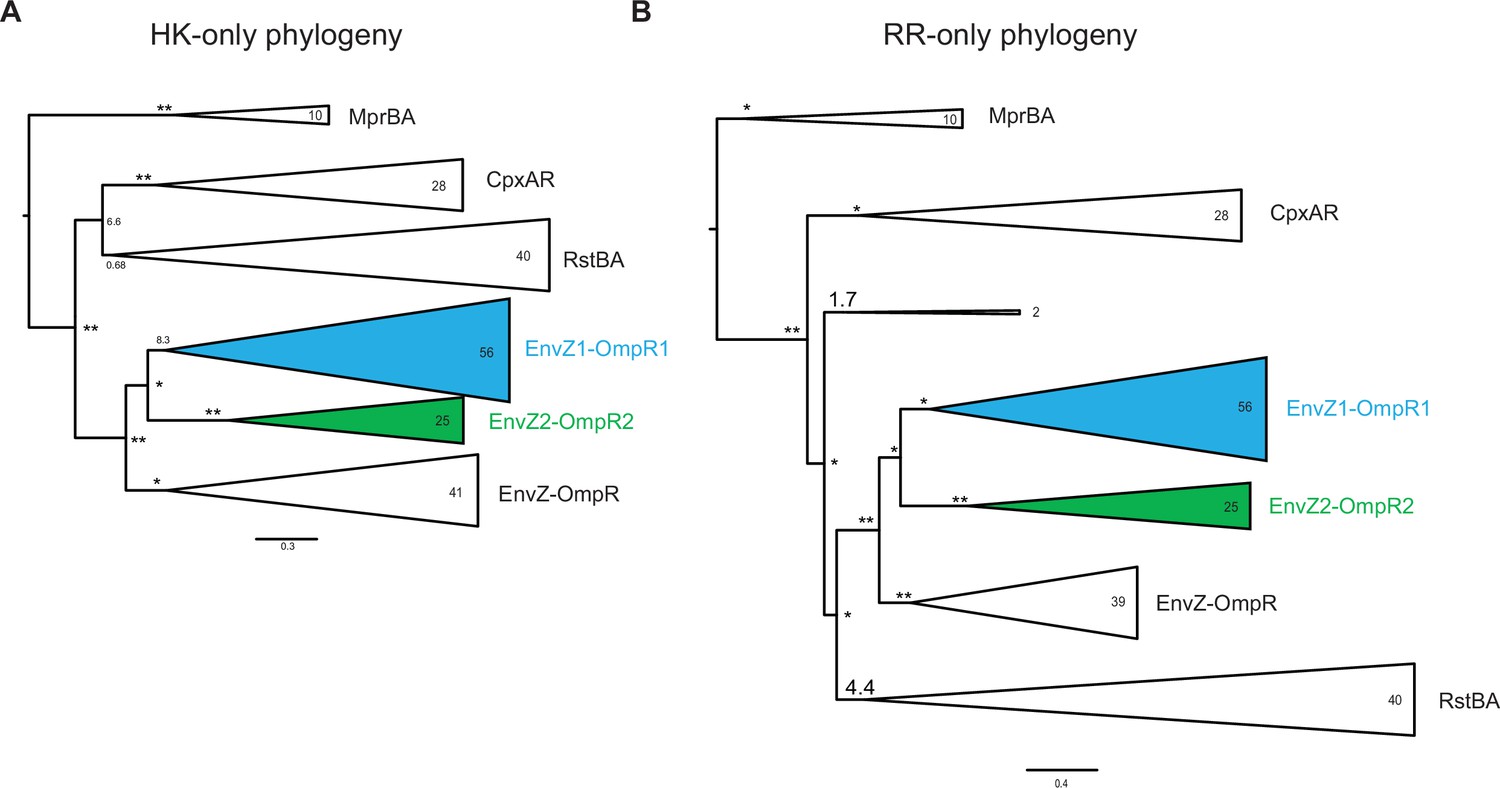
HK-only and RR-only phylogenies.
Simplified phylogenetic tree of EnvZ (A) and OmpR sequences (B) based on non-merged multiple sequence alignments. Number of sequences in each clade indicated. Node support indicated by approximate likelihood ratio statistic (* indicates >10, ** indicates >100). Scale bar represents substitutions per site.
Figure 2—figure supplement 3
Multiple sequence alignments of EnvZ and OmpR proteins.
(A–B) Multiple sequence alignment of EnvZ (DHp and CA domains) (A) and OmpR full protein (B) from extant C. crescentus paralogs, ancHK-ancRR, ancHK1-ancRR1, and ancHK2-ancRR2, and extant E. coli EnvZ and OmpR sequences. Residues conserved in both C. crescentus paralogs and all ancestors highlighted in grey; residues previously shown to strongly covary and dicatate specificity in E. coli EnvZ (Capra et al., 2010) highlighted in yellow. Secondary structure elements, based on AlphaFold prediction of ancHK-ancRR complex, shown below alignment. Posterior probabilities of reconstructed ancestral sequences at these positions shown for ancHK-ancRR (yellow), ancHK1-ancRR1 (blue), and ancHK2-ancRR2 (green) with most likely residue indicated by respective colors, and second most likely shown in grey. Dashed white line indicates posterior probability of 0.2, the threshold for identifying sites to be alternatively reconstructed (see Figure 2—figure supplement 4).
Figure 2—figure supplement 4
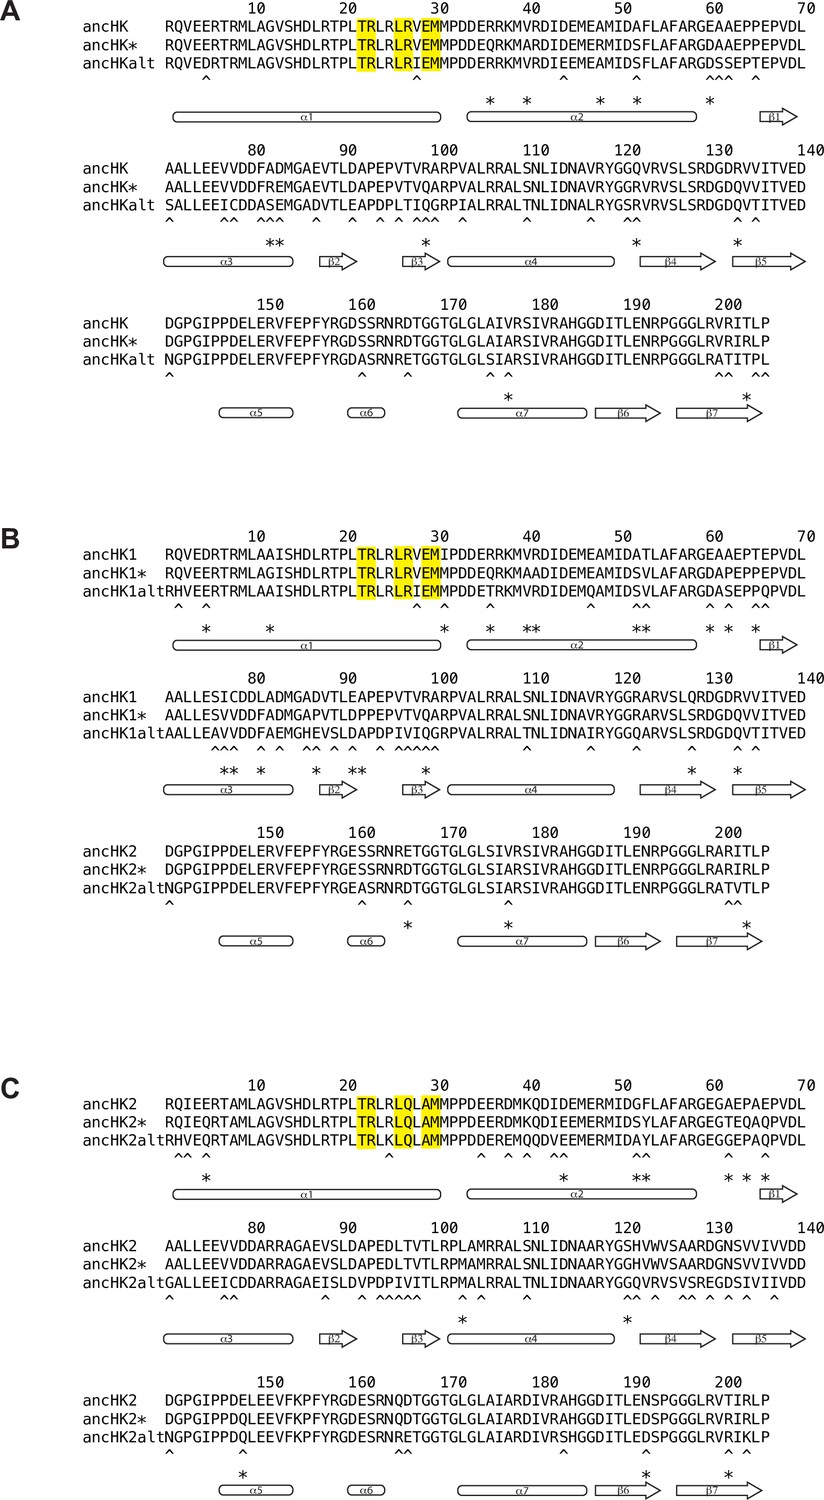
Alignment of ancestral HK sequences reconstructed using alternative techniques.
Comparison of ancHK (A), ancHK1 (B), and ancHK2 (C) sequences reconstructed using merged HK-RR alignment (ancHK, ancHK1, ancHK2), HK-only alignment (ancHK*, ancHK1*, ancHK2*), and merged HK-RR alignment with alternative “AltAll” residues (ancHKalt, ancHK1alt, ancHK2alt). Positions that differ between original ancestor (first line) and HK-only ancestor (second line) indicated with asterisks; positions that differ between original ancestor (first line) and AltAll ancestor (third line) indicated with asterisks.
Figure 2—figure supplement 5

Alignment of ancestral RR sequences reconstructed using alternative techniques.
Comparison of ancRR (A), ancRR1 (B), and ancRR2 (C) sequences reconstructed using merged HK-RR alignment (ancRR, ancRR1, ancRR2), RR-only alignment (ancRR*, ancRR1*, ancRR2*), and merged HK-RR alignment with alternative “AltAll” residues (ancRRalt, ancRR1alt, ancRR2alt). Positions that differ between original ancestor (first line) and RR-only ancestor (second line) indicated with asterisks; positions that differ between original ancestor (first line) and AltAll ancestor (third line) indicated with asterisks.
Figure 3 with 2 supplements
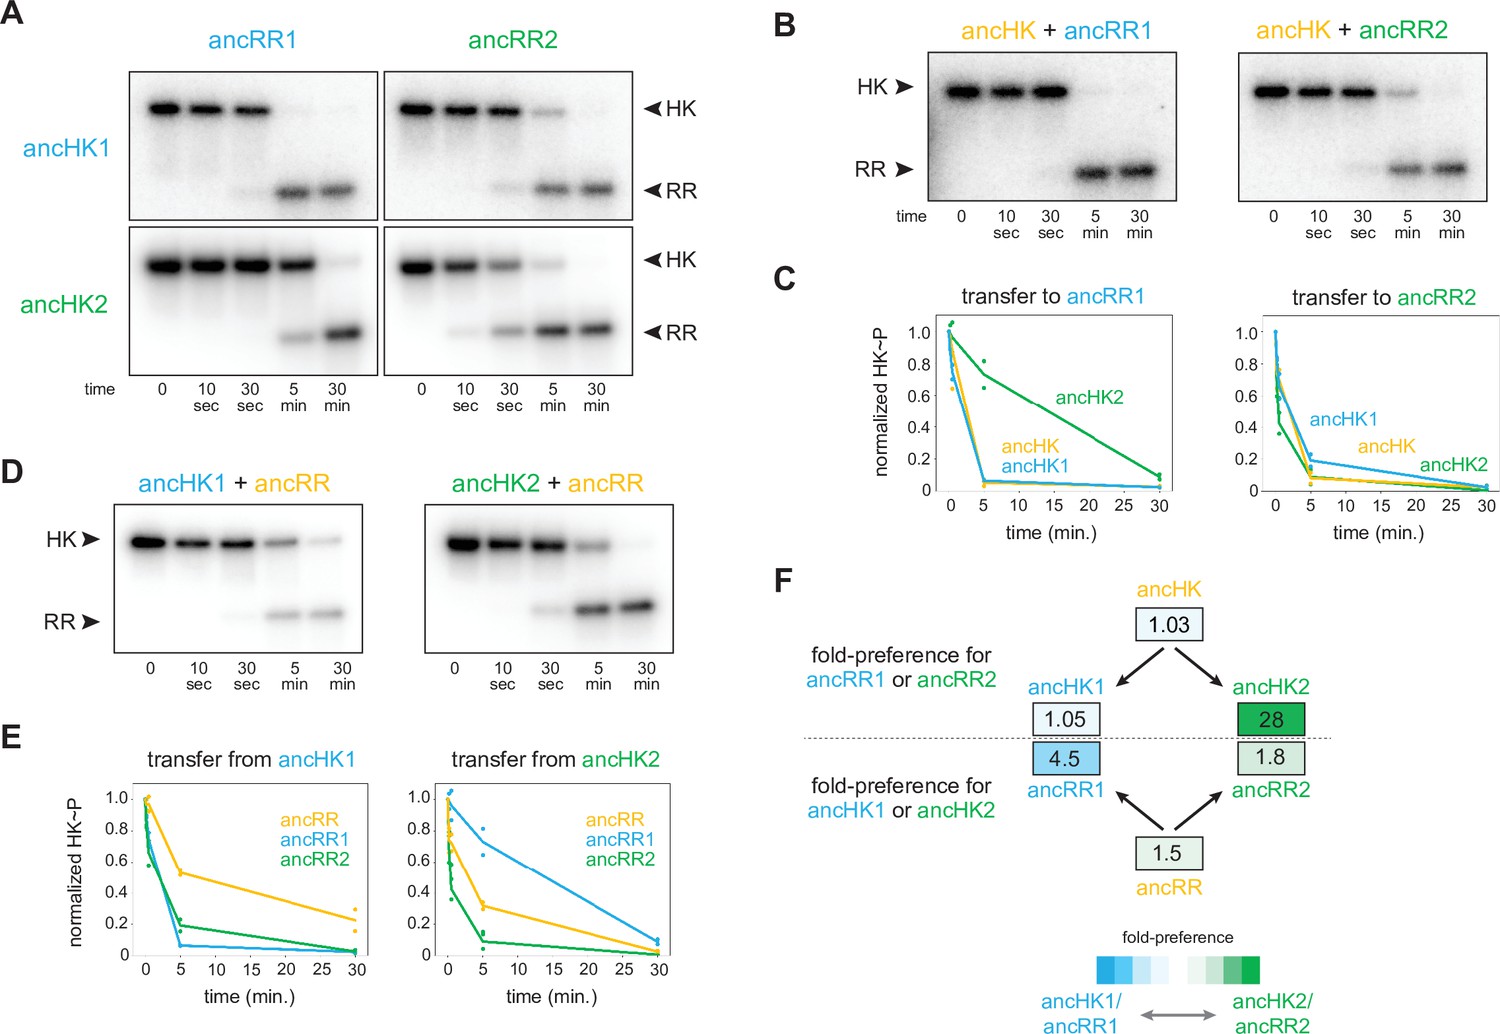
AncHK2 and ancRR1 acquired new specificities post-duplication.
(A) Phosphotransfer from ancHK1 and ancHK2 to ancRR1 and ancRR2. (B) Phosphotransfer from ancHK to ancRR1 and ancRR2. (C) Quantification of the phosphorylated HKs indicated over time for (A) and (B) for transfer to ancRR1 (left) and ancRR2 (right). Lines represent mean (n=2) and dots represent independent replicates. (D) Phosphotransfer from ancHK1 and ancHK2 to ancRR. (E) Quantification of phosphorylated HK over time from (A) and (D) for transfer from ancHK1 (left) and ancHK2 (right) to the RRs indicated. (F) Estimate of substrate specificity for all ancestors. The ratio of specificity constants (kcat/kM) was determined for each HK or RR using the initial rate of phosphotransfer to one protein relative to another. Blue indicates a preference for ancHK1 (for RRs) or ancRR1 (for HKs), green represents a preference for ancHK2 (for RRs) or ancRR2 (for HKs), and white indicates no preference. Numbers indicate fold-preference (ratio of specificity constants).
-
Figure 3—source data 1
Quantified phosphotransfer values for Figure 3C.
- https://cdn.elifesciences.org/articles/77346/elife-77346-fig3-data1-v2.xlsx
-
Figure 3—source data 2
Quantified phosphotransfer values for Figure 3E.
- https://cdn.elifesciences.org/articles/77346/elife-77346-fig3-data2-v2.xlsx
-
Figure 3—source data 3
Quantified phosphotransfer values for Figure 3—figure supplement 2E.
- https://cdn.elifesciences.org/articles/77346/elife-77346-fig3-data3-v2.xlsx
Figure 3—figure supplement 1
All Phosphotransfer Reactions Compared.
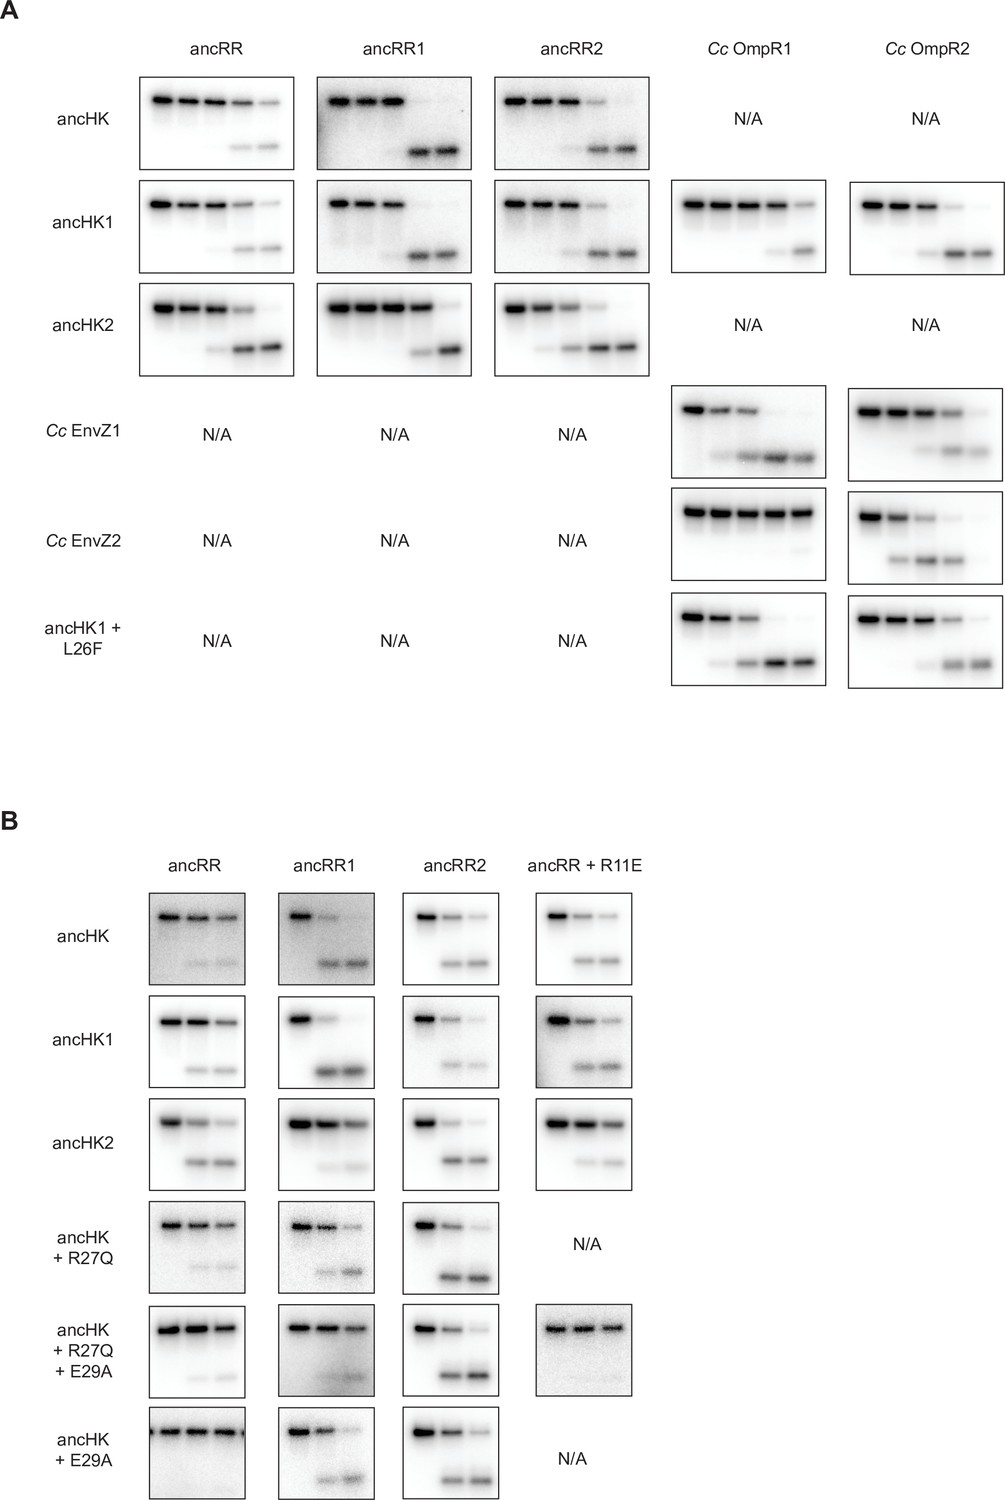
(A) Comparison of all 5-timepoint phosphotransfer reactions from ancHK, ancHK1, ancHK2, Cc EnvZ1, Cc EnvZ2, and ancHK1 +L26F to ancRR, ancRR1, ancRR2, Cc OmpR1, and Cc OmpR2. Timepoints shown are 0, 10 s, 30 s, 5 min, 30 min. (B) Comparison of all 3-timepoint phosphotransfer reactions from ancHK, ancHK1, ancHK2, ancHK + R27Q, ancHK + R27Q + E29A, and ancHK + E29A to ancRR, ancRR1, ancRR2, and ancRR + R11E. Timepoints shown are 0, 2 min, 5 min.
Figure 3—figure supplement 2
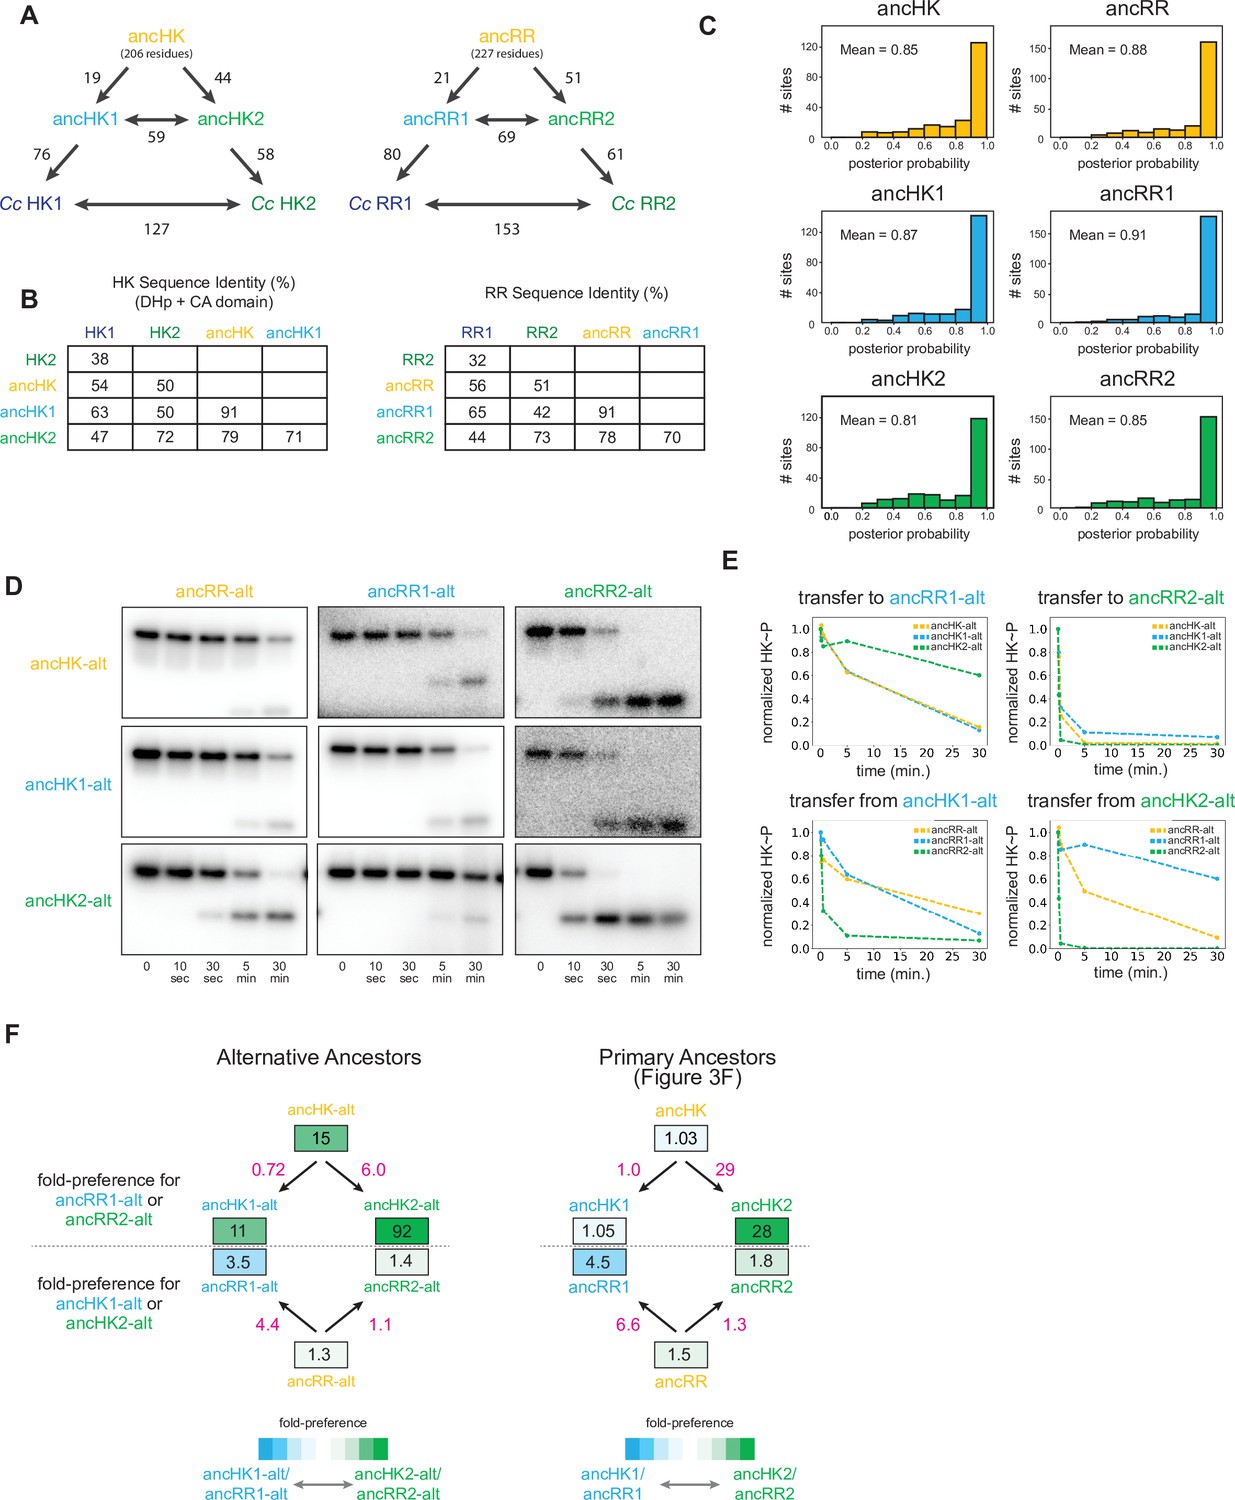
Ancestral protein reconstruction details.
(A) Number of amino acid changes between various ancestors and extant C. crescentus proteins for EnvZ (left) and OmpR (right). Total reconstructed HK length=206 amino acids, RR length=227 amino acids. (B) Sequence identity comparison between various ancestors and extant C. crescentus proteins for EnvZ (left) and OmpR (right). (C) Distribution of posterior probabilities of maximum a posteriori states for all reconstructed ancestral proteins, with mean probability indicated. (D) Phosphotransfer for alternatively reconstructed ancestors, incorporating the second most probable residue at all sites where the probability for this residue was >0.2. Alternative ancestors show similar properties to primary ancestors, with the exception of slower transfer to ancRR and ancRR1, perhaps due to decreased stability of these reconstructed proteins. (E) Quantification of normalized phosphorylated HK from (D). (F) Estimate of substrate specificity for alternative ancestors (left) and primary ancestors (right; copied from Figure 3F for comparison here). Blue indicates a preference for ancHK1-ancRR1, green indicates a preference for ancHK2-ancRR2, and white indicates no preference. Black numbers indicate fold-preference (ratio of specificity constants), while pink numbers indicate ratios of fold-preference. Ratios of fold-preference are consistent between alternative ancestors and primary ancestors, while absolute values differ most notably between HKs, with all three alternative HKs having stronger preferences for ancRR2 due to slower overall transfer observed for ancRR-alt and ancRR1-alt.
Figure 4 with 1 supplement

Identification of mutations responsible for ancestral paralog insulation.
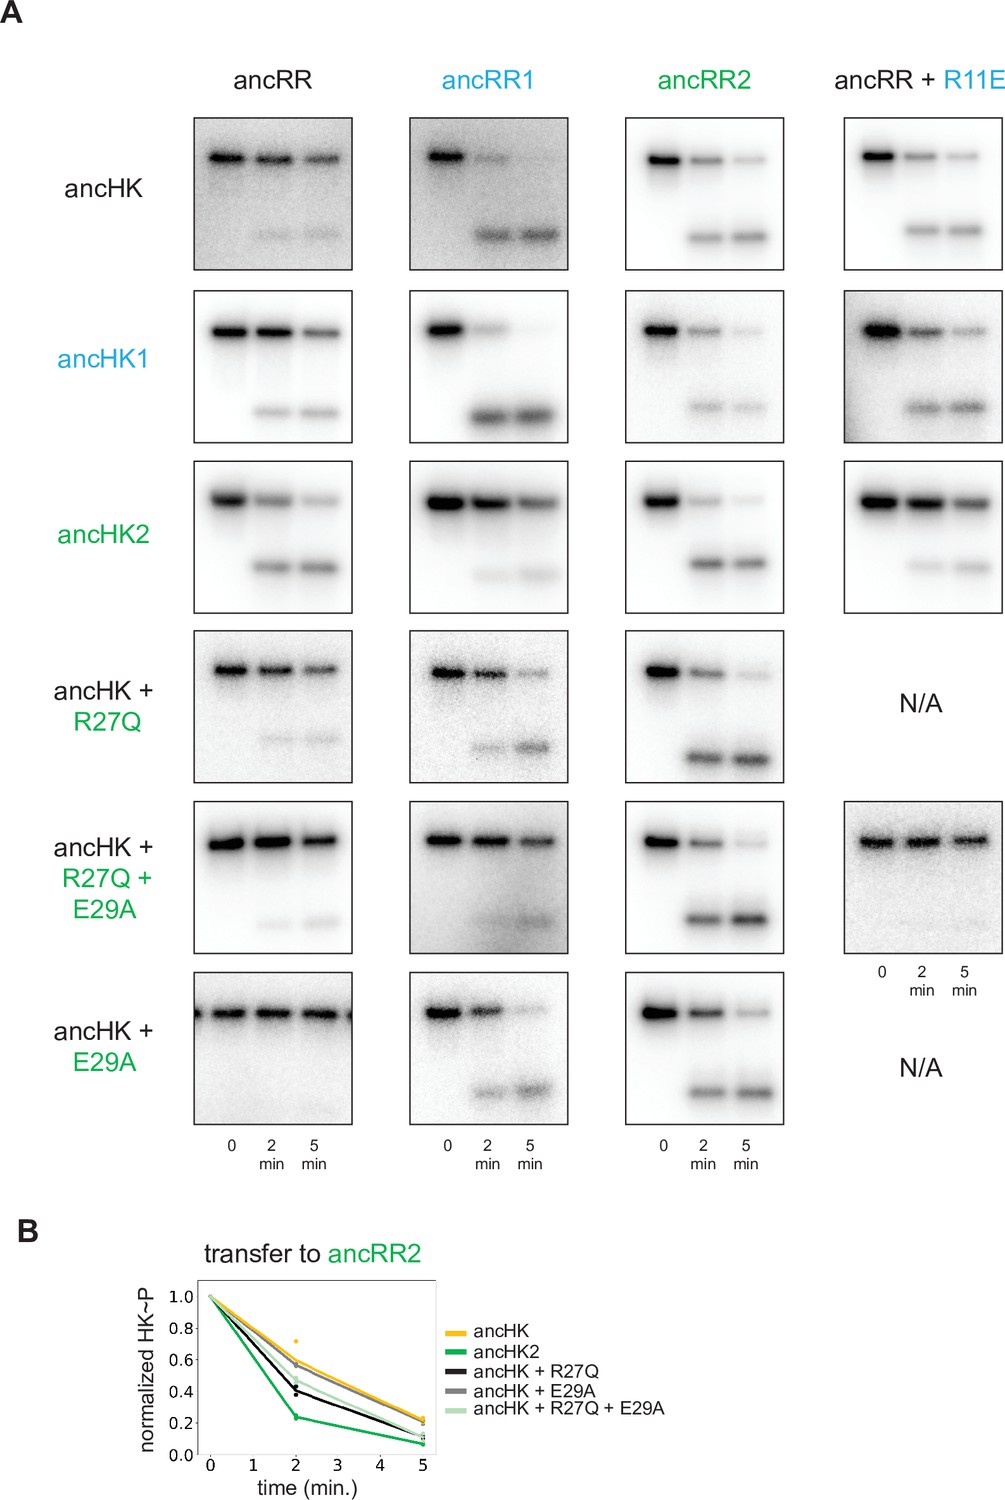
(A) Sequences of ancHK, ancHK1, and ancHK2 for regions primarily involved in molecular recognition. Dots indicate conservation compared to ancHK. Residues previously shown to be strongly coevolving and important for specificity of E. coli EnvZ-OmpR highlighted in yellow, and secondary structure elements predicted by AlphaFold indicated below sequence. (B) Sequence logos for HK positions 27 and 29 in 1,886 identified EnvZ1 paralogs and 822 identified EnvZ2 paralogs, with height indicating frequency of each amino acid. (C) Same as (A) but for ancRR, ancRR1, and ancRR2. (D) Same as (B) but for positions 11 and 12 in OmpR. (E) Phosphotransfer from ancHK, ancHK with the mutations indicated, and ancHK2 to ancRR1 at 0, 2 and 5 minute timepoints. (F). Phosphotransfer from ancHK2 to ancRR, ancRR + R11E, and ancRR1. (G). Phosphotransfer from ancHK + R27Q + E29A to ancRR + R11E. (H–I) Quantification of normalized phosphorylated HK from (E) and (F). Lines represent mean (n=2) and dots represent independent replicates.
-
Figure 4—source data 1
Quantified phosphotransfer values for Figure 4H.
- https://cdn.elifesciences.org/articles/77346/elife-77346-fig4-data1-v2.xlsx
-
Figure 4—source data 2
Quantified phosphotransfer values for Figure 4I.
- https://cdn.elifesciences.org/articles/77346/elife-77346-fig4-data2-v2.xlsx
-
Figure 4—source data 3
Quantified phosphotransfer values for Figure 4—figure supplement 1E.
- https://cdn.elifesciences.org/articles/77346/elife-77346-fig4-data3-v2.xlsx
Figure 4—figure supplement 1
Phosphotransfer analysis of mutations impacting paralog specificity.
(A) Phosphotransfer from the histidine kinases indicated to the response regulators indicated at 0, 2, and 5-min timepoints. (B) Quantification of normalized phosphorylated ancHK, ancHK2, and mutants during transfer to ancRR2.
Figure 5 with 1 supplement
Identification of a mutation that enhances EnvZ-OmpR interactions.
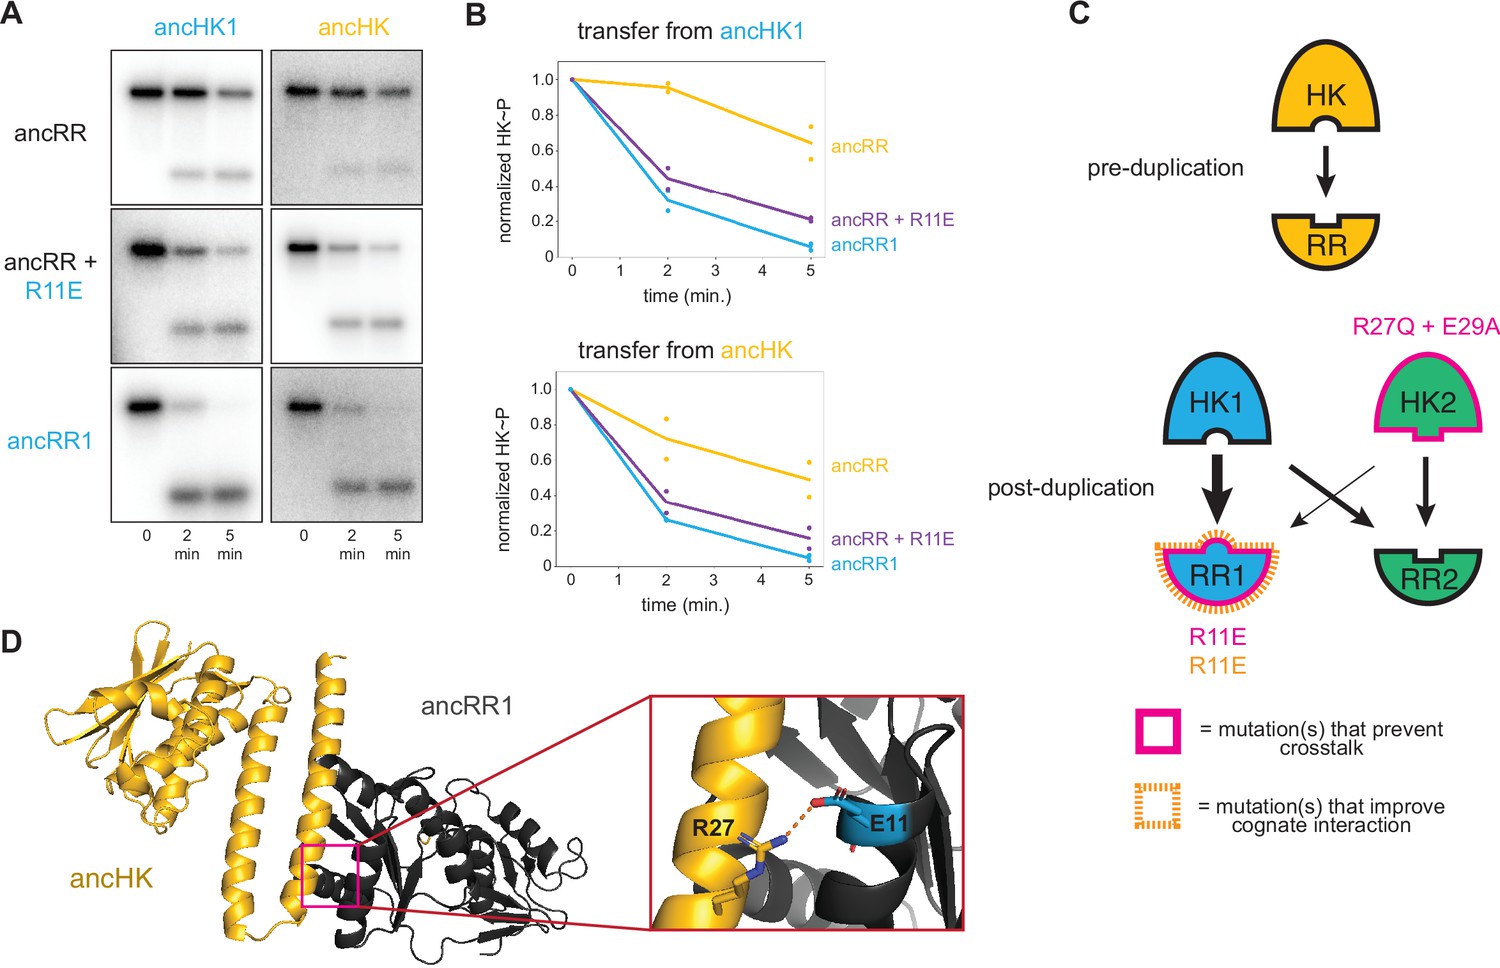
(A) Phosphotransfer from ancHK1 (left) and ancHK (right) to ancRR, ancRR + R11E, and ancRR1 at 0, 2, and 5-min timepoints. (B) Quantification of normalized phosphorylated HK from (A). (C) Model for insulation of EnvZ-OmpR paralogs in α-proteobacteria. Thickness of the black arrows indicates relative strength of a given interaction. Mutations that prevent crosstalk between paralogs indicated in pink; mutations that improve cognate interaction indicated in orange. (D) Predicted ancHK-ancRR1 complex structure from AlphaFold2. Inset: putative salt bridge between arginine 27 in ancHK and glutamate 11 in ancRR1 indicated by dashed line.
-
Figure 5—source data 1
Quantified phosphotransfer values for Figure 5B.
- https://cdn.elifesciences.org/articles/77346/elife-77346-fig5-data1-v2.xlsx
-
Figure 5—source data 2
PDB file for AlphaFold predicted ancHK-ancRR1 complex structure shown in Figure 5D.
- https://cdn.elifesciences.org/articles/77346/elife-77346-fig5-data2-v2.zip
Figure 5—figure supplement 1
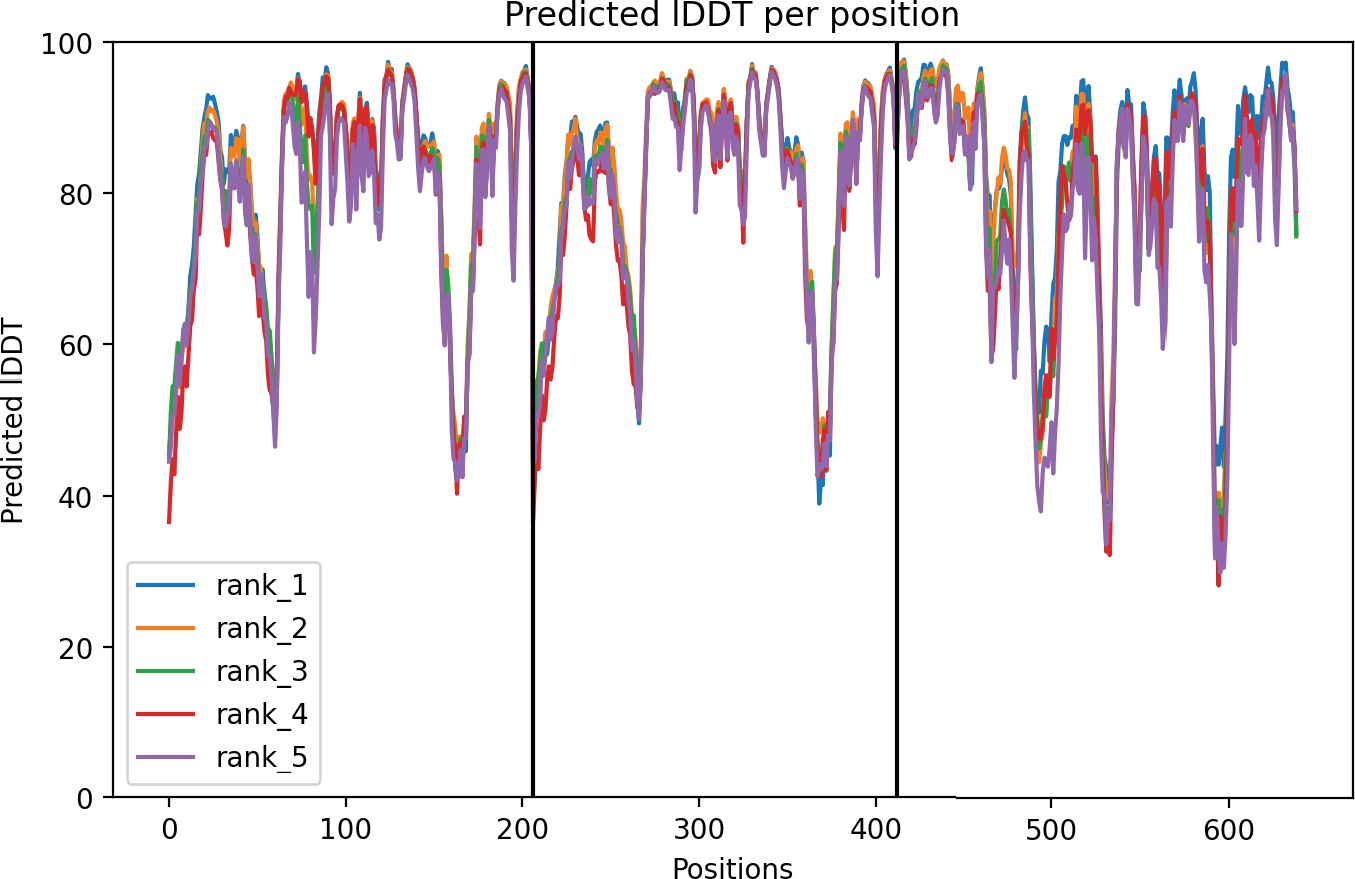
ancHK-ancRR1 AlphaFold structure confidence.
Per-residue local Distance Difference Test (lDDT) for ancHK-ancRR1 complex. Positions 1–211 are ancHK monomer 1, positions 211–422 are ancHK monomer 2, and positions 422–600 are ancRR1. Best 5 models shown; rank 1 model shown in Figure 5.
Figure 6

Tracing the mutations that produced extant, insulated EnvZ-OmpR paralogs.
(A) Sequences of DHp domain for ancHK1 and C. crescentus EnvZ1 shown as in Figure 4A. (B) Sequence logos for HK positions 26 and 30 in 1886 identified EnvZ1 paralogs and 32 EnvZ1 paralogs from Caulobacteraceae species, with height indicating frequency of each amino acid. (C) Phosphotransfer from ancHK1, ancHK1 + L26F, and C. crescentus EnvZ1 to C. crescentus OmpR1 (left) and C. crescentus OmpR2 (right). (D) Quantification of normalized phosphorylated HK from (C). (E) Expanded, simplified phylogeny of α-proteobacterial EnvZ-OmpR paralogs showing origins of key historical mutations leading to C. crescentus and whether they affect crosstalk (pink) and/or cognate interaction (orange).
-
Figure 6—source data 1
Quantified phosphotransfer values for Figure 6D.
- https://cdn.elifesciences.org/articles/77346/elife-77346-fig6-data1-v2.xlsx
Additional files
-
Supplementary file 1
Excel spreadsheet containing relevant strains, primers, and protein sequences.
- https://cdn.elifesciences.org/articles/77346/elife-77346-supp1-v2.xlsx
-
Supplementary file 2
Newick file of proteobacteria species tree (shown in Figure 1C).
Species numbers from ProGenomes database (http://progenomes.embl.de/index.cgi).
- https://cdn.elifesciences.org/articles/77346/elife-77346-supp2-v2.txt
-
Supplementary file 3
Newick file of EnvZ/OmpR merged phylogeny used for ancestral reconstructions (shown in Figure 2—figure supplement 1).
Protein numbers from ProGenomes database.
- https://cdn.elifesciences.org/articles/77346/elife-77346-supp3-v2.txt
-
Transparent reporting form
- https://cdn.elifesciences.org/articles/77346/elife-77346-transrepform1-v2.docx
Download links
A two-part list of links to download the article, or parts of the article, in various formats.
Downloads (link to download the article as PDF)
Open citations (links to open the citations from this article in various online reference manager services)
Cite this article (links to download the citations from this article in formats compatible with various reference manager tools)
Ancestral reconstruction of duplicated signaling proteins reveals the evolution of signaling specificity
eLife 11:e77346.
https://doi.org/10.7554/eLife.77346


