Visceral organ morphogenesis via calcium-patterned muscle constrictions
- Kavli Institute for Theoretical Physics, University of California, Santa Barbara, United States
- Department of Physics, University of California, Santa Barbara, United States
- Department of Physics, Harvard University, United States
- Biomolecular Science and Engineering, University of California, Santa Barbara, United States
Figures
Figure 1 with 3 supplements

Deep tissue live imaging reveals bilayer gut morphogenesis.
(A–B) Muscle and endoderm layers compose the midgut and interact to generate 3D shape. (C) Genetic patterning of hox transcription factors that govern midgut morphogenesis appears in the circumferential muscles. (D) Automatic segmentation using morphological snakes level sets enables layer-specific imaging, here shown for muscle (yellow) and endoderm (blue) for a w,Hand>GAL4;UAS-Hand:GFP;hist:GFP embryo. Morphogenesis proceeds first with a constriction cleaving the gut into two chambers (stage 15). Two more constrictions form a total of four chambers (16a) before the gut begins to coil (16b onward). Stages follow (Campos-Ortega and Hartenstein, 1997). (E) Surface area of the apical surface increases gradually during constrictions, but levels off by stage 16b. The enclosed volume decreases gradually, while the effective length of the organ – computed via the length of a centerline – nearly triples. Solid curves denote the means and shaded bands denote standard deviations (). Developmental timelines are aligned by the onset of the middle constriction (dashed black line). (F–G) Segmentation of the endoderm layer from MuVi SPIM imaging resolves individual cells, both in the endoderm and muscle layers, shown here at stage 15.
Figure 1—figure supplement 1
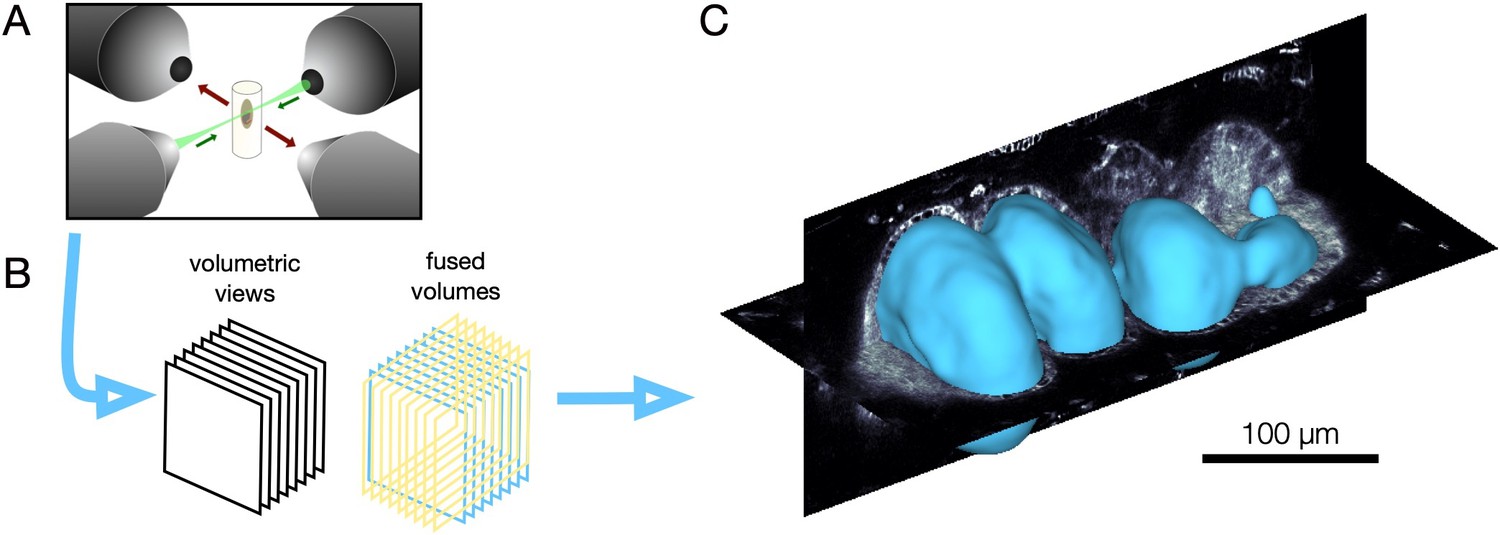
Multi-view light sheet microscopy enables volumetric imaging.
(A) We illuminate embryos embedded in an agarose column via a laser beam emerging from two illumination objectives (green). The laser sweeps along the long axis of the column to raster a sheet of light. Two detection objectives capture fluorescence in the orthogonal axis (red arrows). (B) By translating, rotating, and repeating, we build volumetric views from a series of angles. (C) Through fusion and deconvolution, multiple volumetric views build data volumes with nearly isotropic resolution for analysis.
Figure 1—figure supplement 2
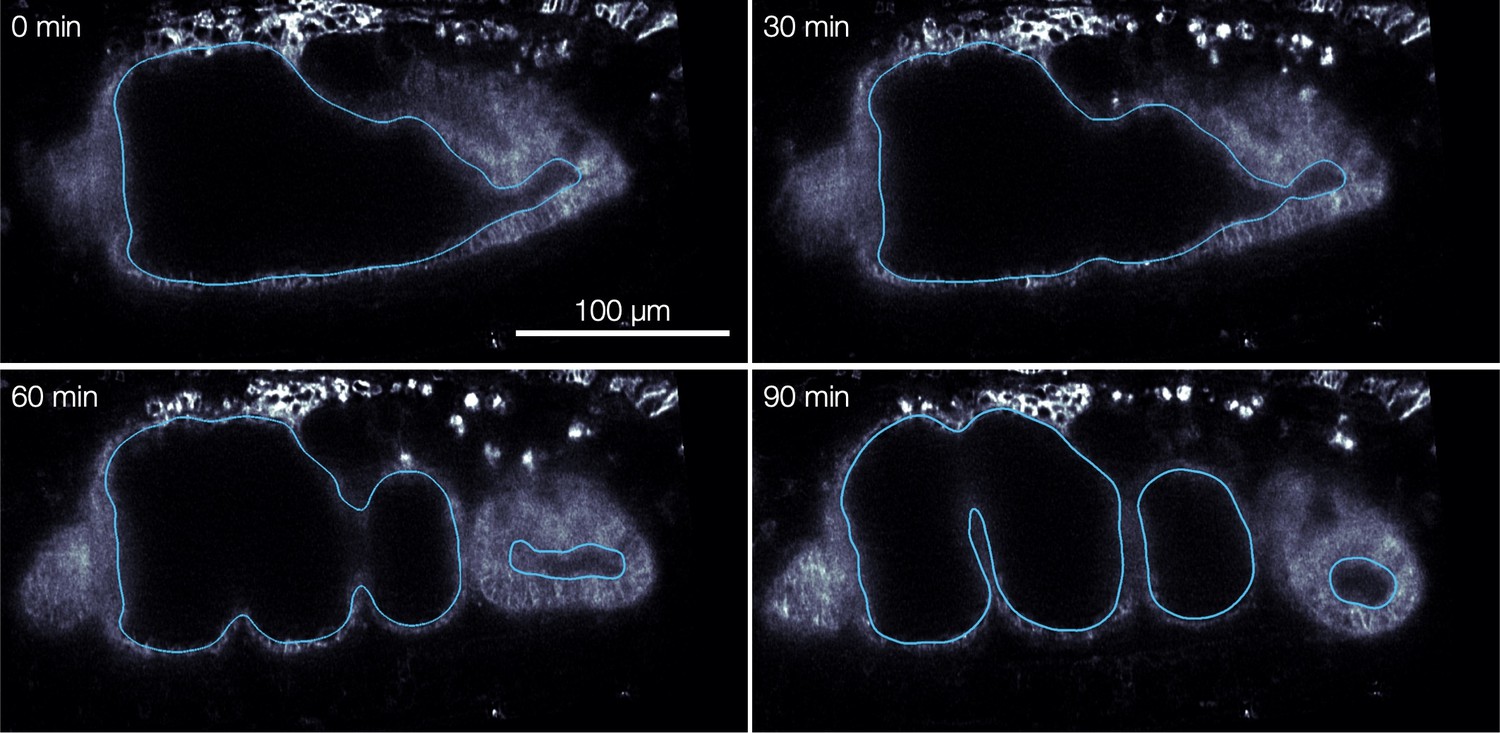
Organ segmentation via morphological snakes level sets enables layer-specific imaging and analysis.
Automatic segmentation of the apical (inner) surface of the endoderm minimizes a non-local Chan-Vese energy functional (Chan and Vese, 2001; Márquez-Neila et al., 2014) to encapsulate yolk without enclosing midgut tissue, shown for four snapshots of mid-sagittal sections using TubULAR (Mitchell and Cislo, 2022). Blue contours mark the surface intersection with the mid-sagittal plane.
Figure 1—figure supplement 3
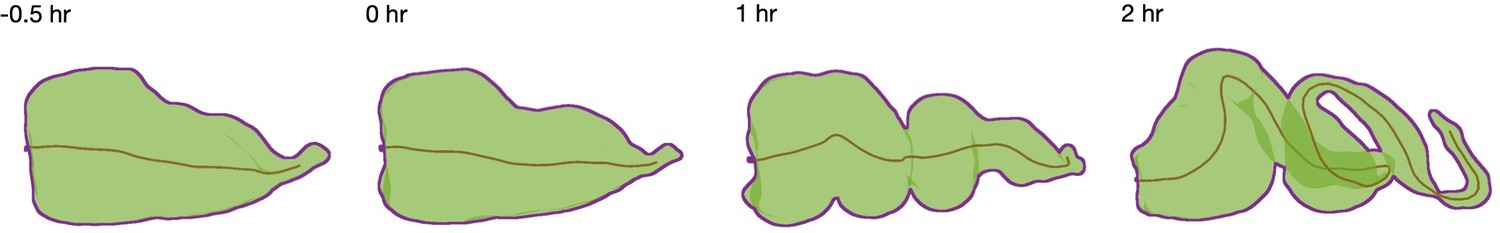
A centerline measures an effective length of the organ.
We compute the centerline (brown curve) for extracted shapes (green with purple boundary for clarity) using the TubULAR package (Mitchell and Cislo, 2022). The cumulative length of these curves defines the effective length of the organ reported in Figure 1.
Figure 2 with 3 supplements

Endodermal cell shape changes underlie organ shape change.
(A) Cell segmentation in a computationally flattened coordinate patch shows endodermal cells are initially elongated along the circumferential direction but change their shape during organ folding. (B–C) Cell aspect ratios evolve from to , shown in 3D for cells near the anterior fold. (C) The mean endodermal cell aspect ratio averaged over the organ decreases during constrictions. Colored bands denote area-weighted standard deviations for 600–1300 segmented cells per timepoint, and tick marks denote standard error on the mean. (D) As cells change their aspect ratio, their orientations do not rotate. (E) Single-cell tracking shows gentle increase of cell areas through violent folding events, suggesting that cell area changes do not drive organ shape change. The blue curve and shaded region denote mean and standard deviation, with raw traces in gray.
Figure 2—figure supplement 1
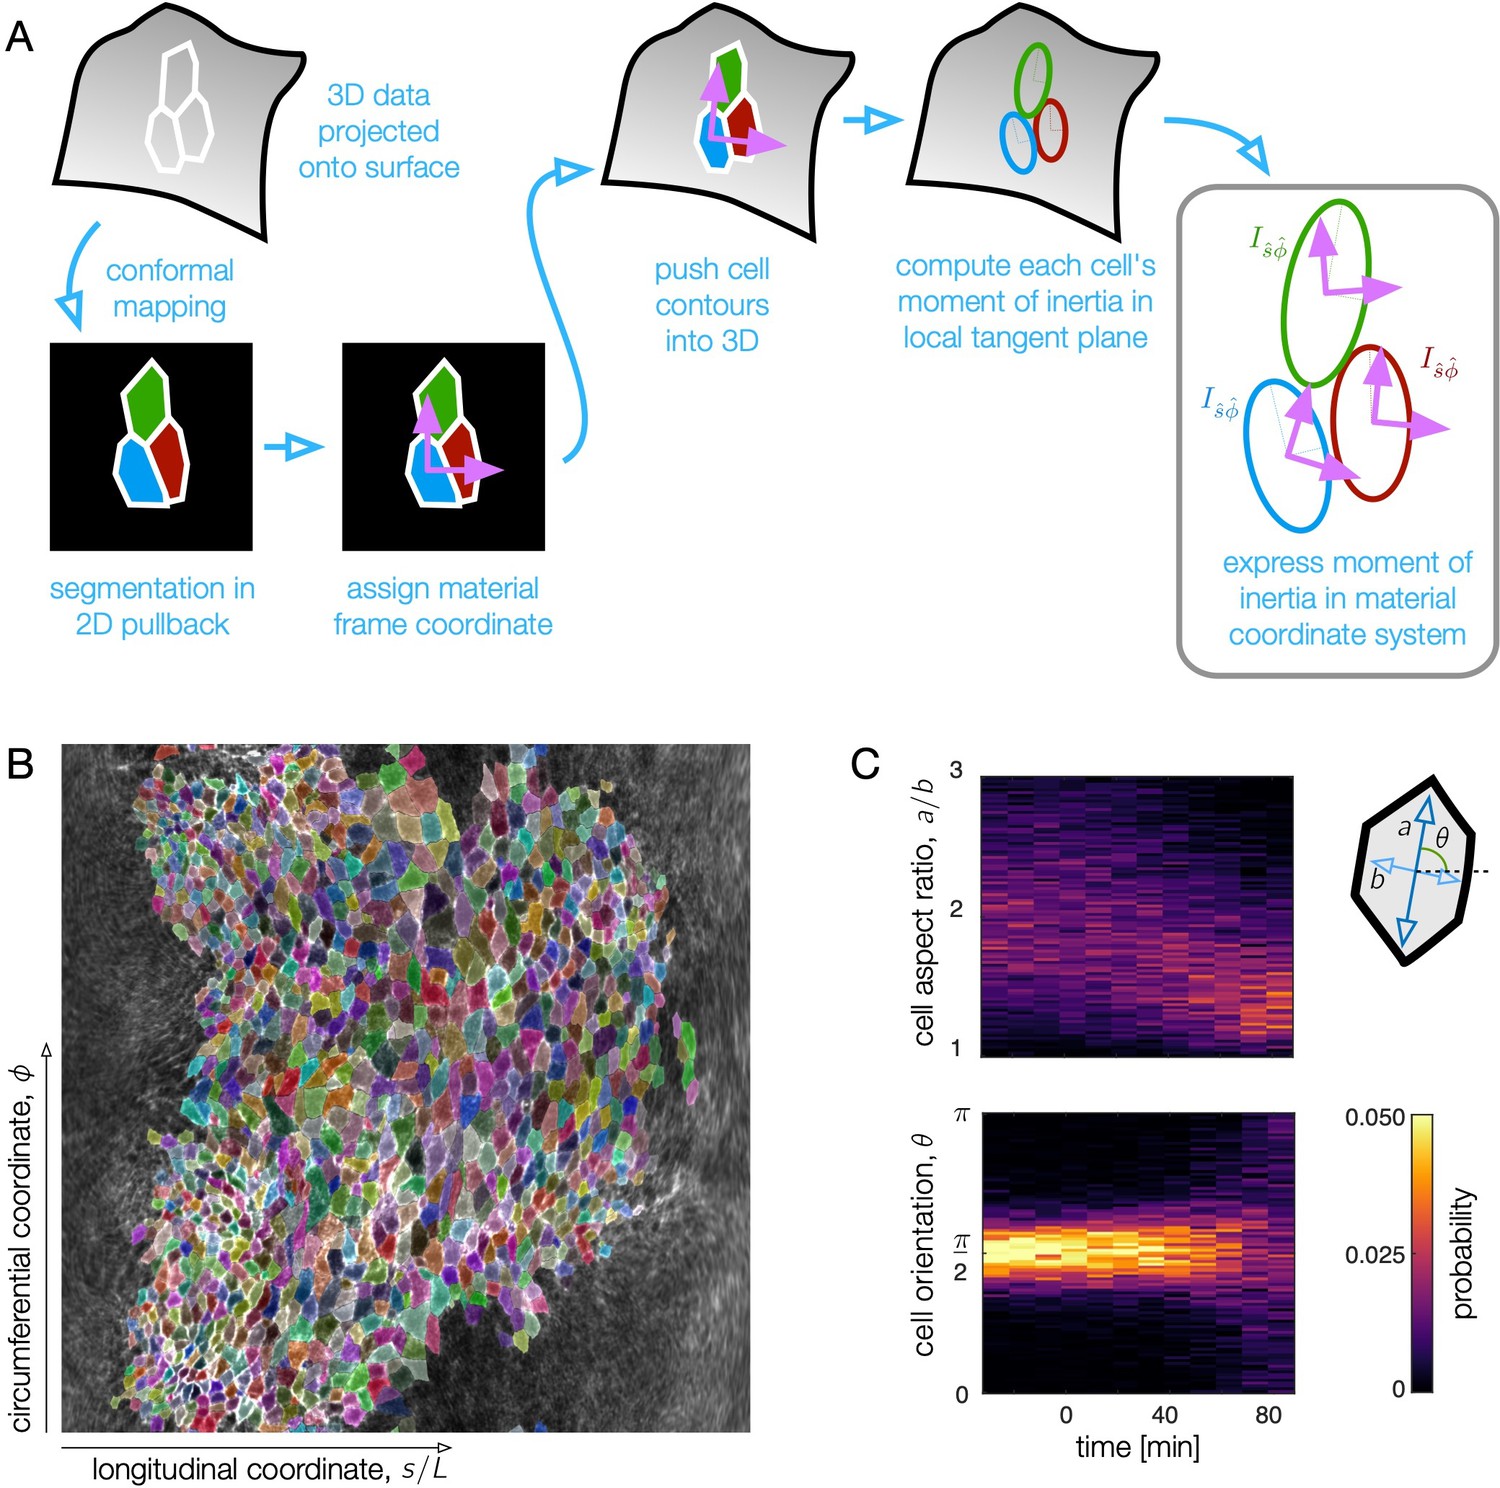
Surface projection aids in quantifying cell shape change in the 3D tissue surface.
(A) To measure cell shapes, we trace cell membrane contours in a conformal mapping to a 2D pullback plane and re-embed cells into local tangent planes in 3D for shape quantification. After surface extraction, we project the data on a midgut surface ∼2.5 μm beyond the apical side of the endoderm to the plane for segmentation. The pullback plane also defines material coordinate directions in which we can measure orientation of cells, θ. By projecting cell contours back into 3D, we compute moment of inertia tensors for each cell in a local tangent plane. The eigenvalues and eigenvectors of the moment of inertia tensors define the cell anisotropy and the orientation of their long axis θ with respect to material coordinate directions and . (B) Example segmentation in the pullback plane at a time near the onset of the first constriction. Each cell polygon is given a random, distinguishable color to demonstrate the segmentation quality. The longitudinal coordinate, , in the pullback plane is proportional to the proper distance from the anterior face of the midgut to a given location along the tissue (see Materials and methods). (C) Here shown in raw histograms, cell aspect ratios decrease and condense close to 1 (isotropic shapes) by ∼80 min after the onset of the first (middle) constriction. During this time, the cells do not rotate, as evidenced by the sustained peak in cell orientation near zero. At late times, when the cells are nearly isotropic, the orientation becomes less clearly defined and the distribution broadens.
Figure 2—figure supplement 2
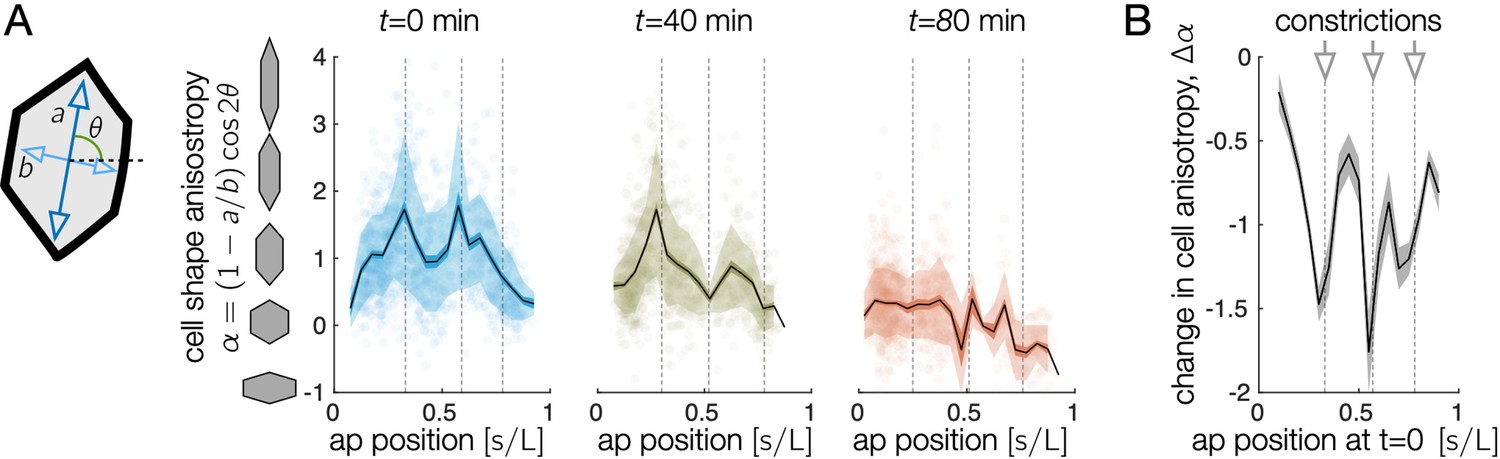
Endodermal cells are initially most elongated near anterior and middle constrictions, and cell shape change is greatest near constrictions.
(A) The oriented cell anisotropy varies along the anterior-posterior axis. We define the cell shape anisotropy to be a signed quantity varying from positive for cells elongated along the circumferential axis and negative for cells elongated along the longitudinal axis. This signed measure of oriented anisotropy shows that some cells become elongated along the longitudinal (AP) axis, particularly near the posterior end of the midgut by min. In particular, the signed shape anisotropy of a cell is , where and are the semimajor and semiminor axes of the ellipse capturing each cell’s moment of inertia tensor and θ is the cell’s angle with respect to the material frame’s longitudinal axis. Locations of the constrictions or constriction precursors are marked in dashed gray vertical lines. Cells near the anterior and middle constrictions are initially elongated along the circumferential axis more than cells in the interstitial regions. Cell anisotropy changes dramatically first at the middle constriction, then at the anterior and posterior constrictions. Shaded error bars denote standard deviations (semi-transparent bands) and standard error on the mean (opaque colored bands), while black curves denote the mean. Semi-transparent dots mark the anisotropy values of individual cells. Here, cell positions are parameterized by their longitudinal coordinate, , which measures the proper distance along the tissue from the midgut’s anterior face, normalized by the total proper length. (B) The total change in signed cell shape anisotropy over the 80-min timecourse shows strong, negative values near each constriction. We here parameterize cells’ anterior-posterior positions at min by mapping to their locations back to using measured meso-scale tissue velocities in order to compare measurements made in the same tissue patches.
Figure 2—figure supplement 3

Topological rearrangements occur in the endoderm but are not aligned during the earliest stages of gut constrictions, consistent with cell shape change being the dominant contributor to tissue deformation at the onset of constrictions.
(A) An example rosette of four tracked cells shows multiple topological rearrangements with different orientations. For visualization, the tissue patch is flattened to a plane such that the longitudinal and circumferential axes of the organ in the material frame align with the horizontal and vertical axis, respectively. The mapping to the plane is an as-rigid-as-possible map constrained so that the ratio of lengths in the longitudinal and circumferential directions is preserved near the center of the image (so the diagonal metric tensor components are equal ). (B) Here we define T1 events to be AP oriented if the cells that lose contact are within 45° of the longitudinal axis of the organ in the material frame. These events contribute to the net convergent extension of the organ. Conversely, in DV oriented T1 events, the cells that lose contact are within 45° of the circumferential axis of the organ in the material frame, and these events counteract the net convergent extension of the organ. (C) In a collection of 175 tracked cells in the anterior midgut, we find no significant difference between the rate of cell intercalations oriented along the longitudinal direction versus the circumferential direction during stage 15 and the beginning of stage 16 (-27<43 min), while we find a bias in T1 orientations later during stage 16 (43<83 min) among the tracked cells. Uncertainties are taken as the square root of the count, and .
Figure 3 with 5 supplements
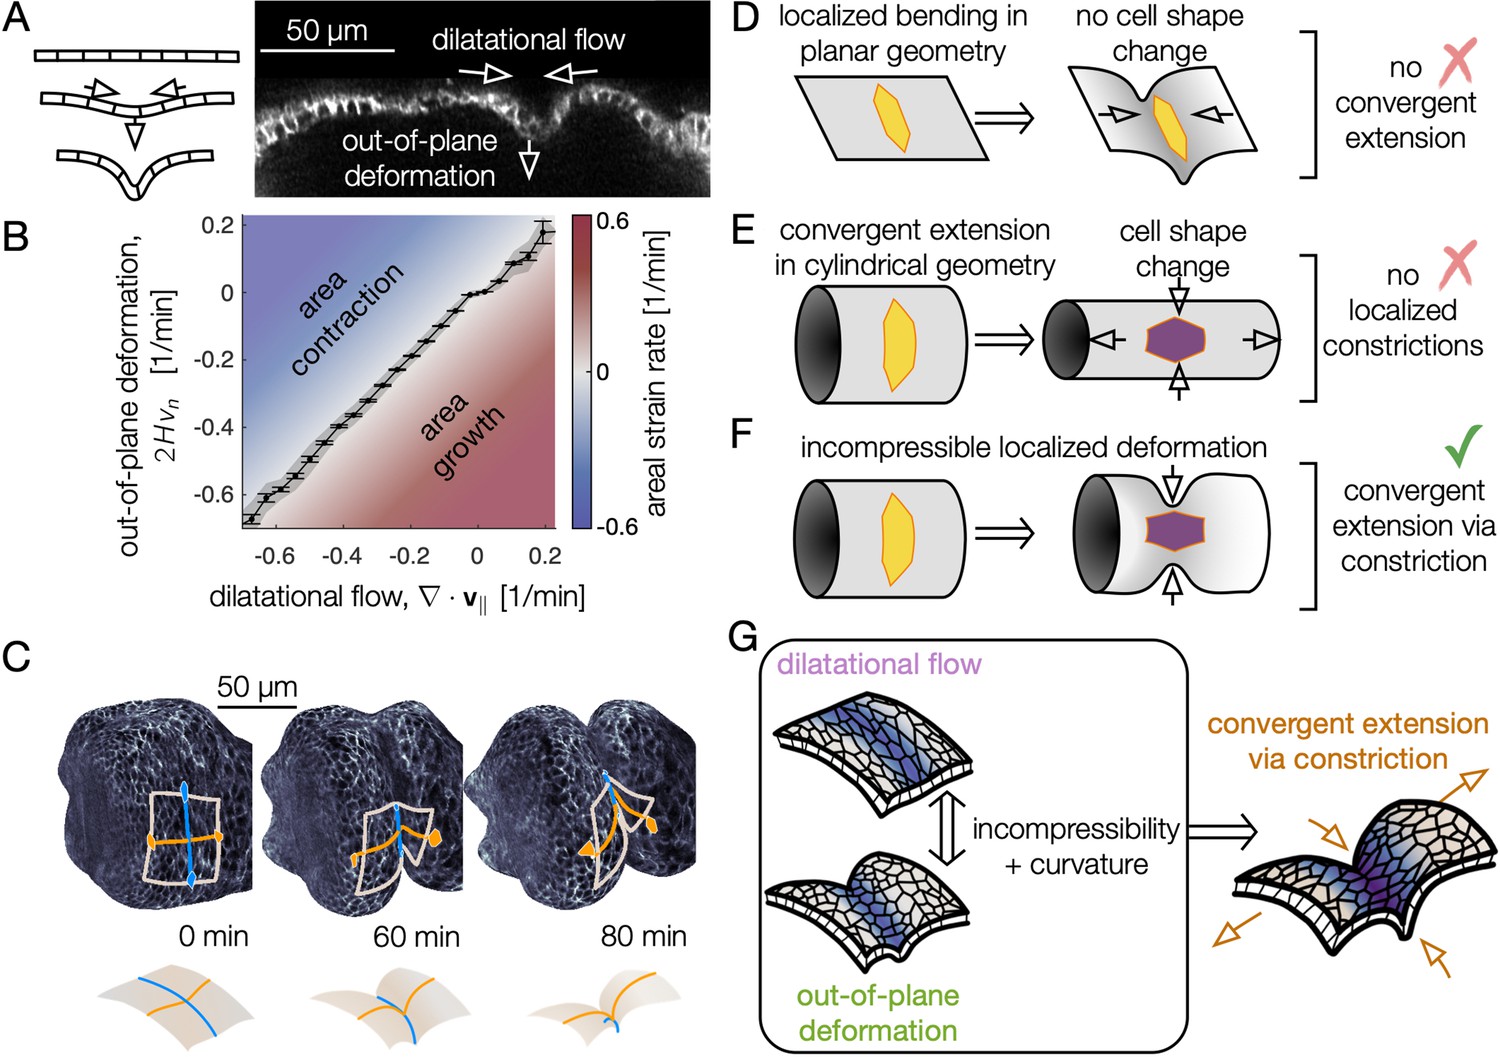
Incompressible tissue dynamics reveal convergent extension via constrictions.
(A) Localized constrictions couple dilatational in-plane velocity patterns to out-of-plane deformation near folds. (B) In-plane divergence and out-of-plane deformation are correlated at the 97% level, signaling nearly incompressible behavior ( embryos, with kinematics sampled in 320 non-overlapping tissue patches per minute for 0<90 min). Gray band denotes standard deviation and ticks denote standard error on the mean for each bin. Here, denotes mean curvature, vn is the normal (out-of-plane) velocity, and is the covariant divergence of the in-plane velocity. (C) The tissue converges along the circumferential direction as cells sink into the constriction (blue) and extends along the bending longitudinal profile (orange) to preserve the area of a tissue patch. (D) In contrast to the curved gut, localized bending of a flat, incompressible sheet requires no cell shape change, and thus no tissue-scale convergent extension. (E) Cell shape deformations converging along the circumferential axis and extending along the the AP axis would generate tissue convergent extension corresponding to uniform constriction of a tube, but no localized constrictions would form. (F) Localized constriction of an incompressible sheet exhibits cell shape change without cell area change in the absence of oriented divisions or oriented cell intercalations. The cell shape extends along the bending longitudinal (AP) axis. (G) Convergent extension via constriction follows as a geometric consequence of localized constrictions of the tubular organ without local area change.
Figure 3—figure supplement 1

Dilatational flow patterns are tightly coupled to out-of-plane deformation throughout midgut constrictions, indicating a nearly incompressible tissue behavior.
Resulting divergence of in-plane tissue motion () and out-of-plane deformation measurements () on an representative embryo, plotted both on the midgut surface in 3D and in pullback coordinates, show strong correlation. The difference of the two patterns gives the local area change (right columns). Each image is the average of patterns over a 30-min timespan, while Video 5 shows the instantaneous measurements. The pullback representation uses the surface Lagrangian parameterization (, ), such that the ventral tissue is in the midline of the image, anterior is to the left, posterior is to the right, and deformation of the organ shape in 3D is subtracted out from the pullback coordinates of subsequent timepoints (Mitchell and Cislo, 2022). The position in the pullback representation is proportional to the proper distance along the organ’s longitudinal axis (see Materials and methods).
Figure 3—figure supplement 2

Convergent extension via constriction links in-plane tissue shape change with out-of-plane deformation.
(A) An initially flat, incompressible sheet may bend in a localized region without deforming the tissue in-plane. Distances between cells in plane are preserved, illustrated by the constant length between the ends of the sheet along the orange geodesic. (B) A uniformly constricting, incompressible tube exhibits convergent extension but has no localized folds. In the absence of cell intercalations, cells converge along the circumferential direction and elongate along the longitudinal direction, so an orange curve spanning several cells along the longitudinal axis lengthens over time. (C) In convergent extension via constriction, localized normal motion of the tube couples to in-plane tissue shape change. In a constricting, incompressible tube, the tissue converges along the circumference and extends along the bending longitudinal profile.
Figure 3—figure supplement 3
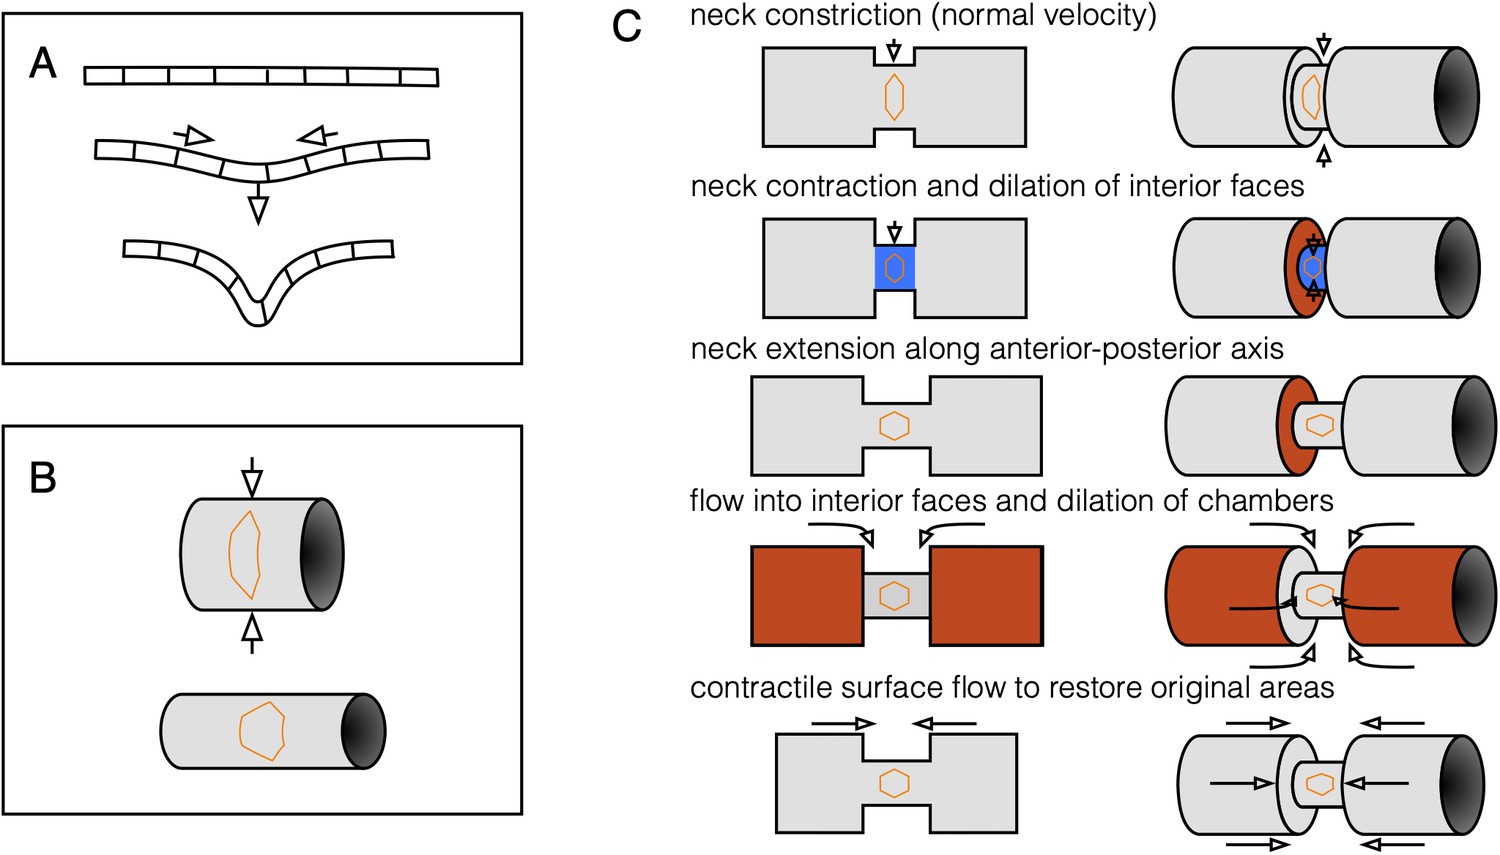
Three-component decomposition of kinematics elucidates coupling between compressibility and convergent extension.
(A) An initially flat incompressible sheet demonstrates kinematic coupling between in-plane dilatational flow and out-of-plane bending to preserve cells’ 2D areas. (B) Constriction couples to convergent extension via curvature of the surface. As a tube constricts, the tube elongates in order to preserve surface area. Correspondingly, cells change their aspect ratio and undergo convergent extension. (C) The two effects shown in (A) and (B) couple in a pinching tube with a localized constriction. A tube with a step-like constriction is composed of deformable cells whose areas shall not change. Constriction of the narrow tube via inward normal velocities would decrease the neck area (blue), so the neck extends to keep its area fixed. This is convergent extension. The faces are now dilated, triggering flow into the interior faces to correct for the change in tissue density. In this way, convergent extension is linked to incompressibility, which couples in-plane dilatational flow to out-of-plane deformation.
Figure 3—figure supplement 4
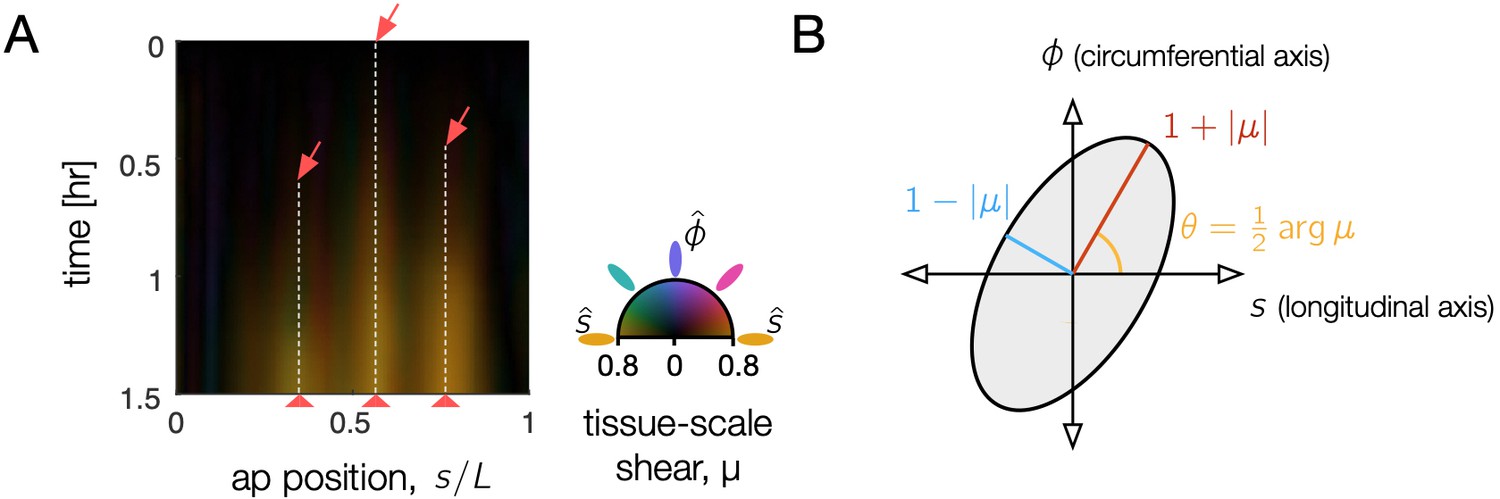
Tissue shear generates 3D convergent extension during constrictions, as captured in the Beltrami coefficient – a local measure of anisotropic, area-preserving deformation.
(A) Tissue-scale shear accumulates near each constriction, shown as a kymograph in the material coordinate frame averaged along the circumferential axis. As time increases (downward), orange streaks reflect area-preserving convergence of tissue patches along the organ circumference and extension along the folding AP axis near constrictions (red arrows). Here, the organ is parameterized by the position, , at the onset of constriction (), measured in proper length along the surface normalized by its total length, and deformation is averaged along the circumferential position in the kymograph. Color denotes the orientation of the anisotropic shear deformation in this material frame, such that deformation which converges along the circumferential axis and extends along the AP axis is denoted by orange color (colorwheel). Larger magnitudes of tissue shear are brighter, reflecting the Beltrami coefficient averaged over the circumferential axis. (B) The Beltrami coefficient μ is defined as the amount of area-preserving shear transforming a circle into an ellipse with aspect ratio at an angle .
Figure 3—figure supplement 5
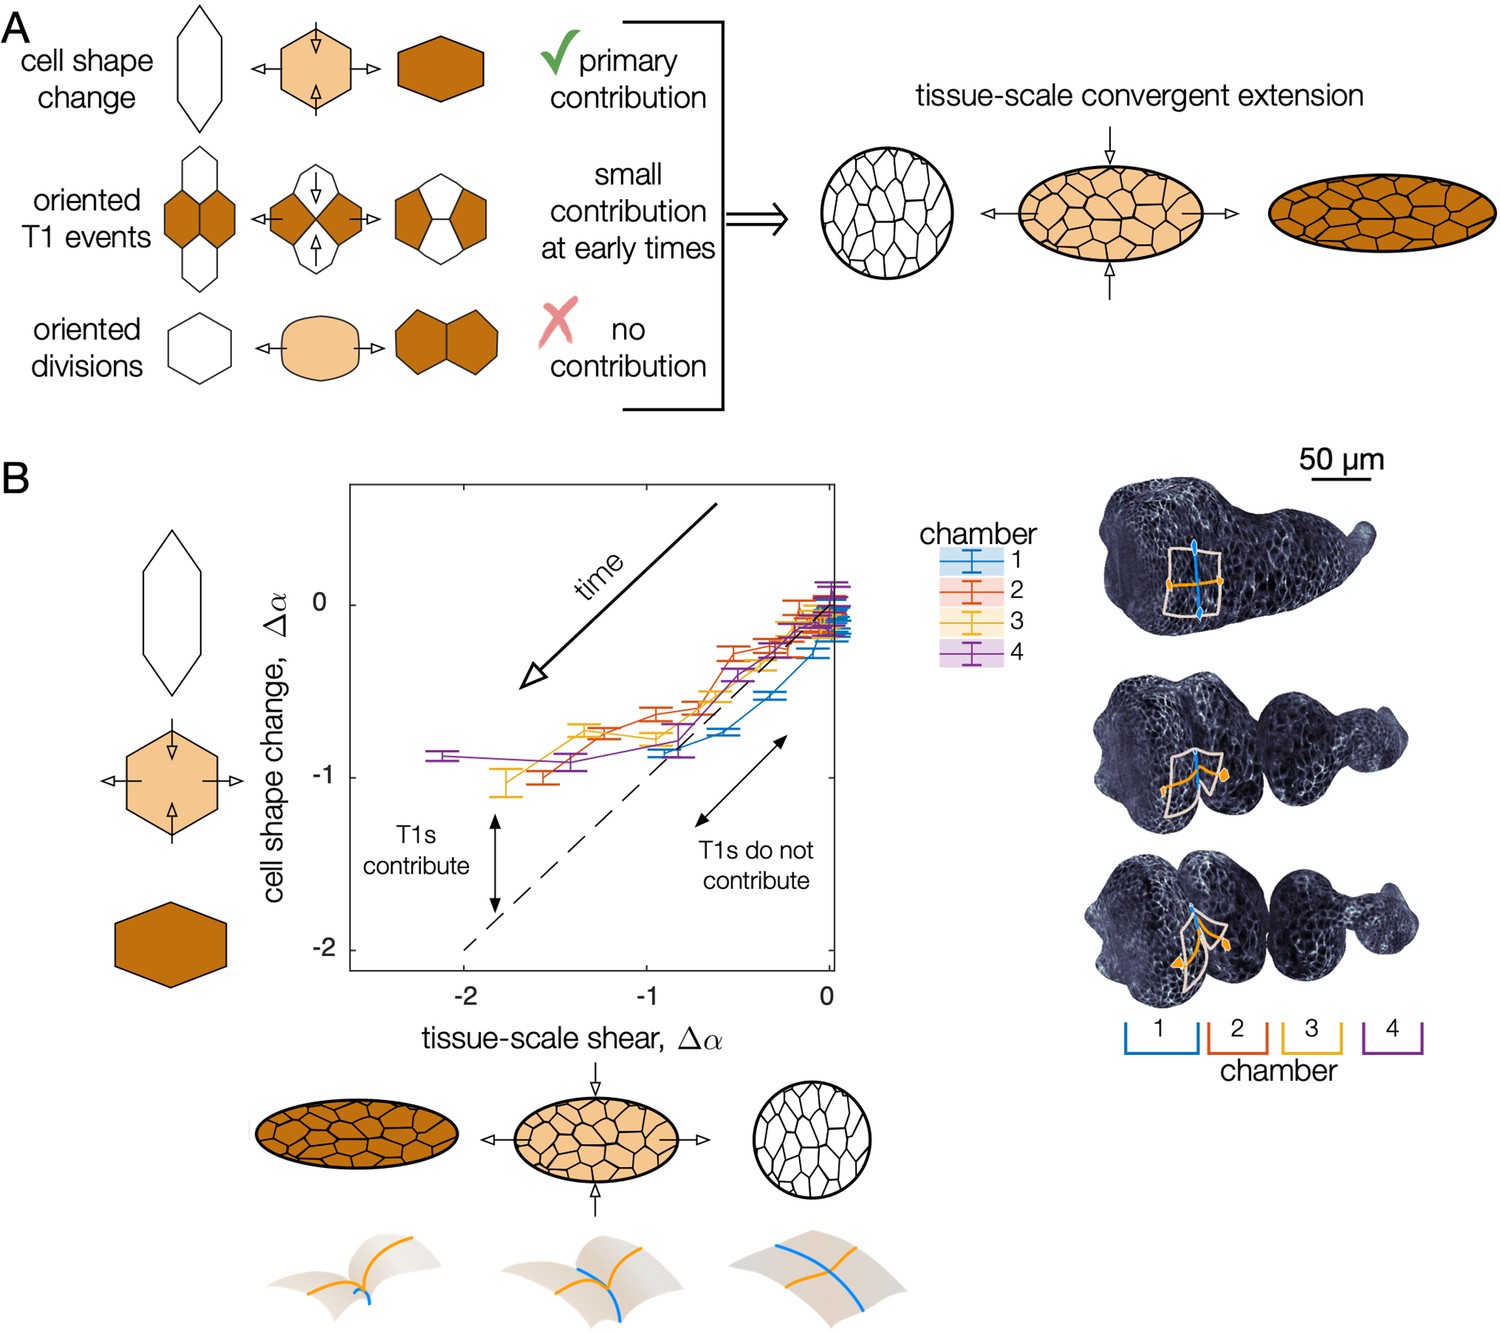
Cell shape change quantitatively accounts for tissue-scale convergent extension during early stages of midgut constrictions.
(A) As constrictions form, cells change shape from elongated circumferentially to elongated along the longitudinal axis of the organ. At the same time, the tissue deformation mirrors the cell shape change, converging along the circumference and elongating along the longitudinal axis of the organ. Cell intercalations (T1 events) could also contribute to convergent extension if oriented. We find these make a small contribution at early stages of constriction and a large contribution at later stages. No signs of divisions are present, so we rule out oriented cell divisions as contributors to convergent extension. (B) Tissue-scale deformation quantitatively tracks cell shape change at early times, while intercalations contribute to convergent extension at later stages. Change in cell shape anisotropy (assessed over all cells in each chamber) is plotted against the magnitude of tissue convergent extension (averaged over the same tissue positions in each chamber). On the vertical axis, we report cell shape change as the average cell shape anisotropy for all segmented cells in each chamber , minus the mean value for each chamber at the onset of the middle constriction , such that . Given that cells’ orientations are steady during constrictions, we use a scalar measure of oriented cell shape anisotropy, , where and are the semimajor and semiminor axes of the ellipse capturing each cell’s in-plane moment of inertia tensor and θ is the cell’s angle with respect to the material frame’s longitudinal axis. To compute a tissue-scale shape change for comparison, we advect the cell contours of the initial segmentation along the meso-scale tissue flow and compute the cell shape anisotropy of the advected segmentation (Mitchell and Cislo, 2022). Chambers are numbered from anterior (1) to posterior (4), separated by constriction locations. Tick marks denote standard errors on the mean for cell anisotropies within each chamber.
Figure 4 with 3 supplements
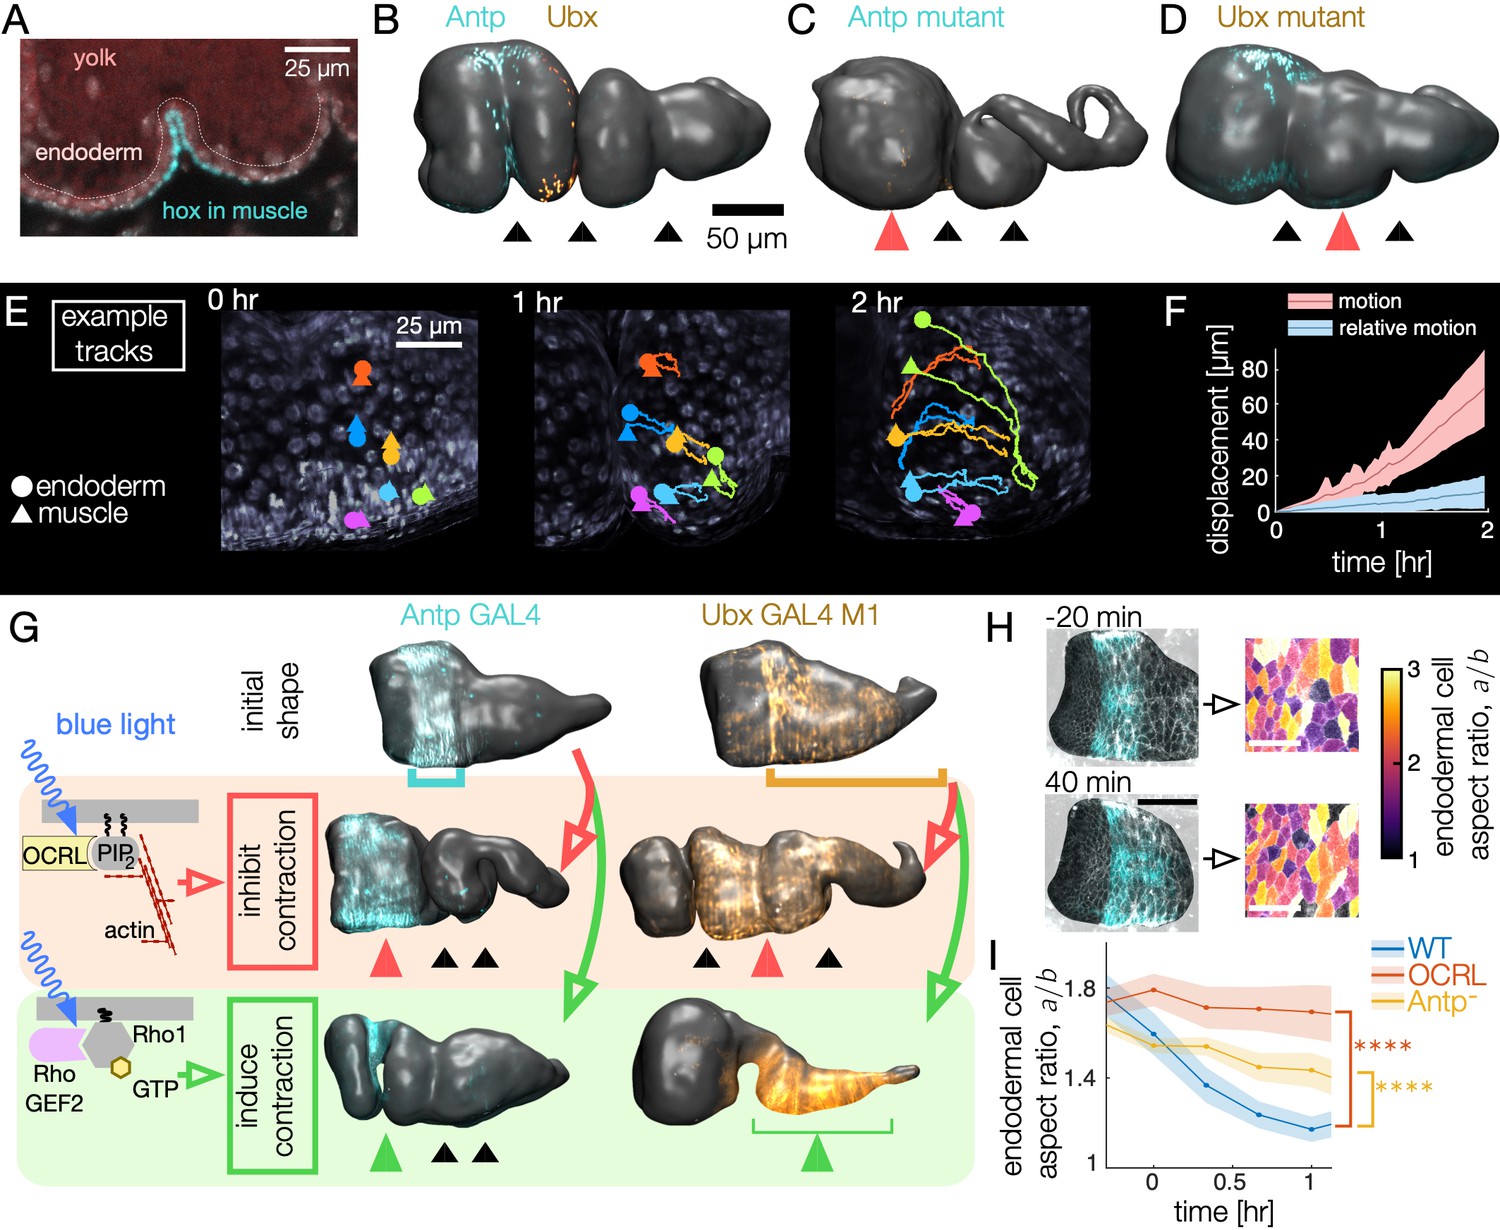
Muscle contractions mechanically couple to the endoderm layer, inducing cell shape change and convergent extension.
(A–B) Hox genes Antp and Ubx are expressed in the circumferential muscle in discrete regions, shown for surfaces extracted from light-sheet imaging. (C–D) Hox genes control organ shape: Antp and Ubx mutants lack anterior and middle constrictions, respectively. (E) Muscle and endoderm layers move together. By computationally extracting both muscle and endoderm layers in an embryo expressing both fluorescent circumferential muscle and endoderm (w,Hand>GAL4;UAS-Hand:GFP;hist:GFP), we track relative motion of initially close muscle-endoderm nuclei pairs. (F) Muscle-endoderm nuclei pairs show modest relative motion compared to the integrated motion of the tissue ( pairs, colored bands denote standard deviations). (G) Optogenetic inhibition of contractility via CRY2-OCRL, which dephosphorylates PI(4,5)P2 (Guglielmi et al., 2015), mimics hox mutant behaviors ( each), and stimulation of muscle contraction via recruitment of CRY2-RhoGEF2 to the plasma membrane (Izquierdo et al., 2018) drives ectopic folding ( each). (H) Inhibiting muscle contraction via CRY2-OCRL prevents endoderm cell shape change, shown for snapshots before and after the anterior constriction would normally form. The black scale bar is 50 μm, and white scale bar in images of segmented cells is 25 μm. (I) Measurements of endodermal cell anisotropy over time confirm that mechanical inhibition in the muscle reduces cell shape change in the endoderm (blue, ). Antp mutants also exhibit reduced endoderm cell shape change, consistent with Antp regulating muscle contraction (yellow, ). Each datapoint is the weighted average of multiple adjacent timepoints from two to three embryos with at least 30 cells per timepoint segmented in each embryo. Colored bands denote standard error on the mean, and **** denotes .
Figure 4—figure supplement 1
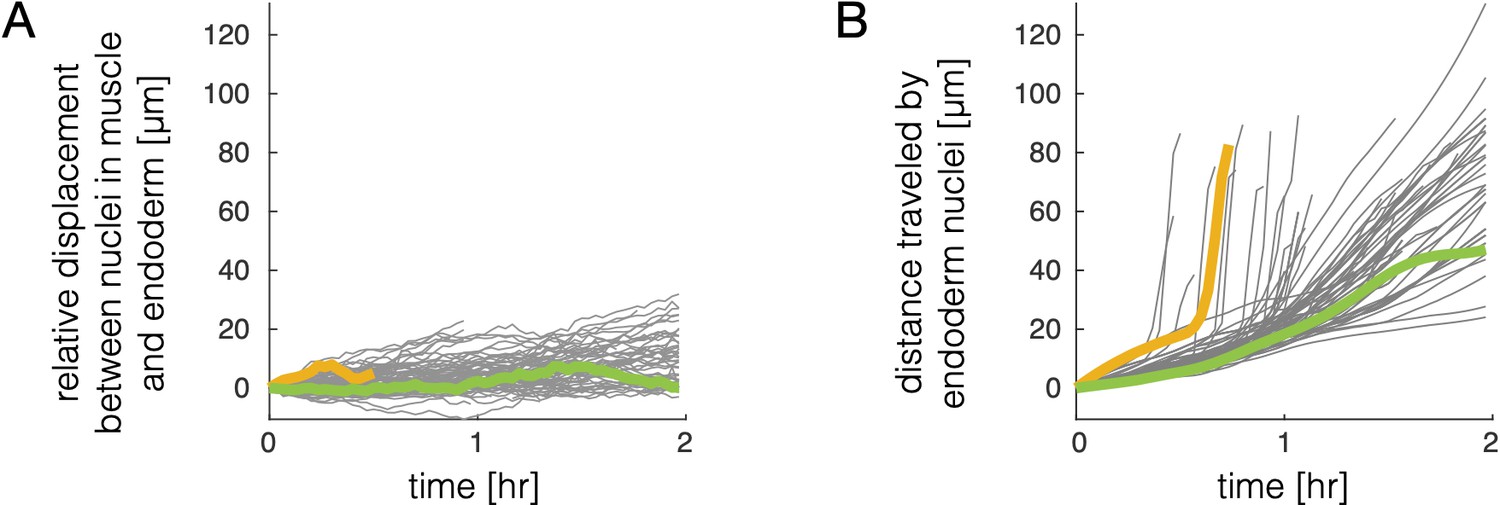
Relative motion of endodermal and mesodermal nuclei is small compared to motion of the tissue.
(A) Tracking muscle nuclei and counterpart nuclei in the endoderm reveals only a gradual increase in geodesic distance (distance along the gut surface) between initially close nuclei pairs over time. The mean displacement grows by ∼5 μm per hour during folding on average, regardless of whether nuclei are located in deep folds (as in the example pair marked by a yellow curve) or on the surface of the gut chambers (green curve). (B) In contrast, the tissue deformation leads to large displacements of cells. We measure distances in 3D embedding space along pathline trajectories suitably smoothed to remove contributions from noise and transient motions. Distance traveled for example tracks invaginating into deep folds (yellow curve) or translating on gut chambers (green curve) are highlighted to match panel (A).
Figure 4—figure supplement 2
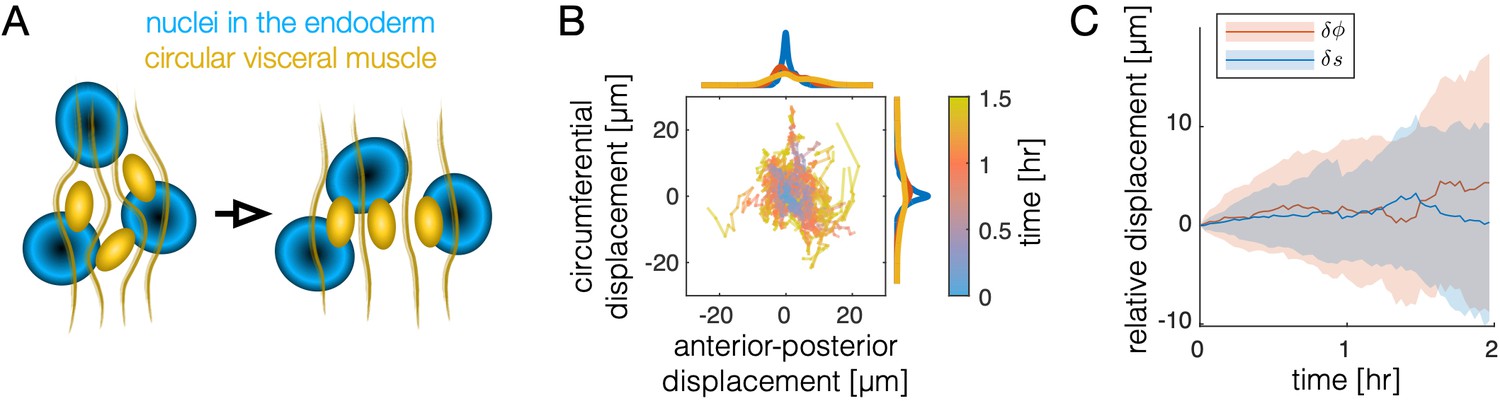
Motion of the muscle nuclei with respect to the endoderm is not coherent.
(A) Schematic of muscle nuclei configuration at early and late times. Muscle cells are positioned in bands along the AP axis and are initially clustered, such that each band is several cells wide along the circumferential axis. As constrictions form, circumferential muscle nuclei arrange in a nearly single-file configuration. (B) Motion of nuclei cells relative to the endodermal layer does not show strongly coherent (directional) motion, as demonstrated by individual tracks of relative displacement colored by timestamp. As before, the positions of 81 nuclei cells are measured relative to the center of mass of the endodermal nucleus that was nearest at the onset of constrictions. Distances are measured as geodesic lengths along the surface. Distances along the normal direction (through the thickness of the tissue) are ignored. That is, nuclear positions are projected along the thickness of the tissue onto the surface in which the endodermal nuclei reside. Histograms of accumulated displacements in either direction show the average over the first 30 min (blue), 30–60 min (red), and 60–90 min (yellow). (C) The same data shown in (B) is plotted as a distribution, with each component separated. The standard deviation of displacement coordinates (colored bands), either in the direction (along the folding longitudinal axis in the material frame, blue) or the direction (along the circumferential axis in the material frame, orange) show an increase of ∼5 μm per hour, with nearly zero mean displacement in either axis.
Figure 4—figure supplement 3

Optogenetic knockdown of muscle contractility inhibits endodermal shape changes, mimicking mutant behavior.
(A) Snapshots of single-cell shape measurements of embryos under optogenetic perturbations demonstrate that muscle contraction induces endoderm cell shape change. During optogenetic inhibition of muscle contractility in the Antp domain using w,Antp-GAL4 × w; UAS-CIBN::pmGFP;UAS-CRY2-OCRL, cell shapes in the interior two chambers (which remain as a single chamber in the optogenetic mutant) remain steady. (B) Endodermal cells undergo less shape change in both CRY2-OCRL and Antp mutants, as reported in the main text. As before, **** denotes , and N.S. denotes . (C) The endodermal cell orientation does not change significantly between conditions.
Figure 5 with 4 supplements
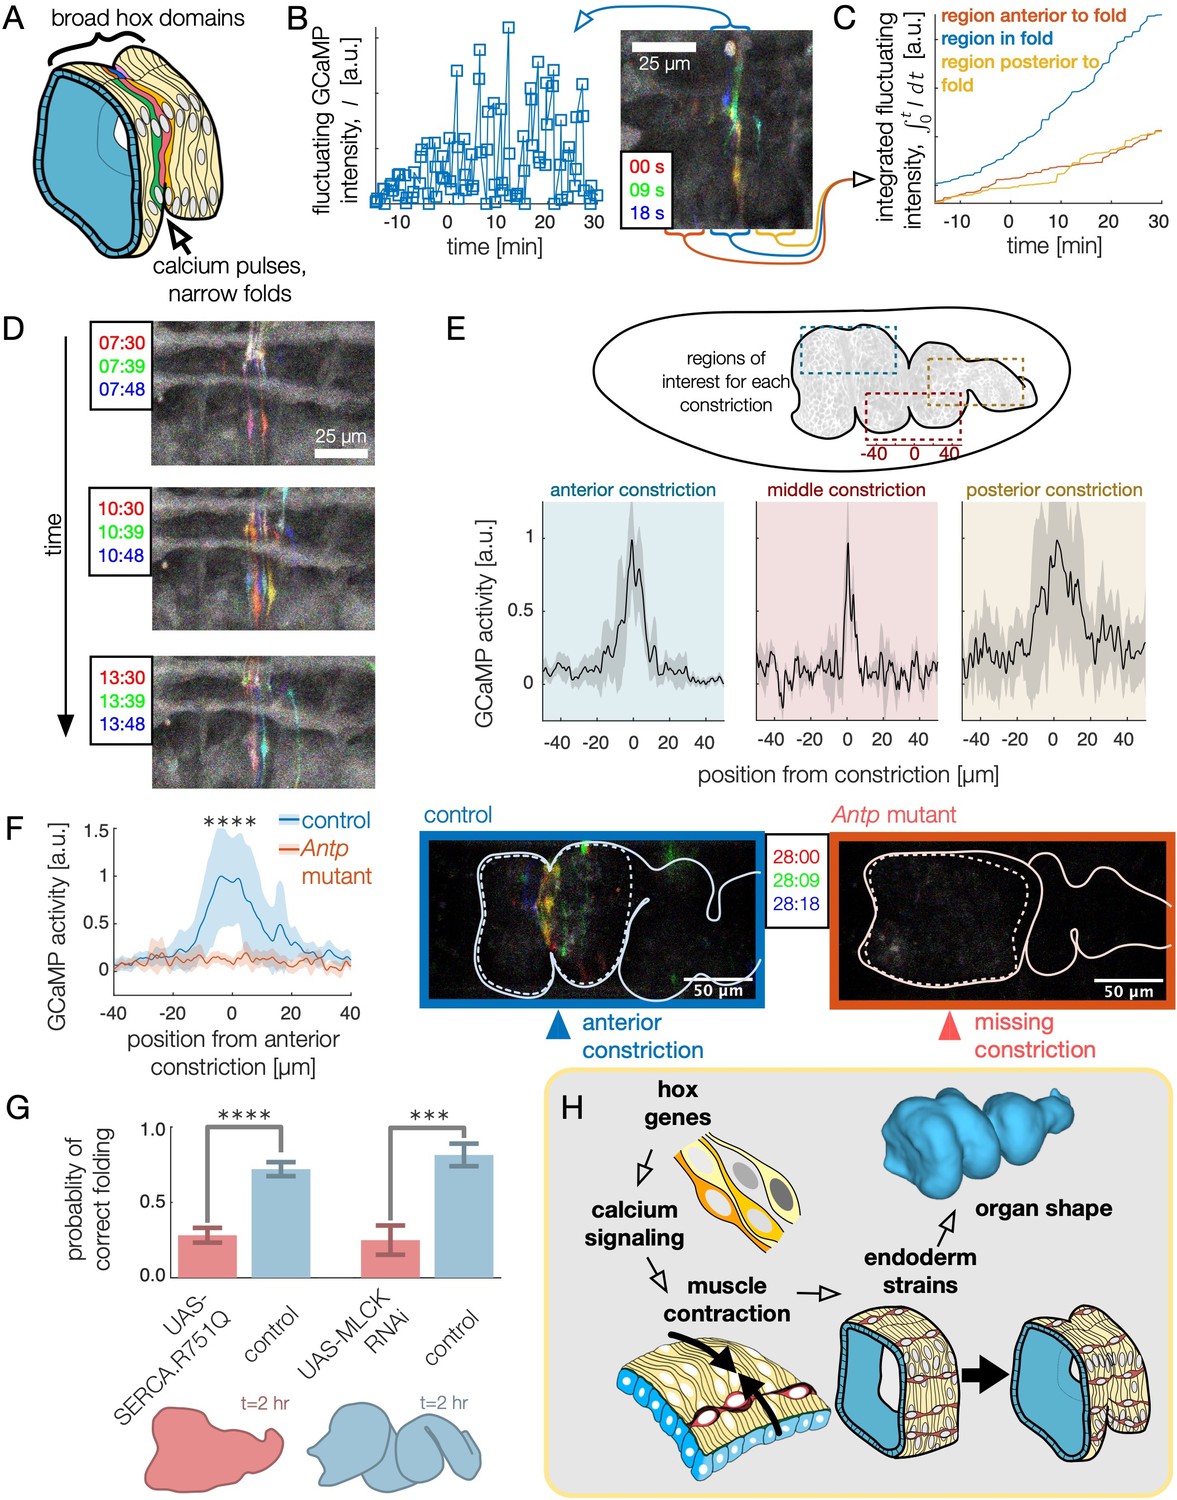
High frequency calcium pulses mediate muscle contraction, linking hox genes to organ shape through tissue mechanics.
(A) Dynamic calcium pulses appear near the anterior fold, localized to a region more narrow than the Antp domain. (B) Transient pulses in GCaMP6s intensity occur on the timescale of seconds and increase in amplitude when folding begins (). Red, green, and blue channels of images represent maximum intensity projections of confocal stacks separated in time by 9 seconds, here and below. (C) Integrated transient pulses for the embryo in (B) show calcium pulses are localized near the fold: GCaMP6s signals 20 μm in front (red) or behind the fold (yellow) are less intense. (D) Snapshots of GCaMP6s fluorescence in muscle cells demonstrate calcium activity near constrictions. Each frame is a composite of three subsequent snapshots in red, green, and blue, so that transient pulses appear as colored signal, while background appears gray. Different muscle cells report calcium activity in adjacent frames. (E) Average fluorescent activity during the first 15 min of folding show localized signatures at each constriction, with particularly sharp peaks in the middle and anterior constrictions (, , and for anterior, middle, and posterior folds, respectively). (F) In Antp mutants, GCaMP6s fluorescence is significantly reduced () and is not localized in space. Snapshots of GCaMP6s fluorescence 28 min after posterior fold onset (right) show almost no activity in the anterior region compared to the control (left). (G) Disruption of calcium regulation in muscle cells inhibits constrictions. The probability of forming three folds is reduced under heat-shock induced expression of the dominant negative mutant allele SERCA.R751Q with a muscle-specific driver Mef2-GAL4 (, ), and is likewise reduced under RNA interference of MLCK driven by tub67-GAL4;tub16-GAL4 (, ). (H) Altogether, we infer that hox genes are upstream of patterned calcium pulses, which generate muscle contraction that is mechanically coupled to the endoderm, driving tissue strains and ultimately organ shape.
Figure 5—figure supplement 1

Kymographs of GCaMP6s dynamics show that calcium activity is initially localized in space to constrictions and begins near the time at which constrictions begin.
For each constriction, the transient signal is computed (colored signals in snapshots A-C) and averaged across the DV direction (in the lab frame) into a space-time heatmap (D–F). A time of min for each panel corresponds to the time when localized constriction is visible in the bright-field channel at that constriction location and carries an uncertainty of ±5 minutes for each sample (dashed orange lines). The middle constriction (the sharpest fold, B and E) has the sharpest activity profile, and the posterior constriction (the widest fold, C and F) has the broadest activity profile.
Figure 5—figure supplement 2
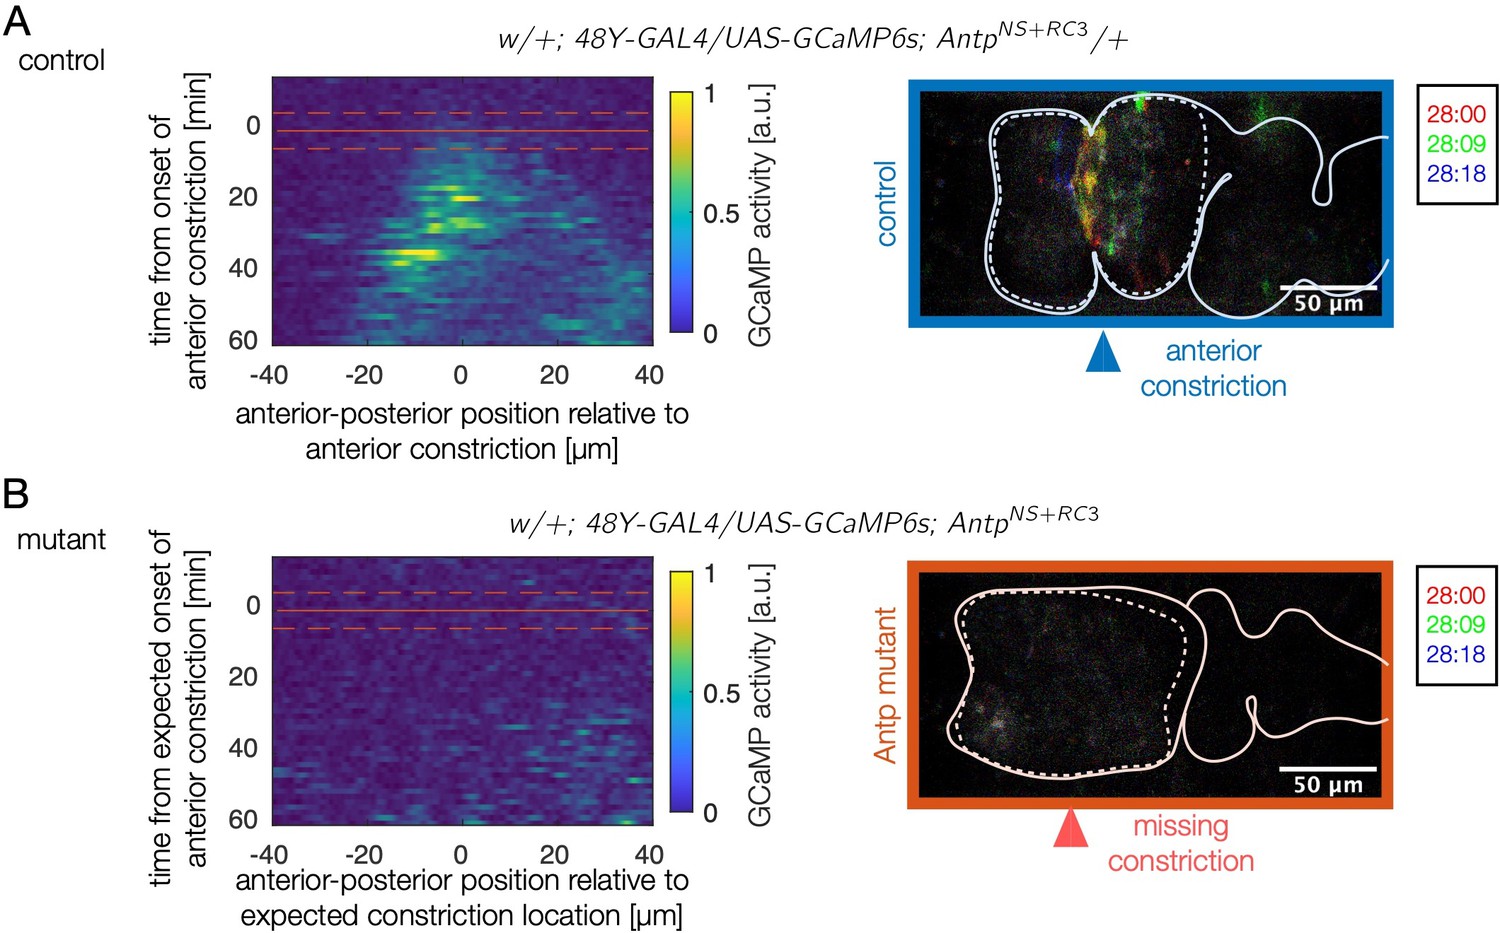
Antp mutants show reduced calcium activity in the anterior two chambers for over an hour.
(A) Kymographs of wild-type calcium dynamics near the anterior fold for control embryos show fluctuating calcium activity beginning at the onset of folding at the site of the fold. The domain of calcium activity broadens anteriorly and posteriorly in time. A red solid line marks the onset of the anterior constriction, and dashed lines denote the precision with which this time is known for a given sample. (B) In mutants, almost no calcium pulses are observed during the same timespan. A kymograph of average fluctuating GCaMP6s intensity for Antp mutants remains quiescent (dark blue). Given that the anterior fold does not form, was prescribed based on the depth of the posterior fold. We inferred the expected position of the anterior fold (which defines the horizontal axis of the kymograph) from the mean position of the anterior fold relative to the anterior face of the midgut in control embryos.
Figure 5—figure supplement 3
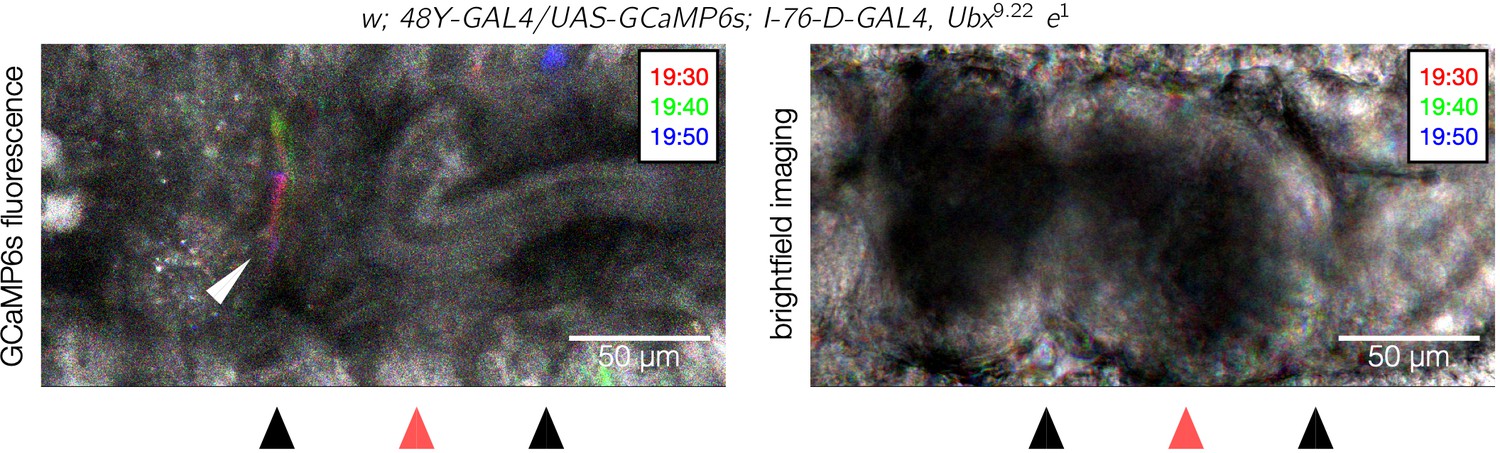
Calcium pulses appear at the unaffected anterior constriction in Ubx mutants.
A dorsal view snapshot of pulsing calcium activity (top panel) and the associated brightfield image (bottom panel) of a Ubx mutant shows calcium pulses in the anterior constriction (white arrowhead). Each image is an overlay of maximum intensity projections for three shallow confocal stacks taken 10 s apart and false-colored red, green, and blue for each respective stack. The colorful streak near the anterior constriction reflects the transient pulses at that location. As in Figure 5F and Figure 5—figure supplement 2, the posterior constriction lies outside the confocal stack and is therefore not visible in the GCaMP6s channel. These data suggest the calcium dynamics at each constriction are regulated locally along the length of the midgut (). Some unrelated calcium activity is visible in the epidermis at the top and bottom of the image because the driver I-76-D-GAL4 was present.
Figure 5—figure supplement 4
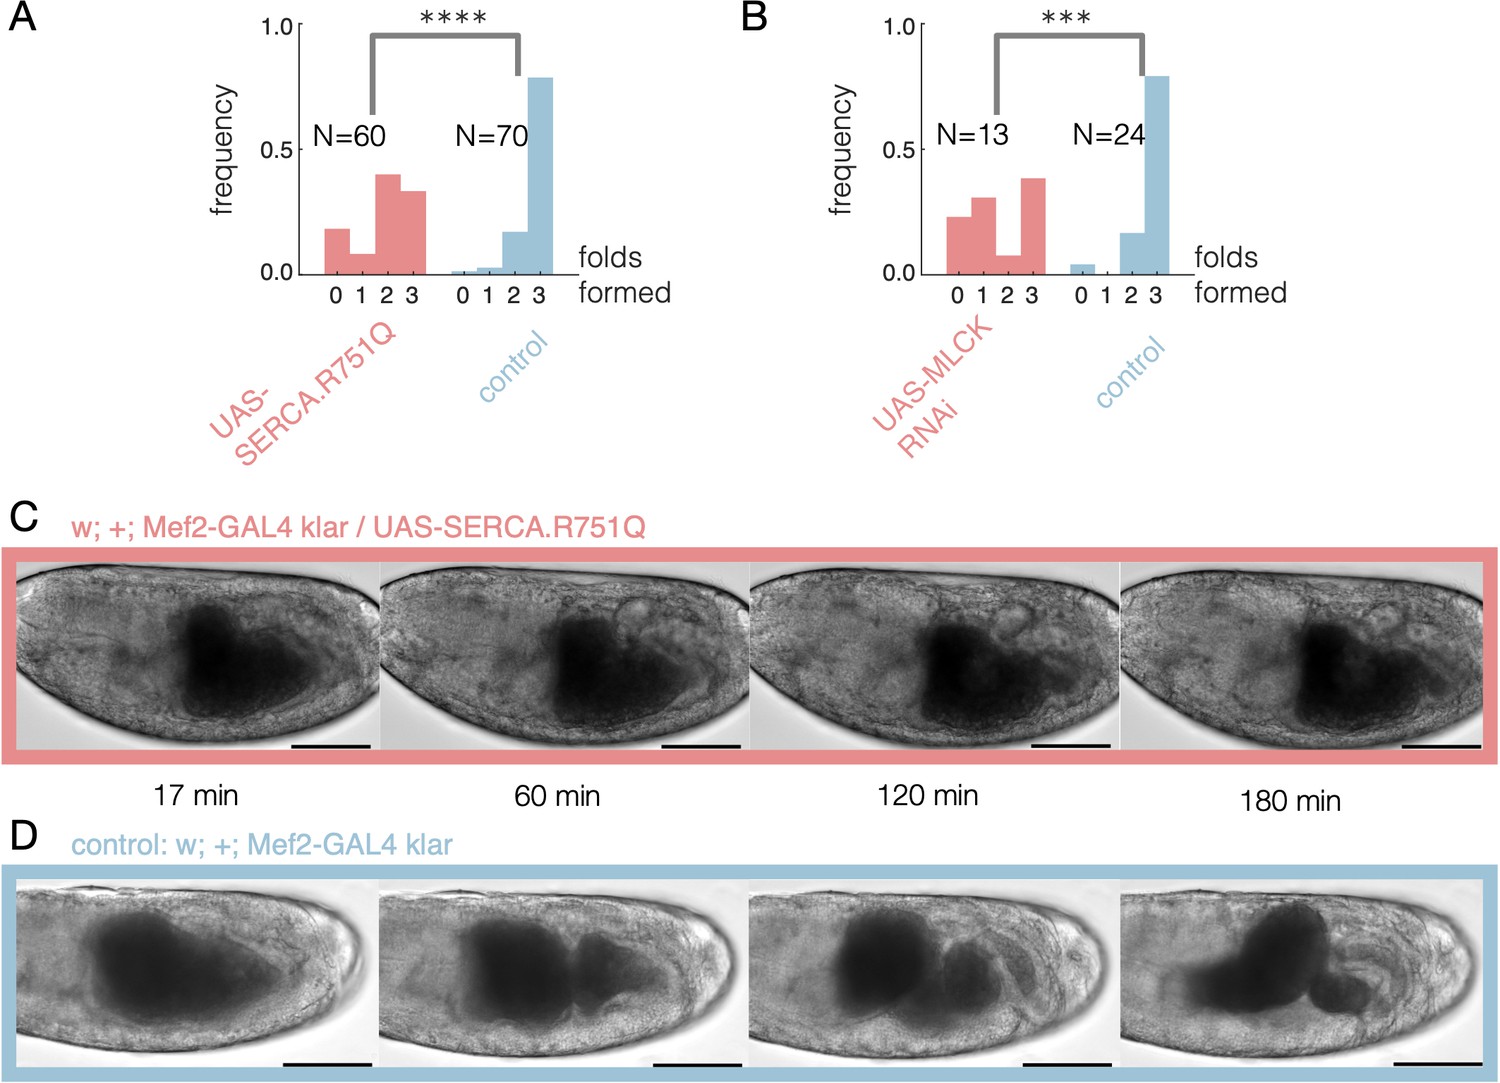
Disrupting calcium activity hinders constrictions.
(A) Embryos expressing a dominant negative form of SERCA have fewer successful constrictions on average (single tailed Z-test, , ) using a muscle-specific driver, Mef2-GAL4, at elevated temperatures (continuous heatshock at 37°C). In adult flies, this dominant negative SERCA was previously shown to exhibit temperature-sensitive expression and inhibits muscle contractions at 37°C (Kaneko et al., 2014). (B) Embryos expressing RNAi against MLCK have fewer successful folds on average (single tailed Z-test, , ). Here we use a ubiquitous driver, tub15-GAL4;tub67-GAL4, under continuous heatshock starting during or just after midgut closure, before constrictions appear. (C) Brightfield imaging of embryos expressing a mutant form of SERCA in muscles show reduced folding activity. Here, driving a mutant SERCA expression via heatshock starting at stage 15 shows no folds. (D) Control embryos without the mutant form of SERCA, in contrast, typically form three folds. Timestamps denote minutes since the onset of heatshock and scalebar is 100 μm.
Videos
Video 1
Live imaging using confocal MuVi SPIM shows the shape change of the midgut as it folds into a coil of compartments.
Here, we display panoramic views of fluorescently-labeled nuclei in both endoderm and muscle tissue layers of the midgut in a w;48Y-GAL4;klar × w;UAS-histone::RFP embryo. Maximum intensity projections of half-volumes from left lateral (upper left), right lateral (lower left), dorsal (upper right), and ventral views (lower right) exhibit the nearly isotropic resolution of our imaging setup.
Video 2
Segmentation using computer vision techniques enables layer-specific imaging of midgut morphogenesis, highlighted here for a w;48Y-GAL4;klar × w;UAS-CAAX::mCh embryo.
First, a morphological snakes level set identifies the midgut endoderm at a timepoint before the onset of constrictions. This surface follows the evolving shape of the organ during the subsequent dynamics. Rendering the data that intersects this dynamic surface allows us to visualize cells.
Video 3
An example tissue patch shows that cell rearrangements in the endodermal layer (i.e ‘T1 transitions’ or ‘intercalation events’) occur during gut morphogenesis.
Here, the blue and green cells are not initially neighbors, but rearrange to separate the red and pink cells. Subsequently, the blue and pink cells lose their connection as well, as do the green and pink cells. Each frame shows the tissue patch mapped to 2D by a rigid flattening of the surface in a manner that the map is nearly conformal near the center of the image, with metric components . T1 transitions are not biased in their orientation until late stages of morphogenesis, consistent with cell shape change being the dominant contributor to tissue shear.
Video 4
Extracted in-plane and out-of-plane tissue velocities show signatures associated with stages of shape change.
The tangential (in-plane) component of the velocity (, top panel) is colored by its orientation in the pullback plane described in the Materials and methods. In this ‘unwrapped’ pullback plane, ventral tissue occupies the center of the image, anterior is left, and posterior is right. For example, purple regions flow towards the midgut’s posterior and orange regions flow towards the anterior. Opacity of the colored signal is proportional to the magnitude of the tissue velocity. The normal (out-of-plane) component of the velocity (vn, bottom panel) is red for motion in the endoderm’s apical direction (toward the inside of the gut) and blue for motion in the basal (outer) direction. The corresponding midgut surface is shown on the left for all timepoints.
Video 5
In-plane tissue velocities are tightly linked to out-of-plane motion, indicating nearly incompressible behavior of the composite midgut tissue.
For a representative embryo, we plot the out-of-plane deformation on the left, both as a left lateral view in 3D and in the pullback plane. Here, vn is the normal velocity and is the mean curvature, which is positive for a cylinder but negative for sharp folds whose outer radius of curvature is smaller than their inner circumference. In the middle column, we plot the dilatational flow for this embryo, defined as the covariant divergence of the in-plane velocity, . In the right column, we plot the difference between these two quantities, which measures the rate of isotropic expansion or contraction of the tissue.
Video 6
Muscle nuclei (yellow) and endoderm nuclei (blue) move together during constrictions, reflecting a tight coupling between tissue layers.
Here, we false color two selected layers of a w,Hand>GAL4;UAS-Hand:GFP;hist:GFP embryo in yellow (muscle layer) and blue (endoderm).
Video 7
Calcium pulses appear at the location of each constriction, shown here for the anterior constriction in a Mef2-GAL4>UAS-GCaMP6s embryo.
We visualize the dynamics of calcium pulses by overlaying three snapshots captured nine seconds apart as red, green, and blue images for each frame. Thus, colored pixels represent transient activity reported by GCaMP6s. A composite frame is imaged every 90 s, and the timestamp is shown relative to the onset of the constriction, as monitored in a separate bright-field channel (not shown).
Video 8
In Antp mutants, calcium pulses are strongly reduced in intensity in the vicinity of the missing anterior constriction location.
In WT embryos (top panel), calcium pulses appear at the onset of constrictions near the anterior constriction and appear in an increasingly spatially extended region as development progresses. In contrast, for Antp mutant embryos, calcium activity is reduced and does not exhibit an initially localized pattern (bottom panel).
Video 9
Disrupting calcium signaling in the muscle layer inhibits constrictions, shown here for an embryo expressing a dominant negative allele of SERCA (red) with a control embryo under the same conditions for reference (blue).
Additional files
Download links
A two-part list of links to download the article, or parts of the article, in various formats.
Downloads (link to download the article as PDF)
Open citations (links to open the citations from this article in various online reference manager services)
Cite this article (links to download the citations from this article in formats compatible with various reference manager tools)
Visceral organ morphogenesis via calcium-patterned muscle constrictions
eLife 11:e77355.
https://doi.org/10.7554/eLife.77355


