CAMSAP2 organizes a γ-tubulin-independent microtubule nucleation centre through phase separation
- Division of Structural Medicine and Anatomy, Department of Physiology and Cell Biology, Kobe University Graduate School of Medicine, Japan
- JST, PRESTO, Japan
- RIKEN Center for Biosystems Dynamics Research, Japan
- Frontier Research Institute for Interdisciplinary Sciences, Tohoku University, Japan
- RIKEN SPring-8 Center, Japan
- Japan Synchrotron Radiation Research Institute (JASRI), Japan
- Materials and Structural Analysis, Thermo Fisher Scientific, Japan
- Research Center for Ultra-High Voltage Electron Microscopy, Osaka University, Japan
Figures
Figure 1 with 1 supplement
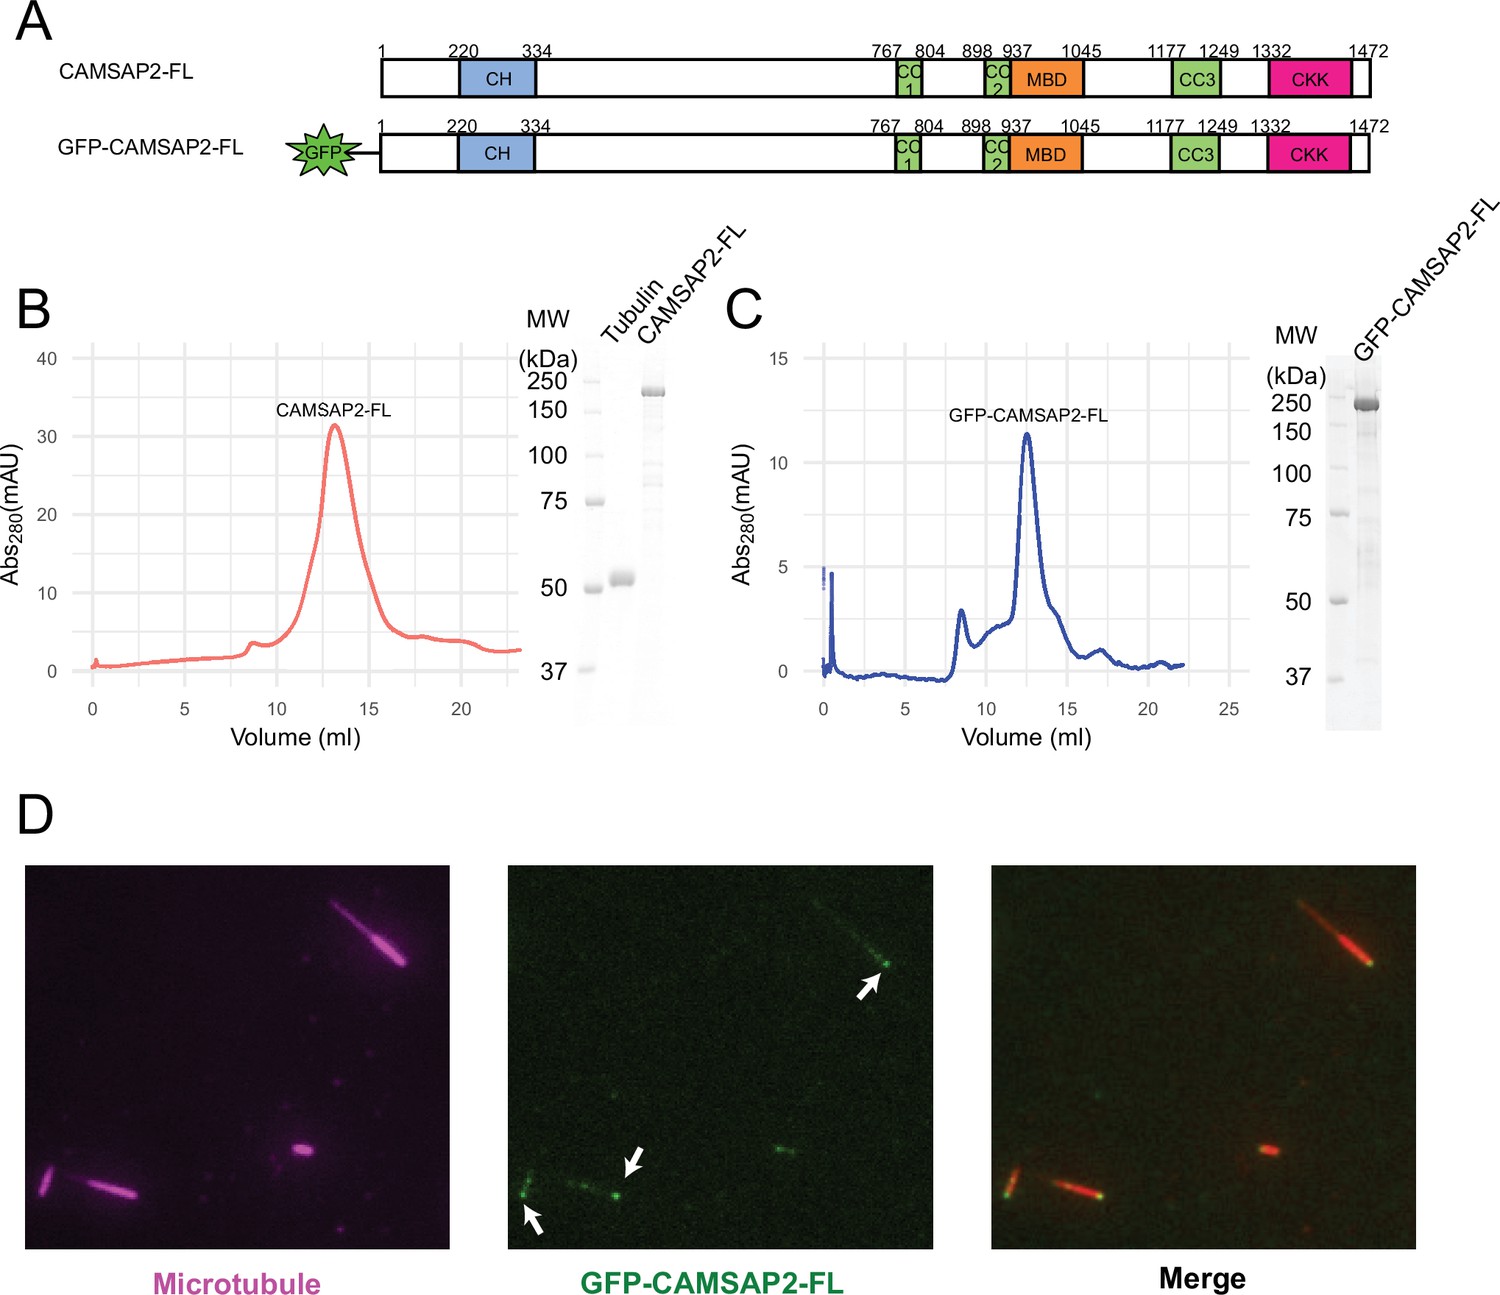
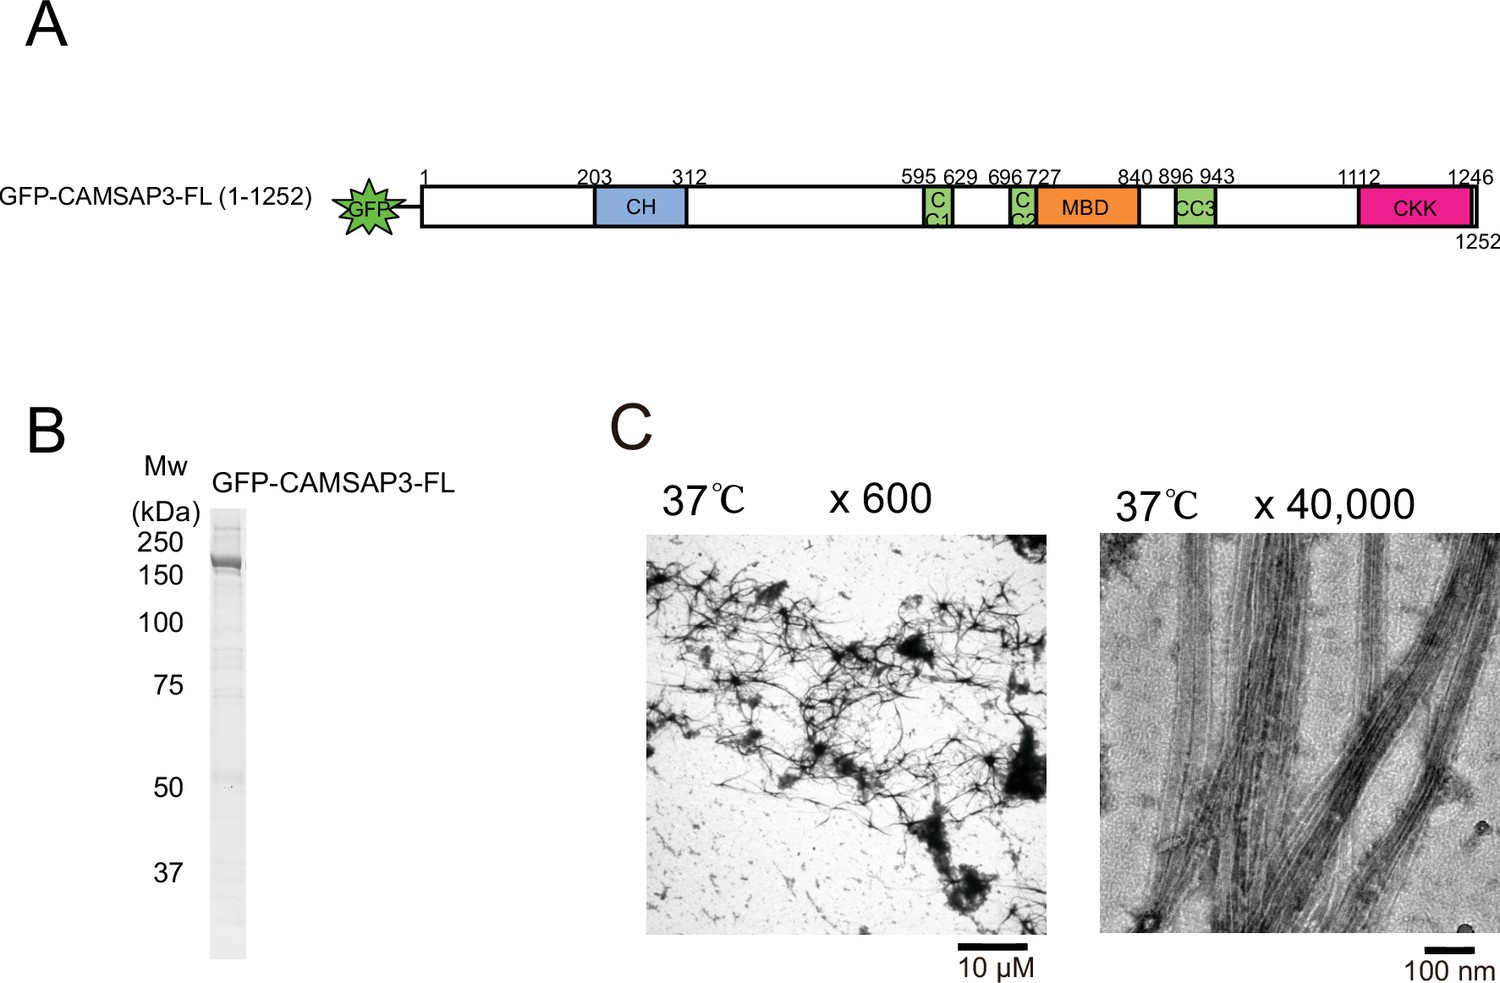
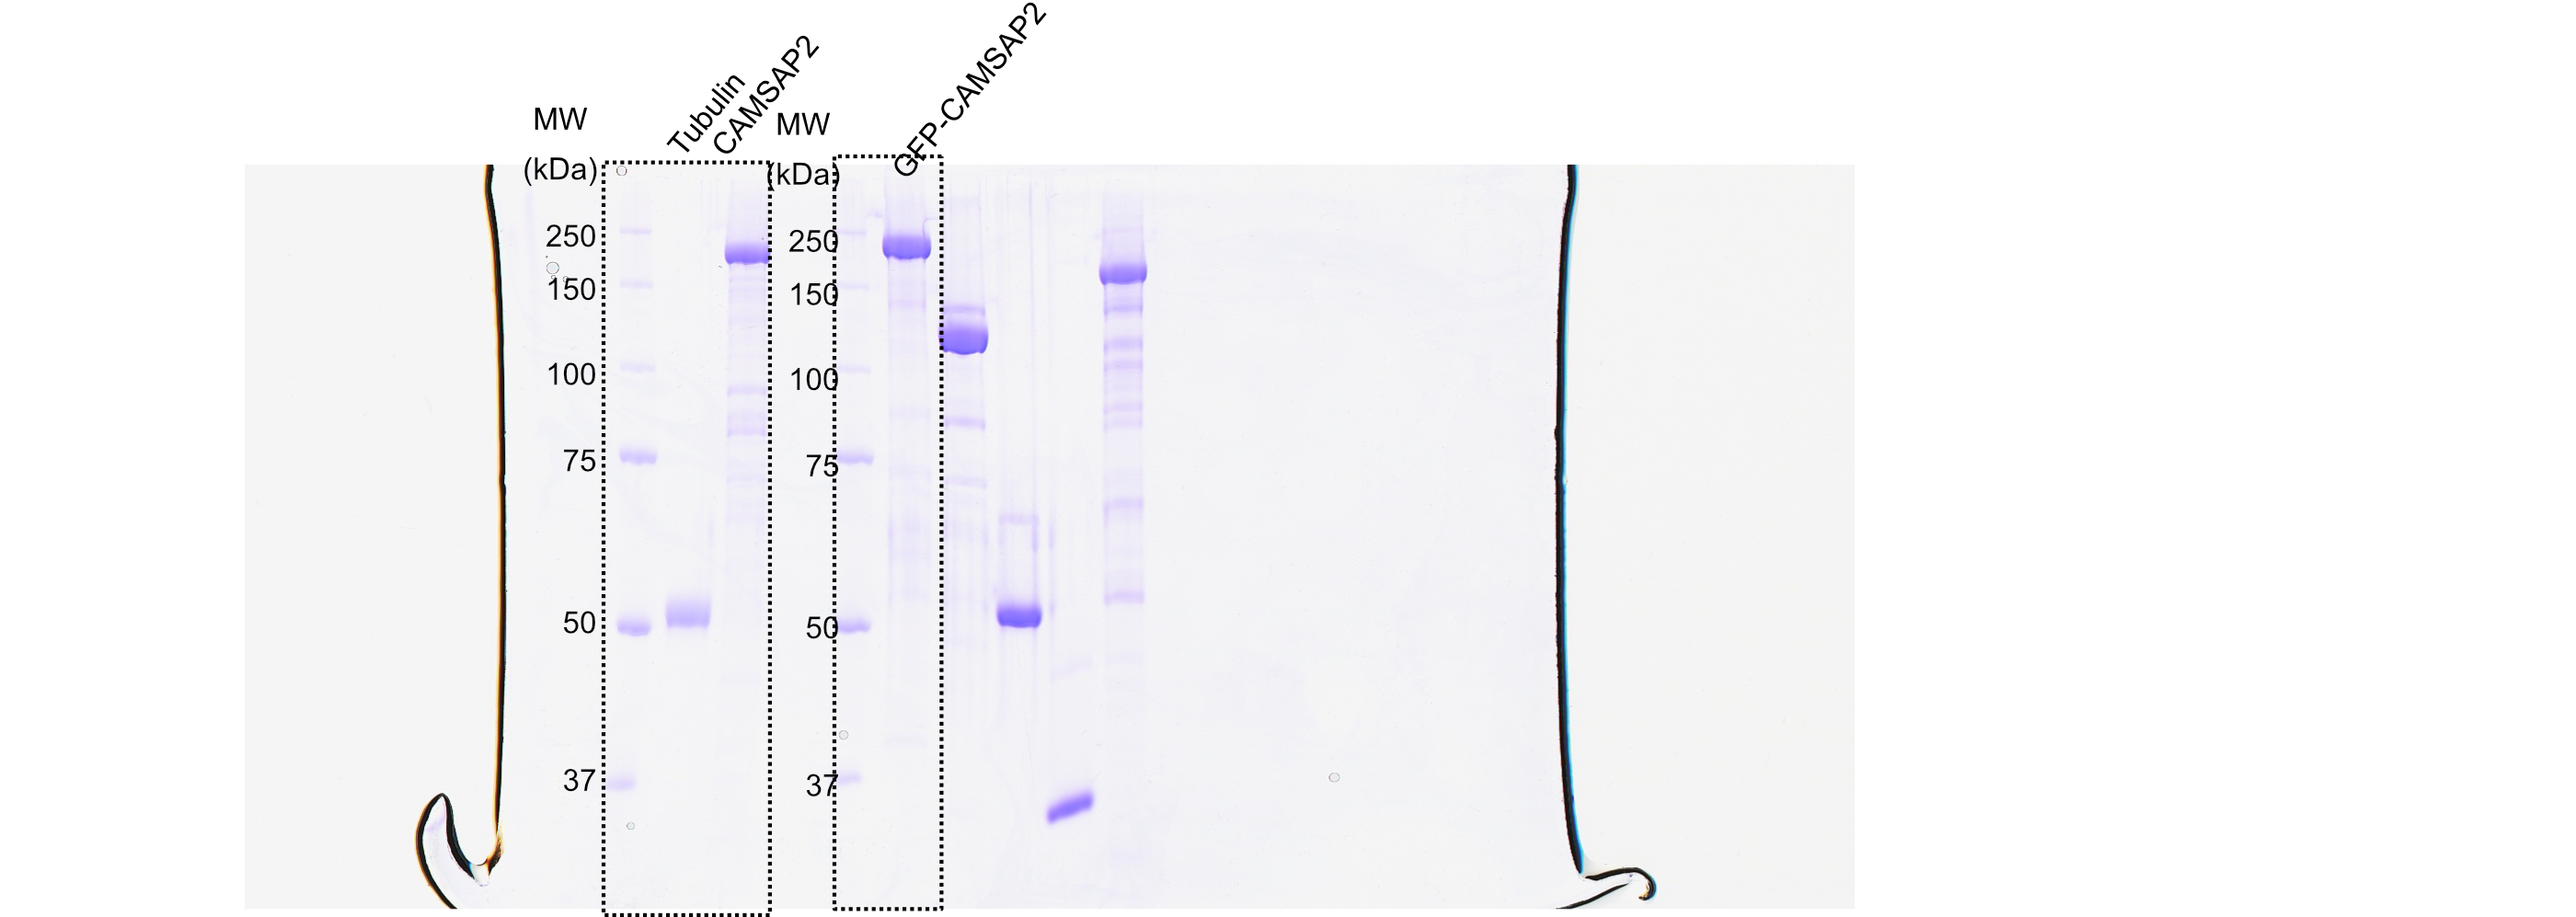
Functional study of recombinant calmodulin-regulated spectrin-associated protein 2 (CAMSAP2).
(A) Schematic representation of the full-length CAMSAP2 constructs used in this study. CH, calponin-homology domain; MBD, microtubule-binding domain; CC, coiled-coil domain; CKK, C-terminal domain common to CAMSAP1 and two other mammalian proteins, KIAA1078 and KIAA1543. (B) (C) Size exclusion chromatography and SDS-PAGE of the peak fraction of (B) full-length CAMSAP2 and (C) GFP-CAMSAP2. (D) Total internal reflection fluorescence images of polarity-marked microtubules (magenta) decorated with purified GFP-CAMSAP2 (green). The minus-end segment of the microtubule is brighter than the plus-end segment.
-
Figure 1—source data 1
Figure 1 SDS-PAGE gel of the full-length calmodulin-regulated spectrin-associated protein 2.
- https://cdn.elifesciences.org/articles/77365/elife-77365-fig1-data1-v1.jpg
Figure 1—figure supplement 1
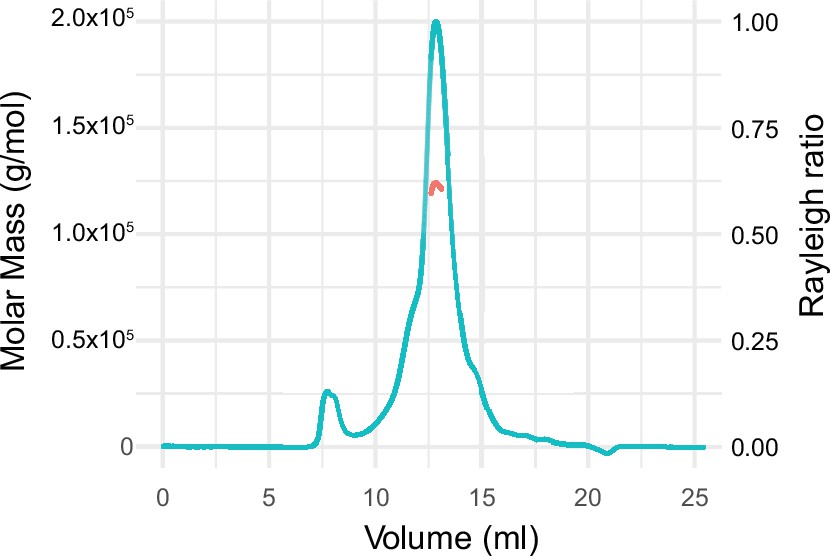
Size exclusion chromatography with multi-angle light scattering of the calmodulin-regulated spectrin-associated protein 2-FL.
Figure 2 with 1 supplement
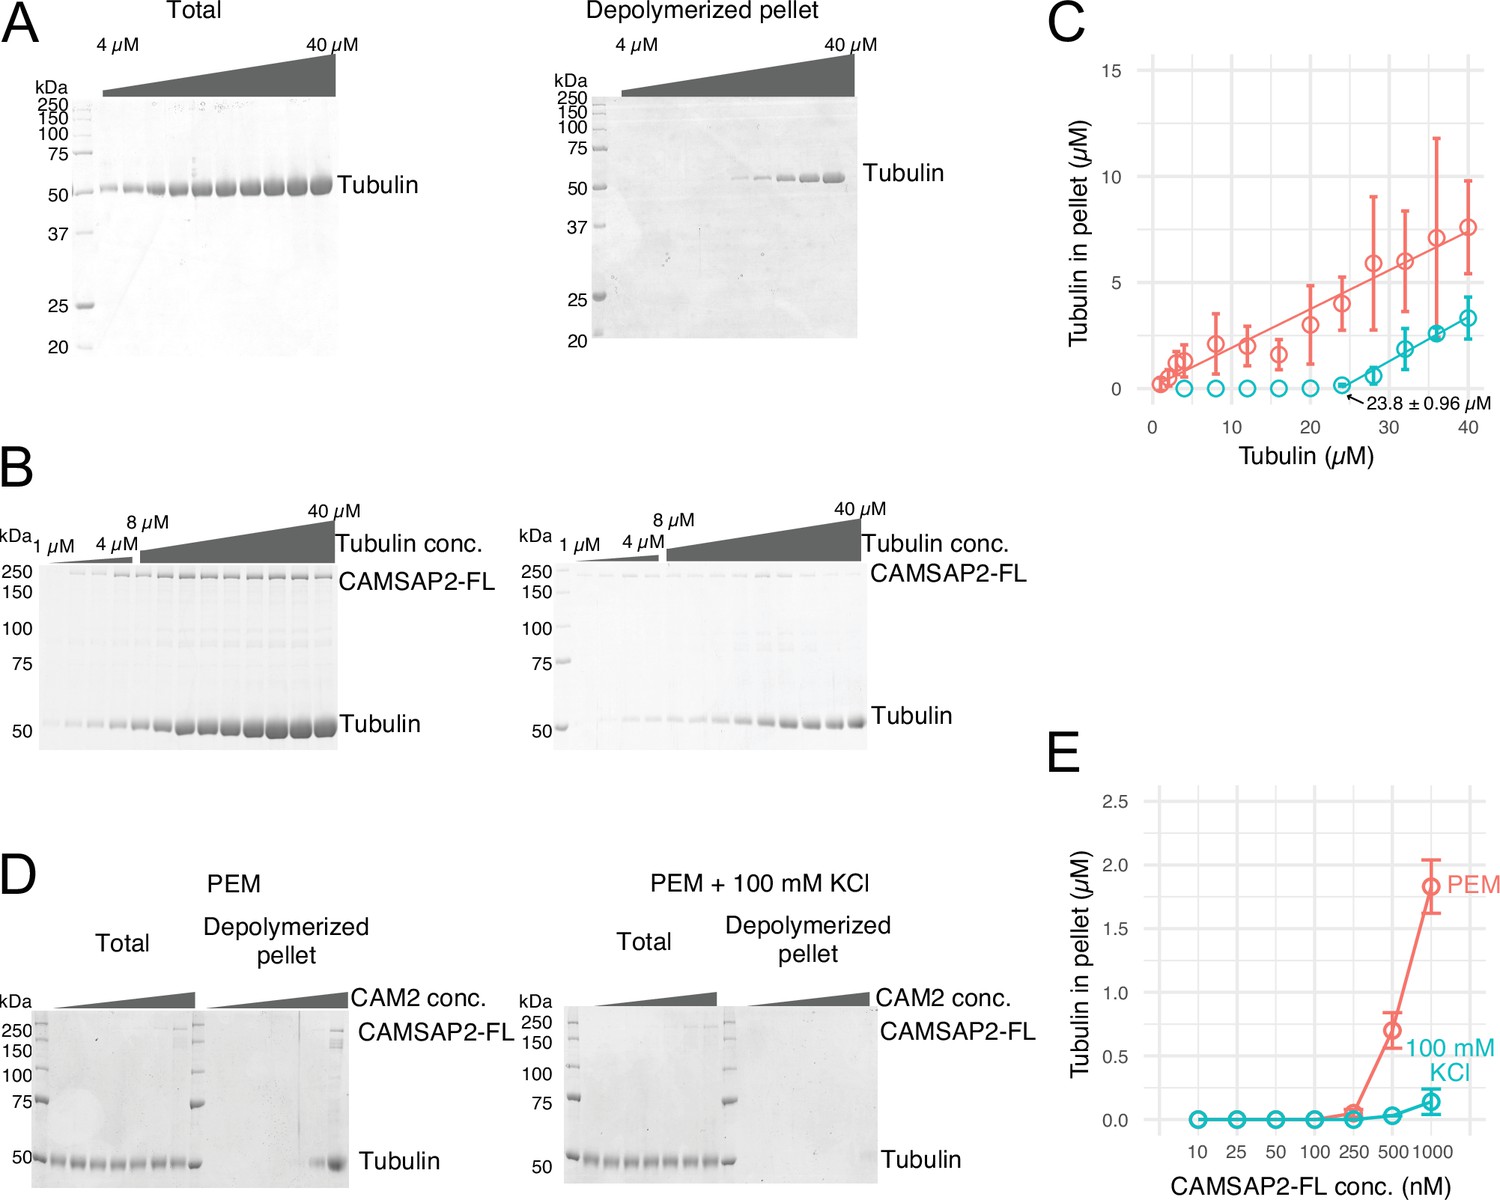
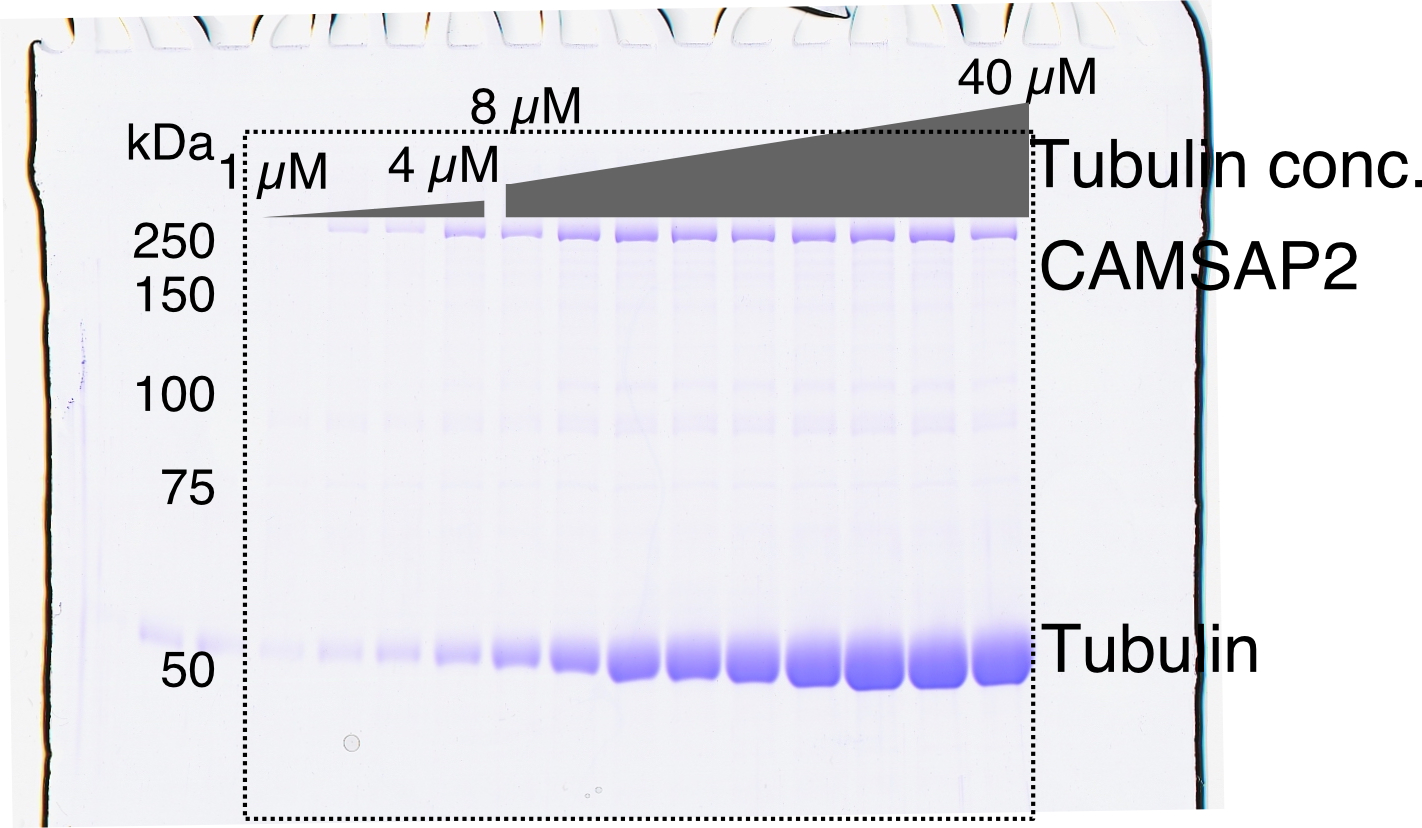
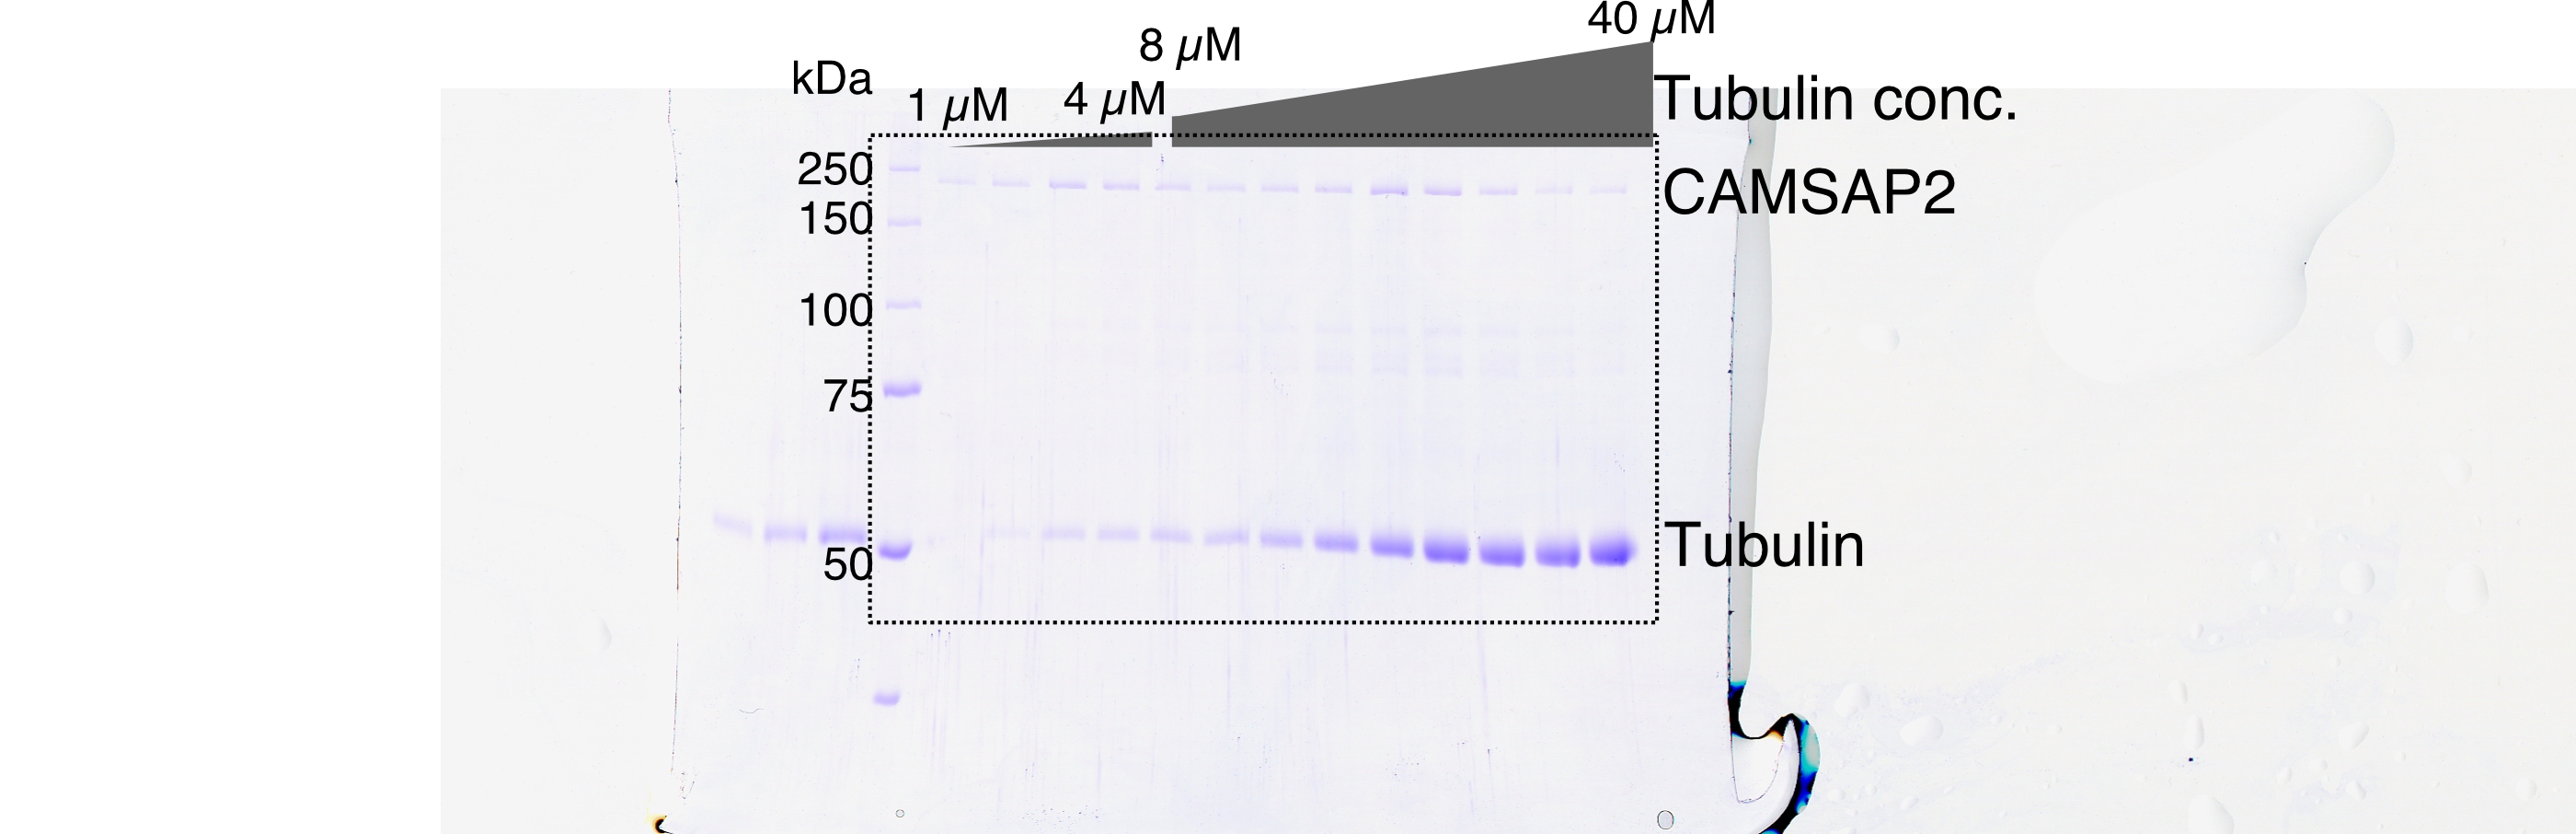
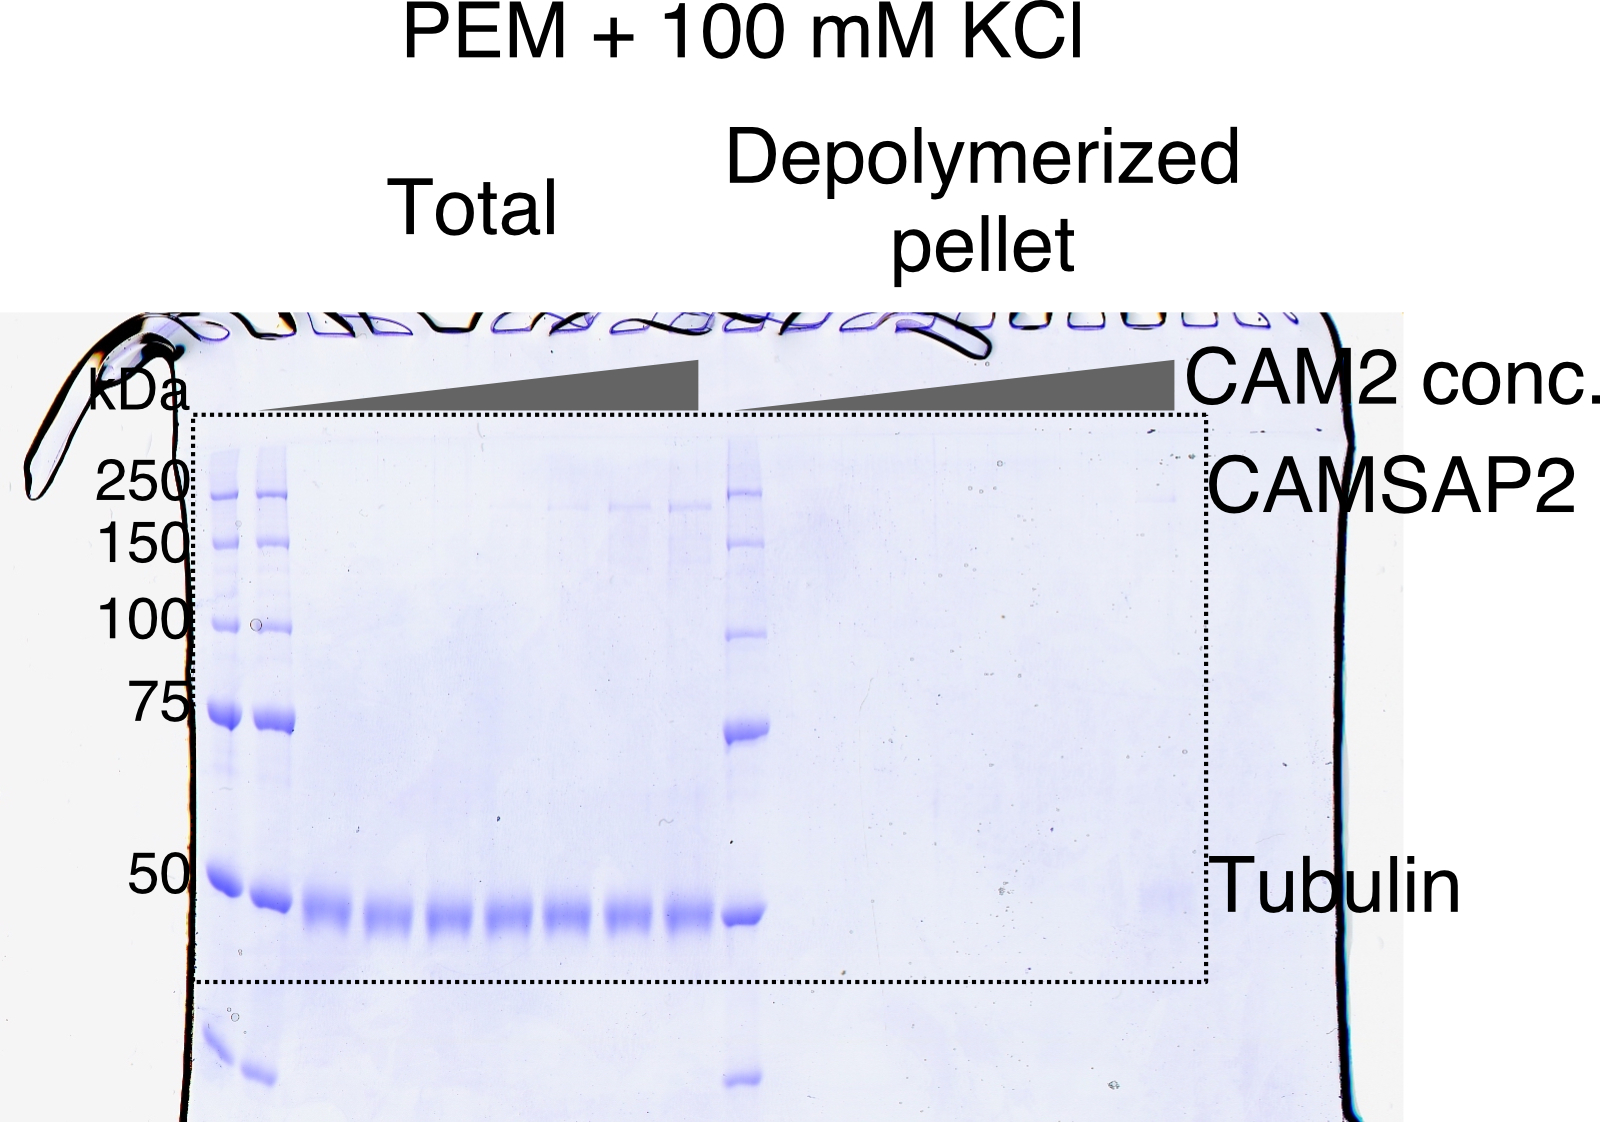
Calmodulin-regulated spectrin-associated protein 2 (CAMSAP2) stimulates microtubule nucleation.
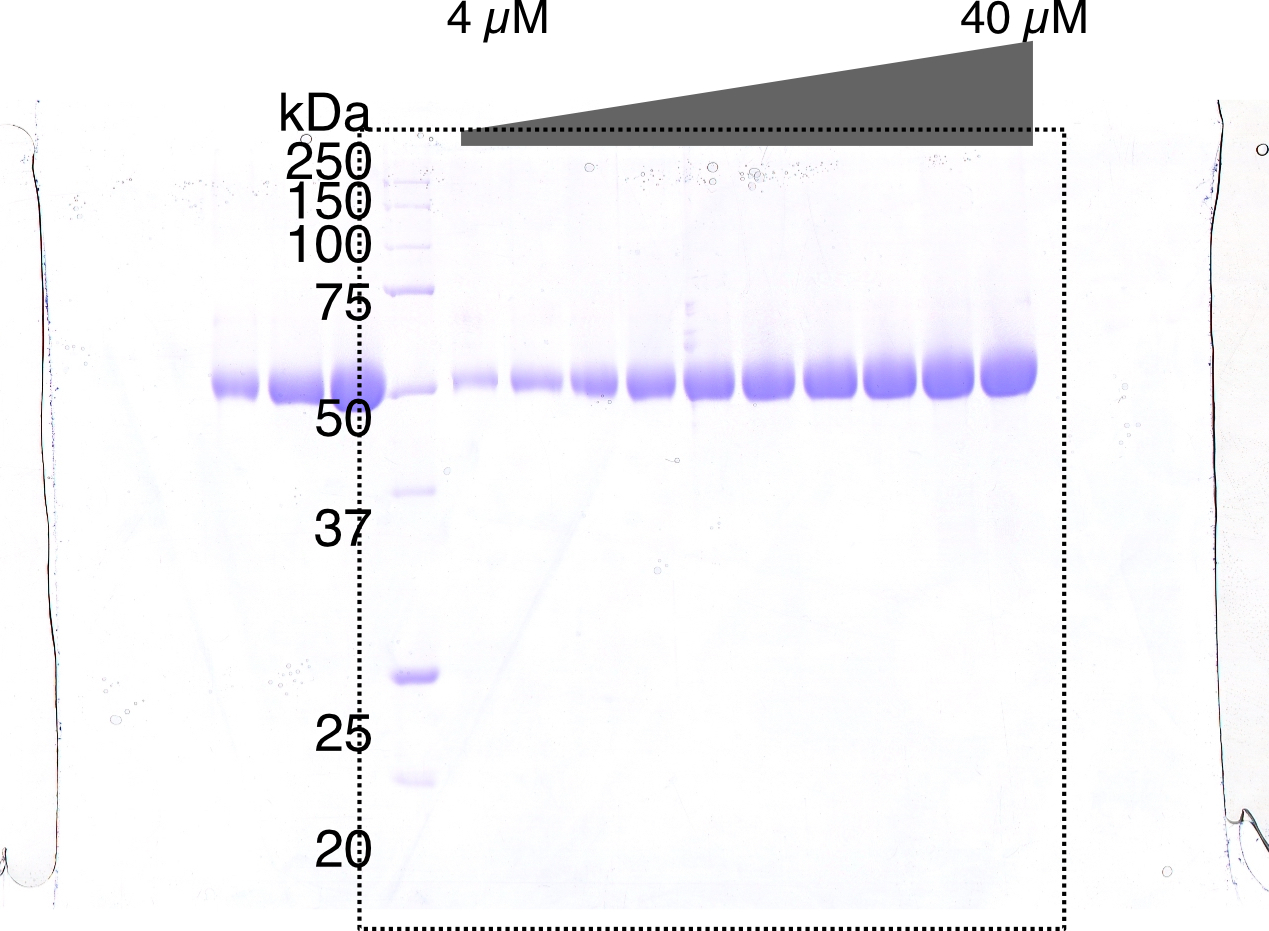
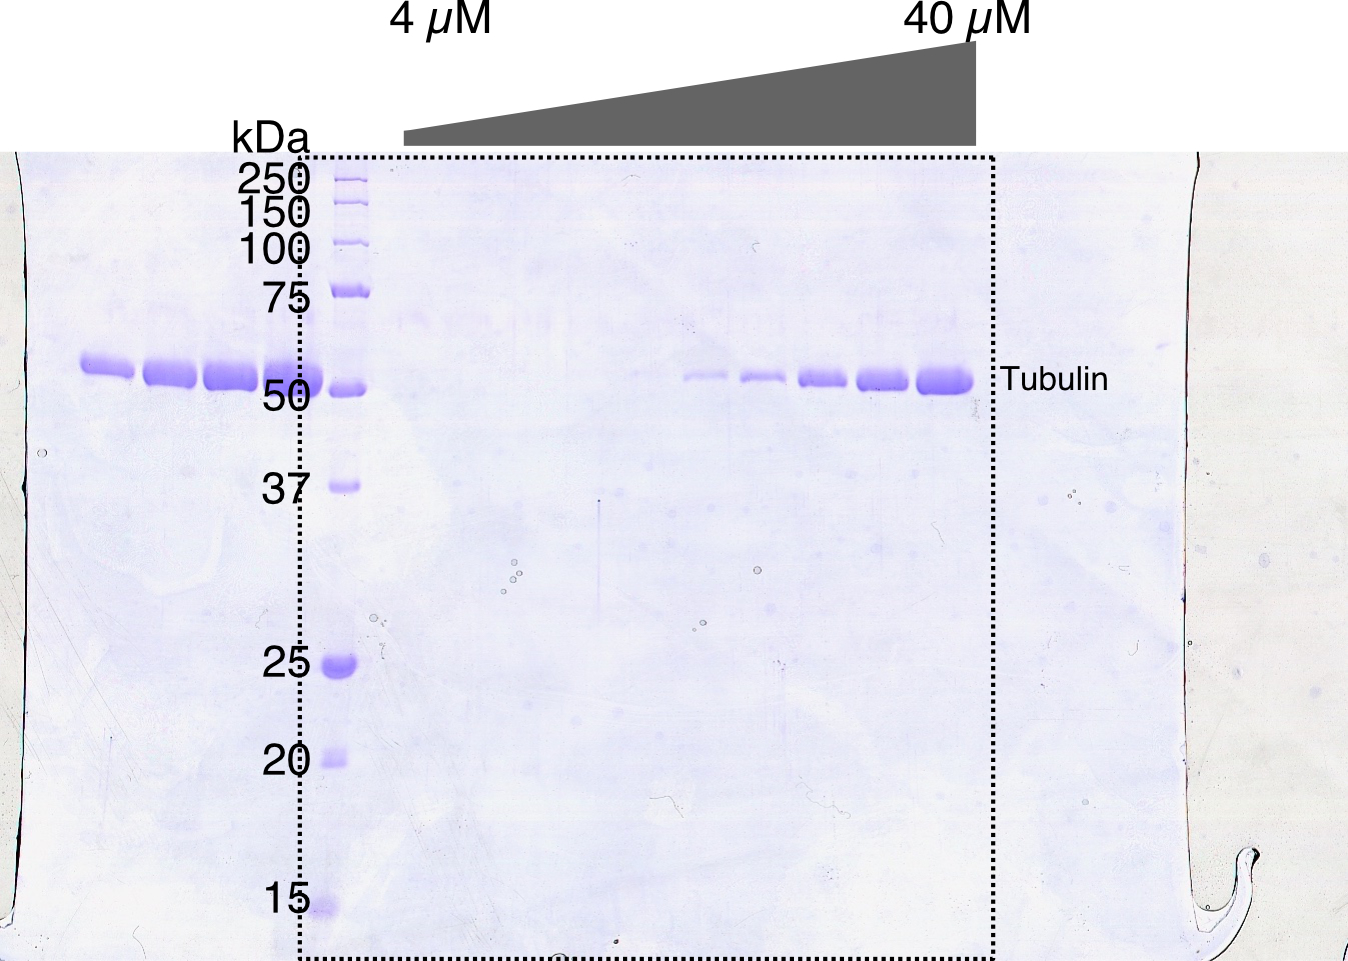
(A) SDS-PAGE gels from a spin-down spontaneous nucleation assay of tubulin showing the total tubulin after 60 min of polymerization at 37°C (left gel). Polymerized tubulin was pelleted by centrifugation and then depolymerized on ice and centrifuged to remove debris, and the supernatant was subjected to SDS-PAGE (right gel). (B) SDS-PAGE gels from a spin-down spontaneous nucleation assay of tubulin with 1 µM CAMSAP2-FL showing the total tubulin-CAMSAP2 (left gel) and the polymerized/depolymerized tubulin (right gel). (C) Plots of the depolymerized tubulin concentrations determined by pelleting assay against the total tubulin concentrations determined by the reaction on SDS-PAGE gel from three independent assays (mean ± SD). The depolymerized tubulin from the tubulin assay is turquoise green, and that combined with CAMSAP2-FL is orange. The concentrations of tubulin greater than 0.1 µM are fitted with a trend line that has an x-intercept of 23.8 ± 0.96 µM (CcMT nucleation). (D) SDS-PAGE gels from a spin-down spontaneous nucleation assay of 10 µM tubulin with 10–1000 nM CAMSAP2-FL in the PEM (100 mM PIPES pH 6.8, 1 mM MgCl2, 1 mM EGTA, and 1 mM GTP) or PEM + 100 mM KCl. (E) Plots of the depolymerized pelleting assay in the different concentration of the CAMSAP2-FL with different buffer with SD from three independent assays (mean ± SD).
-
Figure 2—source data 1
SDS-PAGE gel from a spin-down spontaneous nucleation assay of tubulin showing the total tubulin after 60 min of polymerization at 37°C.
- https://cdn.elifesciences.org/articles/77365/elife-77365-fig2-data1-v1.jpg
-
Figure 2—source data 2
SDS-PAGE gel of depolymerized tubulin after spin-down pelleting assay.
- https://cdn.elifesciences.org/articles/77365/elife-77365-fig2-data2-v1.jpg
-
Figure 2—source data 3
SDS-PAGE gel from a spin-down spontaneous nucleation assay of tubulin with 1 µM calmodulin-regulated spectrin-associated protein 2-FL showing the total tubulin after 60 min of polymerization at 37°C.
- https://cdn.elifesciences.org/articles/77365/elife-77365-fig2-data3-v1.jpg
-
Figure 2—source data 4
SDS-PAGE gel of depolymerized tubulin with 1 µM calmodulin-regulated spectrin-associated protein 2-FL after spin-down pelleting assay.
- https://cdn.elifesciences.org/articles/77365/elife-77365-fig2-data4-v1.jpg
-
Figure 2—source data 5
Quantification of the depolymerized tubulin concentrations determined by pelleting assay.
- https://cdn.elifesciences.org/articles/77365/elife-77365-fig2-data5-v1.docx
-
Figure 2—source data 6
SDS-PAGE gel from a spin-down spontaneous nucleation assay of 10 µM tubulin with 10–1000 nM calmodulin-regulated spectrin-associated protein 2-FL in the PEM.
- https://cdn.elifesciences.org/articles/77365/elife-77365-fig2-data6-v1.jpg
-
Figure 2—source data 7
SDS-PAGE gel from a spin-down spontaneous nucleation assay of 10 µM tubulin with 10–1000 nM calmodulin-regulated spectrin-associated protein 2-FL in the PEM + 100 mM KCl.
- https://cdn.elifesciences.org/articles/77365/elife-77365-fig2-data7-v1.jpg
-
Figure 2—source data 8
Quantification of the depolymerized tubulin concentrations determined by pelleting assay.
- https://cdn.elifesciences.org/articles/77365/elife-77365-fig2-data8-v1.docx
Figure 2—figure supplement 1
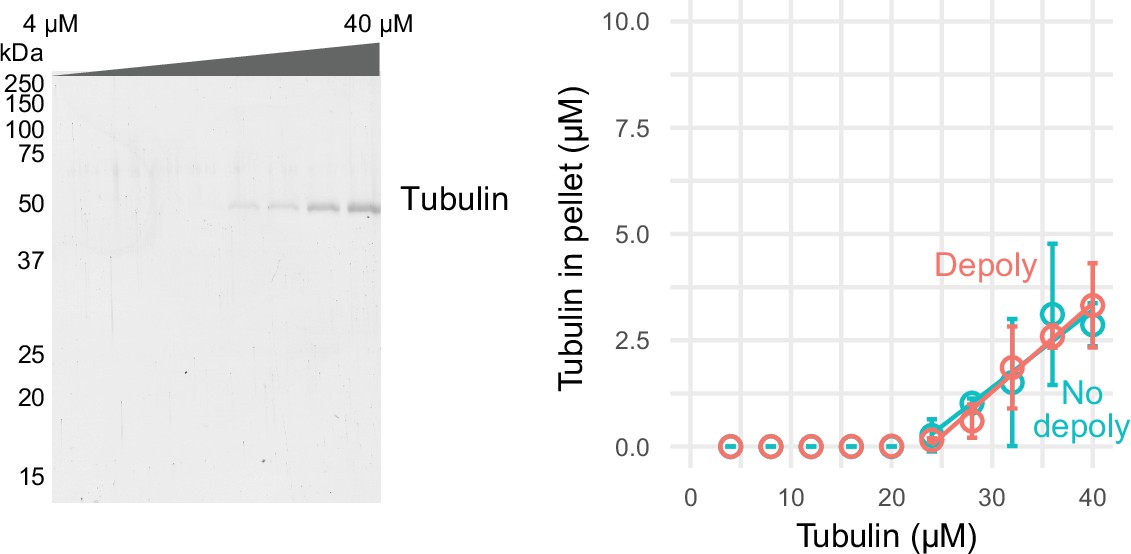
Comparison of pelleting assay.
Comparison of conventional pelleting assay without depolymerization (no deploy) and modified pelleting assay with depolymerization (depoly, which is the same data as shown in Figure 2C).
-
Figure 2—figure supplement 1—source data 1
SDS-PAGE gel of tubulin spin-down pelleting assay without depolymerization (no depoly).
- https://cdn.elifesciences.org/articles/77365/elife-77365-fig2-figsupp1-data1-v1.jpg
-
Figure 2—figure supplement 1—source data 2
Quantification of the depolymerized tubulin concentrations determined by pelleting assay.
- https://cdn.elifesciences.org/articles/77365/elife-77365-fig2-figsupp1-data2-v1.jpg
Figure 3 with 1 supplement
Calmodulin-regulated spectrin-associated protein 2 (CAMSAP2) forms co-condensate with tubulin in vitro.
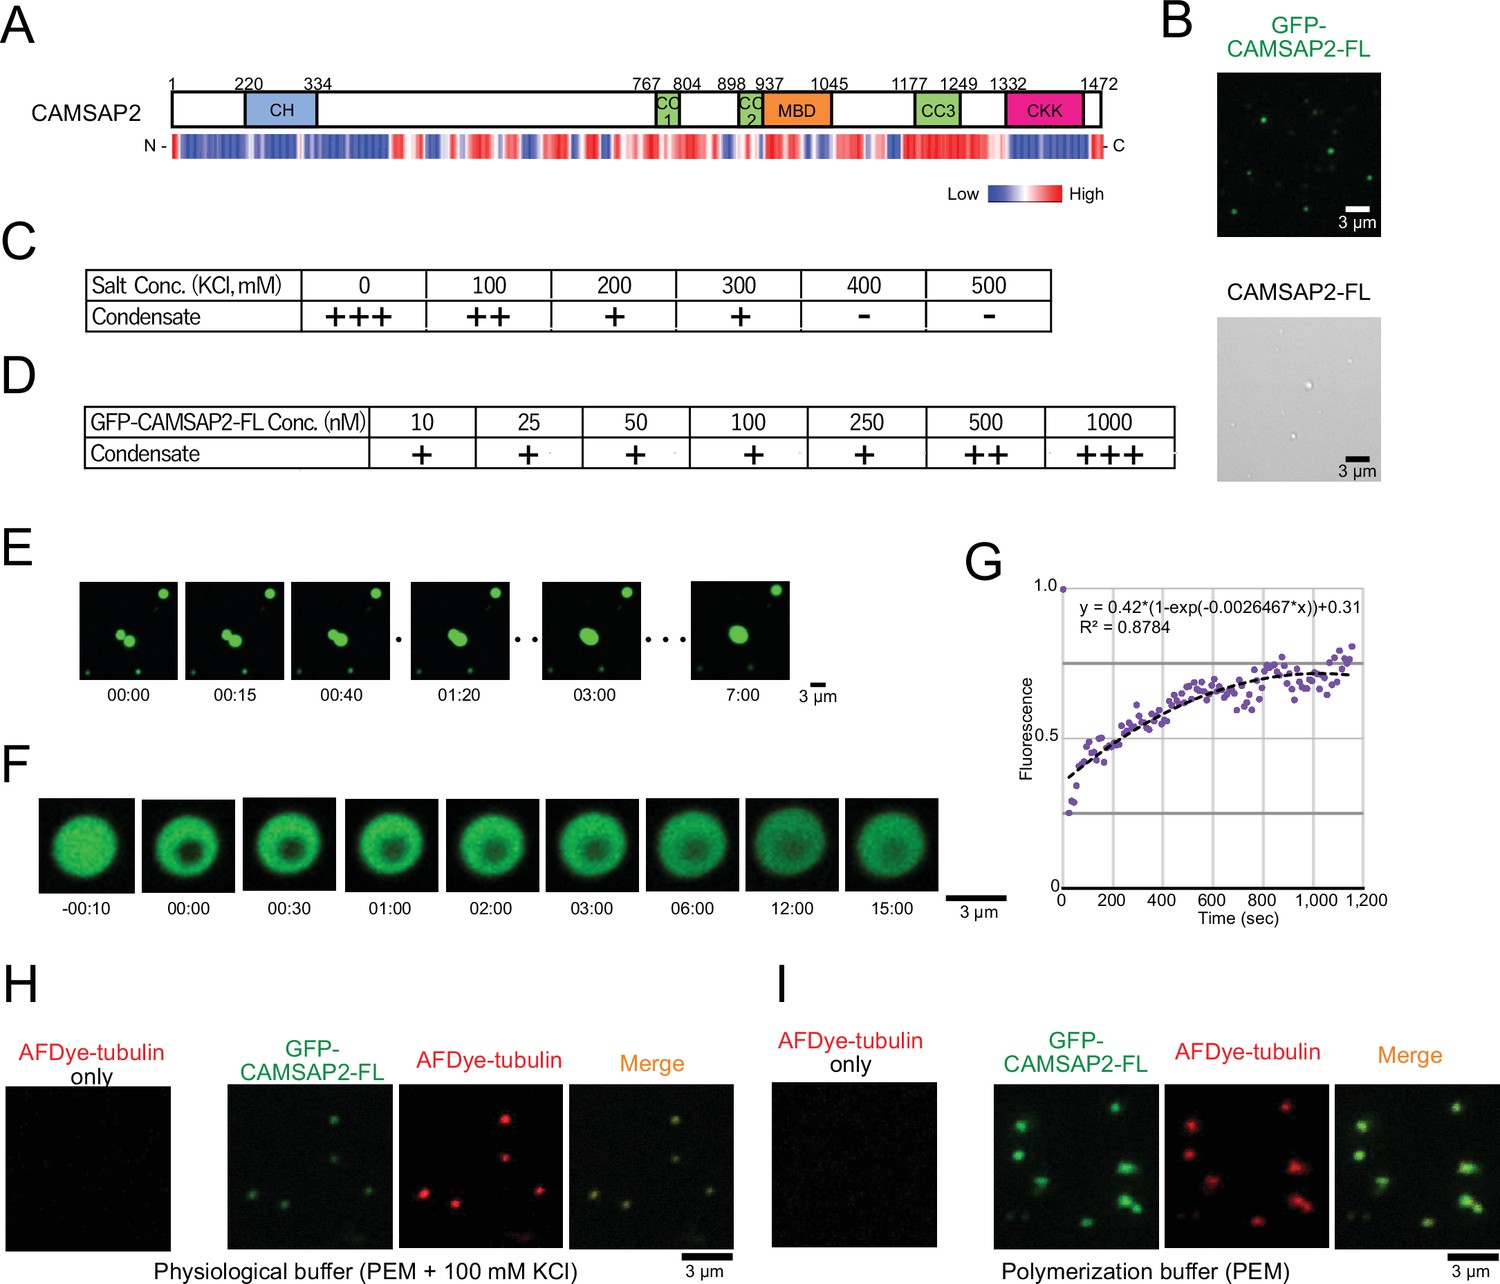
(A) Intrinsic disorder prediction of CAMSAP2 by PONDR. CH, calponin-homology domain; MBD, microtubule-binding domain; CC, coiled-coil domain; CKK, C-terminal domain common to CAMSAP1 and two other mammalian proteins, KIAA1078 and KIAA1543. (B) Fluorescent image of GFP-CAMSAP2-FL condensates (top) and DIC image of CAMSAP2-FL condensates (bottom). (C, D) Phase diagram of 1 µM GFP-CAMSAP2-FL with indicated salt concentrations (C) and different concentrations of GFP-CAMSAP2-FL with 100 mM KCl (D). (E) Fusion of the GFP-CAMSAP2-FL condensate (also see Video 1). (F) Fluorescence recovery after photobleaching of GFP-CAMSAP2-FL condensates, acquired via confocal microscopy and (G) quantification. Time 00:00 (minutes:seconds) corresponds immediately after photobleaching. The graph shows the fluorescence recovery process of one of the four quantified droplets in Figure 3—figure supplement 1. (H) (I) GFP-CAMSAP2-FL and tubulin formed co-condensate in the physiological buffer (PEM with 100 mM KCl) and microtubule polymerization buffer (PEM).
-
Figure 3—source data 1
Quantification of the fluorescence recovery after photobleaching of GFP-calmodulin-regulated spectrin-associated protein 2-FL condensates, acquired via confocal microscopy.
- https://cdn.elifesciences.org/articles/77365/elife-77365-fig3-data1-v1.docx
Figure 3—figure supplement 1
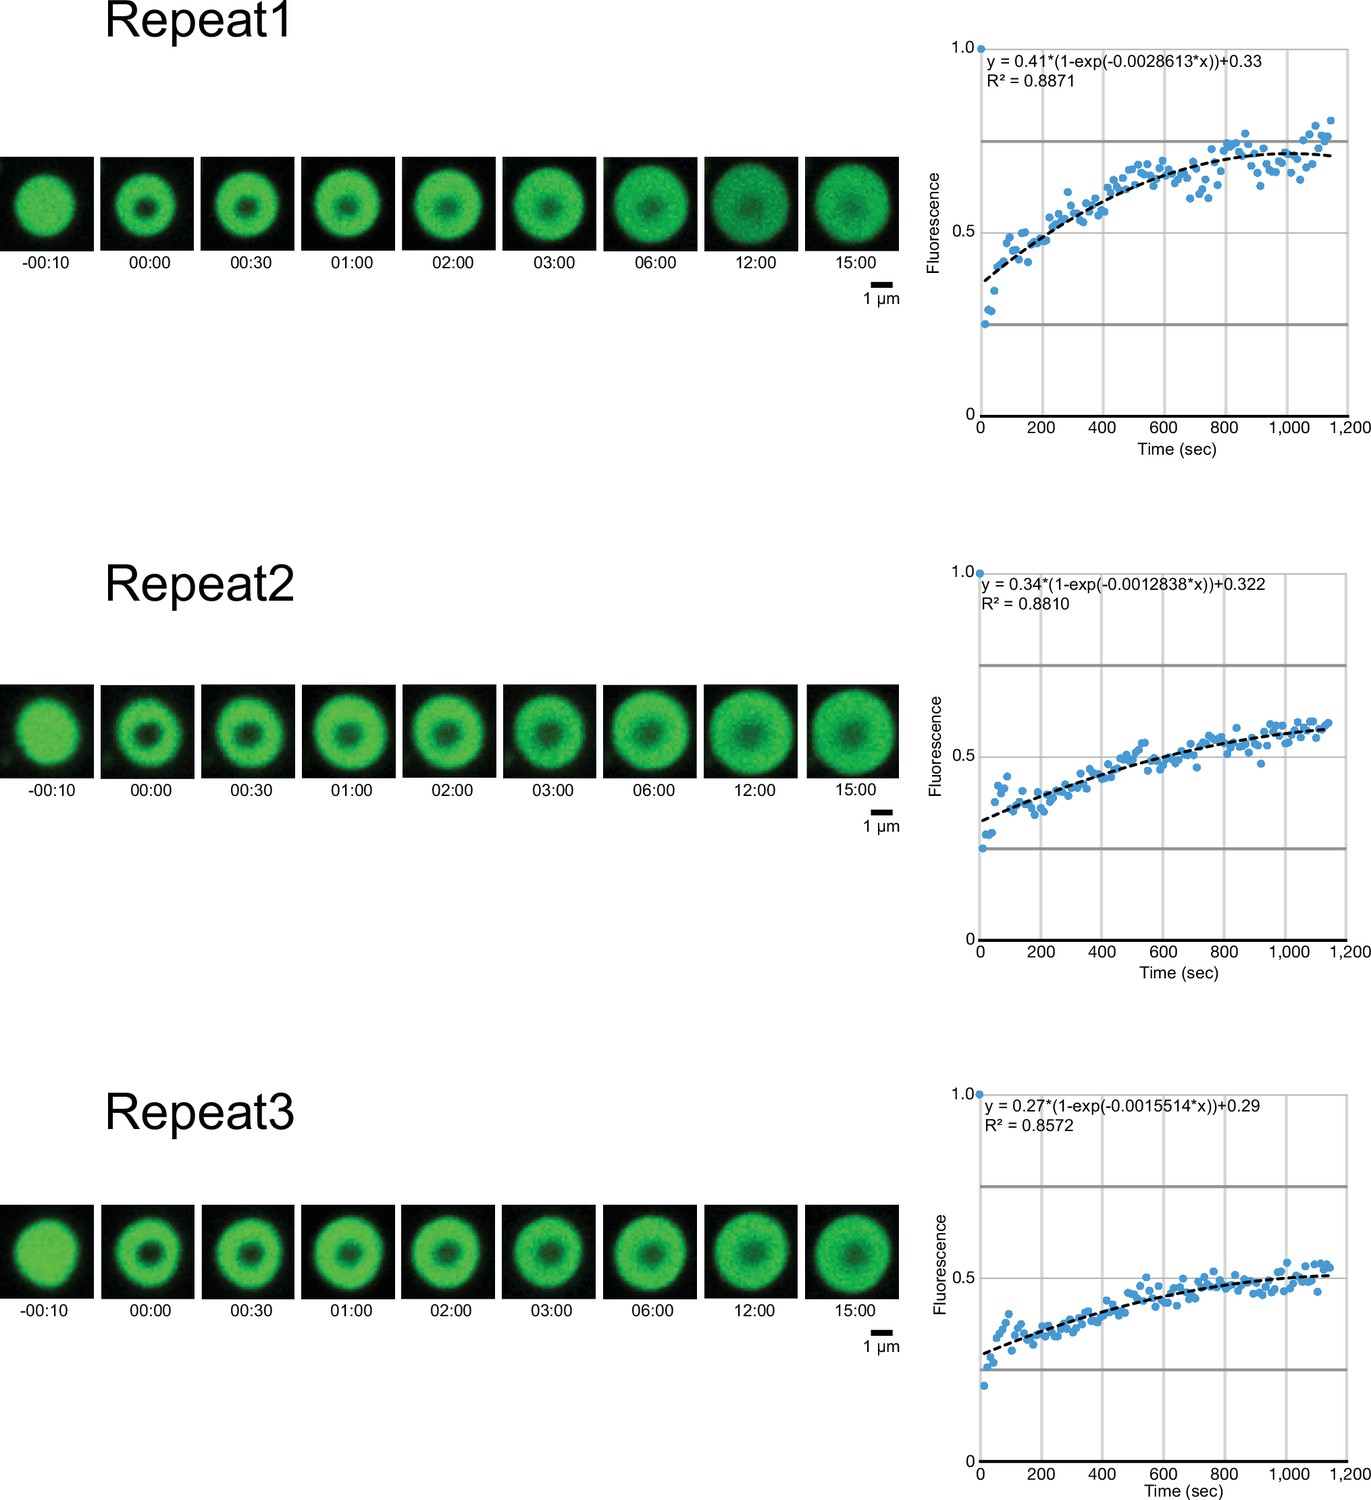
Three different measurements of fluorescence recovery after photobleaching of GFP-calmodulin-regulated spectrin-associated protein 2-FL condensates, acquired via confocal microscopy and quantification.
-
Figure 3—figure supplement 1—source data 1
Quantification of the fluorescence recovery after photobleaching of GFP-calmodulin-regulated spectrin-associated protein 2-FL condensates, acquired via confocal microscopy.
- https://cdn.elifesciences.org/articles/77365/elife-77365-fig3-figsupp1-data1-v1.pdf
Figure 4 with 1 supplement
Tubulin is incorporated into calmodulin-regulated spectrin-associated protein 2 (CAMSAP2) condensates to form aster-like structure.
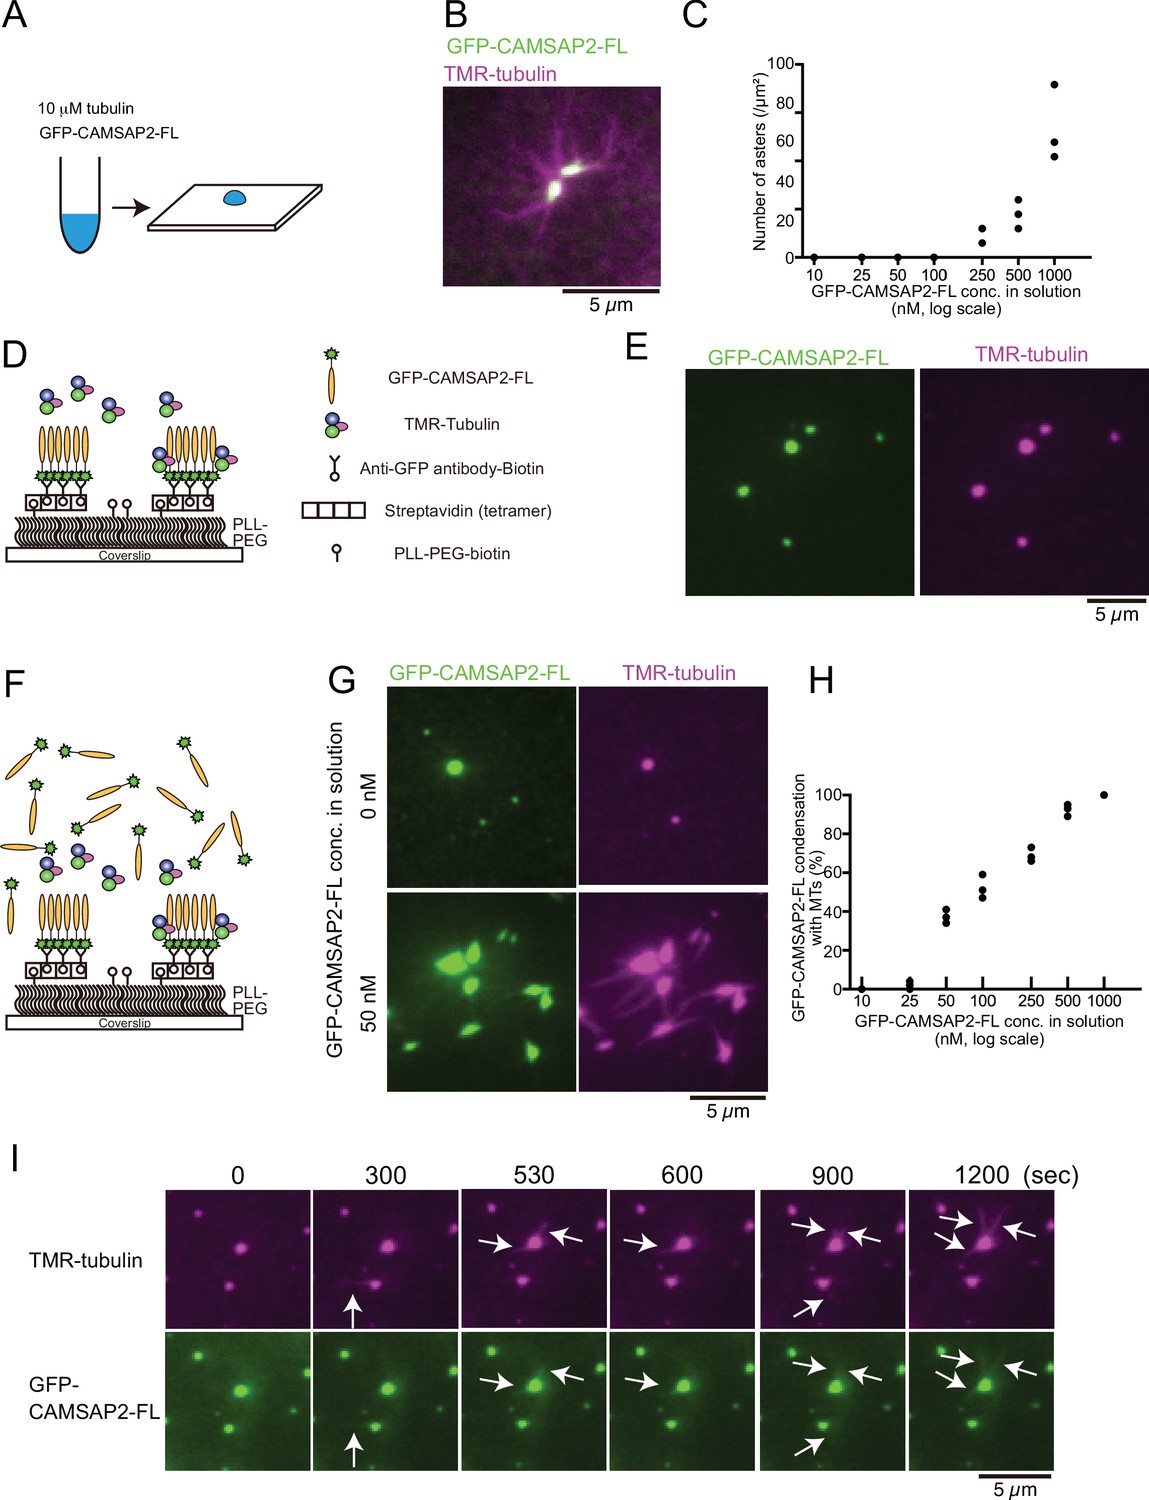
(A) The procedure used to obtain the data in panels (B) and (C). GFP-CAMSAP2-FL, 10 μM tubulin, and 0.5 μM tetramethylrhodamine (TMR)-tubulin were mixed in BRB80 supplemented with 100 mM KCl and incubated for 10 min at 37°C. The solution was directly transferred onto a coverslip and observed by fluorescence microscopy. (B) Representative image of asters. GFP-CAMSAP2-FL (0.5 μM), tubulin (10 μM), and TMR-tubulin (0.5 μM) were co-incubated. (C) Quantification of the numbers of asters in solutions containing 10 μM tubulin, 0.5 μM TMR-tubulin, and 10, 25, 50, 100, 250, 500, and 1000 nM GFP-CAMSAP2-FL. The results of three independent assays are shown with dots. (D) Schematic showing reconstitution of CAMSAP2-containing foci. CAMSAP2 condensates were formed as described in Figure 3 and fixed on the coverslip by an anti-GFP antibody. (E) Soluble tubulins were incorporated into CAMSAP2 condensates within 1 min. (F) Schematic showing CAMSAP2-containing foci with soluble tubulin and GFP-CAMSAP2-FL. (G) CAMSAP2 in solution induced aster formation from CAMSAP2 condensates in a dose-dependent manner. Representative images for 0 and 50 nM GFP-CAMSAP2-FL are shown. (H) Quantification of microtubule formation from CAMSAP2 condensates. The percentages of CAMSAP2 condensates with microtubules among total CAMSAP2 condensates are shown. Each dot shows the results of three independent experiments. (I) Time-lapse images of aster formation. Tubulin (10 μM), TMR-tubulin (0.5 μM), and GFP-CAMSAP2-FL (50 nM) were incubated with CAMSAP2 condensates fixed on coverslips. Dynamic microtubules from CAMSAP2 condensates were observed (arrows). The scale bars indicate 5 µm. See Videos 3 and 4.
Figure 4—figure supplement 1
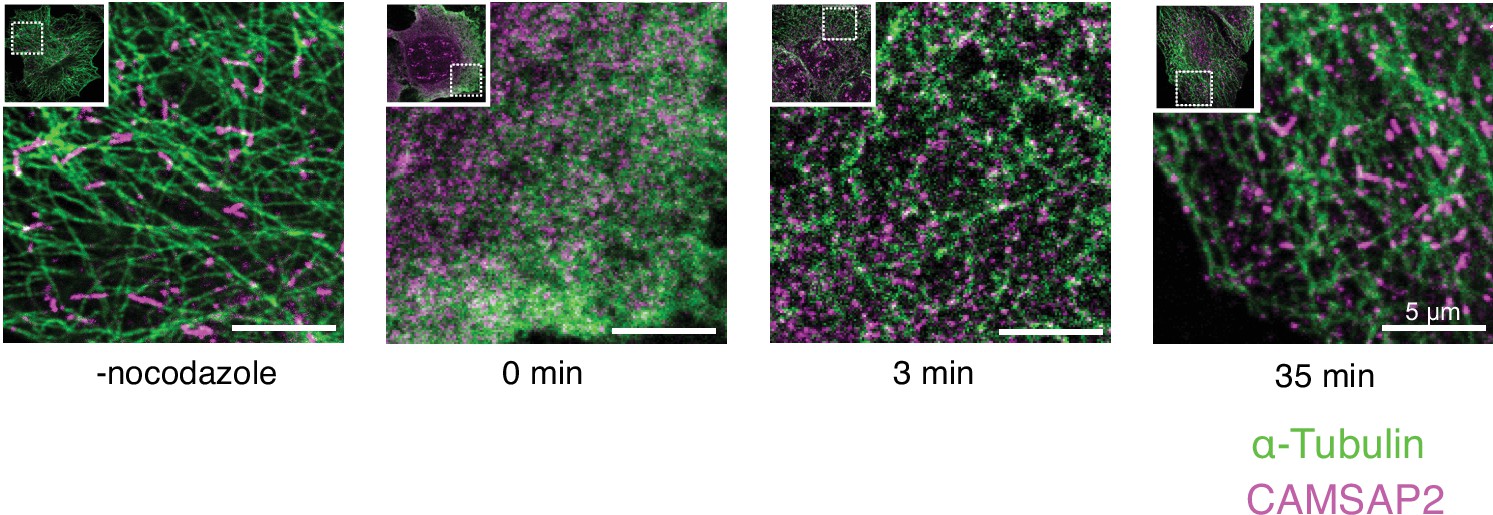
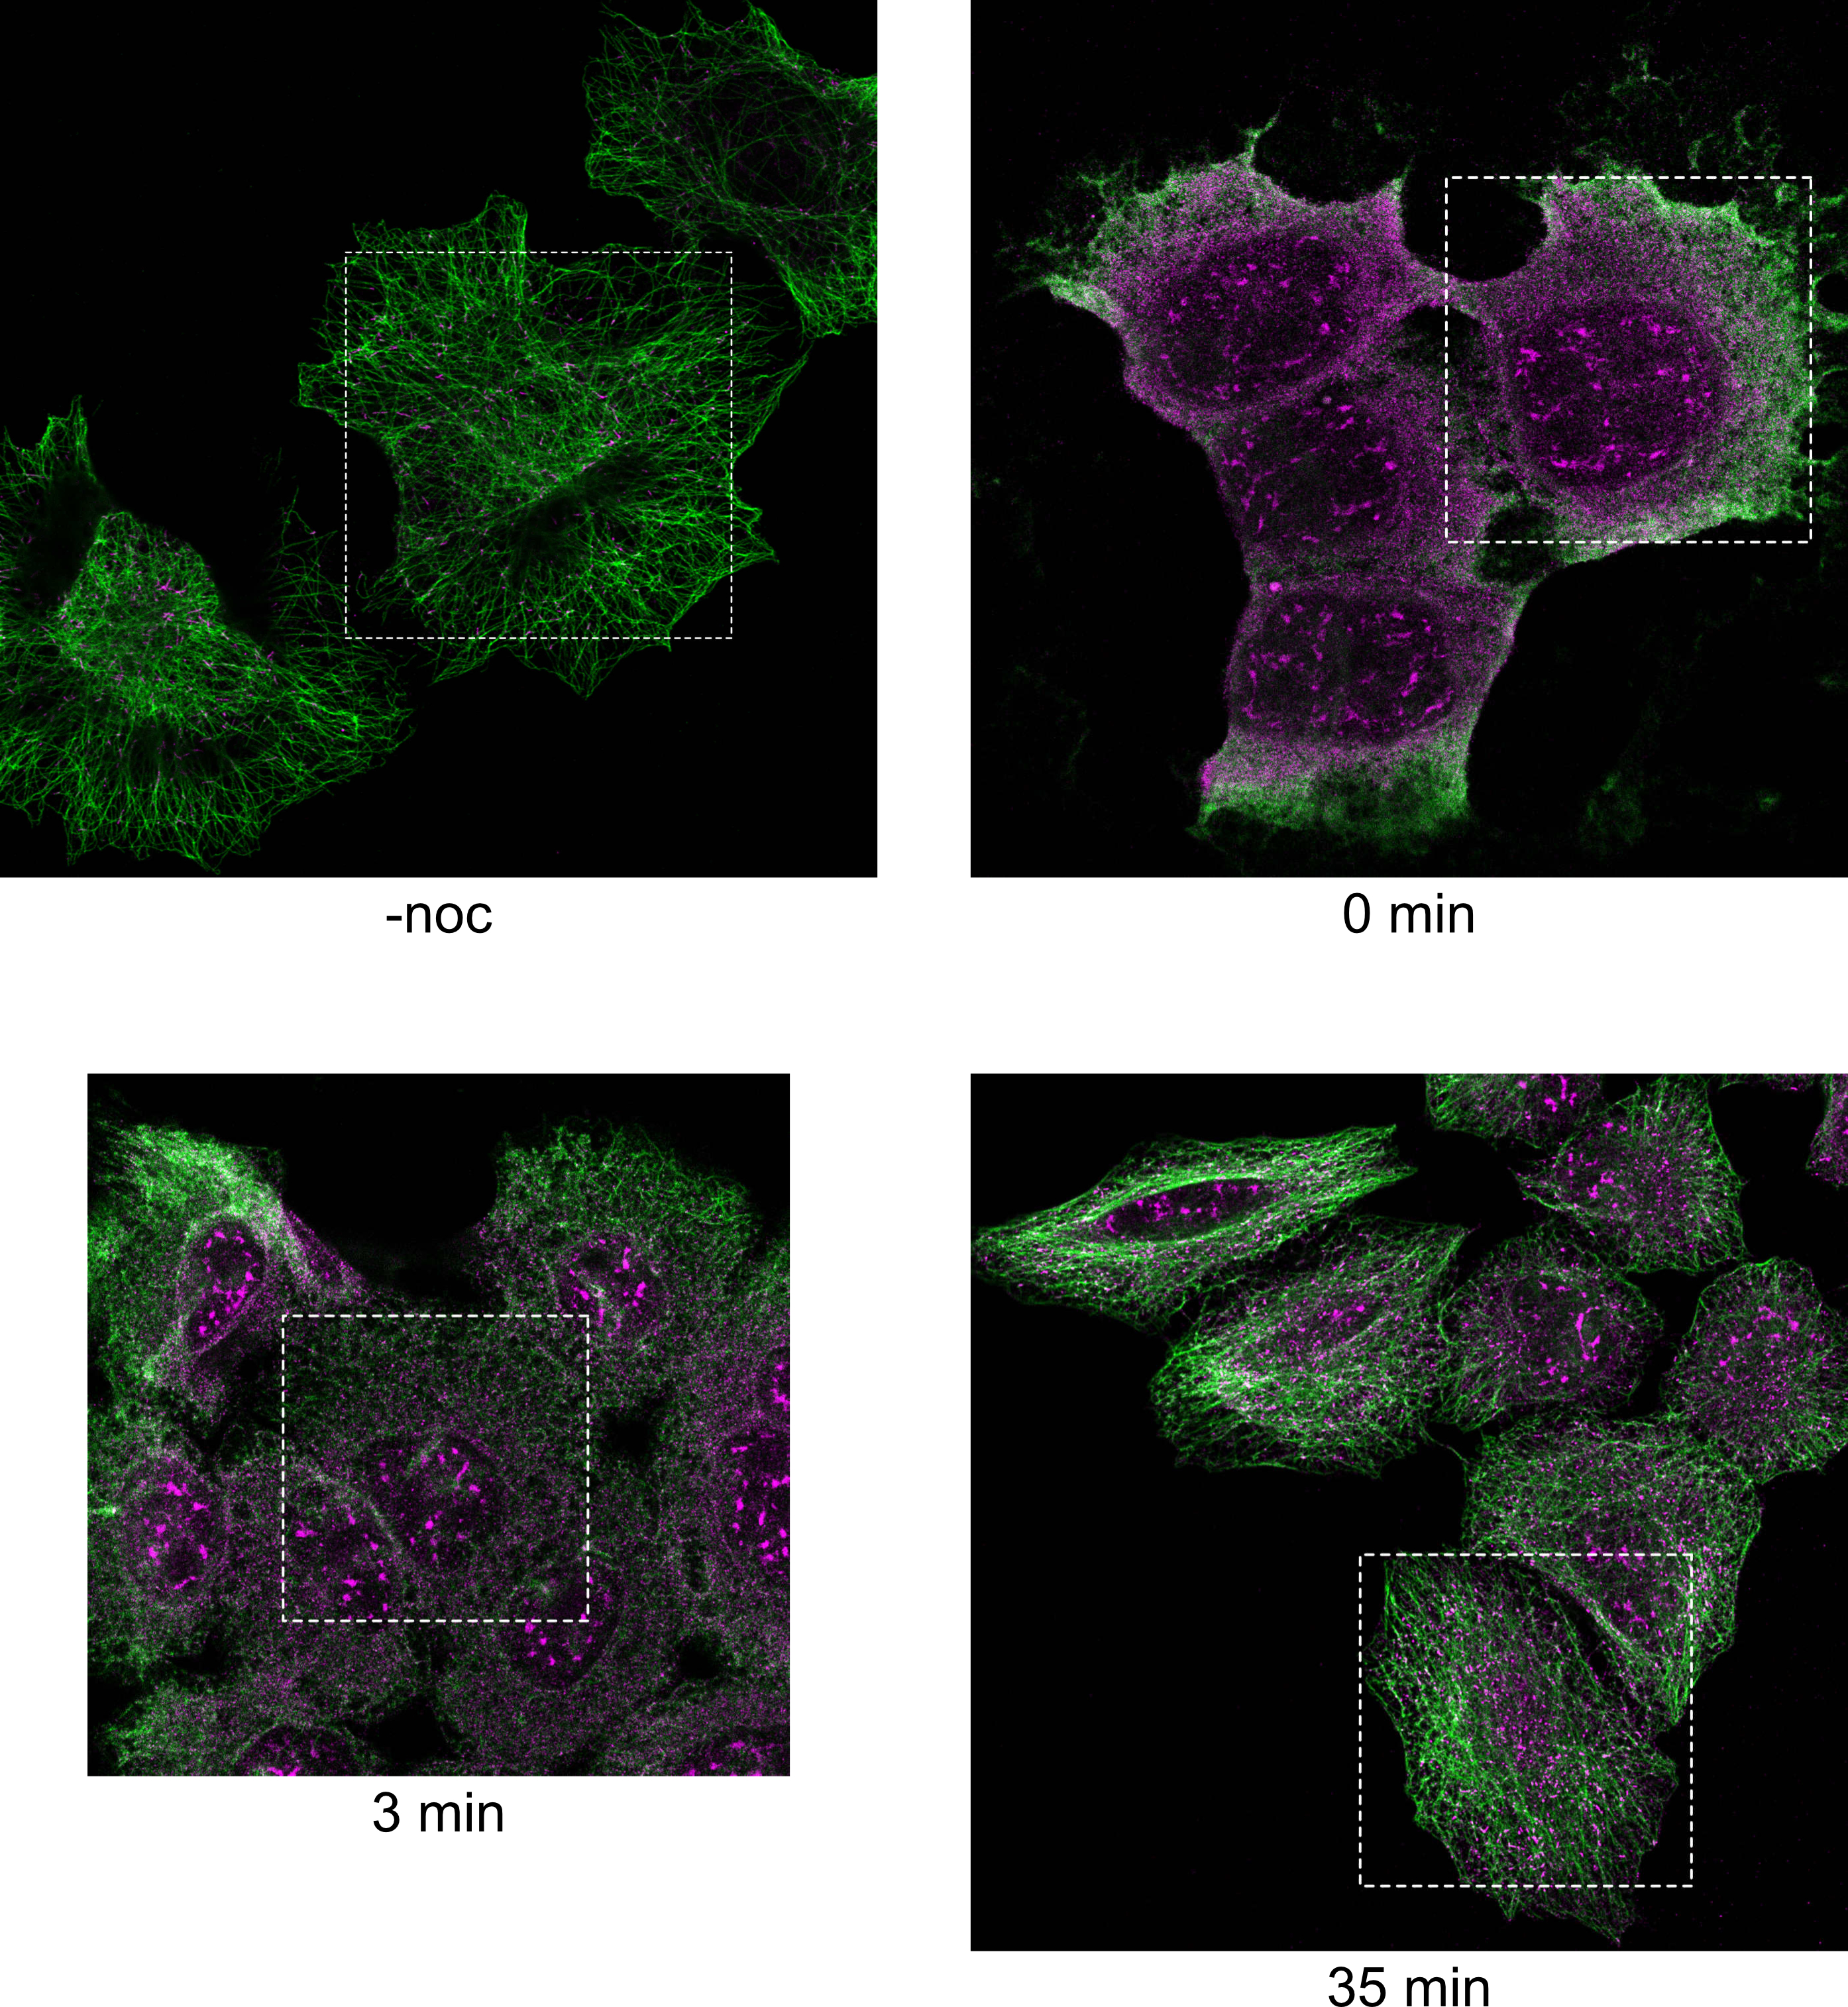
Calmodulin-regulated spectrin-associated protein 2 (CAMSAP2) localization in growing microtubule networks in HeLa cells.
Cells were monitored before nocodazole treatment (-nocodazole), just after nocodazole treatment (0 min), and 3 min and 35 min incubation at 37°C after washout. Immunostaining of intrinsic CAMSAP2 (magenta) and α-tubulin (green) in HeLa cells shows the local condensates of CAMSAP2 appeared before the initiation of microtubule polymerization. The scale bars indicate 5 µm.
-
Figure 4—figure supplement 1—source data 1
Original image of immunofluorescence visualized by a confocal laser-scanning microscope.
- https://cdn.elifesciences.org/articles/77365/elife-77365-fig4-figsupp1-data1-v1.jpg
Figure 5 with 3 supplements
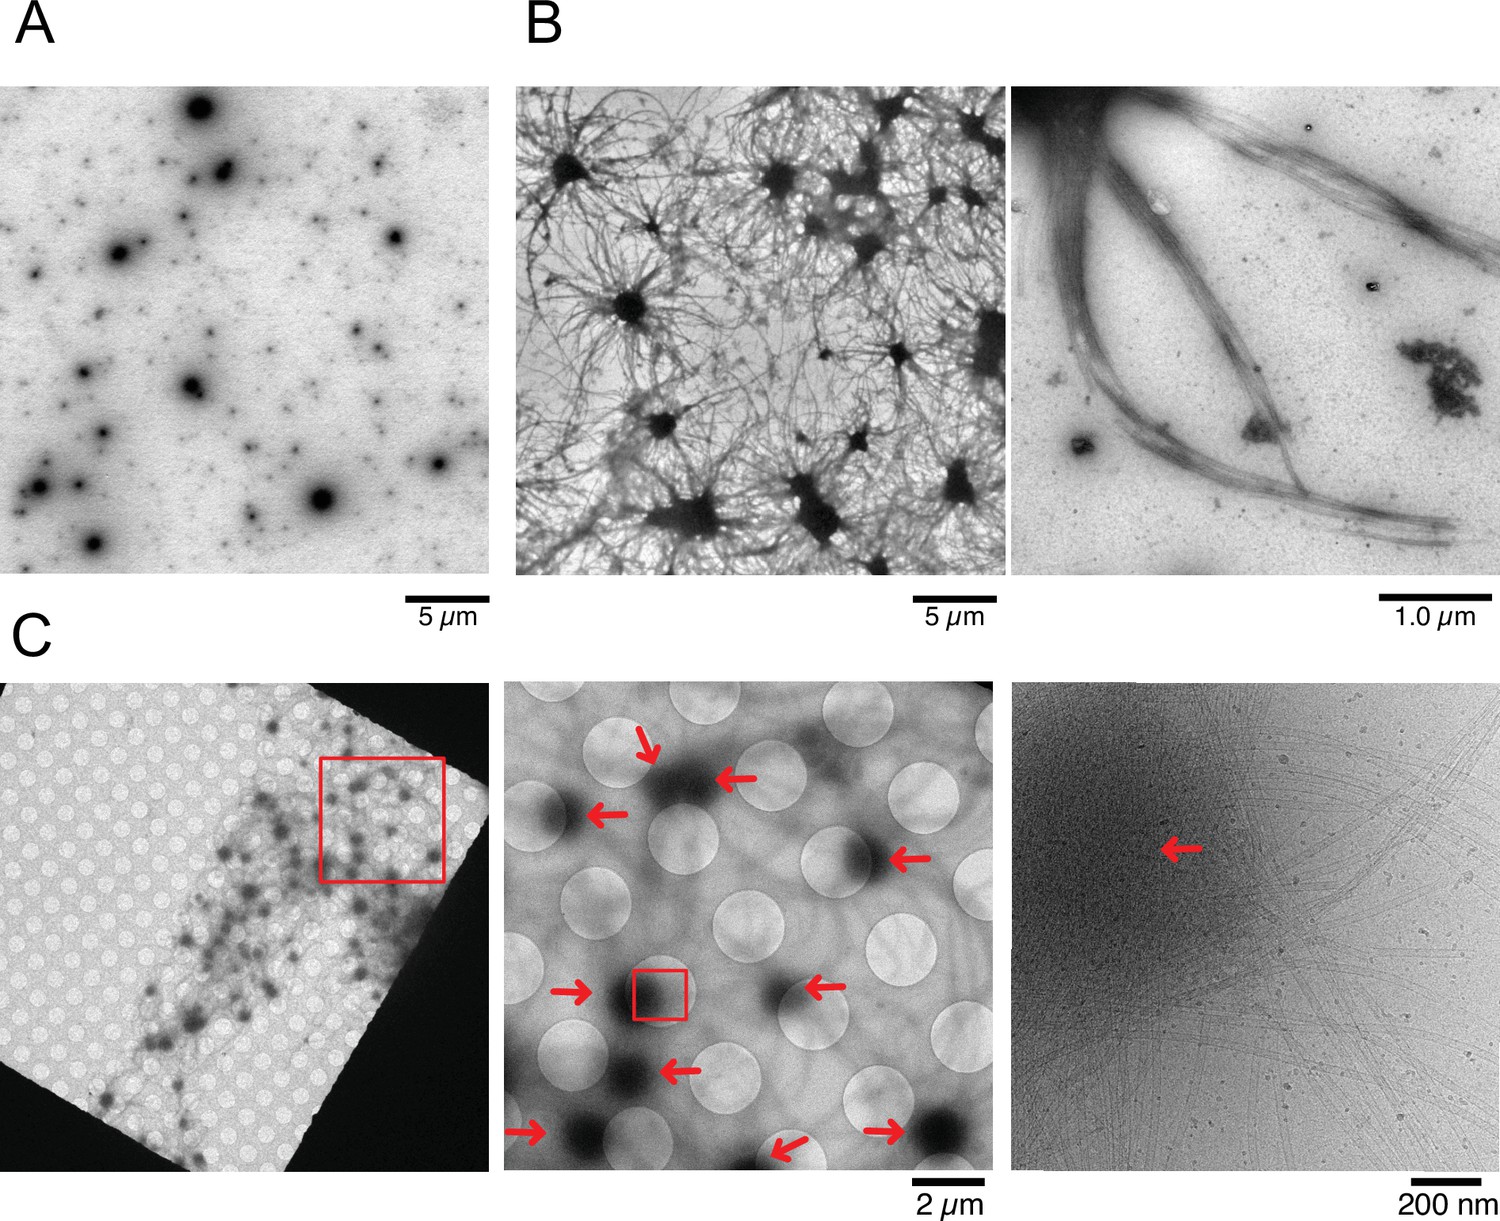
Nucleation and aster formation activity of calmodulin-regulated spectrin-associated protein 2 (CAMSAP2).
Representative electron microscopy (EM) images are shown from at least three independent assays. (A) Negative stain EM micrographs of 1 µM CAMSAP2-FL incubated at 25°C for 30 min. (B) Negative stain EM micrographs of 10 µM tubulin polymerized with 1 µM of CAMSAP2-FL after incubation at 37°C for 10 min. Aster-like microtubule structures were observed. Negative stain micrographs of tubulin with CAMSAP2-FL incubated at various conditions were also available in Figure 5—figure supplement 2. (C) Cryo-EM micrographs of 30 µM tubulin polymerized with 3 µM CAMSAP2-FL after incubation at 37°C for 10 min captured at different magnifications. Cam2-asters are indicated by the red arrows. The cryo-EM micrographs of 30 µM tubulin on ice, polymerized for 1, 3, and 10 min at 37°C are available in Figure 5—figure supplement 3.
Figure 5—figure supplement 1
Aster formation activity of recombinant calmodulin-regulated spectrin-associated protein 3 (CAMSAP3).
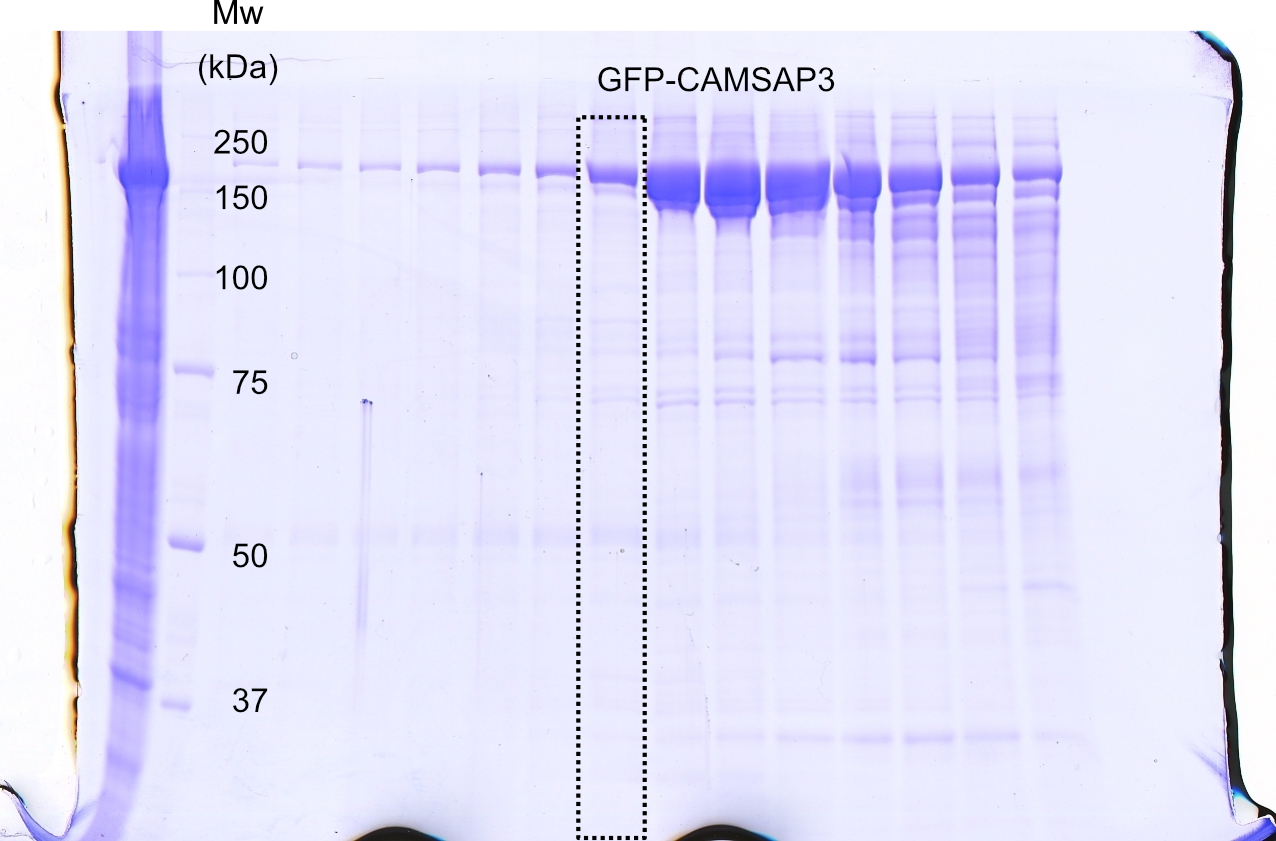
(A) Schematic representation of the GFP-fused CAMSAP3 constructs used in this study. CH, calponin-homology domain; MBD, microtubule-binding domain; CC, coiled-coil domain; CKK, C-terminal domain common to CAMSAP1 and two other mammalian proteins, KIAA1078 and KIAA1543. (B) SDS-PAGE of GFP-fused CAMSAP3. (C) Negative stain electron microscopy (EM) micrographs of 10 µM tubulin polymerized with 1 µM CAMSAP3 after incubation on ice for 30 min and 37°C for 10 min.
-
Figure 5—figure supplement 1—source data 1
SDS-PAGE gels of full-length GFP-CAMSAP3.
- https://cdn.elifesciences.org/articles/77365/elife-77365-fig5-figsupp1-data1-v1.jpg
Figure 5—figure supplement 2
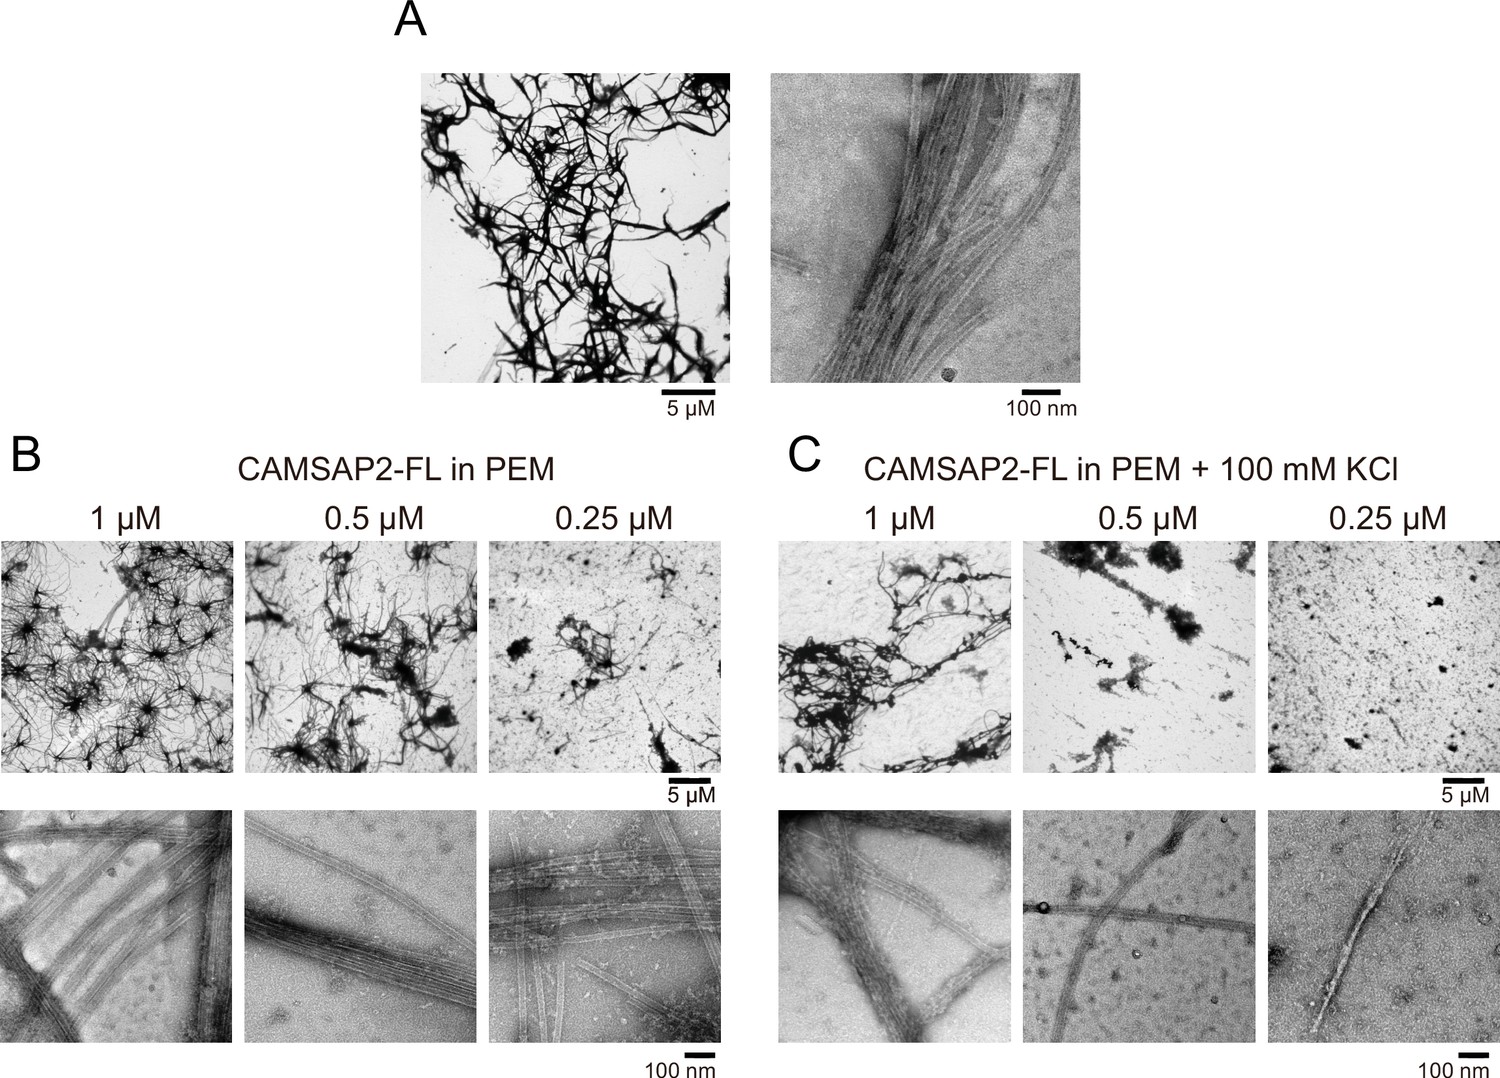
Nucleation and aster formation activity of calmodulin-regulated spectrin-associated protein 2 (CAMSAP2).
(A) Negative stain images of 2 µM tubulin polymerized with 1 µM of CAMSAP2-FL after incubation at 37°C for 30 min in PEM. (B) Negative stain images of 10 µM tubulin polymerized with different concentrations of CAMSAP2-FL after incubation at 37°C for 30 min in PEM with 100 mM KCl. (C) Negative stain image of 10 µM tubulin polymerized with different concentrations of CAMSAP2-FL after incubation at 37°C for 30 min in PEM with 100 mM KCl.
Figure 5—figure supplement 3
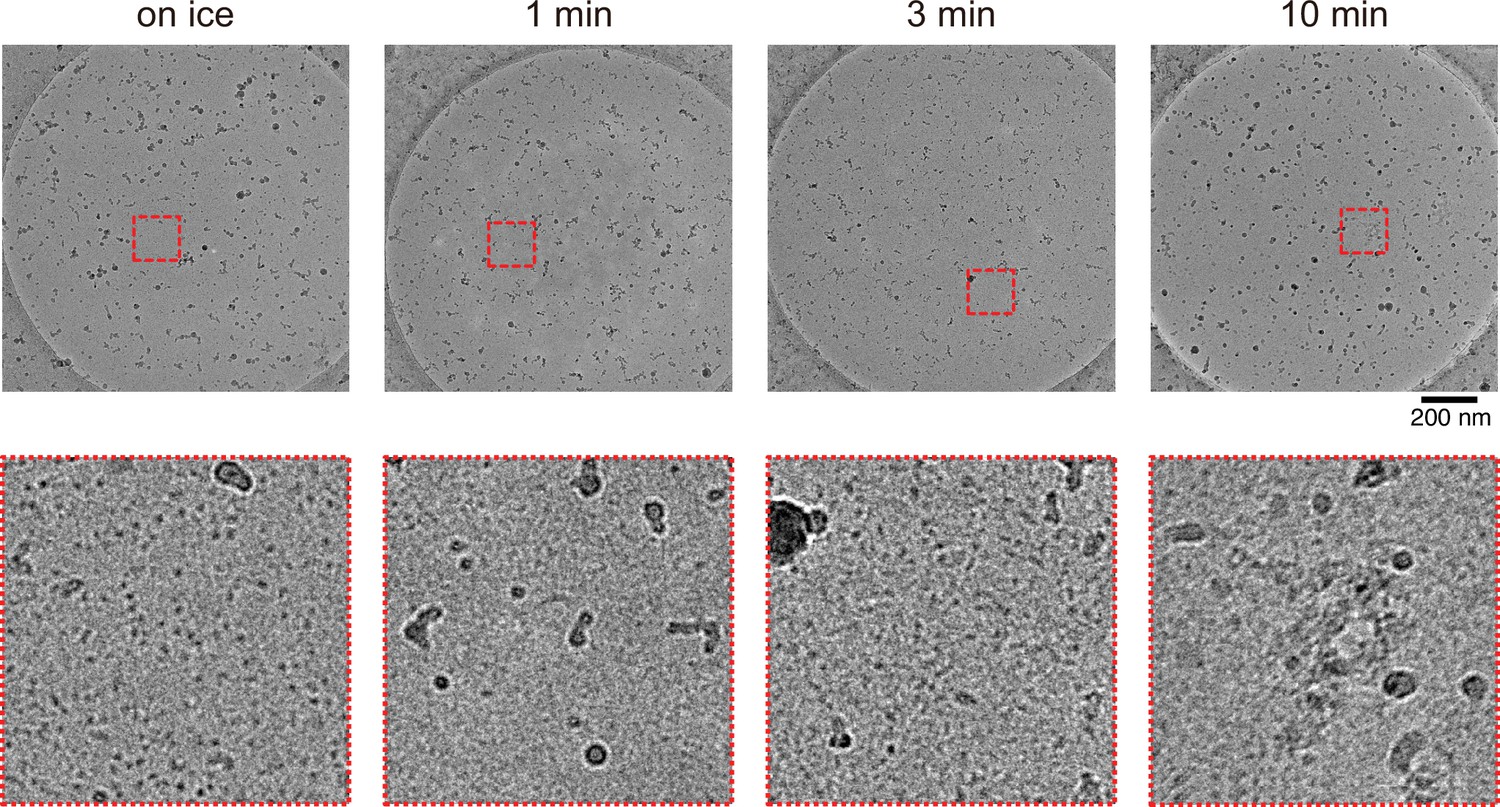
The cryo-electron microscopy micrographs of 30 µM tubulin at different conditions.
No microtubule was observed. (Left) 30 µM tubulin preserved on ice for 30 min. (Middle left) Incubated for 1 min, (Middle right) 3 min, and (Right) 10 min at 37°C after 10 min on ice incubation. The bottom micrographs are closed-up views of red dotted areas indicated in the top micrographs.
Figure 6 with 3 supplements
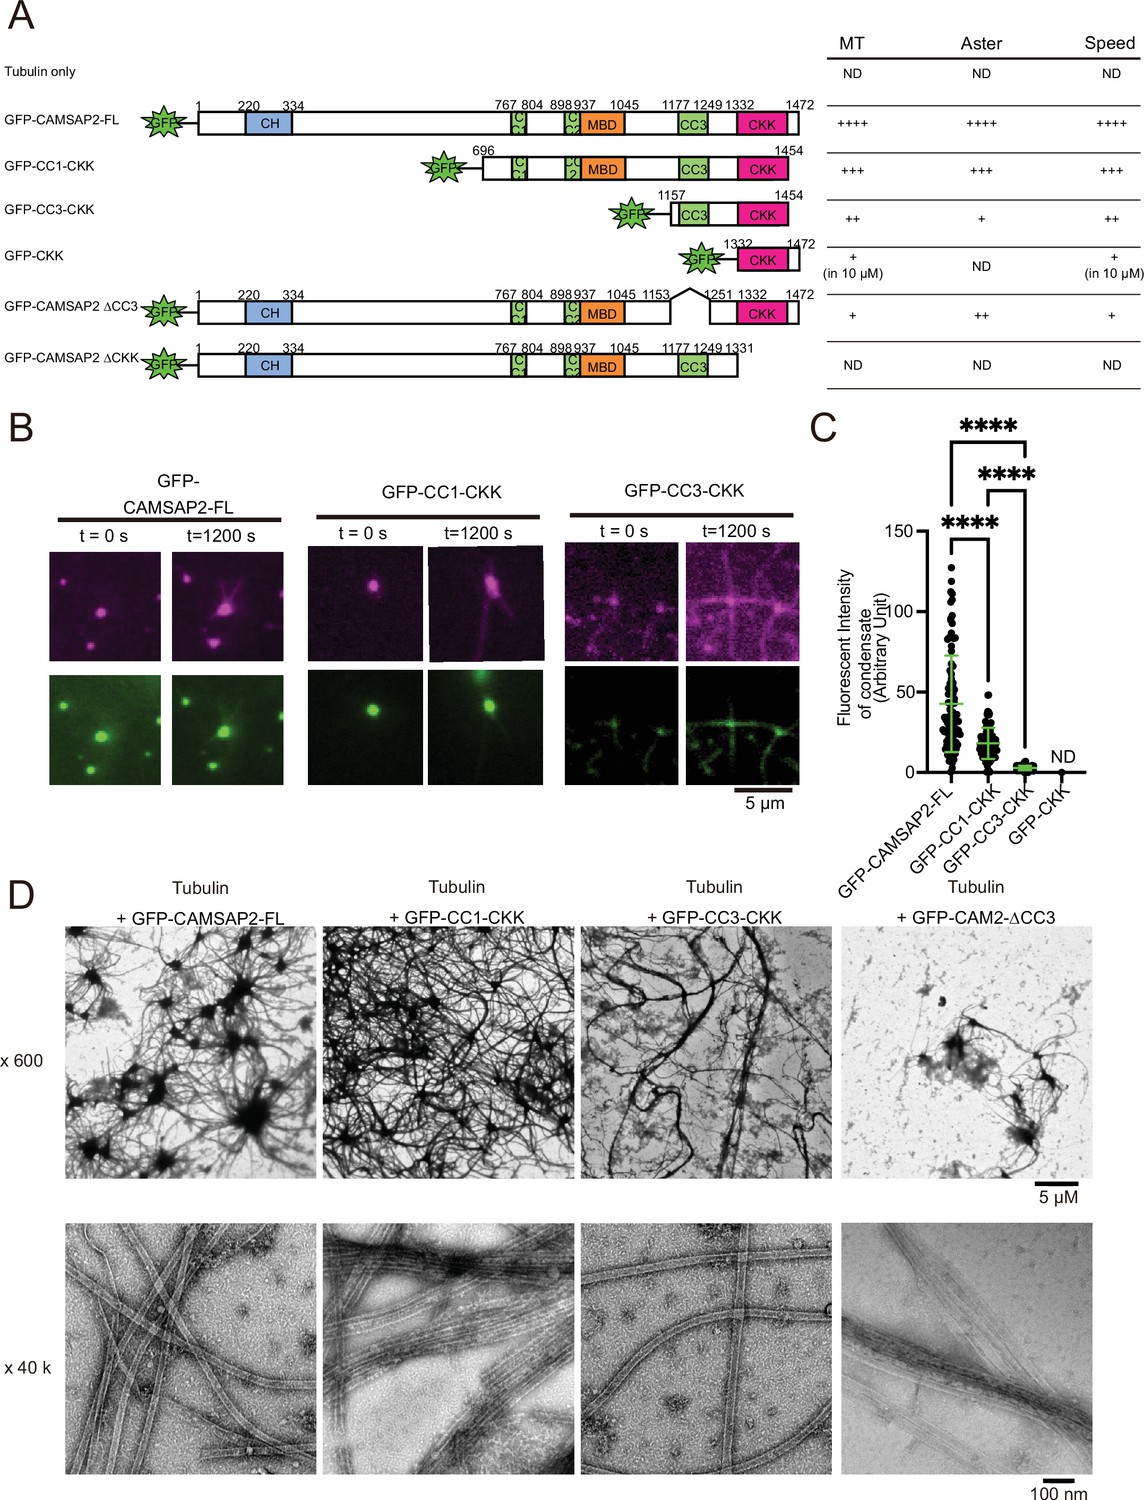
Functional domain mapping of the microtubule nucleation and aster formation activity of calmodulin-regulated spectrin-associated protein 2 (CAMSAP2).
(A) Microtubule nucleation and aster formation activities of CAMSAP2 deletion constructs evaluated by the results of 10 µM tubulin with 1 µM CAMSAP2. The number of ‘+’ symbols indicates the strength of the activity (++++, strongest; +, weakest; ND, not detected). Size exclusion chromatography and SDS-PAGE of GFP fused constructs are available in Figure 6—figure supplement 1. CH, calponin-homology domain; MBD, microtubule-binding domain; CC, coiled-coil domain; CKK, C-terminal domain common to CAMSAP1 and two other mammalian proteins, KIAA1078 and KIAA1543. (B) Microtubule growth from CAMSAP2 condensates composed of full-length and deletion constructs. In vitro reconstitution was performed as described in Figure 4I. (C) Fluorescent intensity of CAMSAP2 condensates at 0 s. ND means that the fluorescent intensity of condensates could not be measured because GFP-CKK did not induce any condensates. Ordinary one-way ANOVA followed by Tukey’s multiple comparisons test. ****, p<0.0001. n=100 condensates from three independent preparations. (D) Negative stain EM images of polymerization by 10 µM tubulin with 1 µM GFP-CAMSAP2-FL or 1 µM CAMSAP2 mutants during 10 min of incubation at 37°C. The results for tubulin alone and GFP-CKK are available in Figure 6—figure supplement 3. Representative EM images are shown from at least three independent assays.
-
Figure 6—source data 1
Quantifications of fluorescent intensity of calmodulin-regulated spectrin-associated protein 2 condensates at 0 s.
- https://cdn.elifesciences.org/articles/77365/elife-77365-fig6-data1-v1.pdf
Figure 6—figure supplement 1
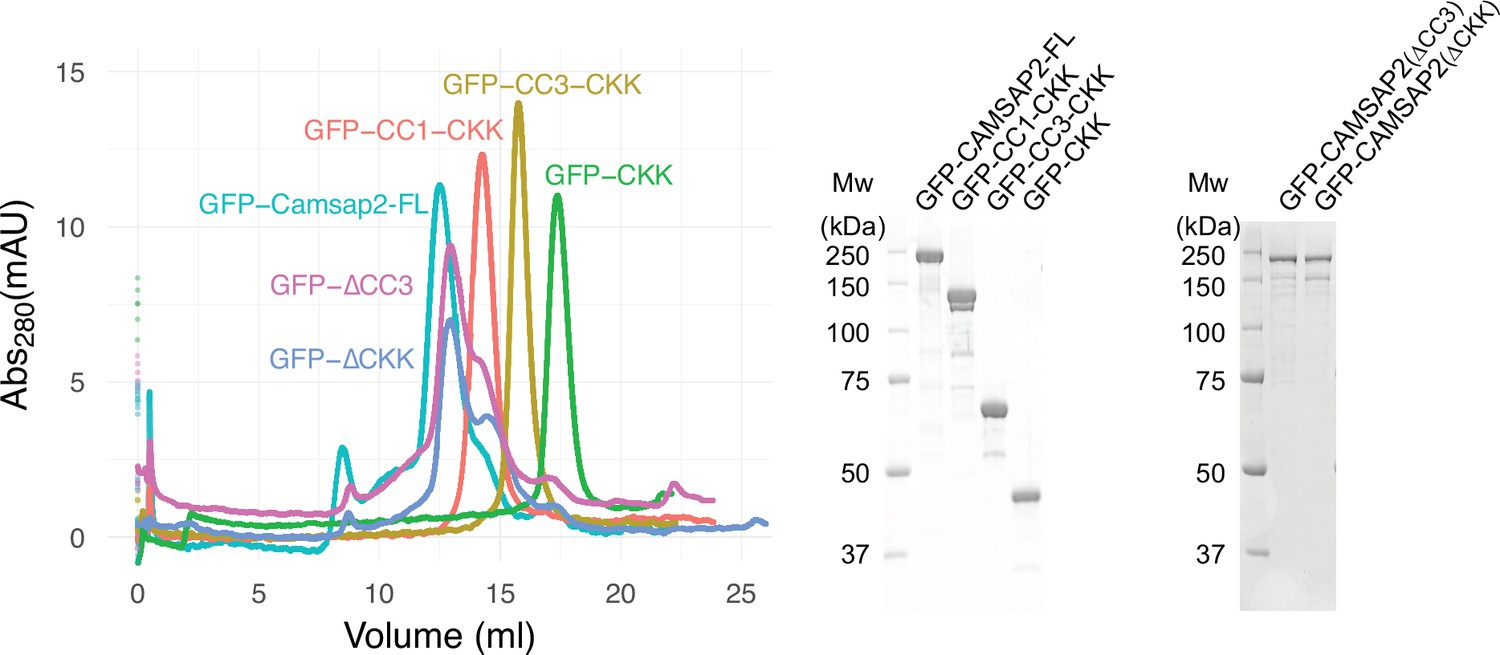
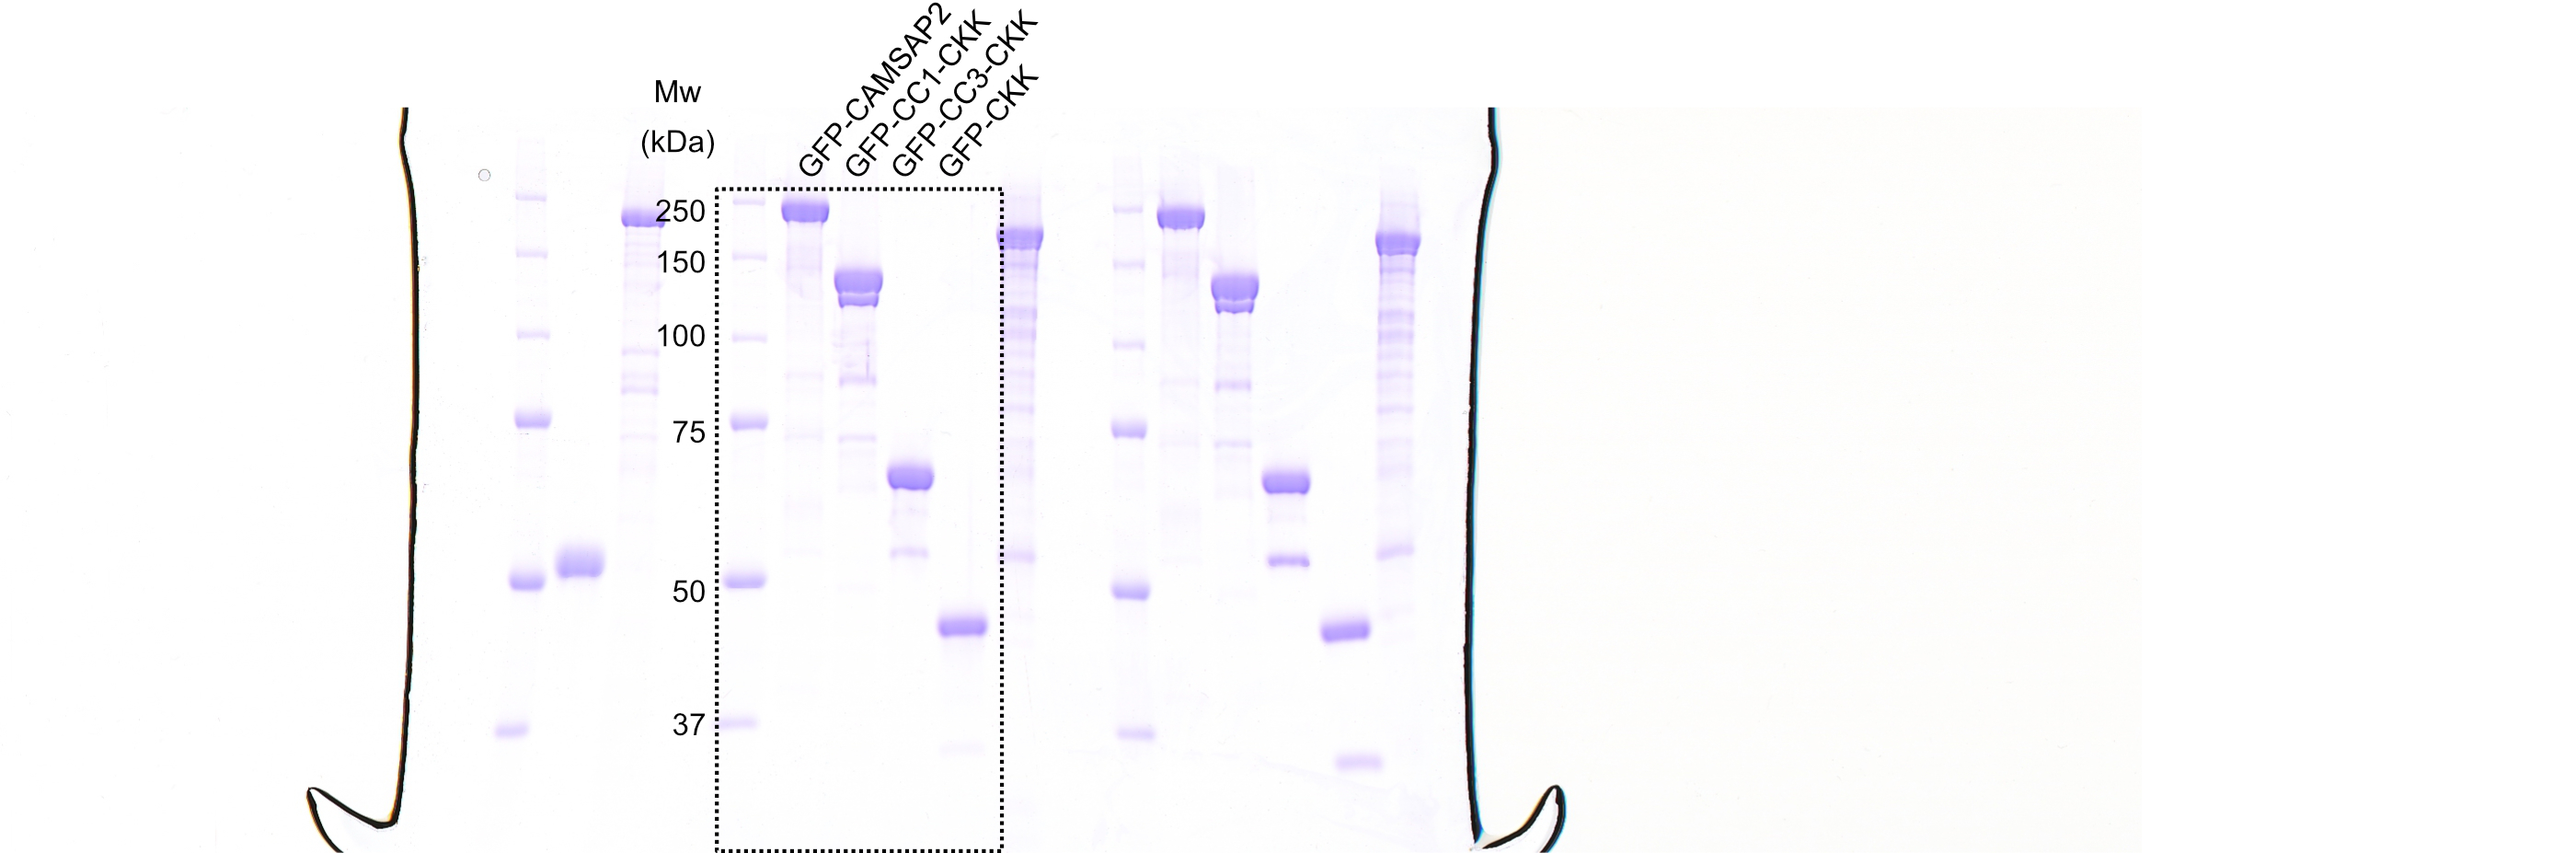
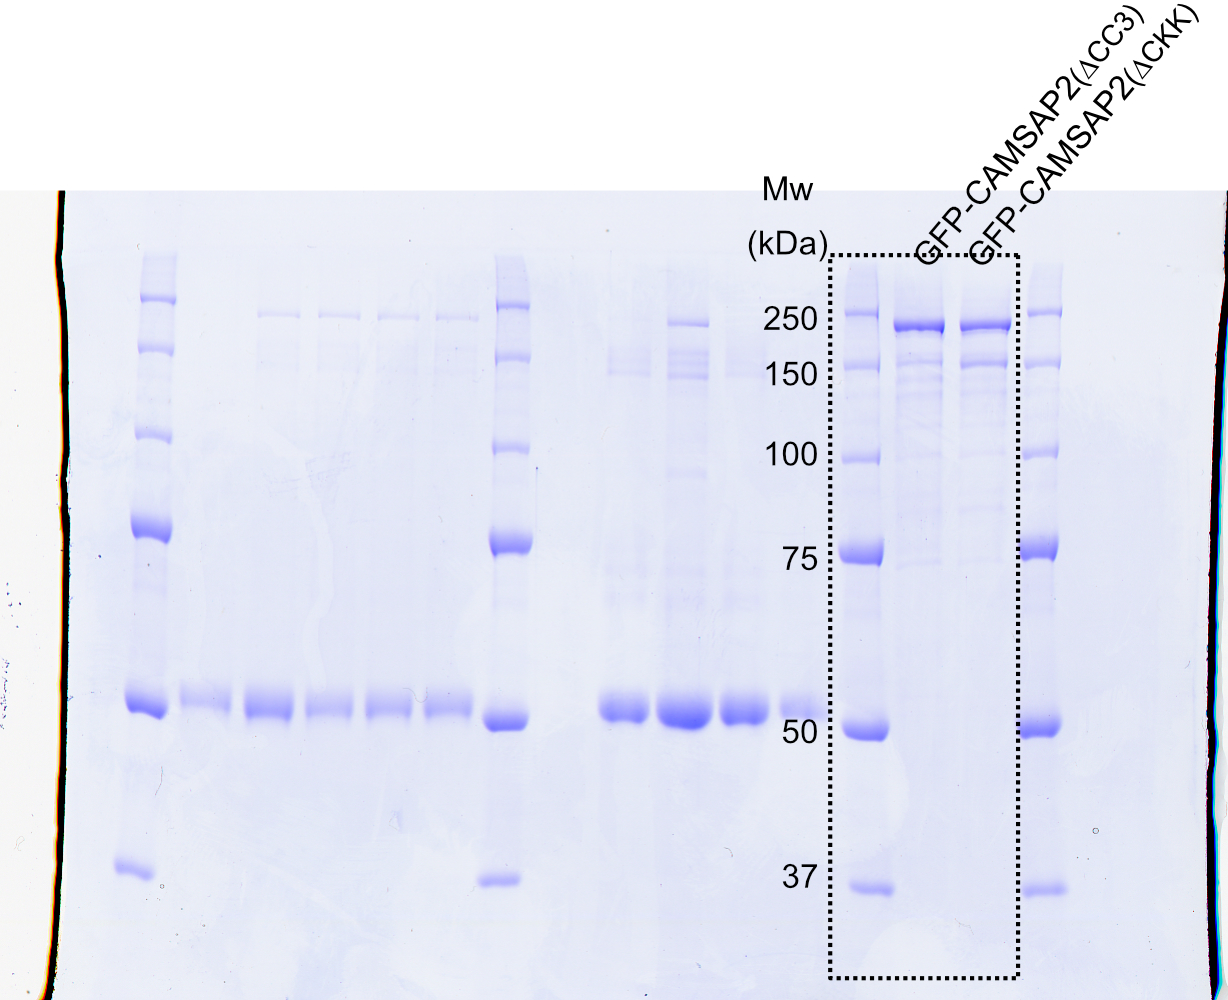
GFP fused calmodulin-regulated spectrin-associated protein 2 (CAMSAP2) constructs used in this study.
Size exclusion chromatography of GFP-CAMSAP2-FL (turquoise green), GFP-CC1-CKK (orange), GFP-CC3-CKK (yellow), GFP-CAMSAP2 ∆CC3 (magenta), GFP-CAMSAP2 ∆CKK (blue), and GFP-CKK (green). The peaks of each sample were subjected to SDS-PAGE.
-
Figure 6—figure supplement 1—source data 1
SDS-PAGE gel of calmodulin-regulated spectrin-associated protein 2 deletion constructs.
- https://cdn.elifesciences.org/articles/77365/elife-77365-fig6-figsupp1-data1-v1.jpg
-
Figure 6—figure supplement 1—source data 2
SDS-PAGE gel of calmodulin-regulated spectrin-associated protein 2 deletion constructs.
- https://cdn.elifesciences.org/articles/77365/elife-77365-fig6-figsupp1-data2-v1.jpg
Figure 6—figure supplement 2
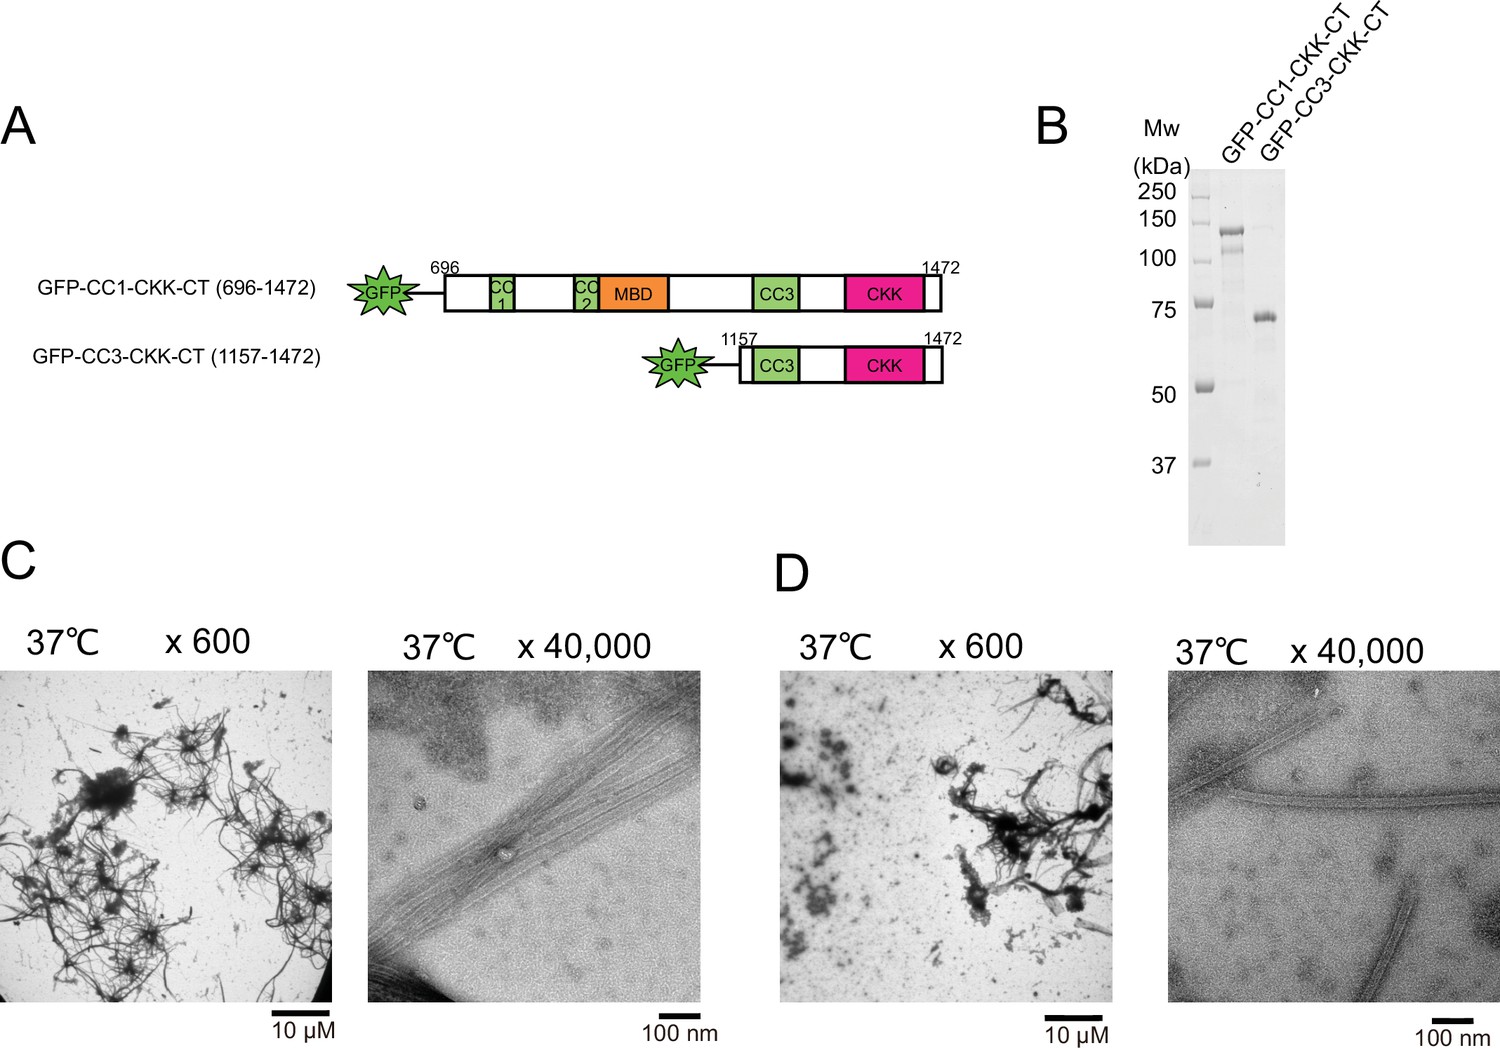
Functional domain mapping of the microtubule nucleation and aster formation activity of calmodulin-regulated spectrin-associated protein 2 (CAMSAP2) deletion mutants.
(A) Schematic representation of the GFP fused CAMSAP2 deletion constructs. CH, calponin-homology domain; MBD, microtubule-binding domain; CC, coiled-coil domain; CKK, C-terminal domain common to CAMSAP1 and two other mammalian proteins, KIAA1078 and KIAA1543. (B) SDS-PAGE of the CAMSAP2 deletion constructs. (C) Negative stain electron microscopy (EM) micrographs of 10 µM tubulin polymerized with 1 µM of GFP-CC1-CKK-CT after incubation on ice for 30 min and 37°C for 10 min. (D) Negative stain EM micrographs of 10 µM tubulin polymerized with 1 µM of GFP-CC3-CKK-CT after incubation on ice for 30 min and 37°C for 10 min.
-
Figure 6—figure supplement 2—source data 1
SDS-PAGE gel of calmodulin-regulated spectrin-associated protein 2 deletion constructs.
- https://cdn.elifesciences.org/articles/77365/elife-77365-fig6-figsupp2-data1-v1.jpg
Figure 6—figure supplement 3
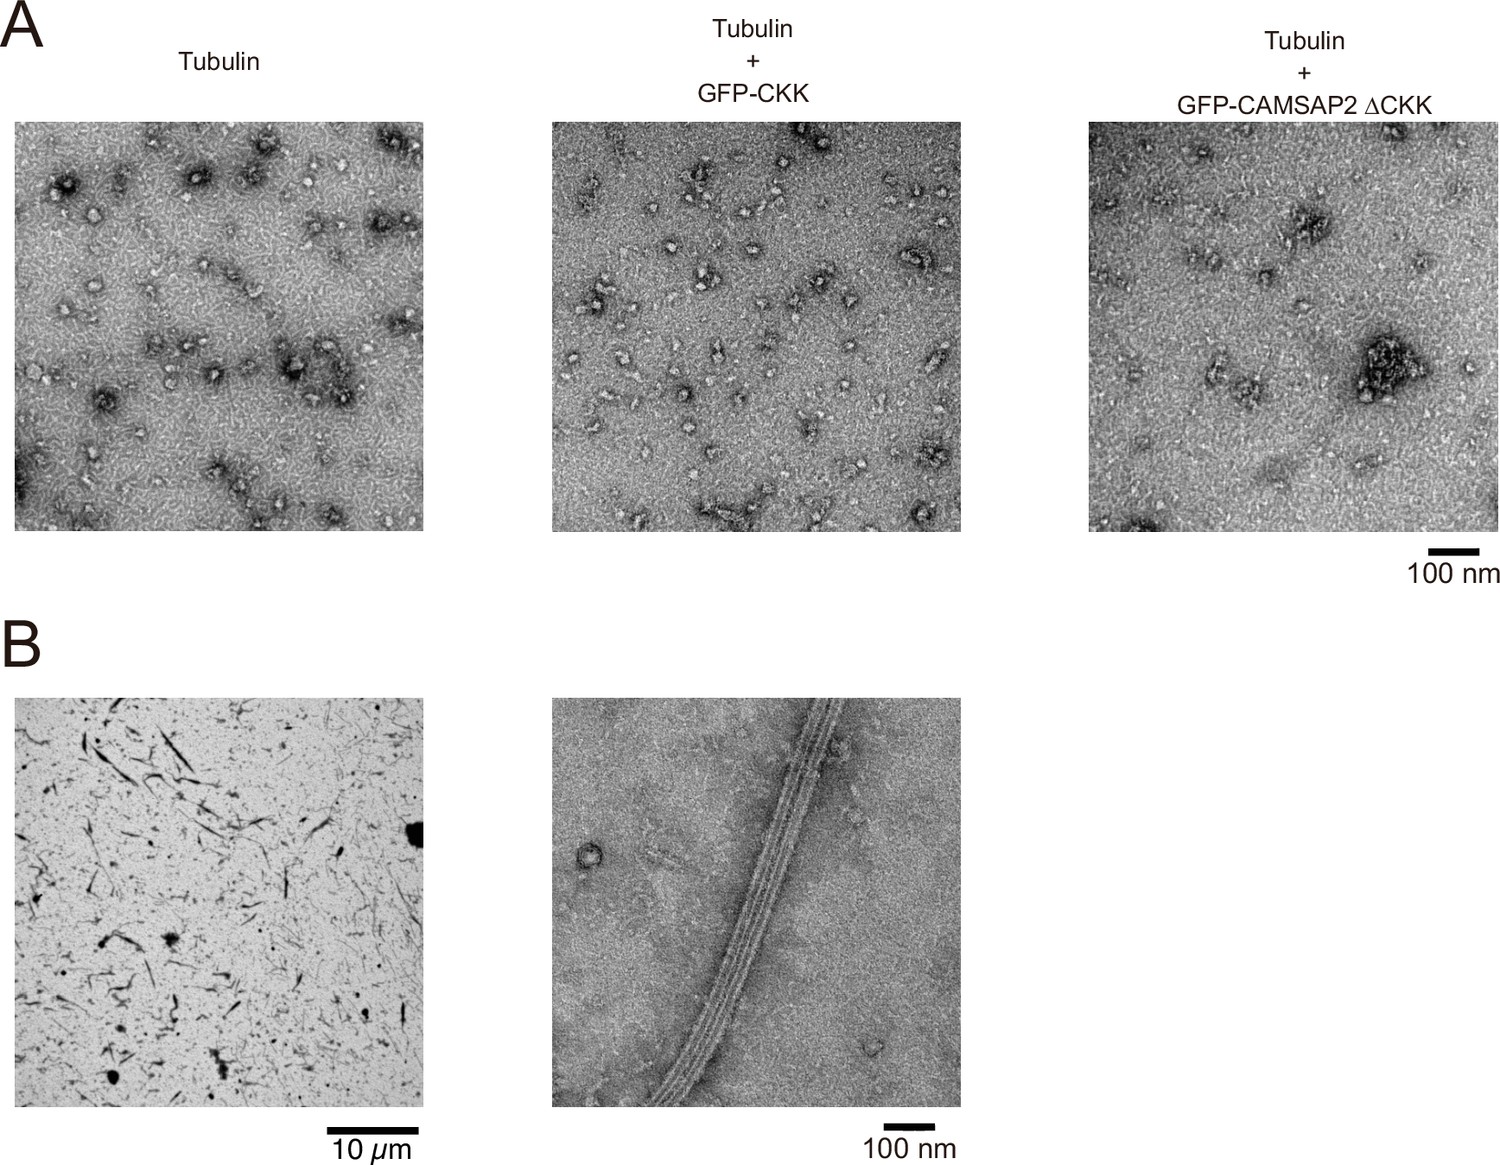
Functional domain mapping of calmodulin-regulated spectrin-associated protein 2 (CAMSAP2) analysed by negative stain electron microscopy (EM).
(A) Ten-micromolar tubulin was incubated alone (left), or with 1 µM GFP-CKK (middle), or with 1 µM GFP-CAMSAP2 ∆CKK (right) at 37°C for 10 min and analysed by negative stain EM. Oligomerization of tubulin was observed in these three conditions, albeit no microtubule formation was observed. (B) Ten-micromolar tubulin with 10 µM GFP-CKK was incubated at 37°C for 10 min and analysed by negative stain EM. Notably, the microtubules were fully decorated with the GFP-CKK.
Figure 7
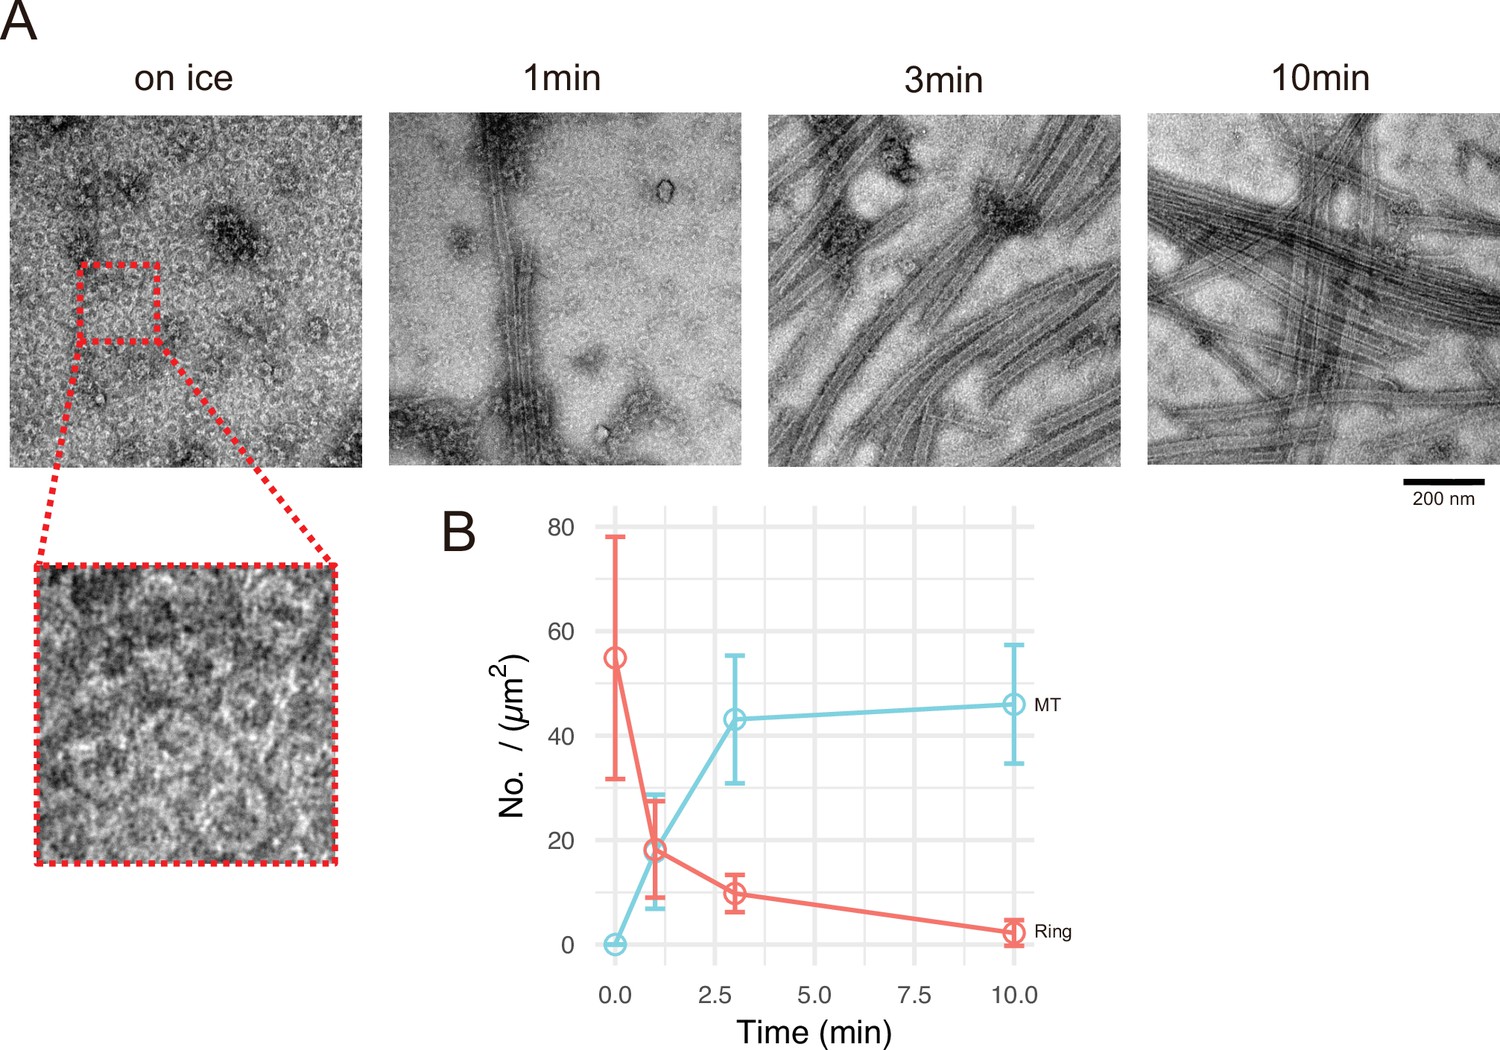
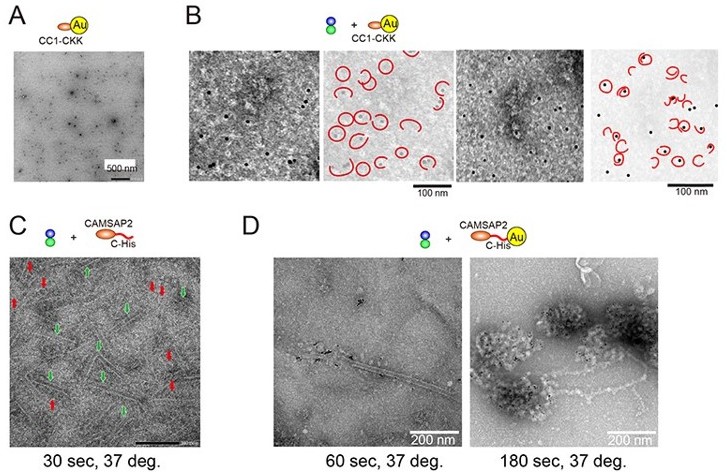
Calmodulin-regulated spectrin-associated protein 2 (CAMSAP2) induces tubulin ring formation.
Representative electron microscopy (EM) images are shown from at least three independent assays. (A) Negative stain EM micrographs of 10 µM tubulin polymerization with 1 µM GFP-CC1-CKK at different time points. (B) Plots of the number of tubulin rings (orange) and that of microtubules (cyan) at different time points (mean ± SD, from 10 independent views).
-
Figure 7—source data 1
Quantification of the numbers of rings and microtubules at different time points.
- https://cdn.elifesciences.org/articles/77365/elife-77365-fig7-data1-v1.pdf
Figure 8 with 3 supplements
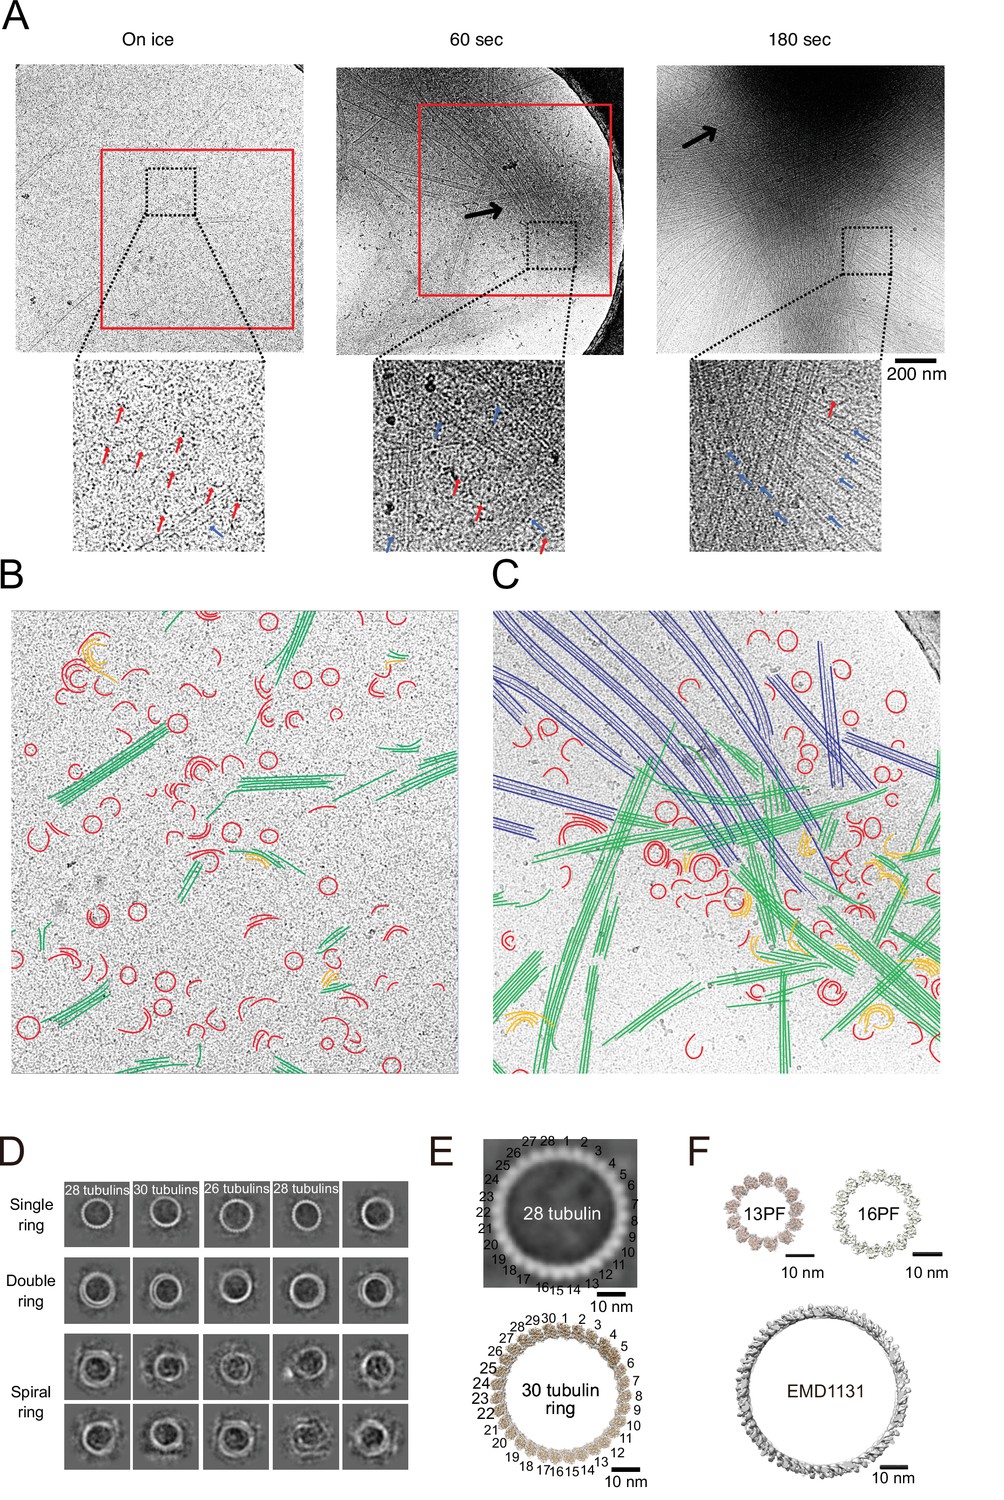
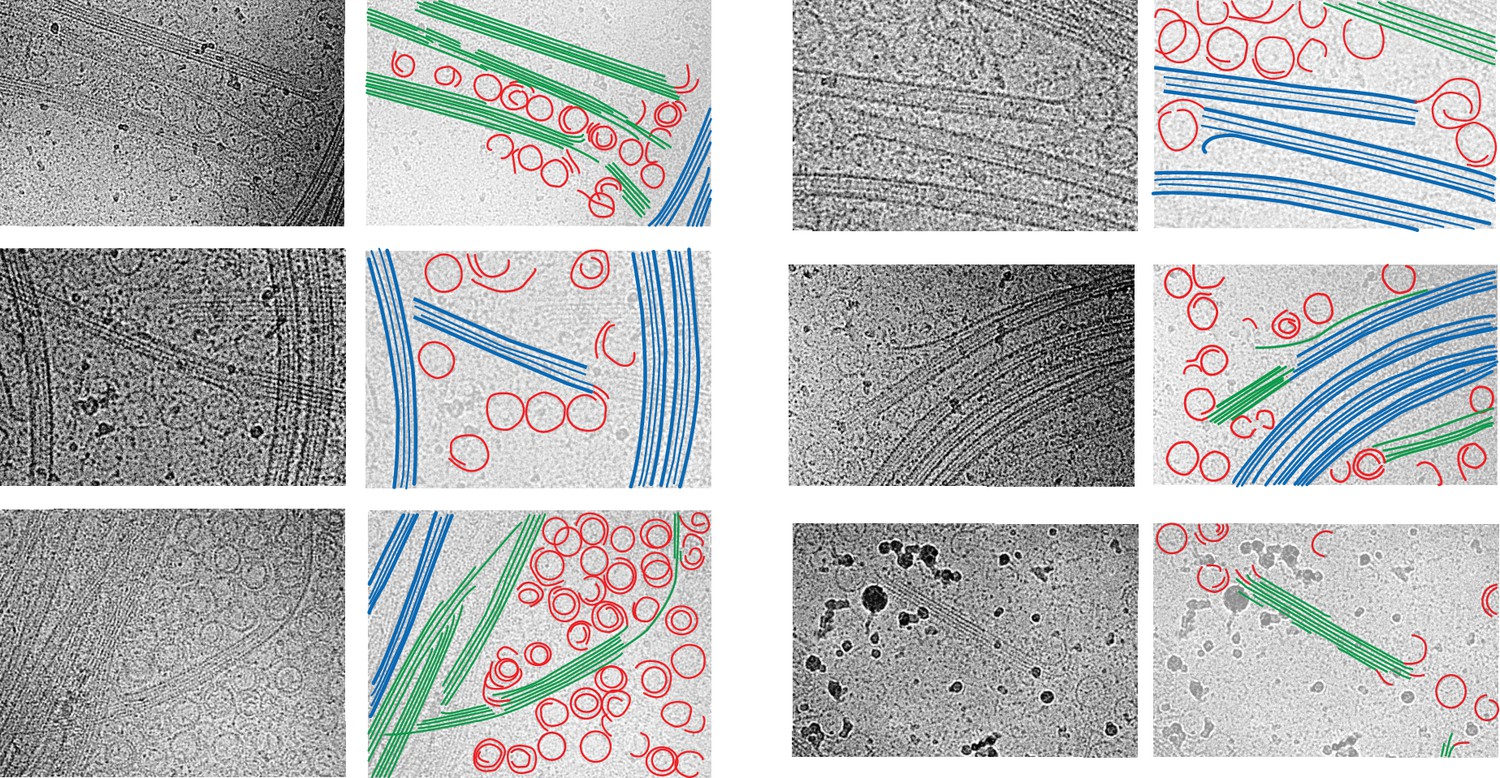
Calmodulin-regulated spectrin-associated protein 2 (CAMSAP2) induced microtubule nucleation intermediates visualized by time-lapse cryo-electron microscopy (EM).
Representative EM images are shown from at least three independent assays. (A) Snapshots of growing microtubule intermediates at different time points. The contrast of the micrographs was adjusted to be slightly higher than the original (see Figure 8—figure supplement 2C for raw images). The black arrows indicate high-density condensed areas, red squares are segmented areas. Red arrows in the zoomed images indicate tubulin-rings or semi-rings, and blue arrows indicate microtubules or sheets. (B) Segmentation of the structural elements of micrographs from panel (A) (on ice, red box). Tubulin rings, red; intermediates between ring and sheet, orange; tubulin sheets, green. (C) Segmentation of the structural elements of the micrographs from (A) (60 s, red box). Tubulin rings, red; intermediates between ring and sheet, orange; tubulin sheets, green; microtubules, blue. (D) 2D classification of tubulin rings. Rings of different shapes and sizes were observed, including single rings, spiral rings, and double rings. (E) Comparison of 2D average of 28 tubulin rings (top) with the reported tubulin rings produced by the 30 tubulin ring consists of longitudinal contacts (EMD-7026). 30 tubulin ring (EMD-6347) was generated by cropping outer tubulin ring from the microtubule-KLP10A map (EMD-7026) using its model (PDB: 6b0c) as a guide. (F) Thirteen and sixteen (EMD-5196) PF microtubule (top) as examples for the ring diameters made by lateral contacts and the tubulin longitudinal tube (EMD-1131) (bottom) as an example for the ring diameter made by longitudinal contacts. Sixteen protofilaments are the thickest microtubule in EMDB. The scale bars indicate 10 nm. The cryo-Electron Tomography (ET) reconstruction of Cam2-asters is available in Figure 8—figure supplement 1 and Video 5.
Figure 8—figure supplement 1
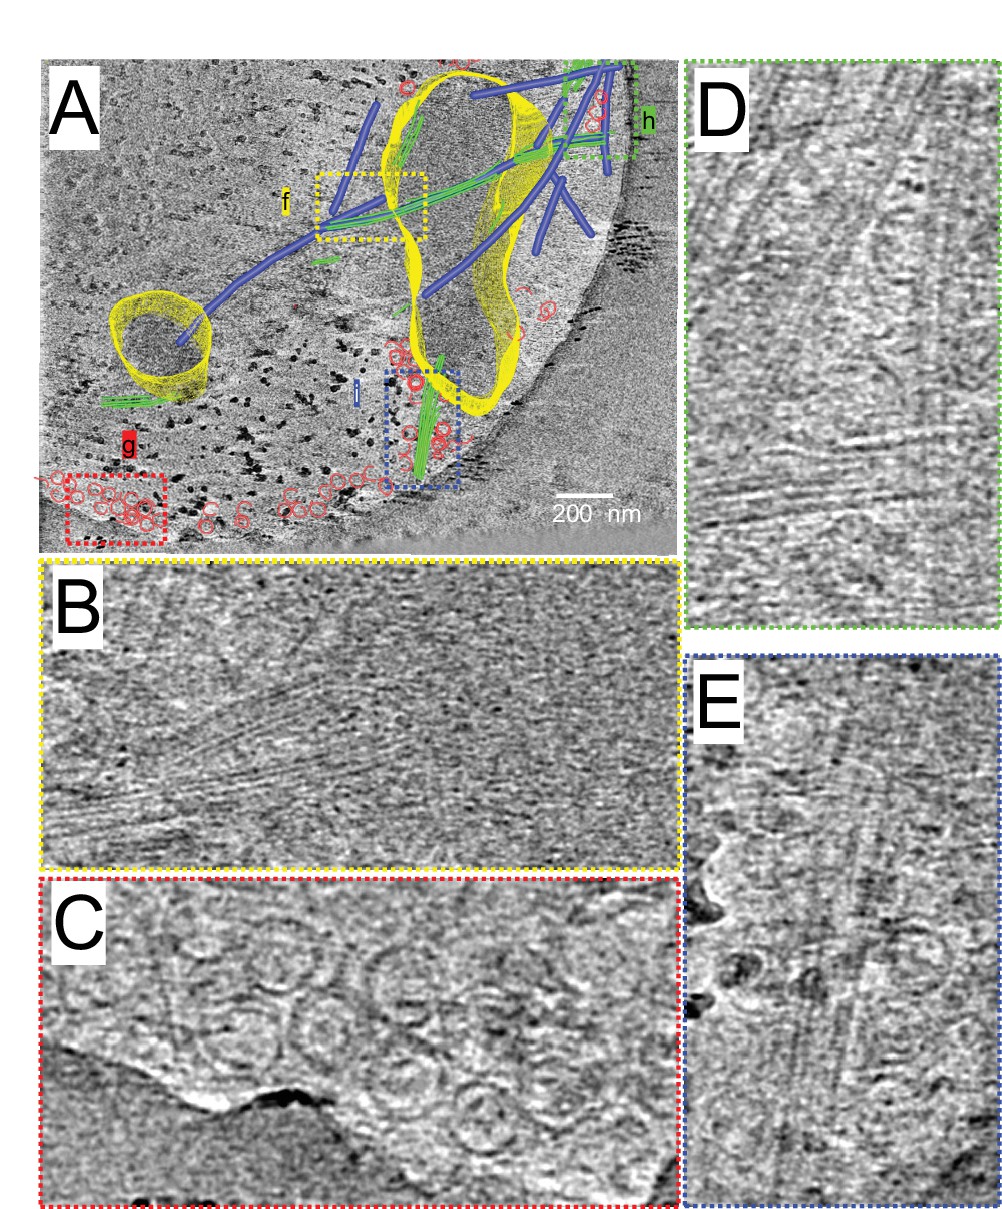
Cryo-electron tomographic reconstruction of the growing Cam2-asters.
(A)-(E) Tomographic reconstruction of a growing Cam2-aster processed by SIRT. See also Video 5. (A) Rendered view of a growing Cam2-aster from representative 120 nm thick tomography slices overlaid with a 2.4 nm tomographic slice. Condensates of the Cam2-aster: yellow; microtubules: blue; tubulin sheets: green; tubulin rings: red. (B)-(E), Magnified views shown in panel (A).
Figure 8—figure supplement 2
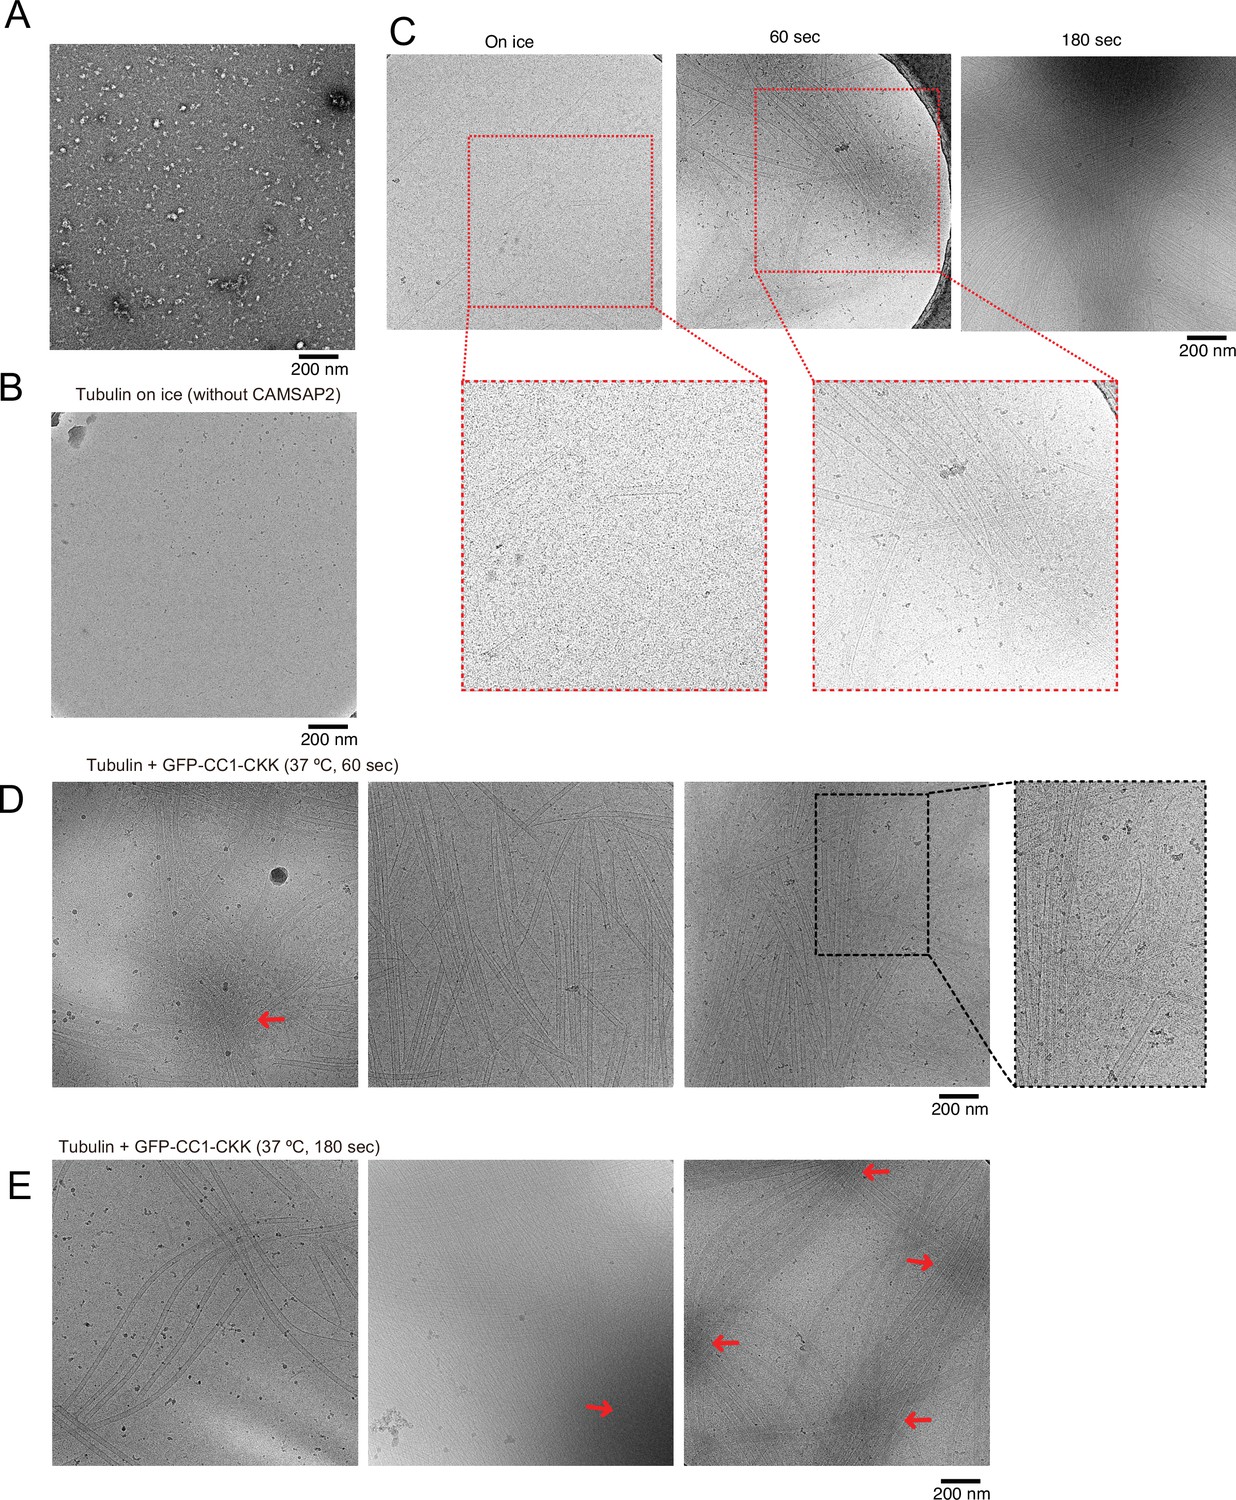
Cryo-electron microscopy (Cryo-EM) visualization of Cam2-aster formation.
(A) Negative stain image of 10 µM tubulin on ice. (B) Cryo-EM image of 30 µM tubulin on ice without calmodulin-regulated spectrin-associated protein 2 (CAMSAP2). (C) Raw micrographs of snapshots of growing microtubule intermediates at different time points, displayed in Figure 8A. Segmented areas corresponding to Figure 8B and C are circled by red dotted square and enlarged. (D) Cryo-EM images of growing microtubules with CAMSAP2 CC1-CKK after 60 s of incubation at 37°C. The enlarged panel shows examples of partially curved sheet-like microtubule ends, which are characteristic of growing microtubules. Enlarged area shows tubulin sheets exhibiting partially curved sheet-like structures (E) Cryo-EM images of growing microtubules with CAMSAP2 CC1-CKK after 180 s of incubation at 37°C. The red arrows in panels C and D indicate high-density condensed areas.
Figure 8—figure supplement 3
Segmentation of the structural elements of the micrographs at 60 s.
Tubulin rings, red; intermediates between ring and sheet, orange; tubulin sheets, green; microtubules, blue.
Figure 9
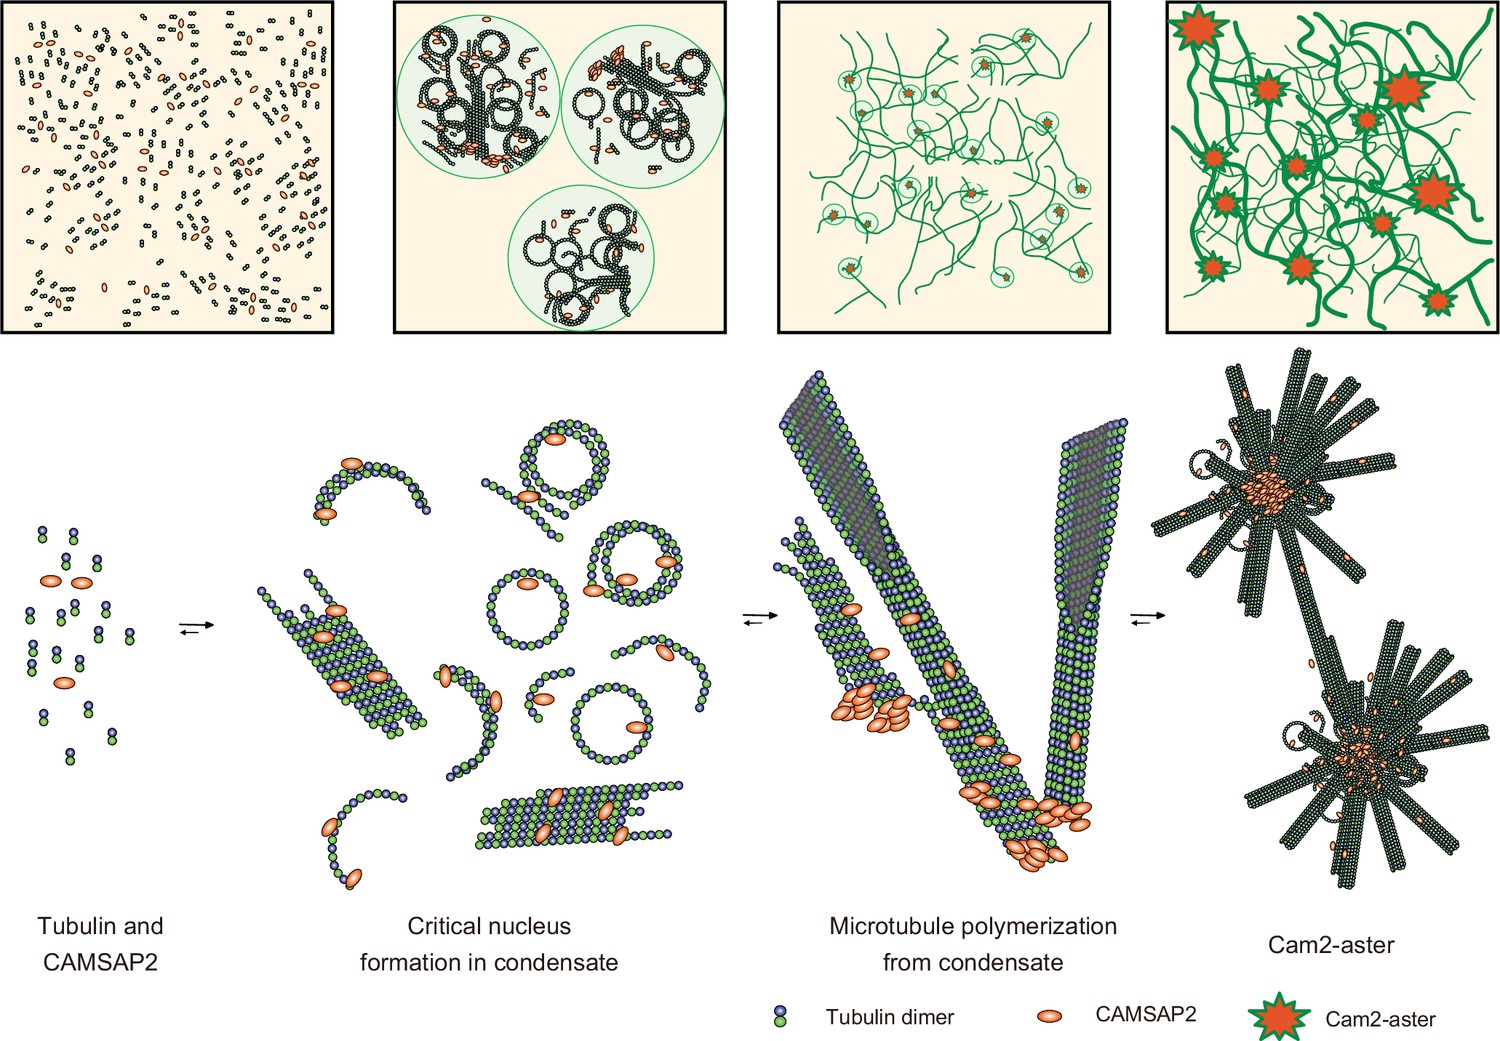
Structural model of microtubule nucleation and Cam2-aster formation induced by calmodulin-regulated spectrin-associated protein 2 (CAMSAP2).
Structural model of tubulin nucleation, polymerization, and aster formation induced by CAMSAP2, as detailed in the main text. CAMSAP2 shifts the equilibrium to the right, as indicated by the arrow size.
Author response image 1
Author response image 2
GFP attached on the glass surface represents homogeneous signals, unlike GFP-CAMSAP2-FL.
Videos
Video 1
Fusion of the calmodulin-regulated spectrin-associated protein 2 (CAMSAP2) condensate.
Video 2
Fluorescence recovery after photobleaching of GFP-calmodulin-regulated spectrin-associated protein 2-FL condensates, acquired via confocal microscopy.
The video was recorded immediately after photobleaching.
Video 3
Time-lapse movie of aster formation.
Tubulin (10 μM), TMR-tubulin (0.5 μM), and GFP-calmodulin-regulated spectrin-associated protein 2 (CAMSAP2)-FL (50 nM) were incubated with CAMSAP2 condensates fixed on coverslips. The size of the field is 81.9 μm × 81.9 μm. The frame rate is 0.2 frames/s.
Video 4
Magnified movie of aster formation from 1.
Dynamic microtubules from calmodulin-regulated spectrin-associated protein 2 condensates were observed. The size of the field is 8.2 μm × 8.2 μm. The frame rate is 0.2 frames/s.
Video 5
Cryo-electron tomographic reconstruction of the growing Cam2-aster.
SIRT processed cryo-tomographic reconstruction of the growing Cam2-aster produced by incubation of 10 µM tubulin with 1 µM full-length calmodulin-regulated spectrin-associated protein 2 for 1 min at 37°C.
Tables
Table 1
List of protein expression constructs used in this study.
| ID | Construct | Amino acids | Vector | Tag (N-terminal) | Tag (C-terminal) |
|---|---|---|---|---|---|
| RN82 | full length | 1–1472 | pFastBac1 | none | 6× His |
| RN63 | CC1-CKK | 696–1,454 | pGFPS1 | HAT*-GFPS1-TEV* | 7× His |
| RN64 | CC3-CKK | 1157–1454 | pGFPS1 | HAT*-GFPS1-TEV* | 7× His |
| RN136 | CKK | 1332–1472 | pGFPS1 | HAT*-GFPS1-TEV* | 7× His |
| RN189 | full length | 1–1472 | pFastBac1 | His_Strep2-3Csite | none |
| RN282 | CC1-CKK-CT | 696–1472 | pET28 | His_Strep2-3Csite | none |
| RN290 | CC3-CKK-CT | 1157–1472 | pET28 | His_Strep2-3Csite | none |
| RN318 | ∆CKK | 1–1331 | pFastBac1 | His_Strep2-3Csite | none |
| RN328 | ∆CC3 | 1–1472 ∆1154–1250 | pFastBac1 | His_Strep2-3Csite | none |
-
*
These tags carry modifications. See the Methods for details.
Additional files
Download links
A two-part list of links to download the article, or parts of the article, in various formats.
Downloads (link to download the article as PDF)
Open citations (links to open the citations from this article in various online reference manager services)
Cite this article (links to download the citations from this article in formats compatible with various reference manager tools)
CAMSAP2 organizes a γ-tubulin-independent microtubule nucleation centre through phase separation
eLife 11:e77365.
https://doi.org/10.7554/eLife.77365


