Non-invasive classification of macrophage polarisation by 2P-FLIM and machine learning
- Department of Mechanical, Manufacturing and Biomedical Engineering, Trinity College Dublin, Ireland
- Trinity Centre for Biomedical Engineering, Trinity Biomedical Science Institute, Trinity College Dublin, Ireland
- School of Biochemistry & Immunology and School of Medicine, Trinity Biomedical Science Institute, Trinity College Dublin, Ireland
- School of Computer Science and Statistics, Trinity College Dublin, Ireland
- Advanced Materials for BioEngineering Research (AMBER) Centre, Trinity College Dublin and Royal College of Surgeons in Ireland, Ireland
- CURAM SFI Research Centre for Medical Devices, National University of Ireland, Ireland
Figures
Figure 1
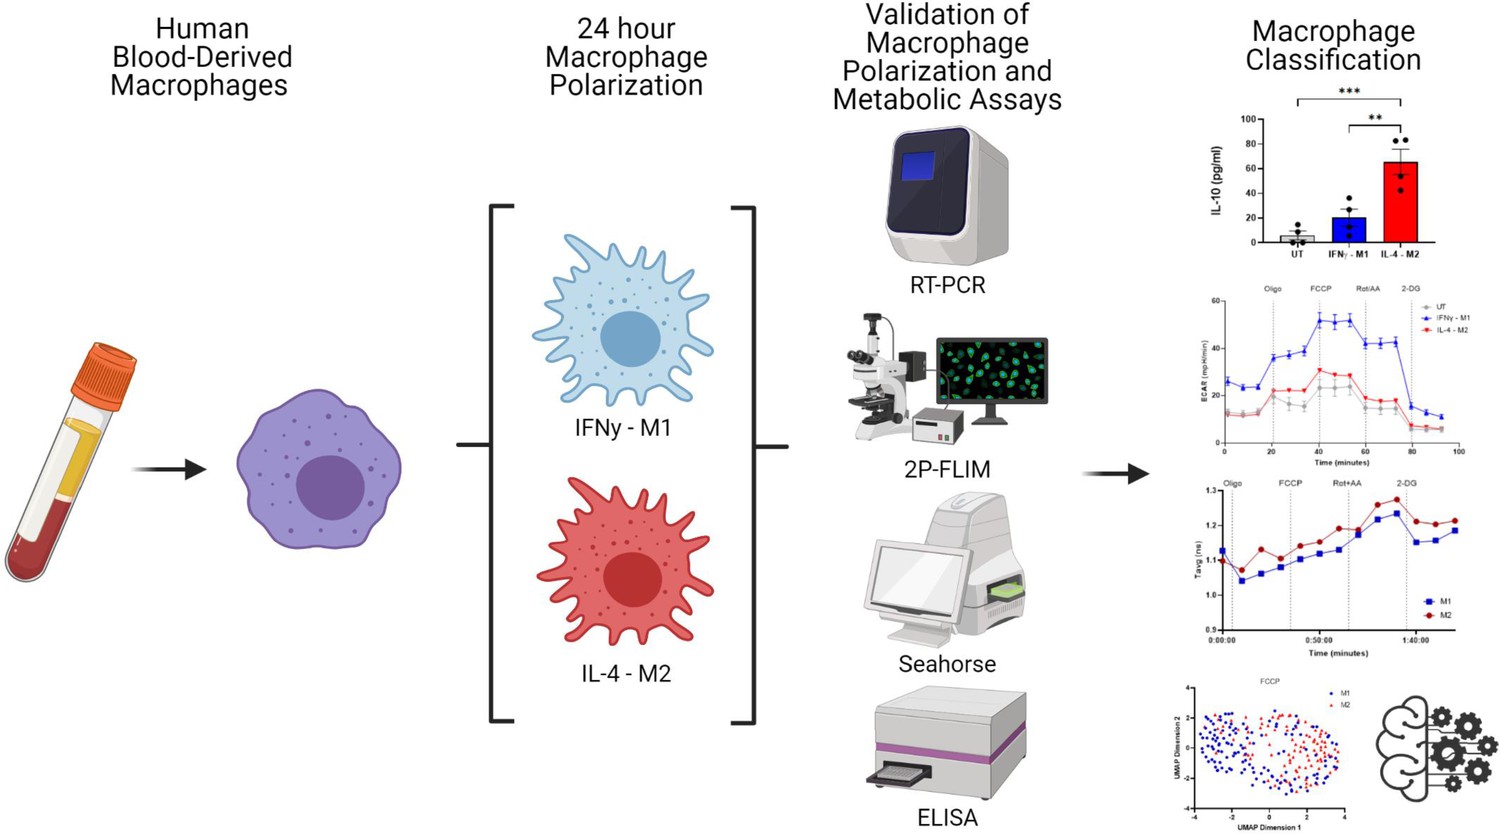
Overview of experimental work.
Image created using biorender.com.
Figure 2 with 1 supplement
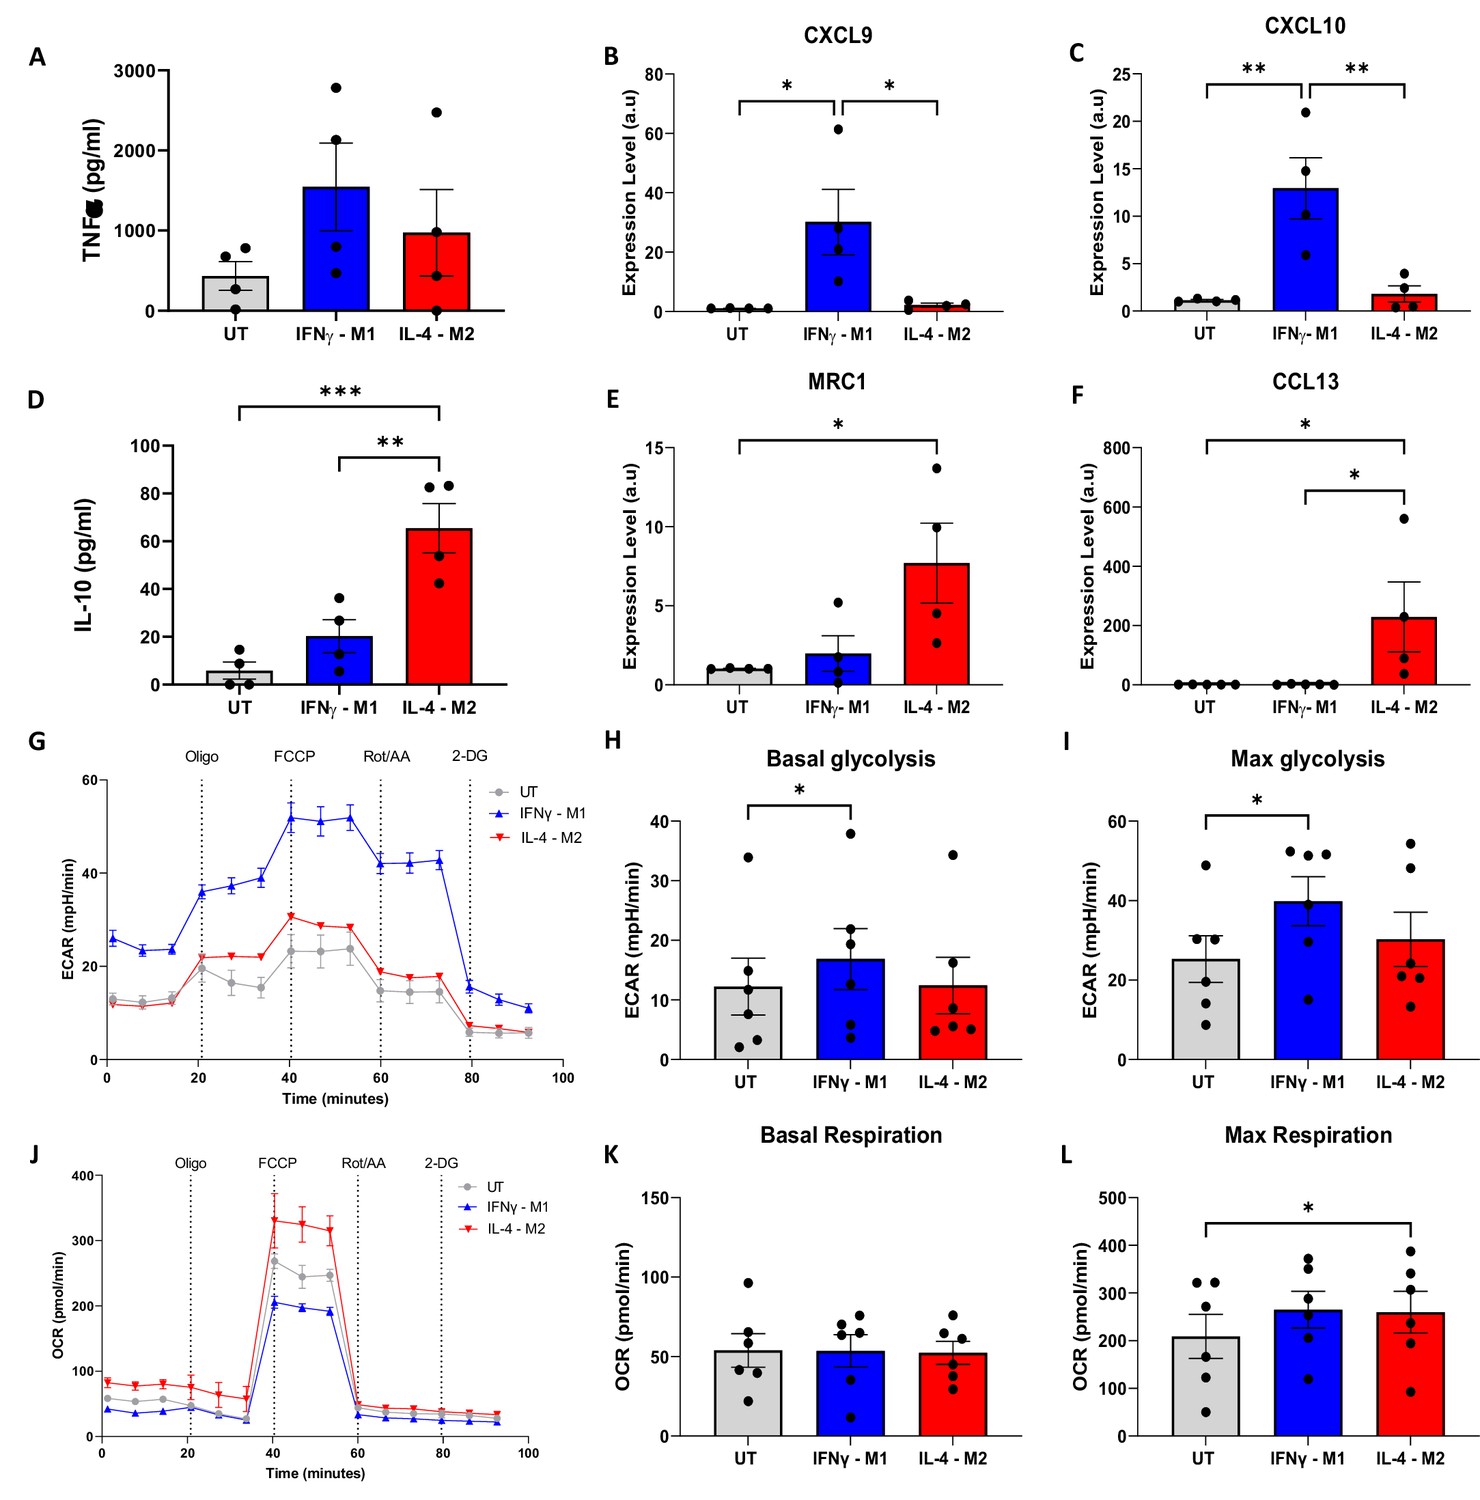
Validation of macrophage polarisation and metabolic profiling of IFNγ-M1, IL-4-M2, and untreated (UT) macrophages.
(A, B) ELISA of inflammatory cytokine TNFα and anti-inflammatory IL-10 in IFNγ-M1, IL-4-M2, and UT macrophages. (C–F) Evaluation of CXCL9, MRC1, CXCL10, and CCL13 gene expression in IFNγ-M1, IL-4-M2, and UT macrophages. (G,J ) Extracellular acidification ratio (ECAR) and oxygen consumption ratio (OCR) profile of IFNγ-M1, IL-4-M2, and UT macrophages when treated sequentially with oligomycin, carbonyl cyanide-p-trifluoromethoxyphenylhydrazone (FCCP), rotenone + antimycin A, and 2-deoxy-d-glucose (2-DG). (H, I, K, L) Area under the curve (AUC) values calculated from ECAR and OCR between each treatment. Data displayed as average ± SD. Statistical significance verified by one-way ANOVA with *p<0.05, **p<0.01, ***p<0.001 to show significance for N = 6 donors.
-
Figure 2—source data 1
ELISA, gene expression, extracellular acidification ratio, and oxygen consumption ratio measurements for each replicate data and details of statistical tests and chosen parameters.
- https://cdn.elifesciences.org/articles/77373/elife-77373-fig2-data1-v1.zip
Figure 2—figure supplement 1
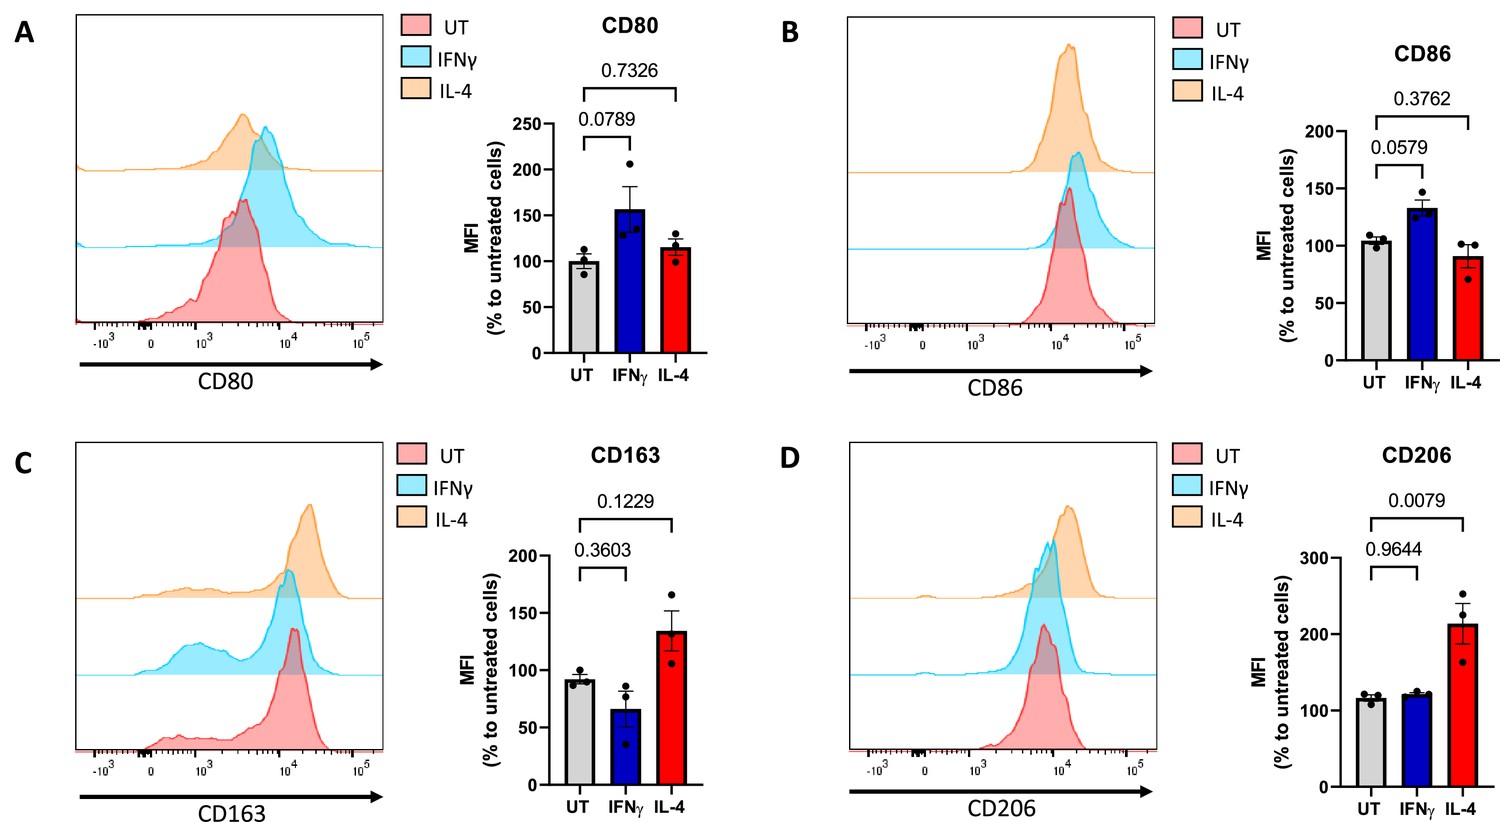
Validation of macrophage polarisation using flow cytometry.
Primary human macrophages were left untreated (UT), treated with IFNγ (20 ng/ml), or IL-4 (20 ng/ml) for 24 hr. Cells were stained for M1 maturation surface markers CD80, CD86, and M2 surface markers CD163, CD206, and analysed by flow cytometry. (A–D) Representative histograms depicting median fluorescence intensity (MFI) of surface markers. Bar graphs depict MFI as a percentage to the control (untreated cells) (N = 3). All data is represented as mean ± SEM and analysed by one-way ANOVA with Dunnett’s multiple-comparisons test.
-
Figure 2—figure supplement 1—source data 1
Flow cytometry surface markers measurement and details of statistical tests and chosen parameters.
- https://cdn.elifesciences.org/articles/77373/elife-77373-fig2-figsupp1-data1-v1.zip
Figure 3 with 6 supplements
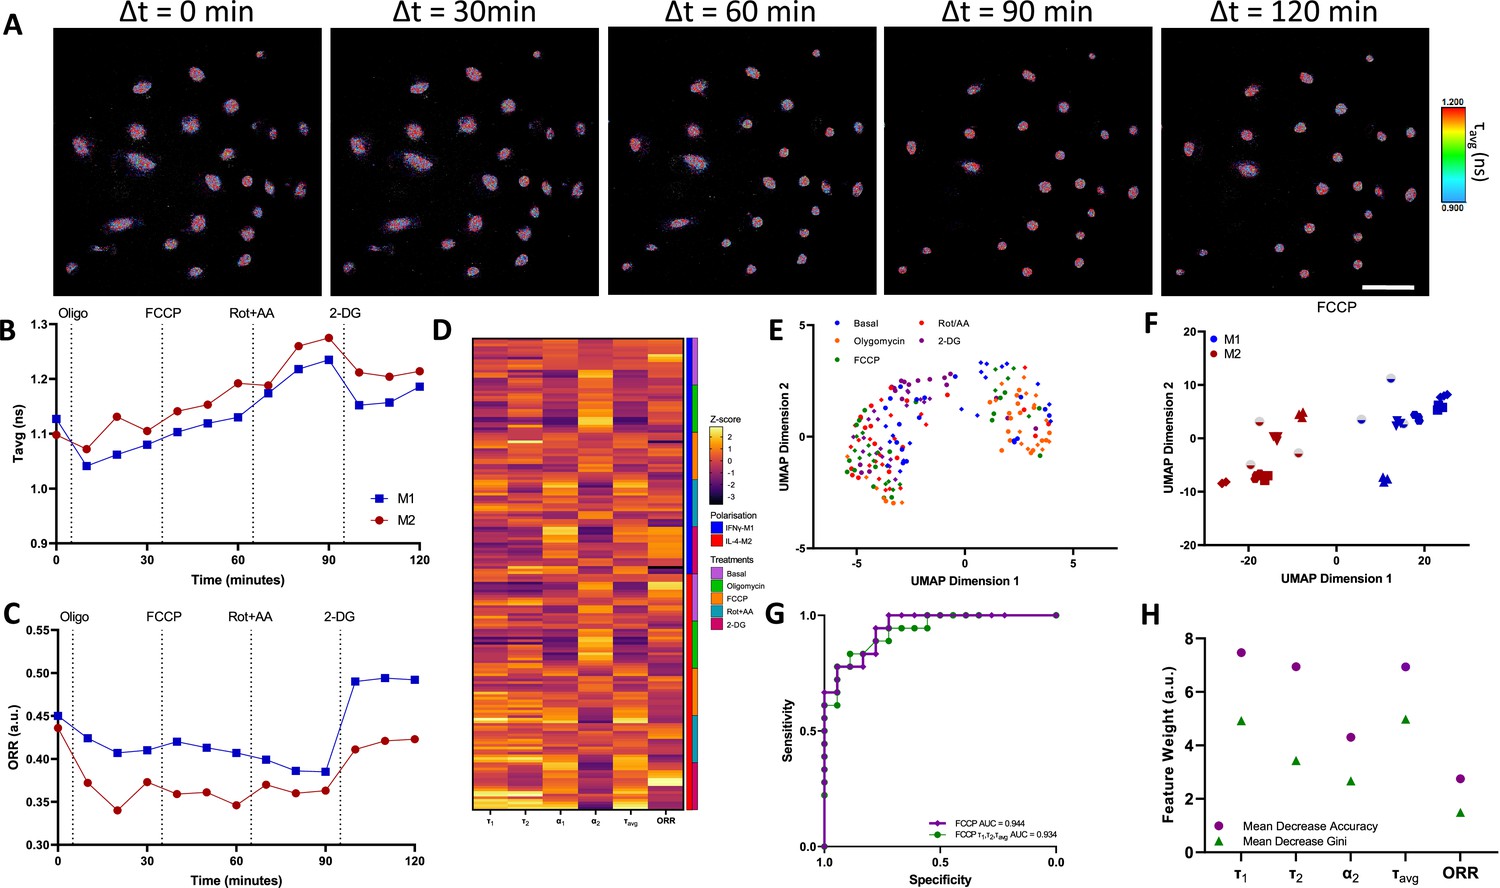
Two-photon fluorescence lifetime imaging microscopy (2P-FLIM) metabolimaging analysis.
(A) Time-course imaging of representative (same field of view throughout) IFNγ-M1 macrophages, scale bar: 100 μm. (B, C) Average fluorescence lifetime (τavg) and optical redox ratio (ORR) values for IFNγ-M1 and IL-4-M2 when treated sequentially with oligomycin, carbonyl cyanide-p-trifluoromethoxyphenylhydrazone (FCCP), rotenone + antimycin A and 2-deoxy-d-glucose (2-DG) of a representative donor. (D) z-score heatmap of 2P-FLIM acquired data for six donors separated by macrophage polarisation and metabolic inhibitor, each individual row corresponds to an imaging field. (E) Uniform Manifold Approximate and Projection (UMAP) plot of 2P-FLIM variables after each treatment each dot corresponds to an individual imaging field. (F) UMAP plot of 2P-FLIM variables after FCCP treatment, each dot corresponds to an individual imaging field. (G) Receiver-operator curve and area under curve values of random forests machine learning model applied to 2P-FLIM data after FCCP treatment. (H) 2P-FLIM weight features determined by mean decrease accuracy and mean decrease Gini of random forests model used to classify macrophages.
-
Figure 3—source data 1
Fluorescence lifetime imaging microscopy (FLIM) imaging and corresponding variables measurement for each replicate, Uniform Manifold Approximate and Projection (UMAP) analysis, and machine learning (random forests) input data and coding.
- https://cdn.elifesciences.org/articles/77373/elife-77373-fig3-data1-v1.zip
Figure 3—figure supplement 1
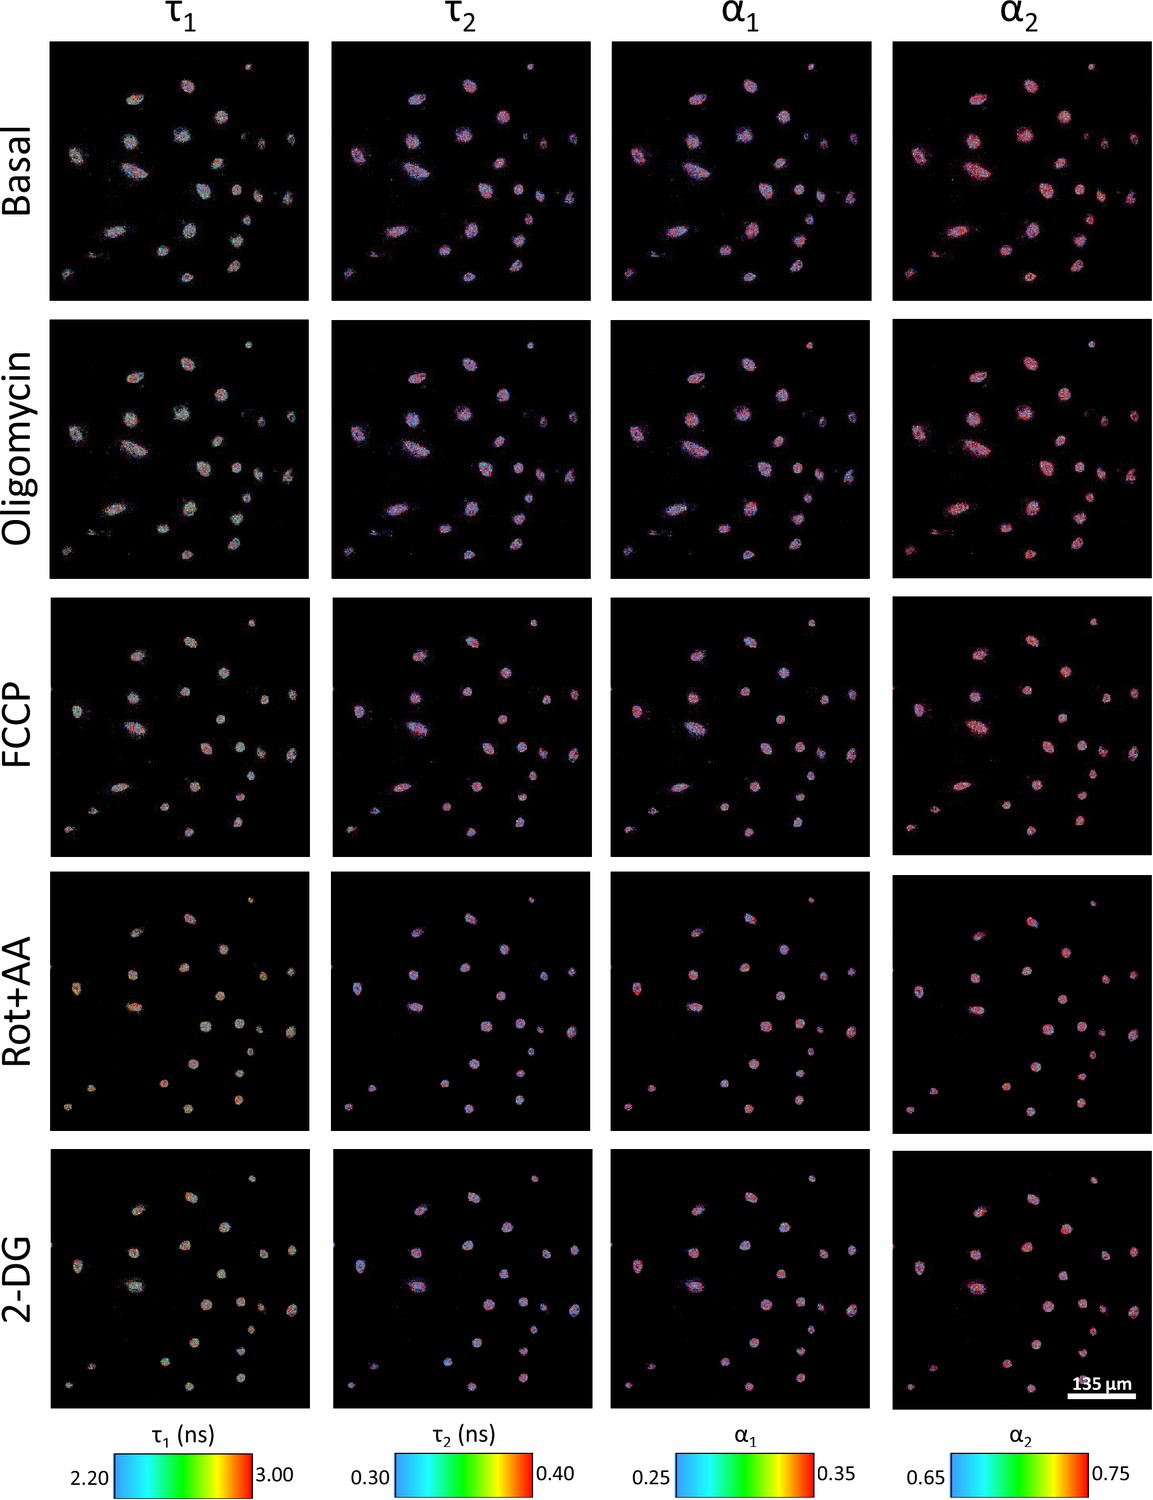
Two-photon fluorescence lifetime imaging microscopy (2P-FLIM) of IFNγ-M1 macrophages for basal conditions, oligomycin, carbonyl cyanide-p-trifluoromethoxyphenylhydrazone (FCCP), rotenone with antimycin A, and 2-deoxy-d-glucose treatments with the concentrations detailed in the article.
All treatment images collected at the 30 min of treatment and color-coded for different NADH FLIM variables.
Figure 3—figure supplement 2
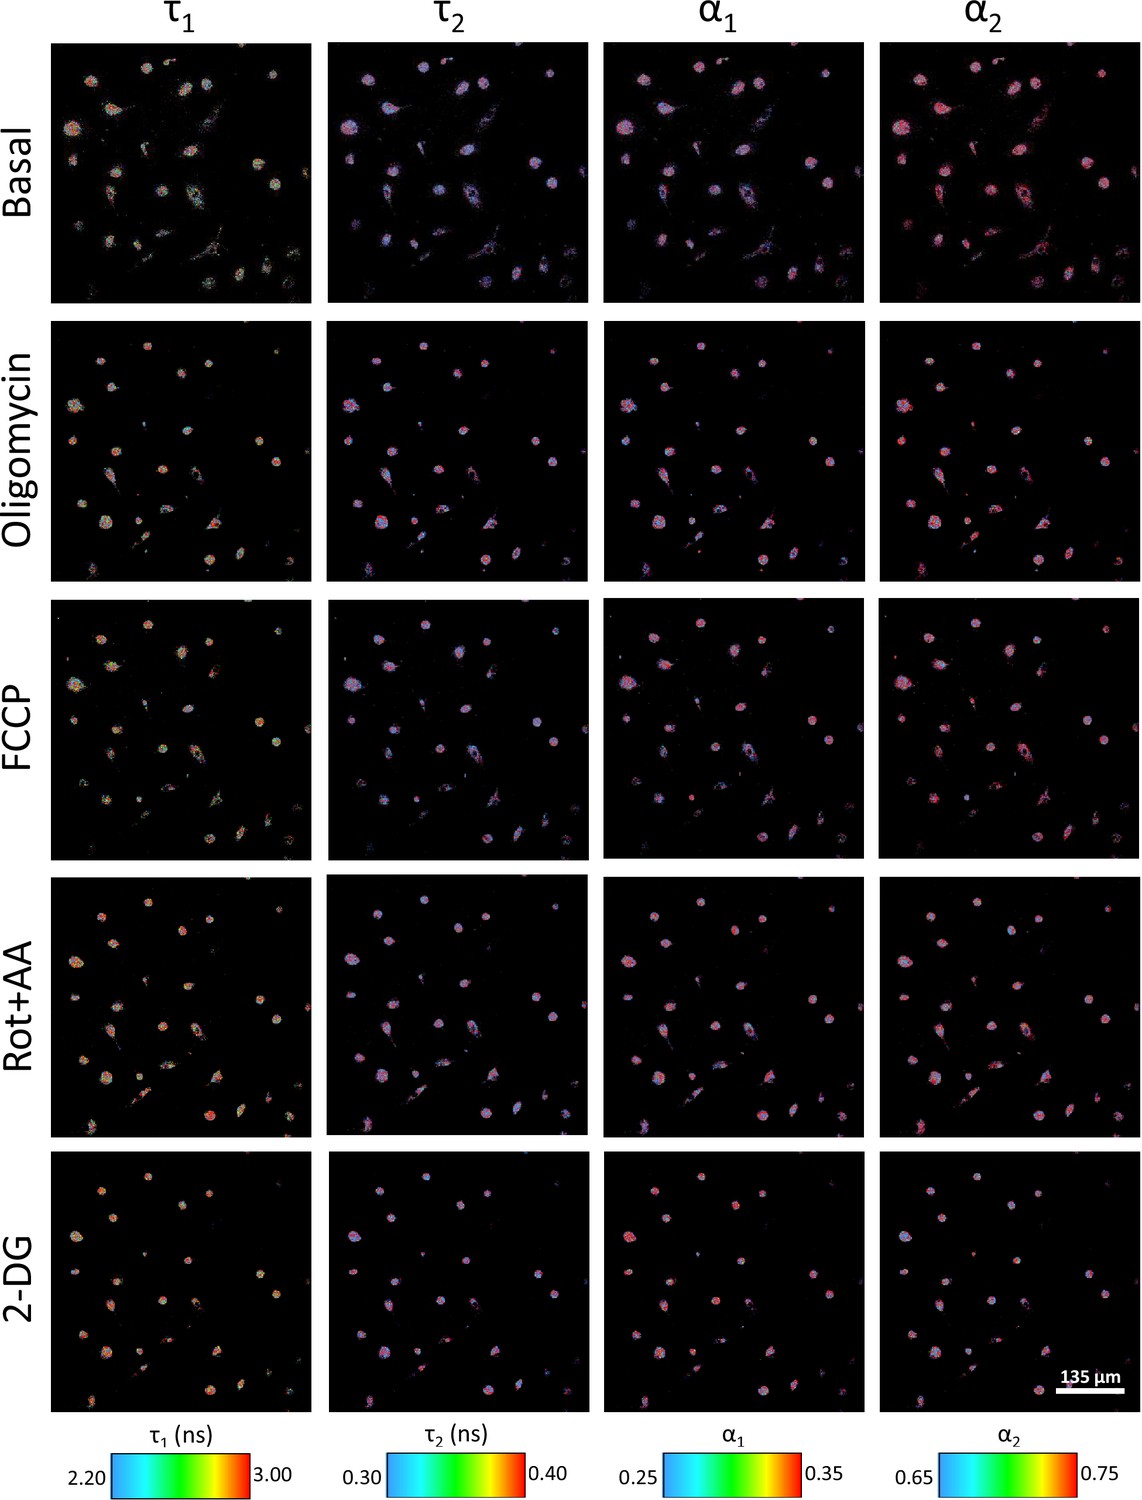
Two-photon fluorescence lifetime imaging microscopy (2P-FLIM) of IL-4-M2 macrophages for basal conditions, oligomycin, carbonyl cyanide-p-trifluoromethoxyphenylhydrazone (FCCP), rotenone with antimycin A, and 2-deoxy-d-glucose treatments with the concentrations detailed in the article.
All treatment images collected at the 30 min of treatment and color-coded for different NADH FLIM variables.
Figure 3—figure supplement 3
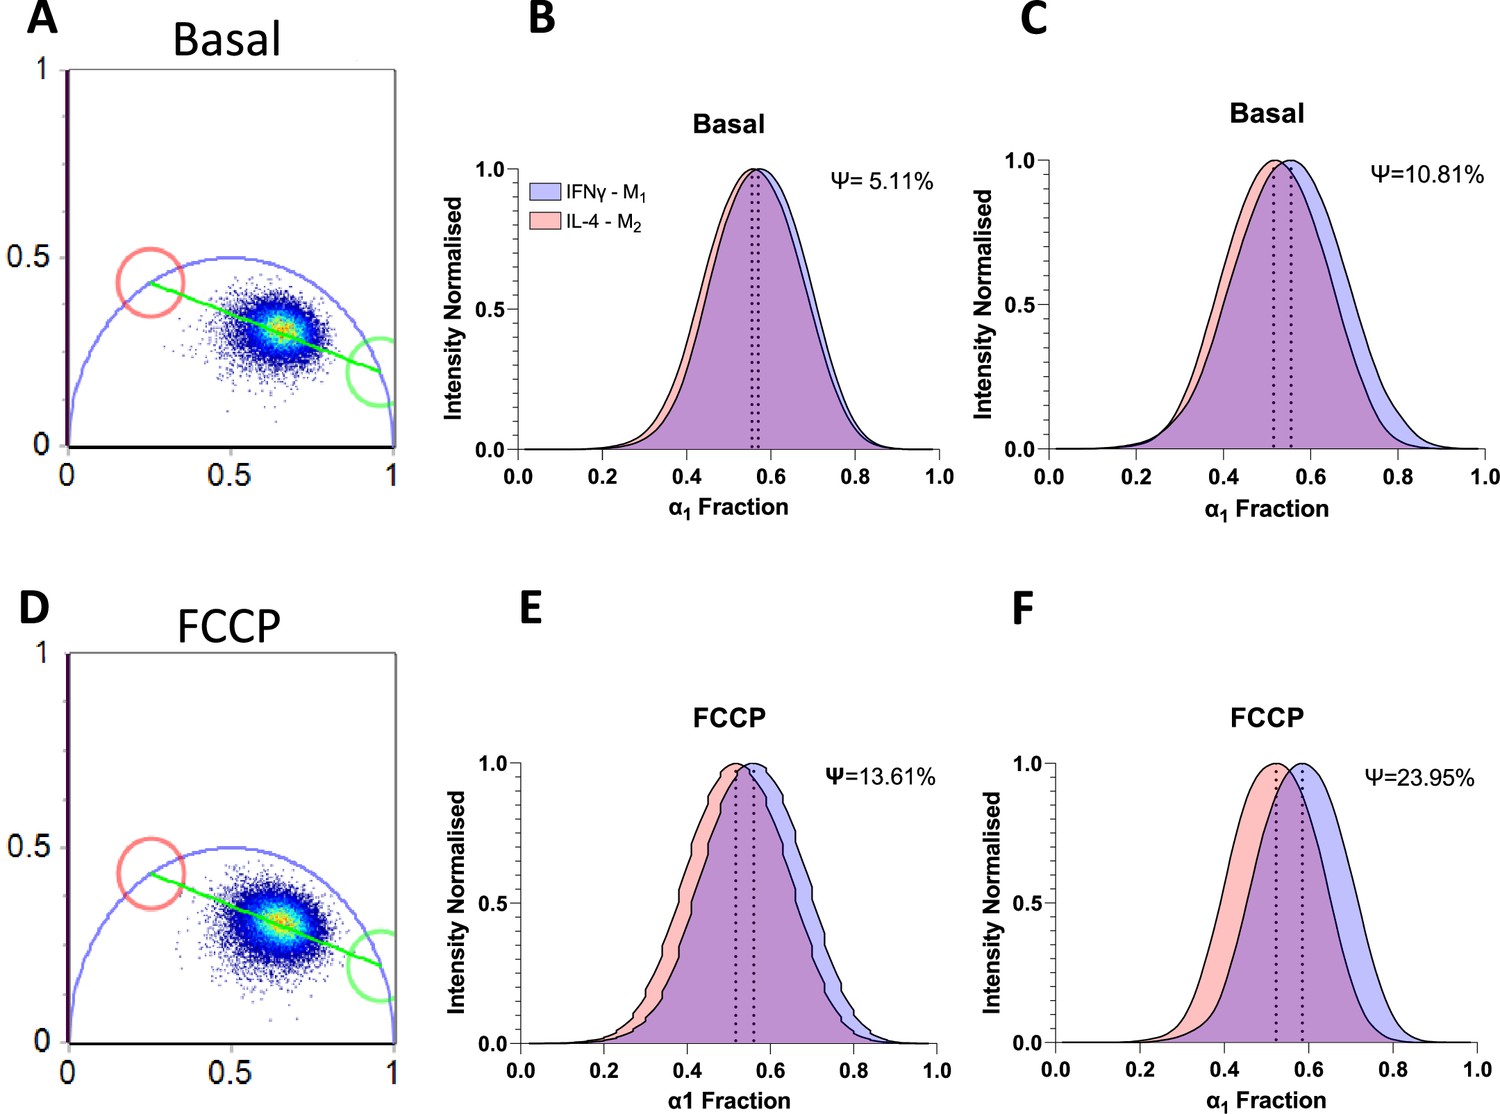
Phasor analysis of NADH fluorescence lifetime imaging microscopy (FLIM) variables in basal and carbonyl cyanide-p-trifluoromethoxyphenylhydrazone (FCCP) conditions.
(A) Basal phasor with values set at 3.4 ns (red) and 0.4 ns (green) and all donors basal FLIM data distribution. (B) Histogram of all donors normalised to pixel intensity in basal conditions. (C) Histogram distribution of a representative donor normalised to pixel intensity in basal conditions. (D) FCCP phasor with values set at 3.4 ns (red) and 0.4 ns (green) and all donors FCCP FLIM data distribution. (E) Histogram of all donors (N = 6) normalised to pixel intensity in FCCP conditions. (F) Histogram distribution of a representative donor normalised to pixel intensity in FCCP conditions. Ψ value is the non-overlapped area for both curves in each plot when compared with the total area occupied by both curves. A higher Ψ value determines a better segregation between datasets.
-
Figure 3—figure supplement 3—source data 1
Phasor fluorescence lifetime imaging microscopy (FLIM) analysis raw histogram data.
- https://cdn.elifesciences.org/articles/77373/elife-77373-fig3-figsupp3-data1-v1.zip
Figure 3—figure supplement 4
2P-FLIM variables correlation matrix.
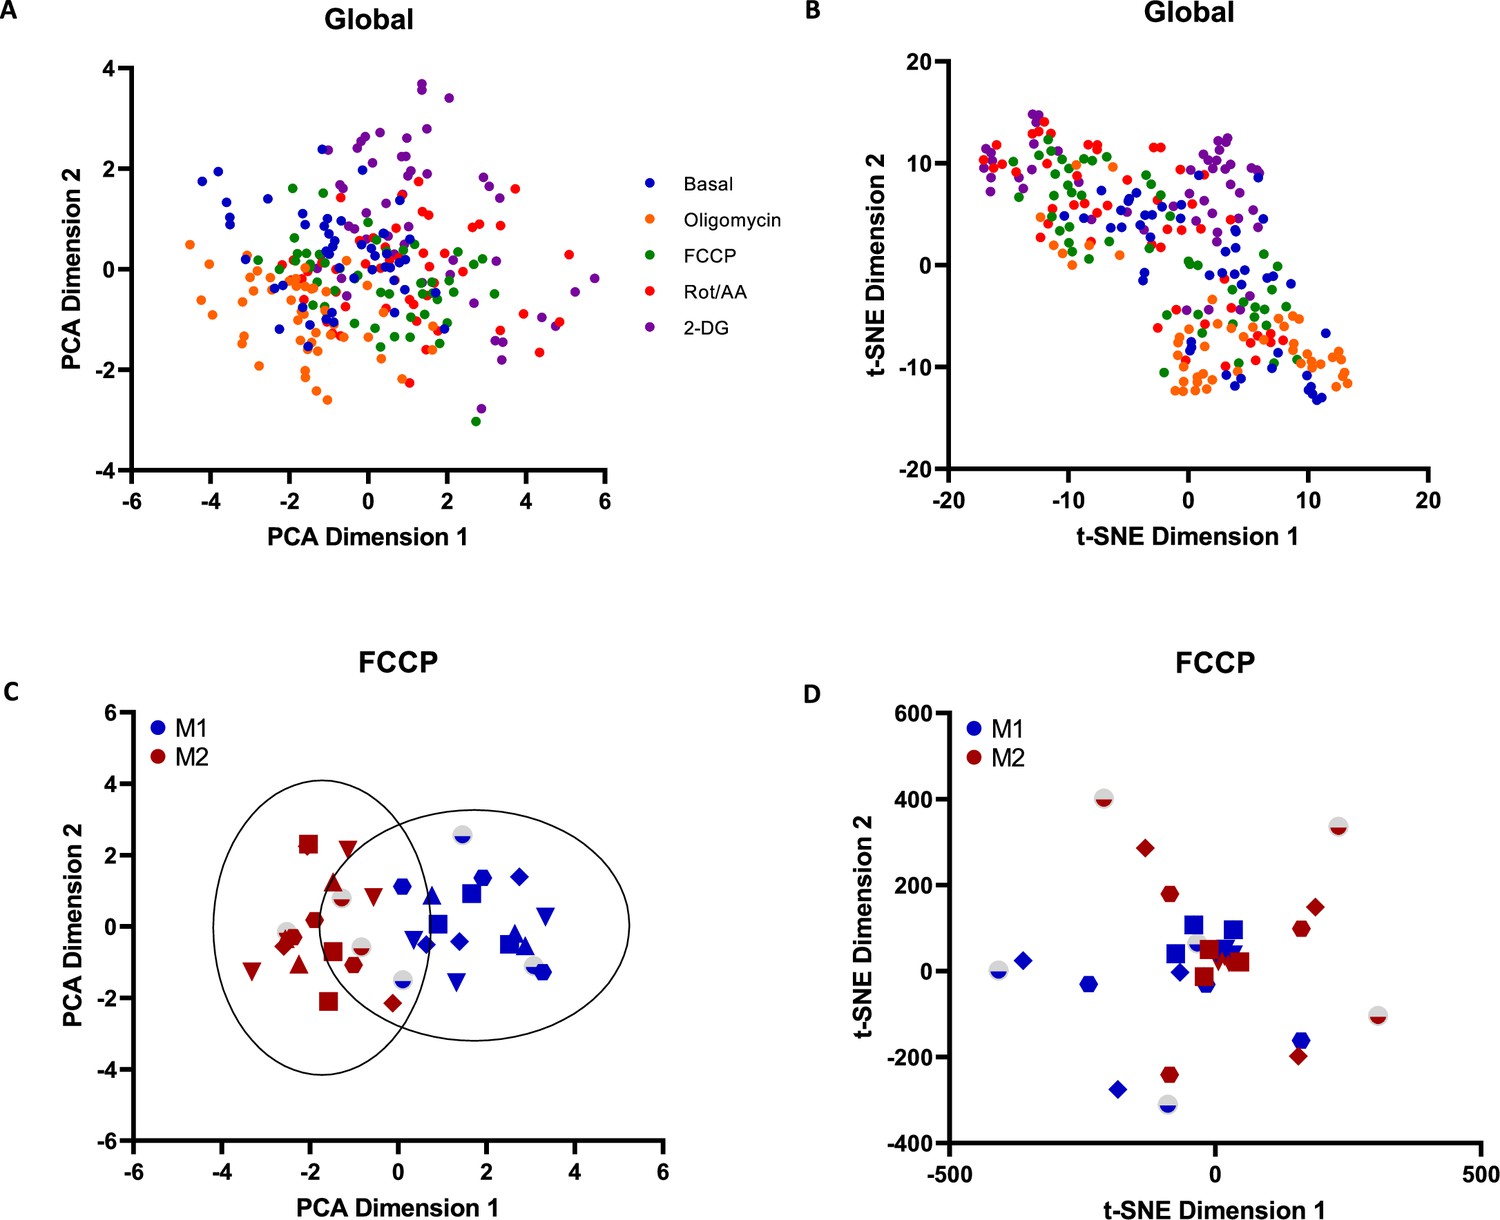
Principal component analysis (PCA) and t-SNE data visualisation of two-photon fluorescence lifetime imaging microscopy (2P-FLIM) variables obtained from full field of view (FoV) collected during the course of metabolic treatments (A, B). PCA data visualisation of 2P-FLIM variables obtained from full FoV collected during carbonyl cyanide-p-trifluoromethoxyphenylhydrazone (FCCP) treatments and representation of 99.9% confidence ellipses derived from 3 standard deviations of the data presented for each group of samples (C). t-SNE data visualisation of 2P-FLIM variables obtained from full FoV collected during FCCP treatments (D).
Figure 3—figure supplement 5
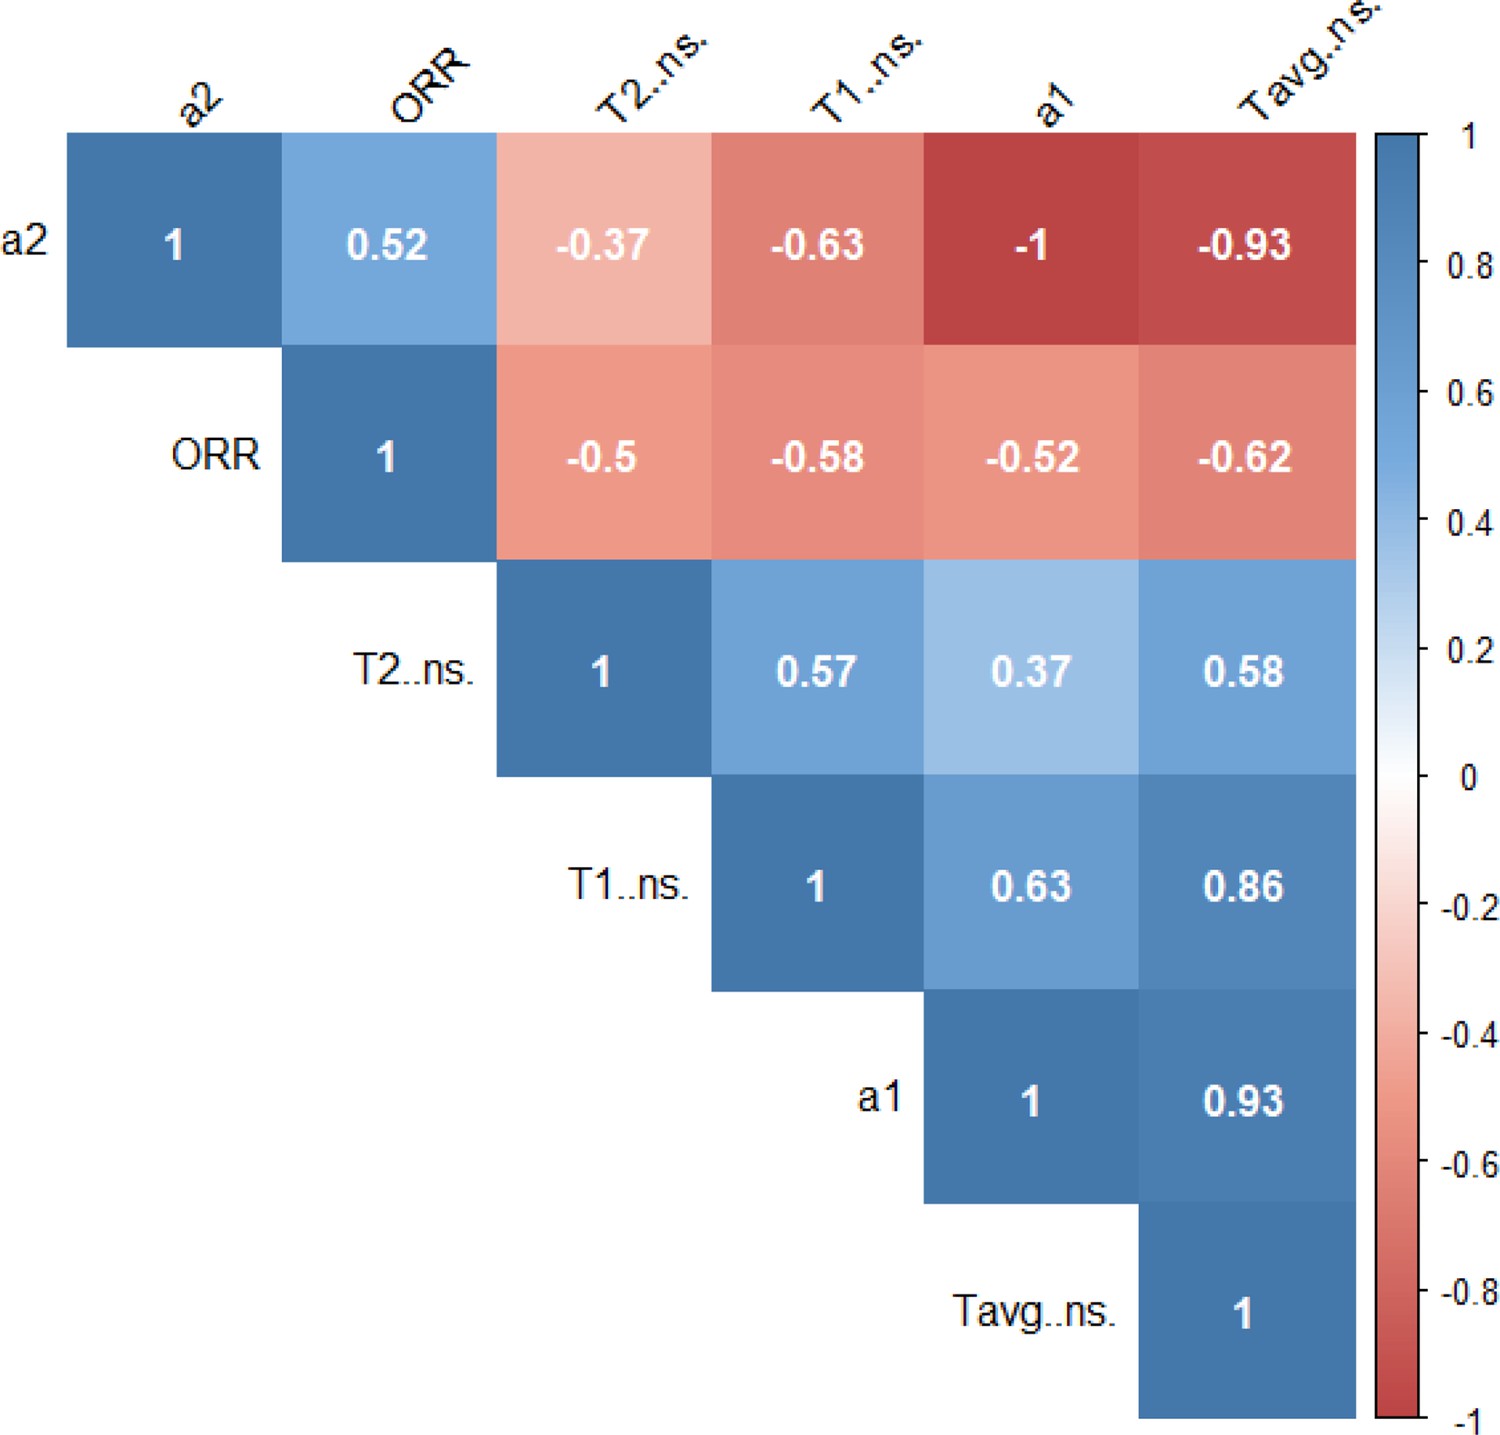
Correlation matrix of two-photon fluorescence lifetime imaging microscopy (2P-FLIM) NAD(P)H variables with correlation values displayed.
Figure 3—figure supplement 6
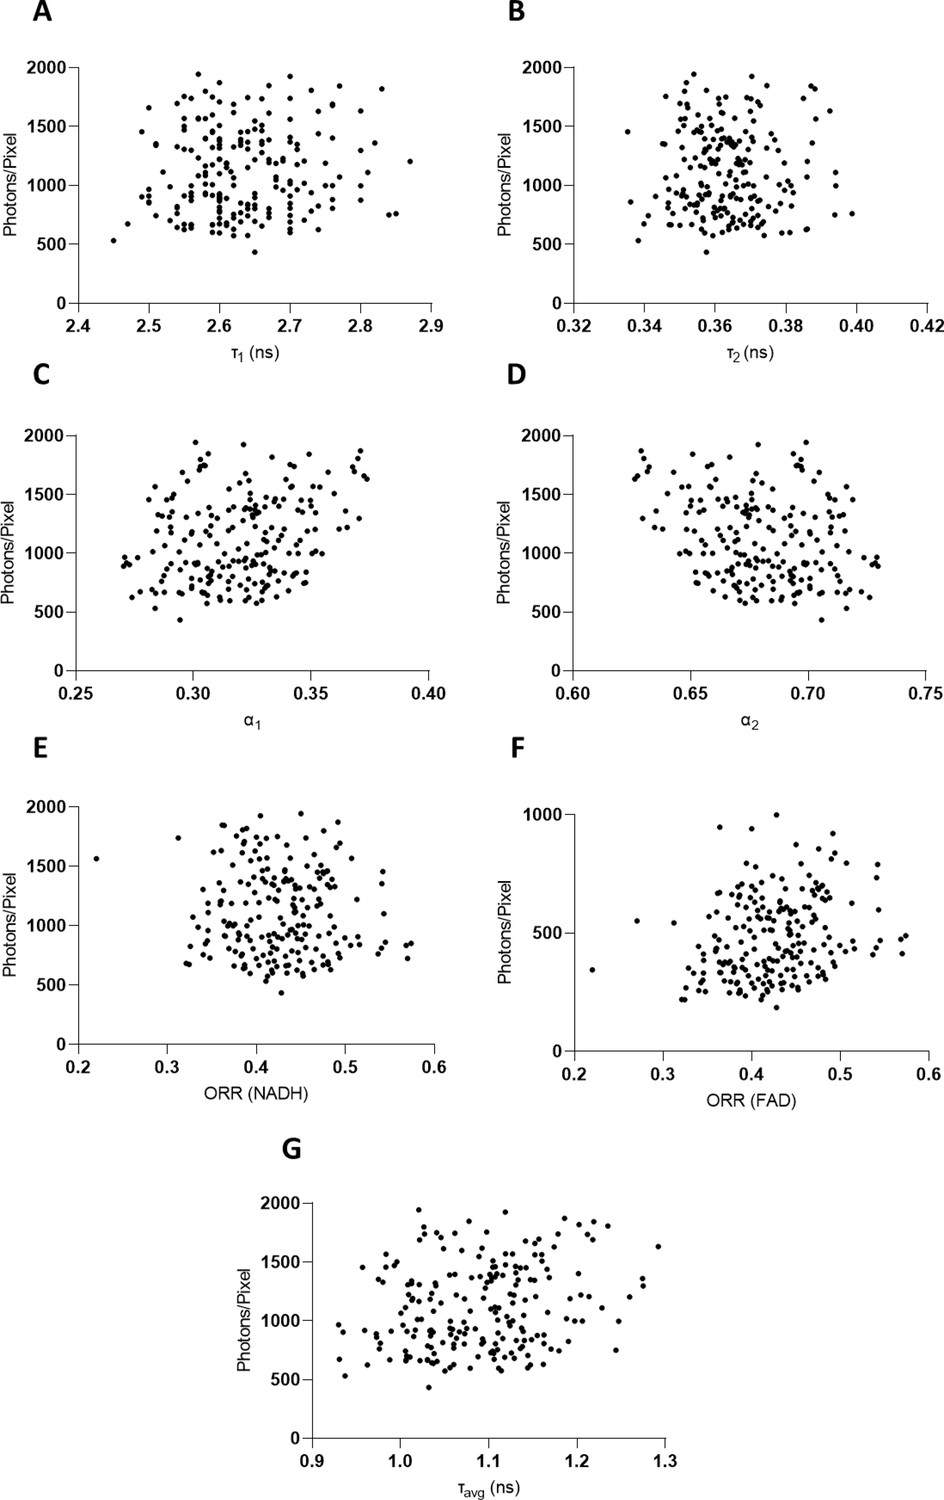
Dispersion plot distribution of photons/pixel per fluorescence lifetime variable value.
(A) τ1, (B) τ2, (C) α1, (D) α2, (E) optical redox ratio (ORR) distribution based on NADH results, (F) ORR distribution based on FAD results, and (G) τavg. These values are obtained after background removal.
-
Figure 3—figure supplement 6—source data 1
Dispersion plot distribution of photons/pixel per fluorescence lifetime variable value raw data.
- https://cdn.elifesciences.org/articles/77373/elife-77373-fig3-figsupp6-data1-v1.zip
Figure 4
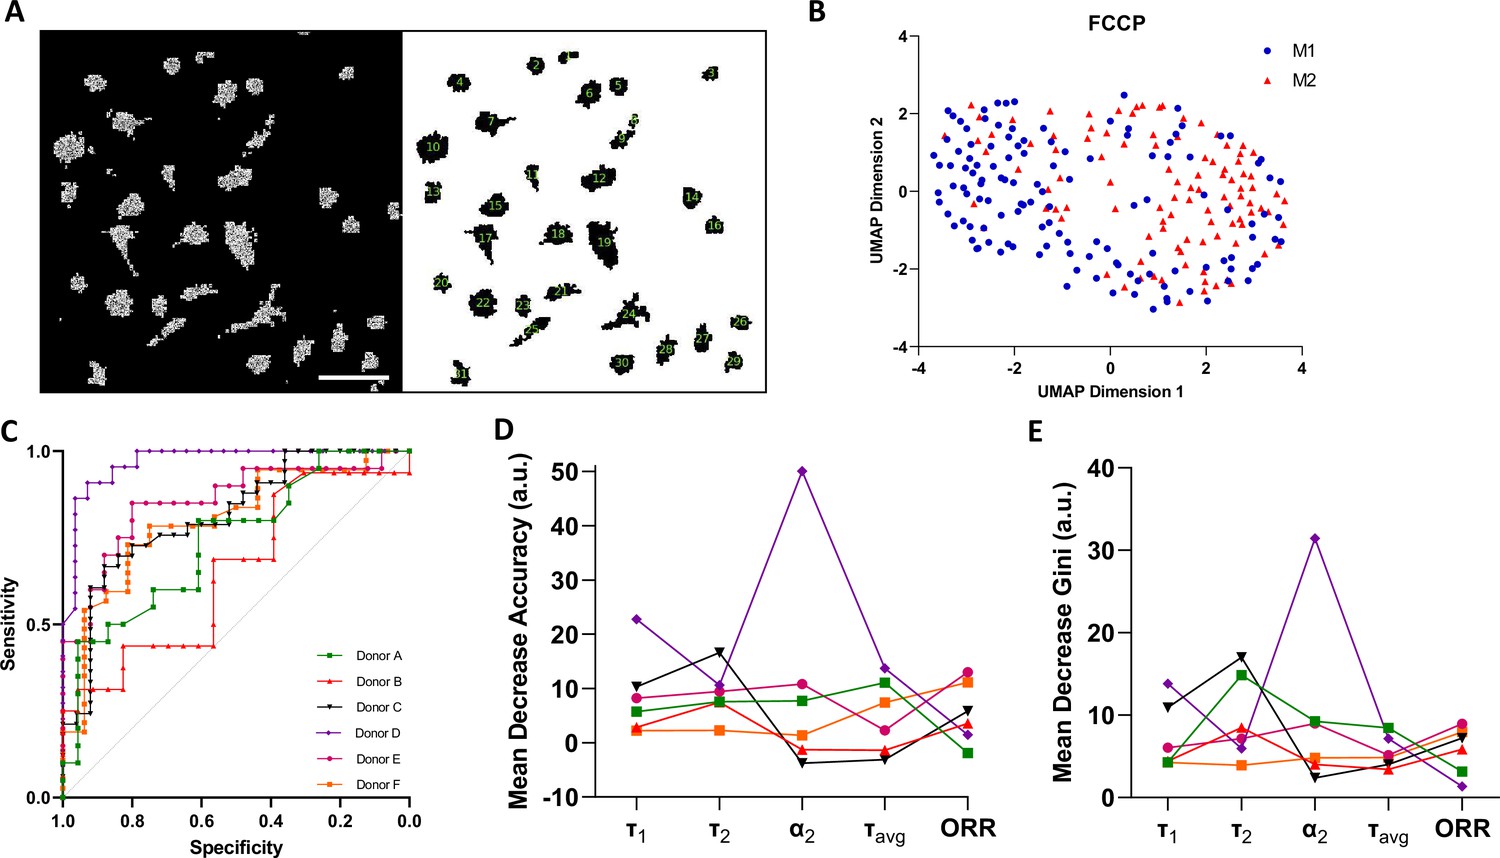
Single-cell two-photon fluorescence lifetime imaging microscopy (2P-FLIM) imaging analysis.
(A) Single-cell analysis using a custom-built Cell Profiler script, scale bar = 100 µm. (B) Single-cell Uniform Manifold Approximate and Projection (UMAP) visualisation of a representative donor after carbonyl cyanide-p-trifluoromethoxyphenylhydrazone (FCCP) treatment using 2P-FLIM variables. (C) Receiver operating characteristics curve (ROCs) of random forests models for classification of macrophages of all human donors used in this study. (D) Mean decrease in accuracy and (E) mean decrease in Gini of each 2P-FLIM variable returned by the random forests model.
-
Figure 4—source data 1
Image and single-cell segmentation cell profiler coding, single-cell fluorescence lifetime imaging microscopy (FLIM) variables measurement for each replicate, and machine learning input data and coding.
- https://cdn.elifesciences.org/articles/77373/elife-77373-fig4-data1-v1.zip
Tables
Table 1
Hyper-parameters, OBB, ROC-AUC, and confusion matrix of the trained random forests model.
| Donor (no. of data points) | ntree | mtry | OOB (%) | ROC-AUC | TP | FP | FN | TN |
|---|---|---|---|---|---|---|---|---|
| All donors – full FoV (36) | 100 | 2 | 16.67 | 0.944 | 16 | 2 | 4 | 14 |
-
ntree, number of trees; mtry, number of variables selected for the best split at each node; OBB, out-of-bag error; ROC-AUC, area under receiver operating characteristics curve; TP, true positive; FP, false positive; FN, false negative; TN, true negative.
Table 2
Hyper-parameters, OBB, ROC-AUC, and confusion matrix of donor-specific random forests models.
| Donor (no. of data points) | ntree | mtry | OOB (%) | ROC-AUC | TP | FP | FN | TN |
|---|---|---|---|---|---|---|---|---|
| A (170) | 100 | 4 | 24.41 | 0.740 | 39 | 18 | 13 | 57 |
| B (155) | 150 | 2 | 38.79 | 0.650 | 28 | 27 | 18 | 43 |
| C (232) | 250 | 3 | 32.18 | 0.813 | 67 | 29 | 27 | 51 |
| D (199) | 400 | 4 | 10.07 | 0.968 | 76 | 5 | 10 | 58 |
| E (179) | 250 | 1 | 19.40 | 0.854 | 58 | 9 | 17 | 50 |
| F (212) | 250 | 1 | 26.42 | 0.801 | 101 | 2 | 40 | 16 |
-
ntree, number of trees; mtry, number of variables selected for the best split at each node; OBB, out-of-bag error; ROC-AUC, area under receiver operating characteristics curve; TP, true positive; FP, false positive; FN, false negative; TN, true negative.
Table 3
Calculation of basal glycolysis, max glycolytic, basal respiration, and max respiration for ECAR/OCR experimental setup.
| Rate | Calculation |
|---|---|
| Basal glycolysis | Average ECAR values prior to oligomycin treatment – non-glycolytic ECAR |
| Max glycolysis | Average ECAR values after oligomycin and before FCCP treatment |
| Basal respiration | Average OCR values prior to oligomycin treatment – nonmitochondrial OCR |
| Max respiration | Average OCR values after FCCP and before rotenone/antimycin A treatment |
-
ECAR, extracellular acidification ratio; OCR, oxygen consumption ratio; FCCP, carbonyl cyanide-p-trifluoromethoxyphenylhydrazone.
Additional files
Download links
A two-part list of links to download the article, or parts of the article, in various formats.
Downloads (link to download the article as PDF)
Open citations (links to open the citations from this article in various online reference manager services)
Cite this article (links to download the citations from this article in formats compatible with various reference manager tools)
Non-invasive classification of macrophage polarisation by 2P-FLIM and machine learning
eLife 11:e77373.
https://doi.org/10.7554/eLife.77373


