MCMBP promotes the assembly of the MCM2–7 hetero-hexamer to ensure robust DNA replication in human cells
- Department of Chromosome Science, National Institute of Genetics, Research Organization of Information and Systems (ROIS), Japan
- Department of Chromosome Biology, Institute of Molecular Embryology and Genetics (IMEG), Kumamoto University, Japan
- Department of Genetics, The Graduate University for Advanced Studies (SOKENDAI), Japan
Figures
Figure 1 with 1 supplement
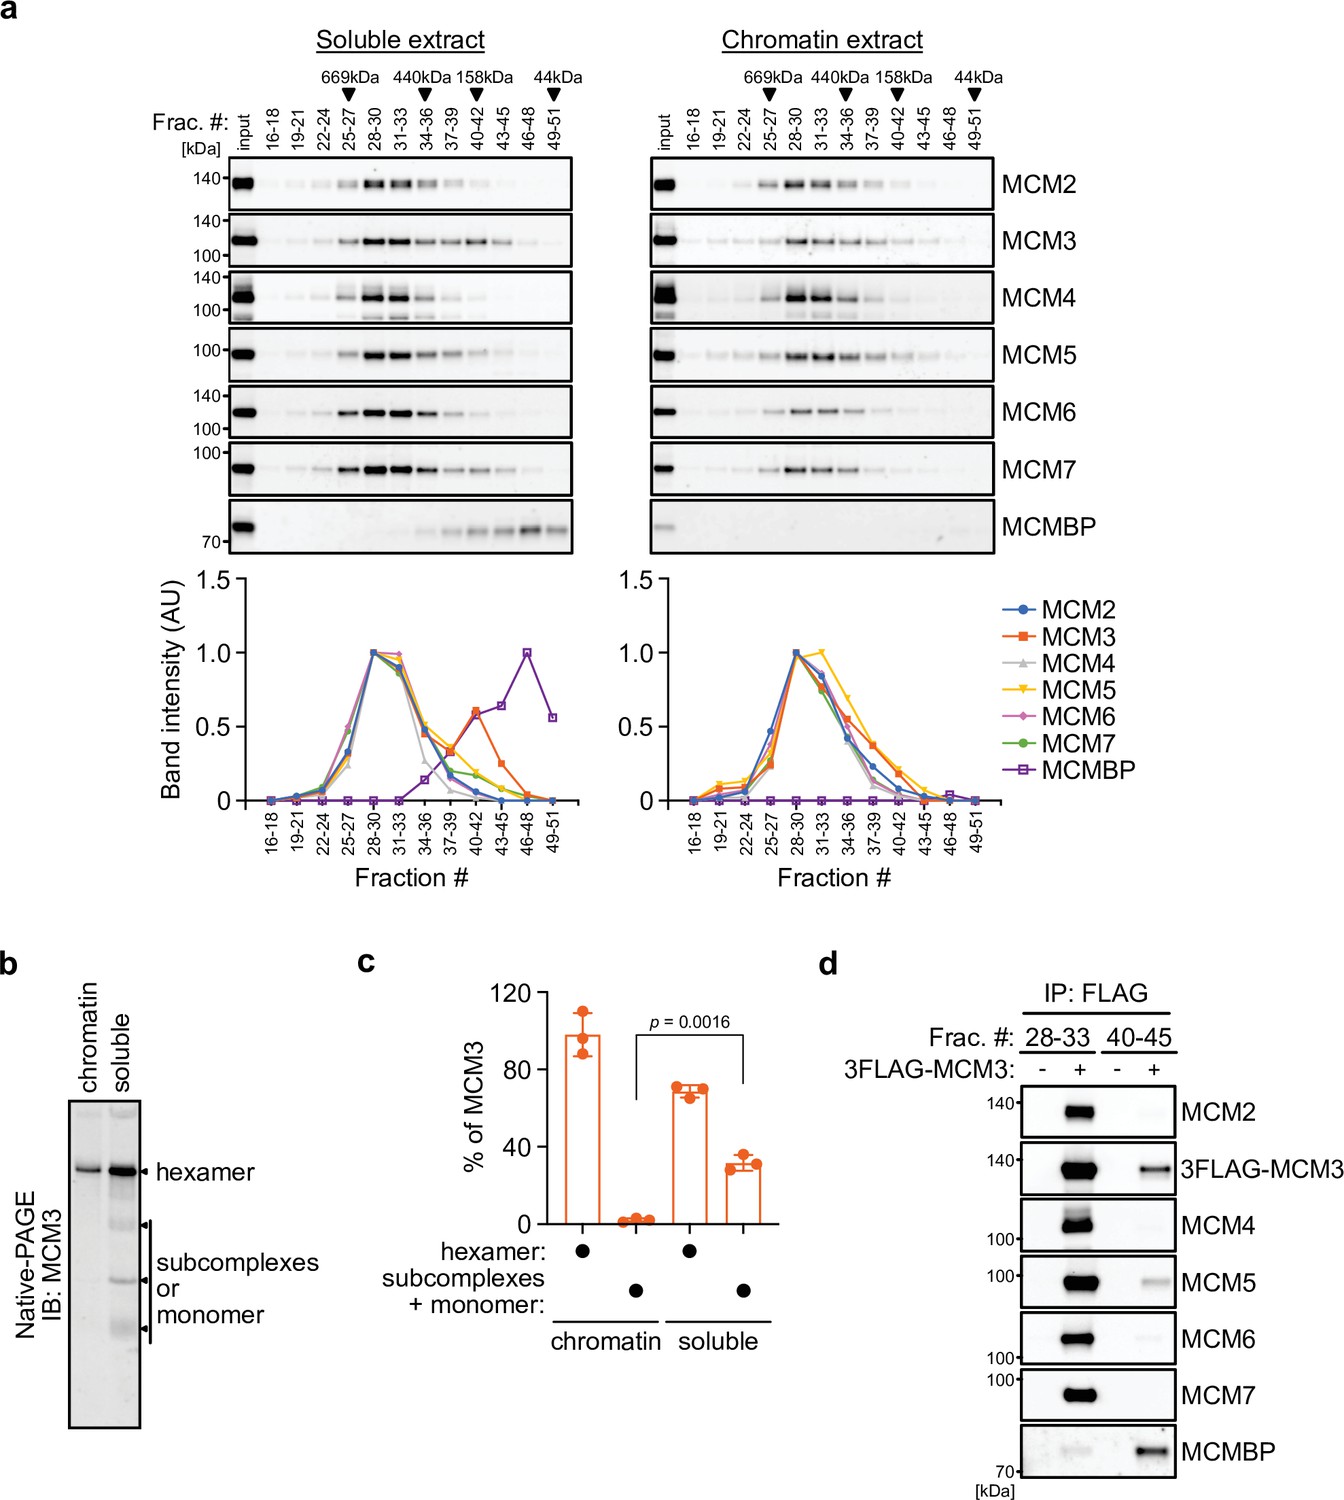
MCM3 associates with MCM-binding protein (MCMBP) in soluble extracts.
(a) Size distribution of the MCM proteins extracted from soluble and chromatin extracts. Estimated size (using thyroglobulin, 669 kDa; ferritin, 440 kDa; aldolase, 158 kDa; and ovalbumin, 44 kDa) is indicated on the top. The intensity of each band was quantified using ImageJ and is indicated as a relative value (max = 1.0) in the graphs shown below. (b, c) Native PAGE for detecting MCM3 in the MCM2–7 hexamer. Proteins were extracted from chromatin and soluble fractions and subjected to native PAGE for immunoblotting with an anti-MCM3 antibody. The intensity of the MCM3 signal was measured using the Image Lab 6.0.1 software (BioRad). The means of the intensities of three independent experiments are shown as relative values (total = 100%). The error bar represents the SD. p values were determined using one-way analysis of variance (ANOVA) with Tukey’s test. (d) Immunoprecipitation of MCM3 for detecting associating proteins in the large and small fractions. After gel filtration analysis, the indicated fractions (#28–33 or #40–45) were pooled and subjected to immunoprecipitation with an anti-FLAG antibody. Precipitated proteins were analyzed by immunoblotting using the indicated antibodies.
Figure 1—figure supplement 1
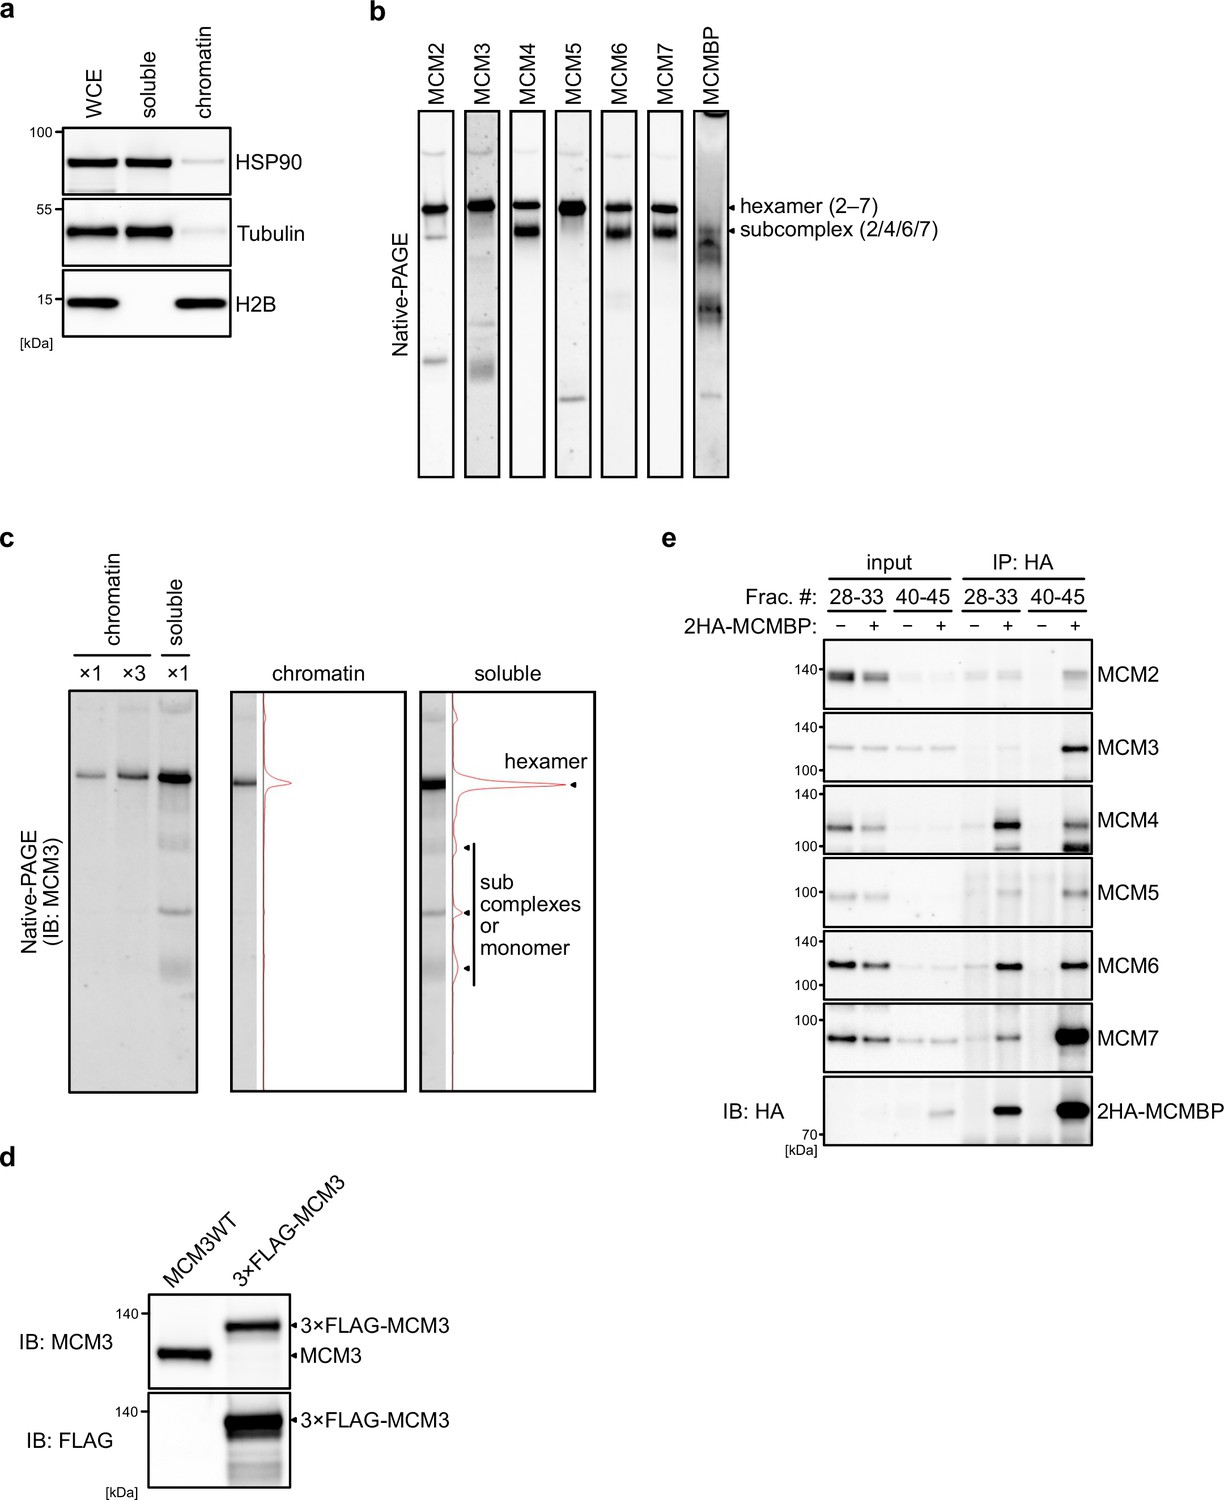
MCM-binding protein (MCMBP) associates with MCM3 and other MCM proteins.
(a) Extracts used for the size fractionation assays. HSP90 and Tubulin were used as soluble protein markers. Histone H2B was used for a chromatin protein marker. (b) All MCM proteins and MCM-binding protein (MCMBP) separated using native PAGE. Proteins in the soluble extracts were subjected to native PAGE, and the indicated proteins were detected by immunoblotting. (c) MCM3 in the soluble and chromatin extracts were separated by native PAGE and subjected to immunoblotting. Intensity of MCM3 signal was measured using Image Lab 6.0.1 software (BioRad). (d) The expression of the endogenous and FLAG-tagged MCM3 was confirmed by immunoblotting using the indicated antibodies. (e) MCMs interacting with MCMBP in the large and small fractions. Soluble extract prepared from cells expressing 2HA-MCMBP was fractionated as Figure 1a. Subsequently, the indicated fractions were pooled and used for HA immunoprecipitation. Precipitated proteins were analyzed by immunoblotting using the indicated antibodies.
Figure 2 with 1 supplement
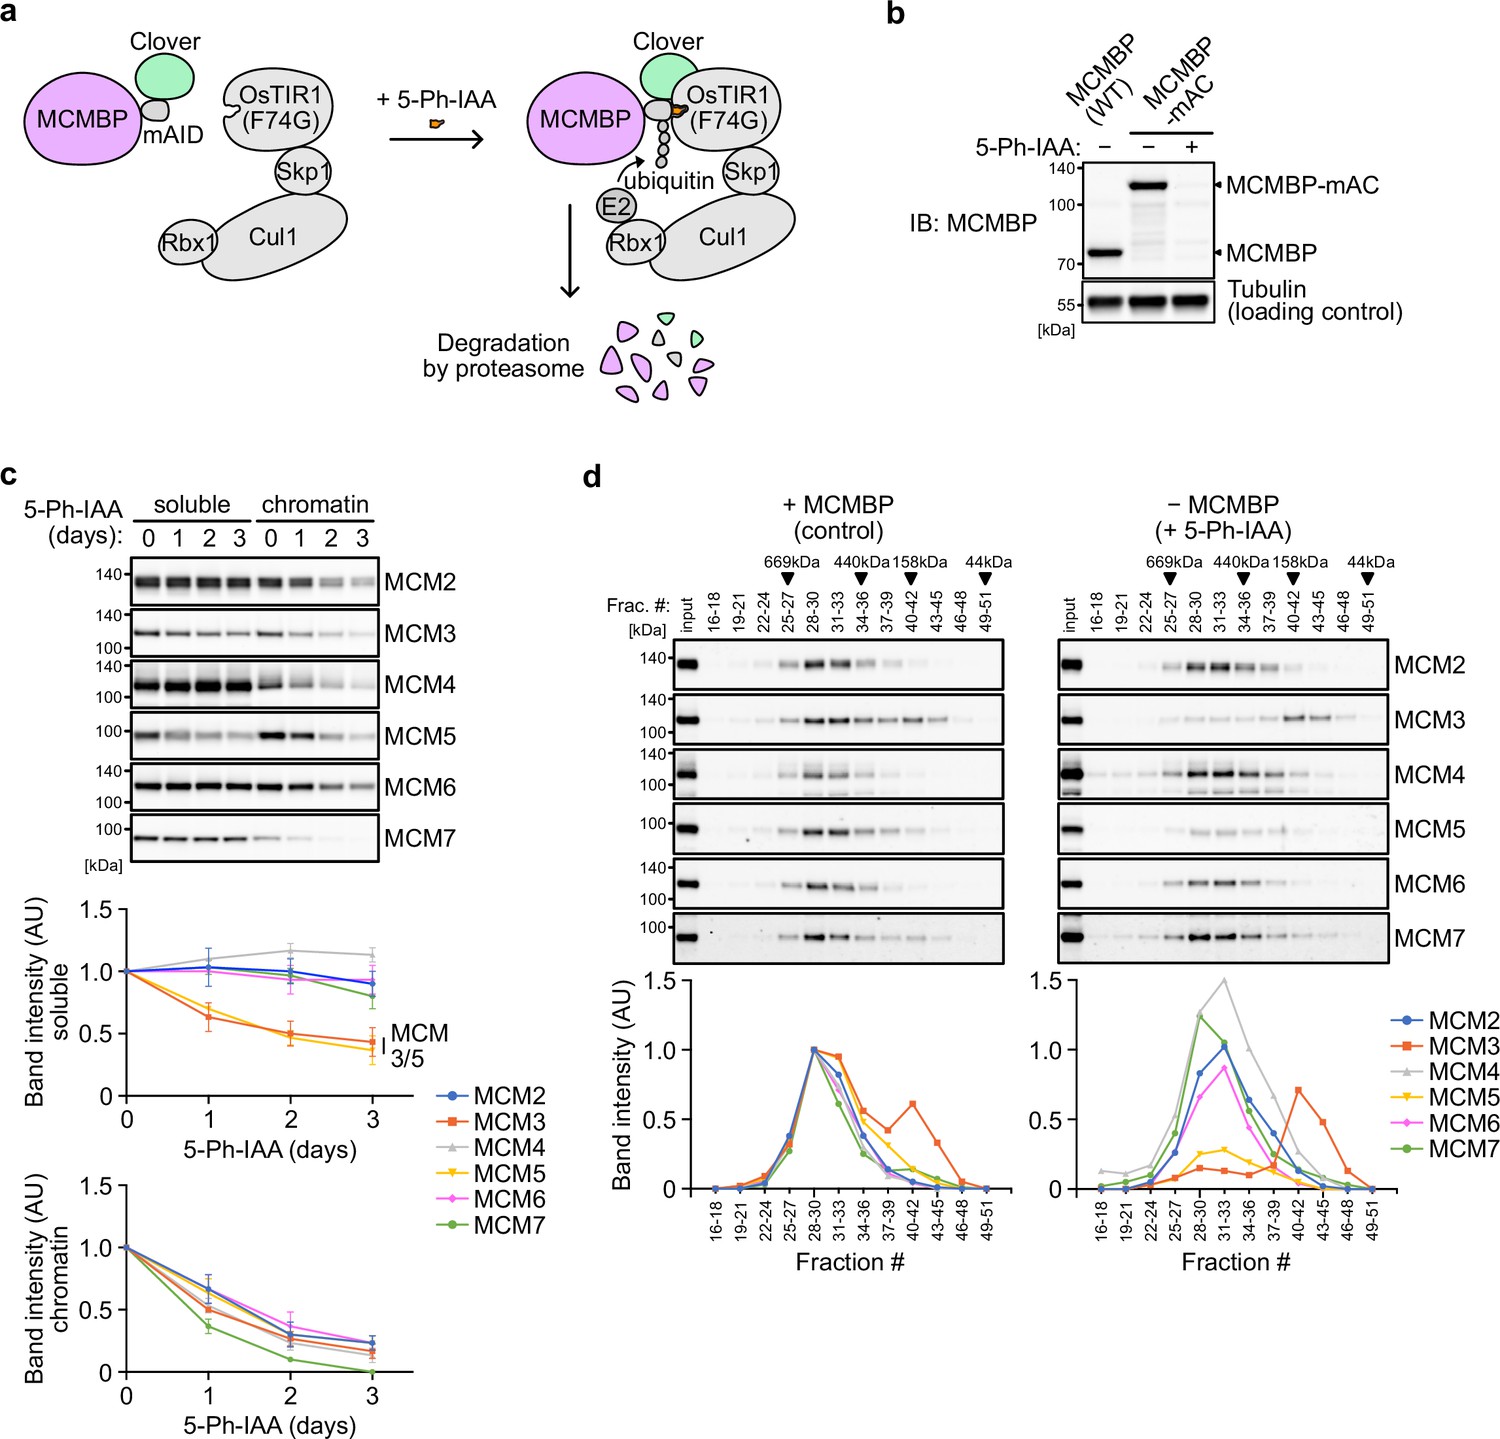
Depletion of MCM-binding protein (MCMBP) causes a defect in the formation of the MCM2–7 hexamer in the soluble extracts.
(a) Schematic illustration of MCMBP depletion by the AID2 system. Upon 5-Ph-IAA addition, mAID-Clover (mAC)-tagged MCMBP was recognized by OsTIR1(F74G) for degradation by the proteasome. (b) MCMBP-mAC was induced to degrade by the addition of 1 μM 5-Ph-IAA for 4 hr. MCMBP expression was analyzed by immunoblotting. (c) Protein levels of soluble- and chromatin-bound MCM2–7 after MCMBP depletion. Proteins were extracted from soluble and chromatin fractions on Days 1, 2, and 3 after MCMBP depletion. The intensity of each band was measured using ImageJ and is indicated as a relative value (Day 0 = 1.0) in the graphs. Data represent the mean ± standard deviation (SD) of three independent experiments. (d) Size distribution of the MCM proteins in soluble extracts after MCMBP depletion. Soluble extracts were prepared 2 days after MCMBP depletion and analyzed as in Figure 1a. The intensity of each band was quantified using ImageJ and is indicated as a relative value (max in control = 1.0) in the graphs.
Figure 2—figure supplement 1
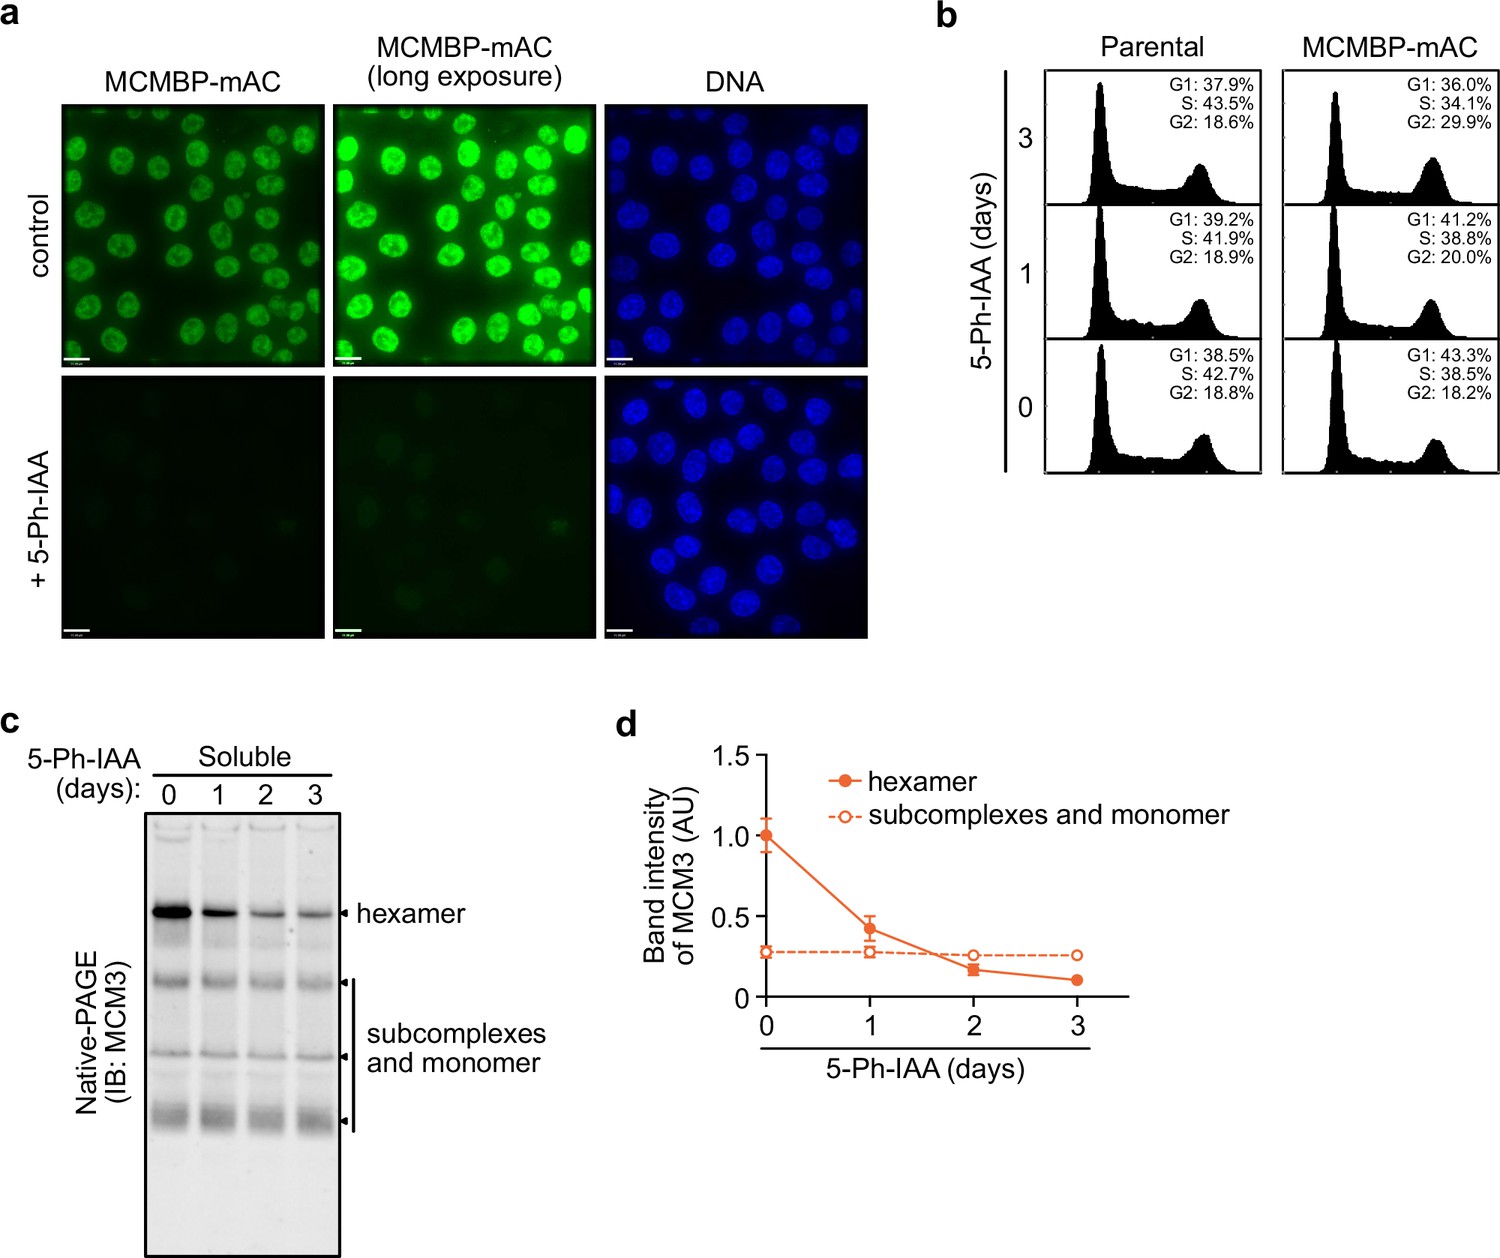
MCM-binding protein (MCMBP) depletion reduces the level of the MCM2–7 hexamer containing MCM3.
(a) Degradation of MCM-binding protein (MCMBP)-mAC was monitored by microscopy at 4 hr after the addition of 1 μM 5-Ph-IAA. (b) Cell-cycle distribution on Days 1, 2, and 3 after the addition of 1 μM 5-Ph-IAA. (c, d) MCM3 in the soluble extract was separated by native PAGE on Days 1, 2, and 3 after MCMBP depletion. Intensity of the MCM3 band at the hexamer size was measured using Image Lab 6.0.1 software (BioRad). The mean of intensities of three independent experiments was indicated as relative value (hexamer at 0 d = 1.0). Error bar represents SD.
Figure 3 with 1 supplement

The association between MCM3 and MCM-binding protein (MCMBP) is required for maintaining the level of the MCM2–7 hexamer and supporting cell proliferation.
(a) Illustration of the MCMBP truncations used in this study. NLS, nuclear localization signal; WB, Walker B; AF, arginine finger. (b) Interaction of MCMBP truncations with MCM3. HCT116 cells were transiently transfected with the HA-tagged MCMBP mutants and subjected to immunoprecipitation using an anti-HA antibody. Coprecipitated MCM3 was analyzed by immunoblotting. (c) Levels of the MCM2–7 hexamer in cells expressing the MCMBP mutants. The indicated MCMBP truncations were expressed in MCMBP-mAC cells; subsequently, MCMBP-mAC was depleted before preparation of the soluble extracts. Proteins were separated using native PAGE and detected using the indicated antibodies. Tubulin was used as a loading control. (d) The MCM2–7 hexamer in the cells expressing the indicated MCMBP truncation. The intensity of the MCM3 signal within the hexamer was quantified using the Image Lab 6.0.1 software (BioRad). The mean of the intensities of three independent experiments is indicated as a relative value (hexamer in control = 1.0). The error bar represents the SD. p values were determined using one-way analysis of variance (ANOVA) with Tukey’s test. (e) Growth curves were obtained every 2 days after the addition of 1 μM 5-Ph-IAA. Data represent the mean ± standard deviation (SD) of three independent experiments (Day 0 = 100).
Figure 3—figure supplement 1
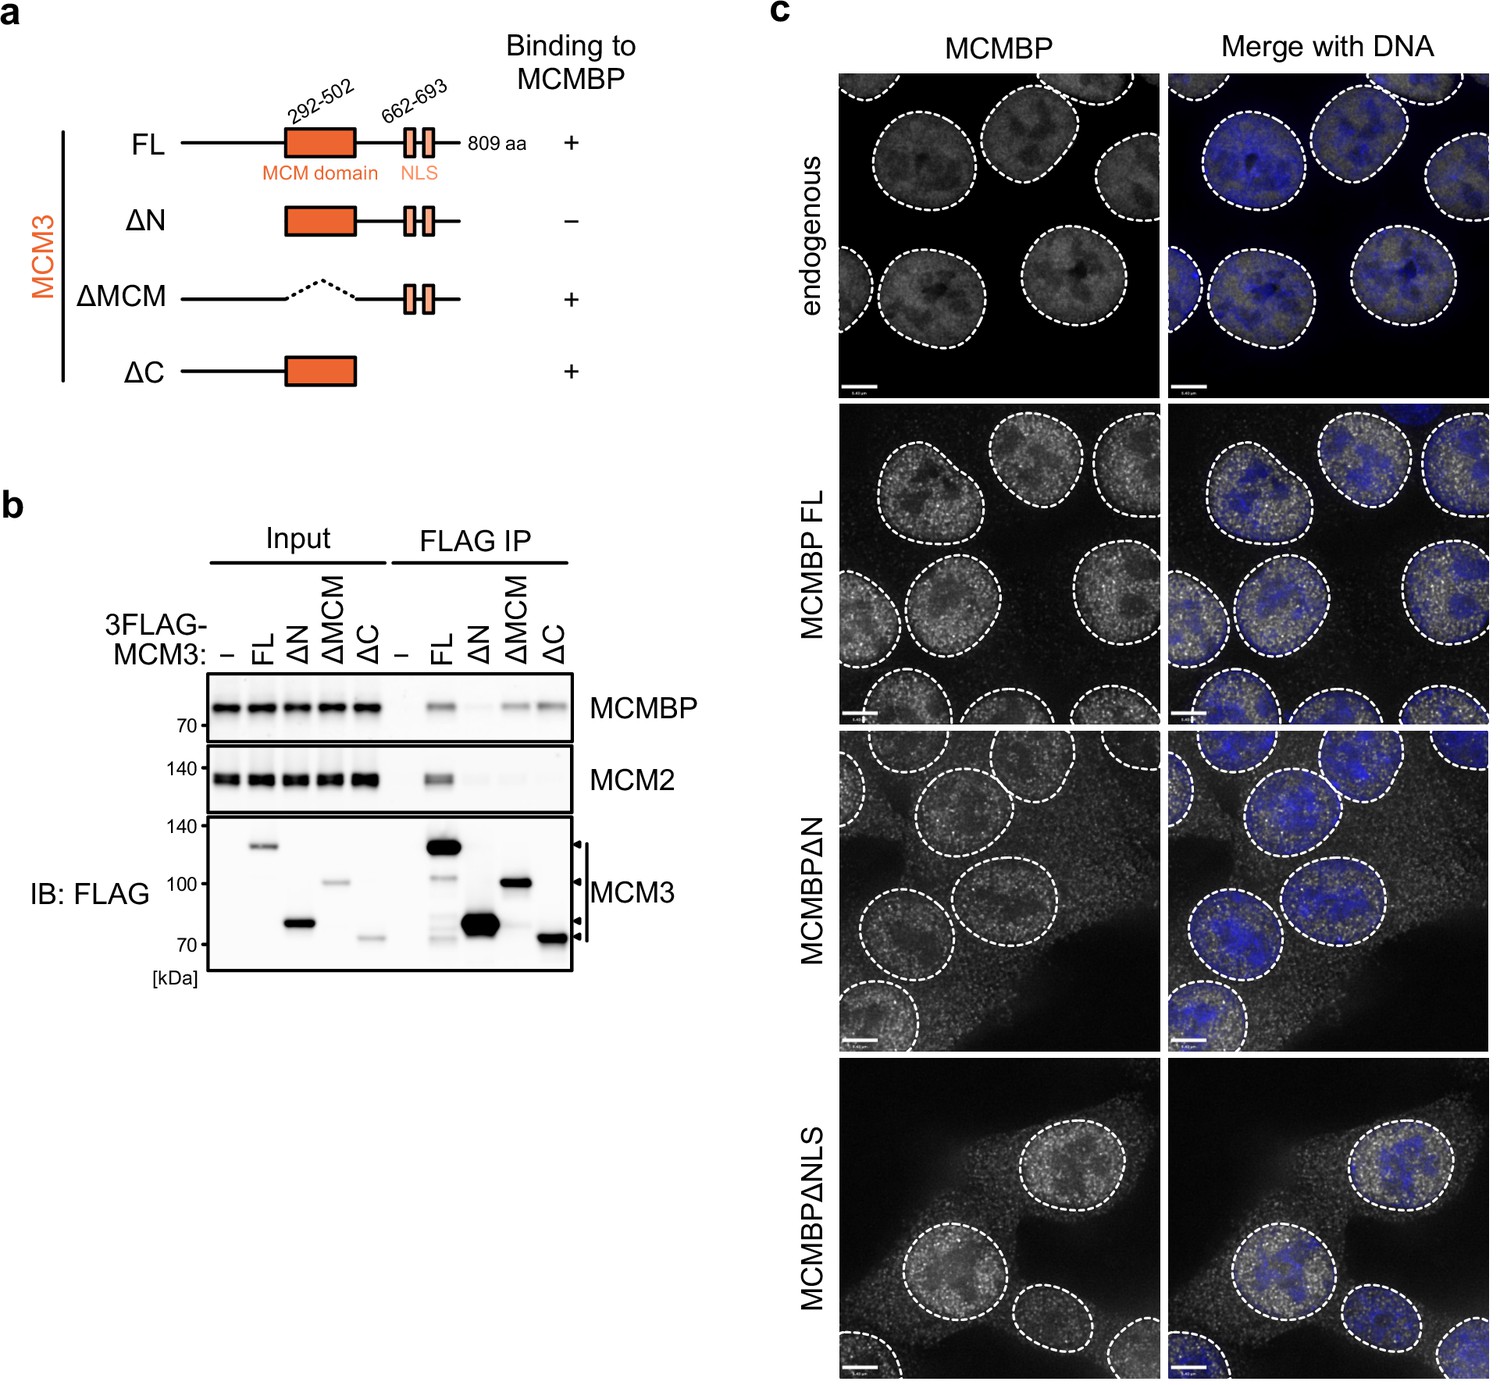
The association between MCM3 mutants and MCM-binding protein (MCMBP).
(a) Representation of the MCM3 truncates. (b) Interaction of the MCM3 truncates with MCM-binding protein (MCMBP). FLAG-tagged MCM3 truncates were expressed and subjected to immunoprecipitation using FLAG antibody. Coprecipitated MCMBP and MCM2 (as a control) were detected by immunoblotting. (c) Subcellular distribution of the MCMBP mutants were captured using a Delta Vision microscope.
Figure 4 with 2 supplements
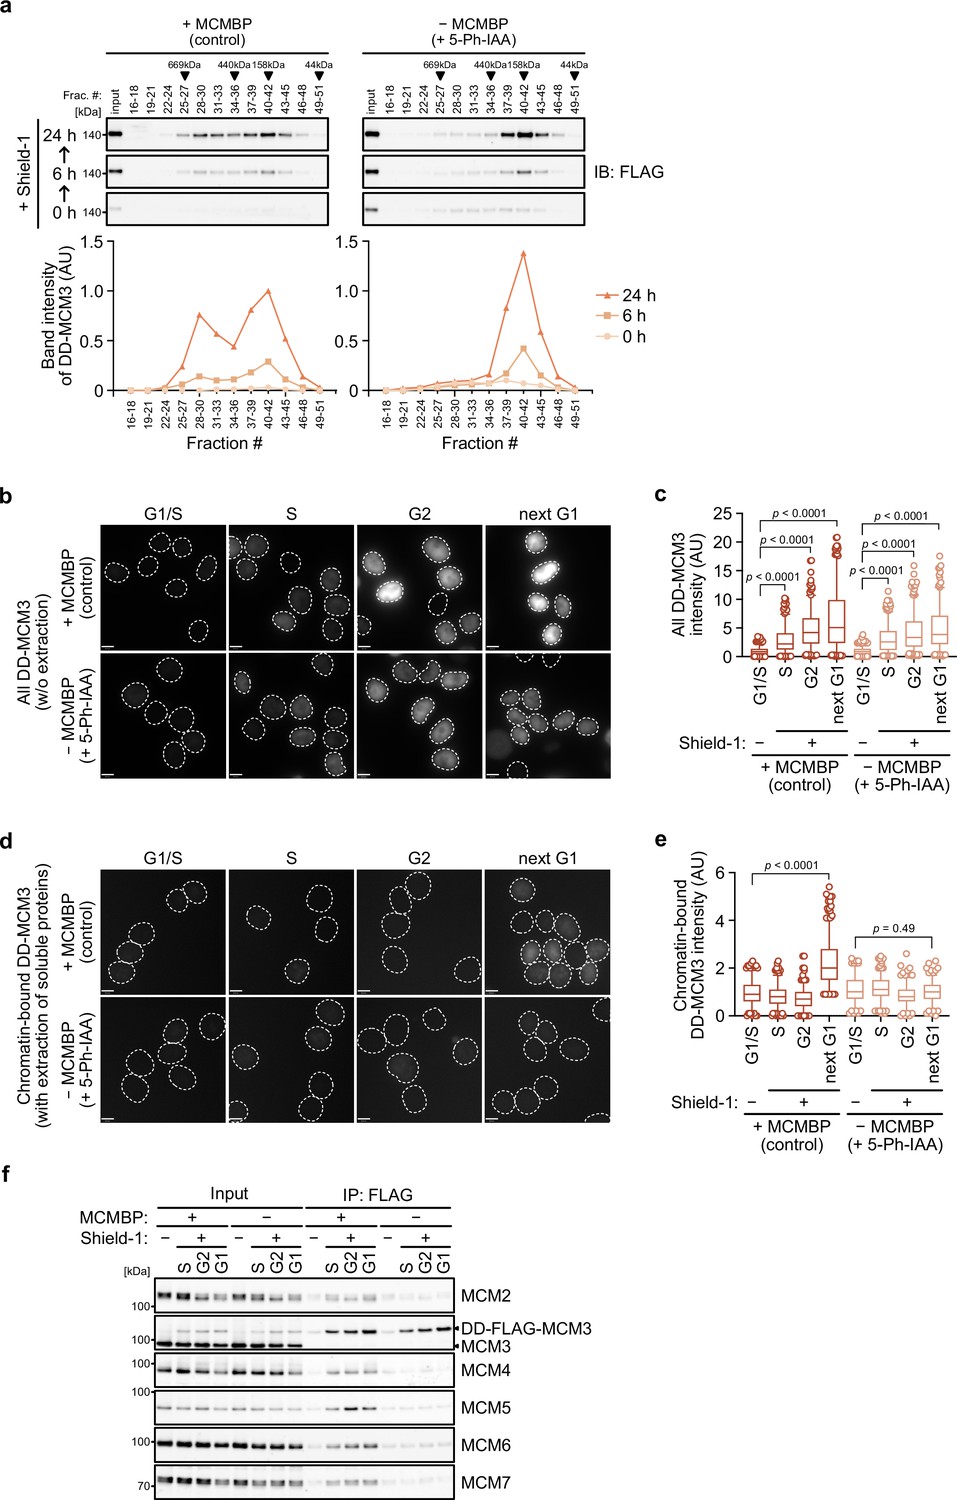
MCM-binding protein (MCMBP) promotes MCM2–7 assembly using nascent MCM3.
(a) Size distribution of DD-FLAG-MCM3 in the presence or absence of MCMBP. Proteins were extracted and analyzed by immunoblotting at 6 or 24 hr after the addition of 0.5 μM Shield-1 with or without 1 μM 5-Ph-IAA. The intensity of each band was measured using ImageJ and is indicated as a relative value (max in control = 1.0) in the graphs. (b, c) Total DD-mScarletI-MCM3 after the addition of 0.5 μM Shield-1 was detected using a Delta Vision microscope. Circles with a dotted line indicate the nucleus. In the graphs, the central lines are medians. The boxes represent 25th and 75th percentiles, and the whiskers represent 5th and 95th percentiles. n > 200 cells per condition. AU, arbitrary units. p values were determined using one-way analysis of variance (ANOVA) with Turkey’s test. (d, e) Chromatin-bound DD-mScarletI-MCM3 was visualized after the extraction of soluble proteins. Circles with a dotted line indicate the nucleus. The data were quantified and presented as in panel c. (f) Interaction of DD-FLAG-MCM3 with other MCM proteins. After immunoprecipitation using an anti-FLAG antibody, the indicated proteins were detected by immunoblotting.
Figure 4—figure supplement 1
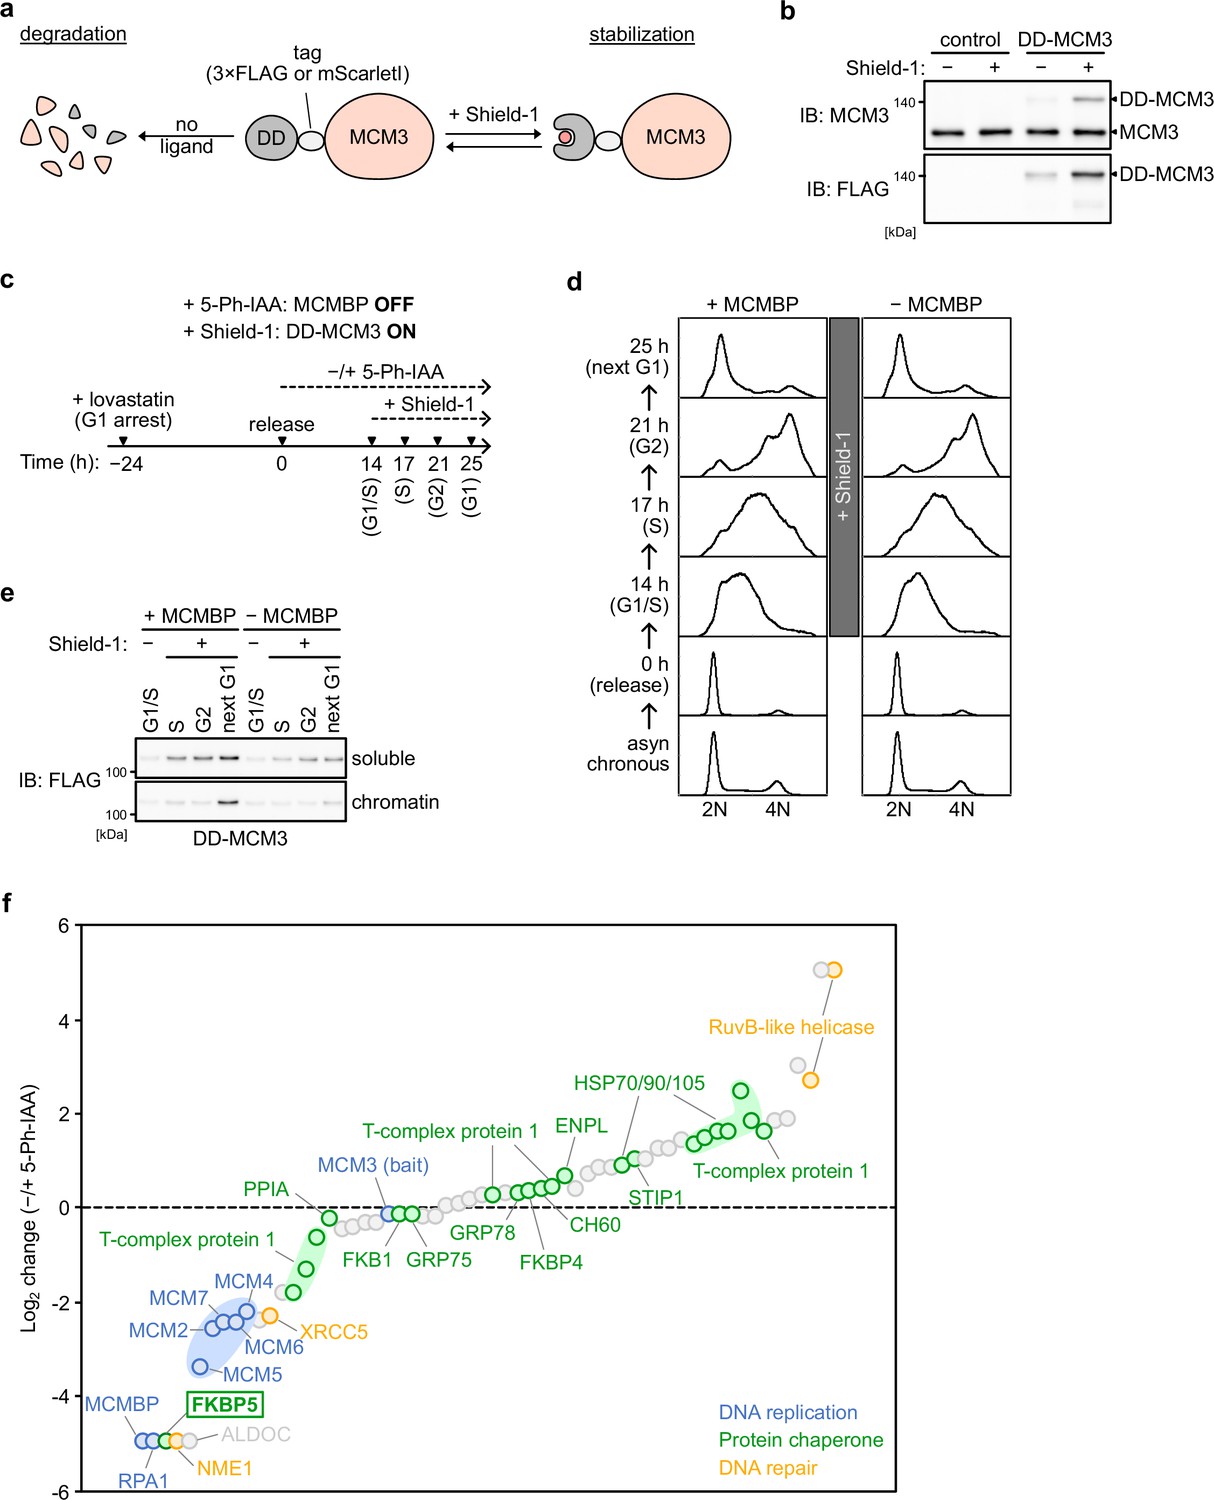
MCM-binding protein (MCMBP) promotes the loading of MCM2–7 containing nascent MCM3.
(a) Schematic illustration of the DD-MCM3 system. Ectopic expression of DD-(FLAG or mScarletI)-MCM3 was stabilized in the presence of a ligand, Shield-1. Without Shield-1, the fusion protein is degraded. (b) Expression of the DD-MCM3 was confirmed by immunoblotting using anti-MCM3 and -FLAG antibodies. (c) Experimental scheme in Figure 4b–f. (d) Cell-cycle progression of the cell used in Figure 4b–f. After releasing from G1 synchronization using lovastatin, 0.5 μM Shield-1 was added at 14 hr for expressing DD-MCM3. (e) Expression and chromatin association of DD-MCM3. Synchronized cells were released into medium containing 1 μM 5-Ph-IAA for MCMBP-depletion. DD-MCM3 was expressed by adding Shield-1. Proteins were extracted from soluble and chromatin fractions at 17, 21, or 25 hr after release for S, G2, or next G1 phase, respectively, and then analyzed by immunoblotting using anti-FLAG antibodies. (f) Mass spectrometry analysis of DD-MCM3-binding proteins with or without MCMBP. The log2 change of PSM (peptide-spectrum match) of the detected proteins was calculated. Among MCM3-binding proteins, all other MCM proteins, PRA1, and FKBP5 interacted with DD-MCM3 in an MCMBP-dependent manner.
Figure 4—figure supplement 2
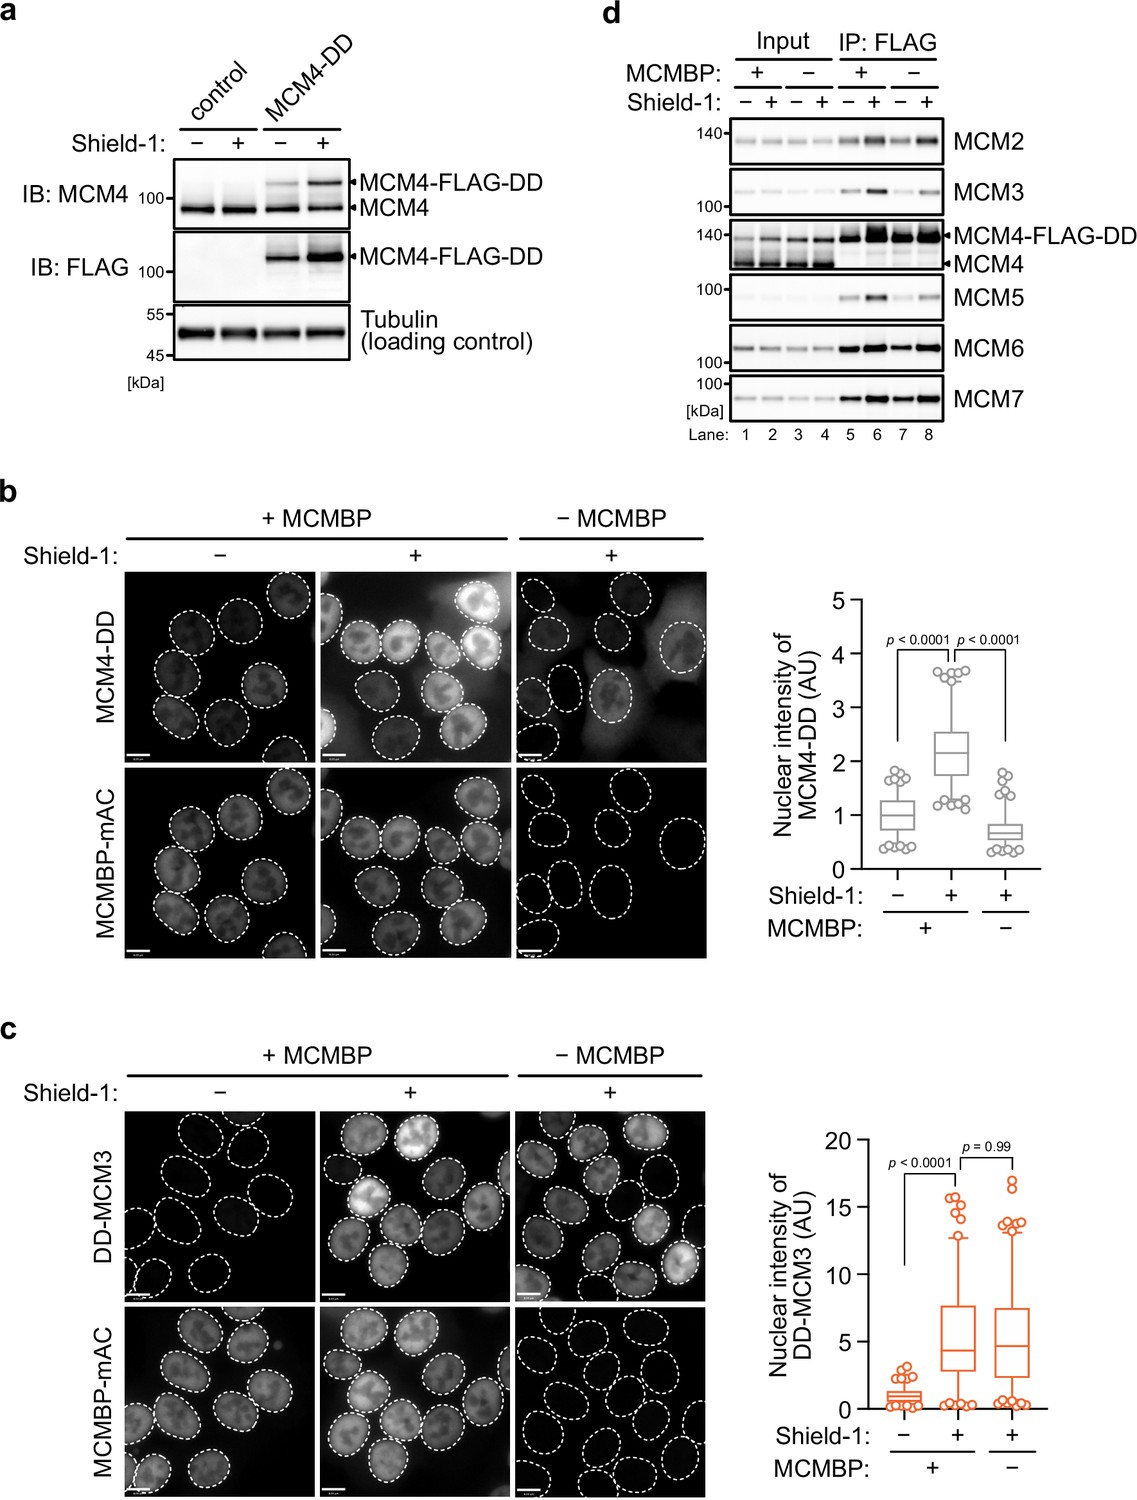
The nuclear transport of nascent MCM4, but not that of nascent MCM3, depends on MCM-binding protein (MCMBP).
(a) The expression of the MCM4-DD was confirmed by immunoblotting using the indicated antibodies. Subcellular localization of MCM4-DD (b) and DD-MCM3 (c) with or without 1 μM of 5-Ph-IAA. In the graphs, center lines are medians. The boxes represent 25th and 75th centiles, and the whiskers represent 5 and 95 percentiles. n > 100 cells per condition. AU; arbitrary units. The p values were determined by one-way analysis of variance (ANOVA) with Turkey’s test.
Figure 5 with 1 supplement
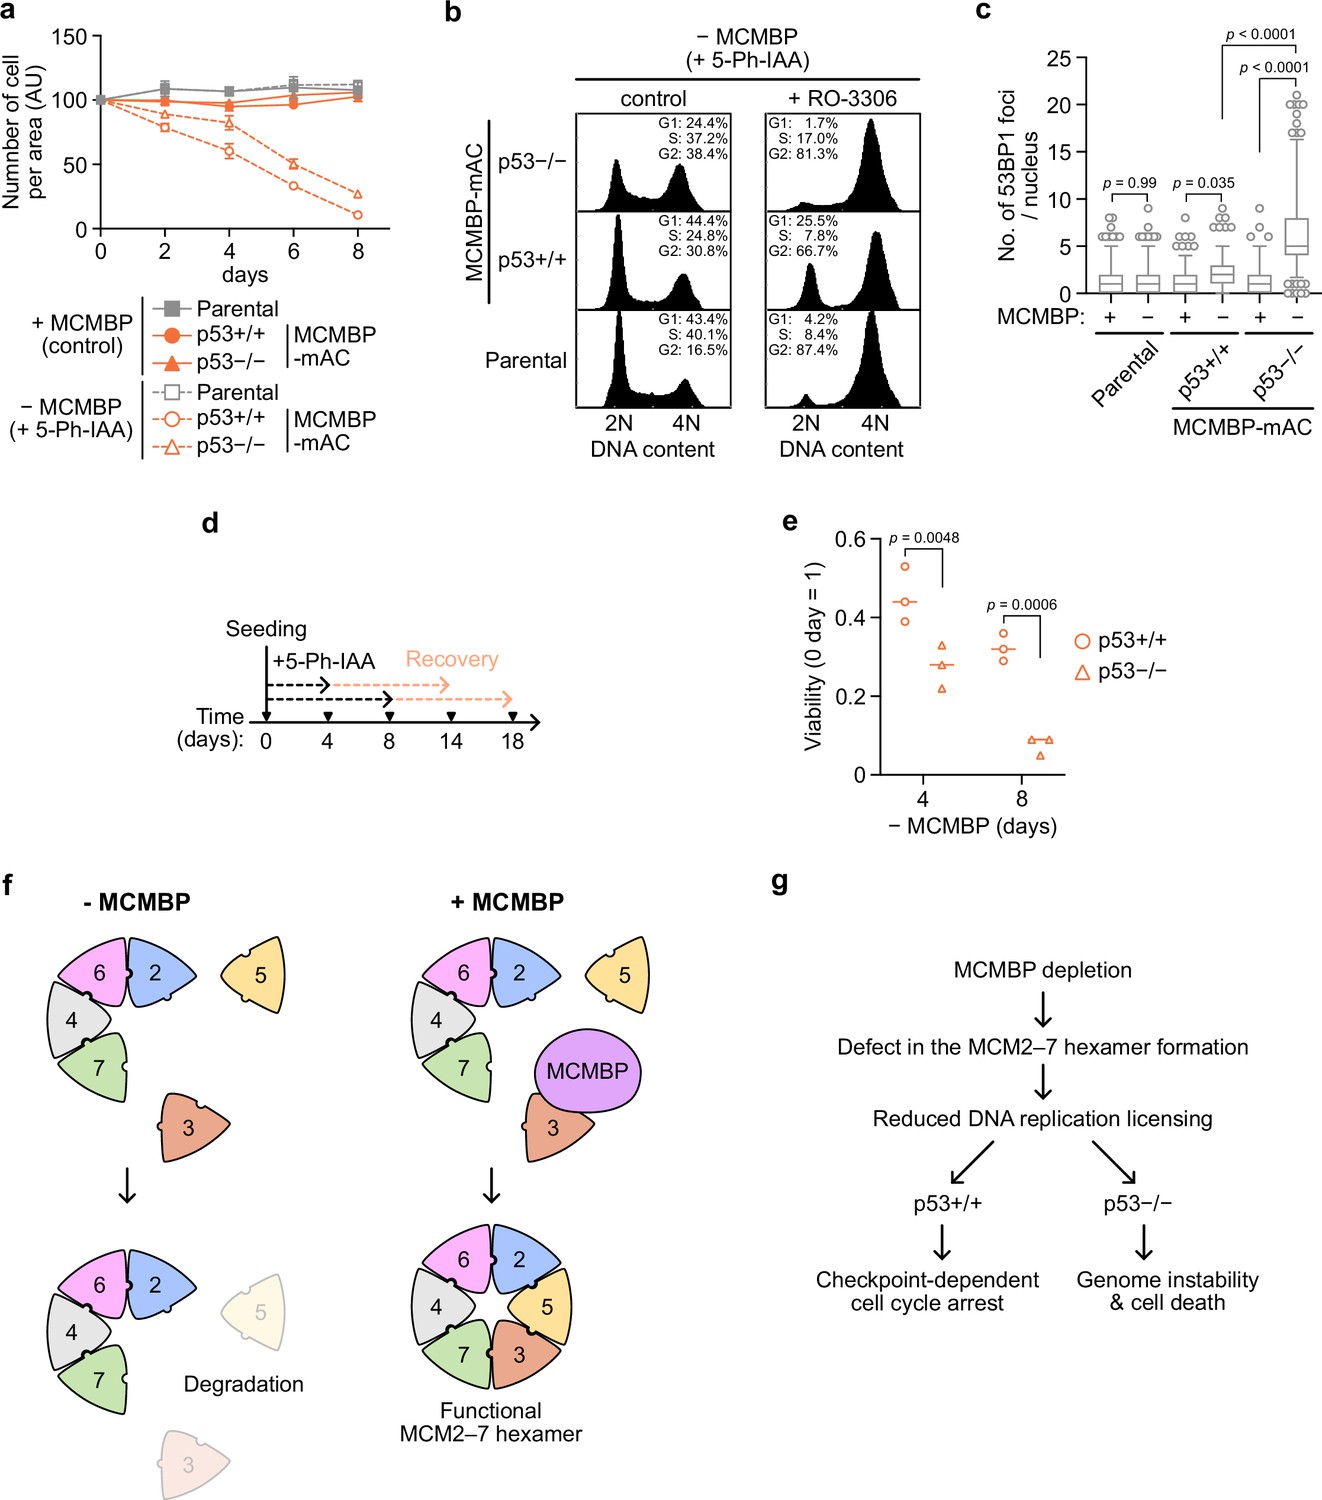
p53-negative cells lose cell viability after MCMBP depletion.
(a) The growth of the indicated cell lines was measured every 2 days after the addition of 1 μM 5-Ph-IAA. Data represent the mean ± standard deviation (SD) of three independent experiments (Day 0 = 100). (b) Cell-cycle distribution on Day 8 after the addition of 1 μM 5-Ph-IAA. RO-3306 was added to the culture medium at 16 hr before fixation. (c) Quantification of 53BP1 foci on Day 5 after the addition of 1 μM 5-Ph-IAA. In the graphs, the central lines are medians. The boxes represent 25th and 75th percentiles, and the whiskers represent 5th and 95th percentiles. n > 200 cells per condition. p values were determined using one-way analysis of variance (ANOVA) with Turkey’s test. (d, e) Cell viability after the temporal depletion of MCMBP was determined using colony formation assay. Two hundred cells were plated and cultured for 4 or 8 days in the presence of 1 μM 5-Ph-IAA, and then released into medium without 5-Ph-IAA. The plating efficiency is shown as a relative value (Day 0 = 1). Data represent the mean of three independent experiments. p values were determined using two-way ANOVA with Šídák’s test. Model of MCM2–7 hexamer formation mediated by MCMBP (f) and the phenotypes induced after MCMBP depletion (g).
Figure 5—figure supplement 1
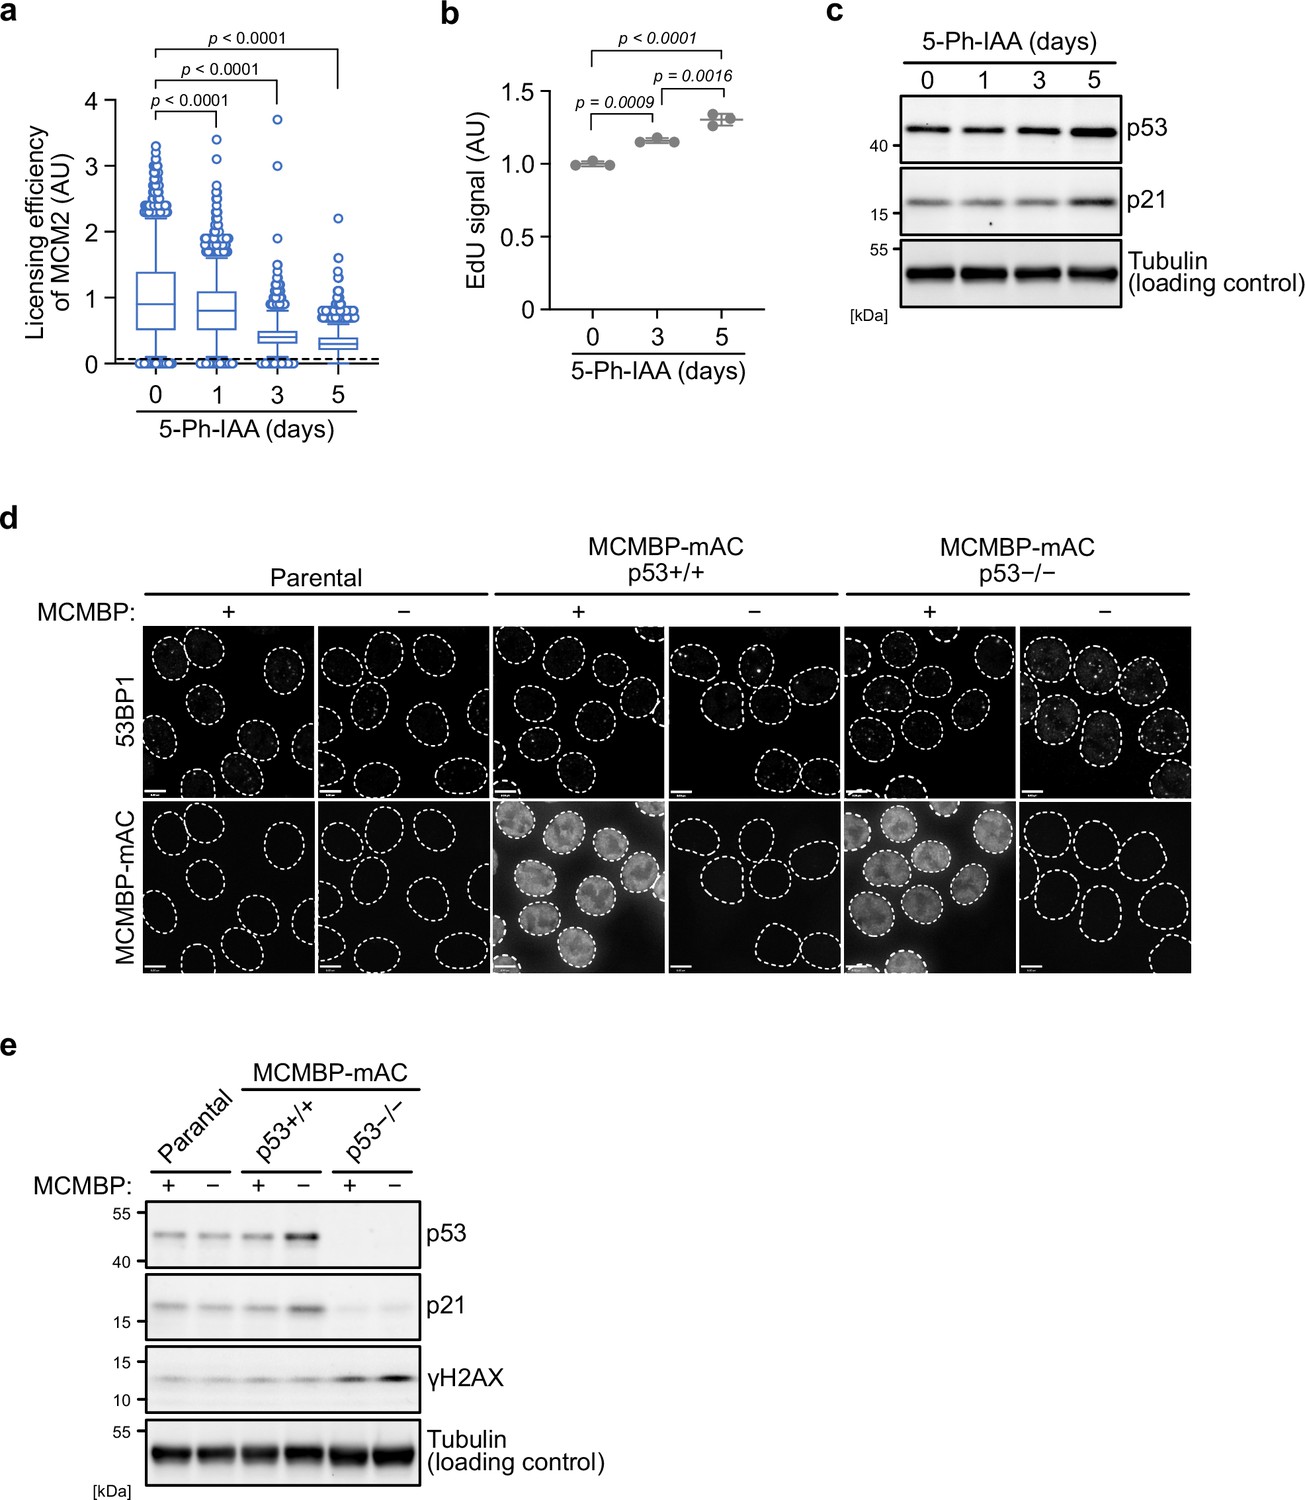
The p53 checkpoint prevents DNA damage accumulation after the depletion of MCM-binding protein (MCMBP).
(a) Chromatin-bound MCM2 after MCM-binding protein (MCMBP) depletion to monitor the levels of replication licensing. Soluble proteins were extracted before staining with anti-MCM2 antibody. The chromatin-bound MCM2 was detected using a BD Accuri C6 flow cytometer. 50,000 cells were analyzed for each sample. The p values were determined by one-way analysis of variance (ANOVA) with Turkey’s test. (b) EdU incorporation after MCMBP depletion. The MCMBP-mAC cells were treated with 1 μM 5-Ph-IAA for 3 or 5 days, and incubated with 10 μM EdU for 30 min. After staining the cell using the Click-iT kit, the incorporated EdU was detected by a BD Accuri C6 flow cytometer. 50,000 cells were analyzed for each sample. (c) The levels of p53 and p21 after MCMBP depletion. The indicated antibodies were used for immunoblotting. (d) 53BP1 foci after MCMBP depletion. The MCMBP-mAC cells were treated with 1 μM 5-Ph-IAA for 5 days, and then immunostained with anti-53BP1 antibody. (e) The H2AX phosphorylation after MCMBP depletion was detected by immunoblotting using anti-γH2AX antibody.
Tables
Table 1
Cell lines used in this study.
| Figure | Cell line |
|---|---|
| Figure 1d | HCT116 CMV-OsTIR1F74G Stag-3FLAG-MCM3 |
| Figure 2b–d | HCT116 CMV-OsTIR1F74G MCMBP-mAC |
| Figure 3c–e, Figure 1—figure supplement 1e | HCT116 CMV-OsTIR1F74G MCMBP-mAC 2HA-MCMBP FL |
| Figure 3c–e | HCT116 CMV-OsTIR1F74G MCMBP-mAC 2HA-MCMBPΔN |
| Figure 3c–e | HCT116 CMV-OsTIR1F74G MCMBP-mAC 2HA-MCMBPΔNLS |
| Figure 4a and f | HCT116 CMV-OsTIR1F74G MCMBP-mAC PiggyBac-EF1-DD-3FLAG-MCM3 |
| Figure 4b–e | HCT116 CMV-OsTIR1F74G MCMBP-mAC PiggyBac-EF1-DD-mScarletI-MCM3 |
| Figure 5a–e | HCT116 CMV-OsTIR1F74G MCMBP-mAC p53−/− |
| Figure 4—figure supplement 2a, d | HCT116 CMV-OsTIR1F74G MCMBP-mAC PiggyBac-EF1-MCM4-3FLAG-DD |
| Figure 4—figure supplement 2b | HCT116 CMV-OsTIR1F74G MCMBP-mAC PiggyBac-EF1-MCM4-mScarletI-DD |
Table 2
Plasmids used in this study.
| Figure | Plasmid |
|---|---|
| Figure 1d | MCM3-N-tagging CRISPR in pX330 |
| Figure 1d | Stag-3FLAG-N-MCM3 donor |
| Figure 2b | MCMBP-C-tagging CRISPR in pX330 |
| Figure 2b | MCMBP-C-tagging CRISPR in pX330 |
| Figure 3a, b | CMV-2HA-MCMBP FL |
| Figure 3a, b | CMV-2HA-MCMBPΔN |
| Figure 3a, b | CMV-2HA-MCMBPΔNLS |
| Figure 3a, b | CMV-2HA-MCMBPΔmid |
| Figure 3a, b | CMV-2HA-MCMBPΔC |
| Figure 3c–e, Figure 1—figure supplement 1e | Piggy–Bac-EF1-2HA-MCMBP FL |
| Figure 3c–e | PiggyBac-EF1-2HA-MCMBPΔN |
| Figure 3c–e | PiggyBac-EF1-2HA-MCMBPΔNLS |
| Figure 4a, f | PiggyBac-EF1-DD-3FLAG-MCM3 |
| Figure 4b–e | PiggyBac-EF1-DD-mScarletI-MCM3 |
| Figure 5a–e | TP53-KO CRISPR in pX330 |
| Figure 3—figure supplement 1a, b | TP53-KO CRISPR in pX330 |
| Figure 3—figure supplement 1a, b | PiggyBac-EF1-3FLAG-MCM3 FL |
| Figure 3—figure supplement 1a, b | PiggyBac-EF1-3FLAG-MCM3ΔN |
| Figure 3—figure supplement 1a, b | PiggyBac-EF1-3FLAG-MCM3ΔMCM |
| Figure 4—figure supplement 2a, d | PiggyBac-EF1-3FLAG-MCM3ΔC |
| Figure 4—figure supplement 2b | PiggyBac-EF1-MCM4-3FLAG-DD |
Table 3
Antibodies used in this study.
| Antigen | Manufacturer | Code | Method(s) | Dilution(s) |
|---|---|---|---|---|
| MCM2 | CST | 3619 | IB and IF | 1:10,000 for IB; 1:1000 for IF |
| MCM3 | Proteintech | 15597-1-AP | IB | 1:5000 |
| MCM4 | Abcam | ab4459 | IB | 1:5000 |
| MCM5 | Proteintech | 11703-1-AP | IB | 1:3000 |
| MCM6 | Proteintech | 13347-2-AP | IB | 1:5000 |
| MCM7 | Proteintech | 11225-1-AP | IB | 1:5000 |
| MCMBP | Proteintech | 19573-1-AP | IB | 1:5000 |
| FLAG | SIGMA | F1804 | IB | 1:10,000 |
| HA | MBL | M132-3 | IB | 1:5000 |
| HSP90 | Proteintech | 60,318 | IB | 1:5000 |
| Tubulin | BioRad | 12004165 | IB | 1:10,000 |
| histone H2B | Abcam | ab1790 | IB | 1:10,000 |
| p53 | MBL | K0181-3 | IB | 1:5000 |
| p21 | CST | 2946 | IB | 1:3000 |
| gH2AX | Millipore | 05-636 | IB | 1:3000 |
| anti-rabbit IgG | Abcam | ab216773 | IB | 1:3000 |
| anti-mouse IgG | Abcam | ab216772 | IB | 1:3000 |
| anti-mouse IgG | BioRad | 12004158 | IB | 1:3000 |
| anti-rabbit IgG | BioRad | 12004161 | IB | 1:3000 |
| anti-rabbit IgG | Life Technologies | A-11037 | IF | 1:500 |
| anti-mouse IgG | Life Technologies | A-21236 | IF | 1:500 |
Additional files
-
Transparent reporting form
- https://cdn.elifesciences.org/articles/77393/elife-77393-transrepform1-v1.docx
-
Source data 1
Underlying data for all graphs.
- https://cdn.elifesciences.org/articles/77393/elife-77393-data1-v1.xlsx
-
Source data 2
All original immunoblot images.
- https://cdn.elifesciences.org/articles/77393/elife-77393-data2-v1.zip
Download links
A two-part list of links to download the article, or parts of the article, in various formats.
Downloads (link to download the article as PDF)
Open citations (links to open the citations from this article in various online reference manager services)
Cite this article (links to download the citations from this article in formats compatible with various reference manager tools)
MCMBP promotes the assembly of the MCM2–7 hetero-hexamer to ensure robust DNA replication in human cells
eLife 11:e77393.
https://doi.org/10.7554/eLife.77393


