EZ Clear for simple, rapid, and robust mouse whole organ clearing
- Department of Integrative Physiology, Baylor College of Medicine, United States
- Optical Imaging and Vital Microscopy Core, Advance Technology Cores, Baylor College of Medicine, United States
- Department of Education, Innovation and Technology, Baylor College of Medicine, United States
- Cardiovascular Research Institute, Baylor College of Medicine, United States
- Department of Neurosurgery, Baylor College of Medicine, United States
Figures
Figure 1 with 1 supplement
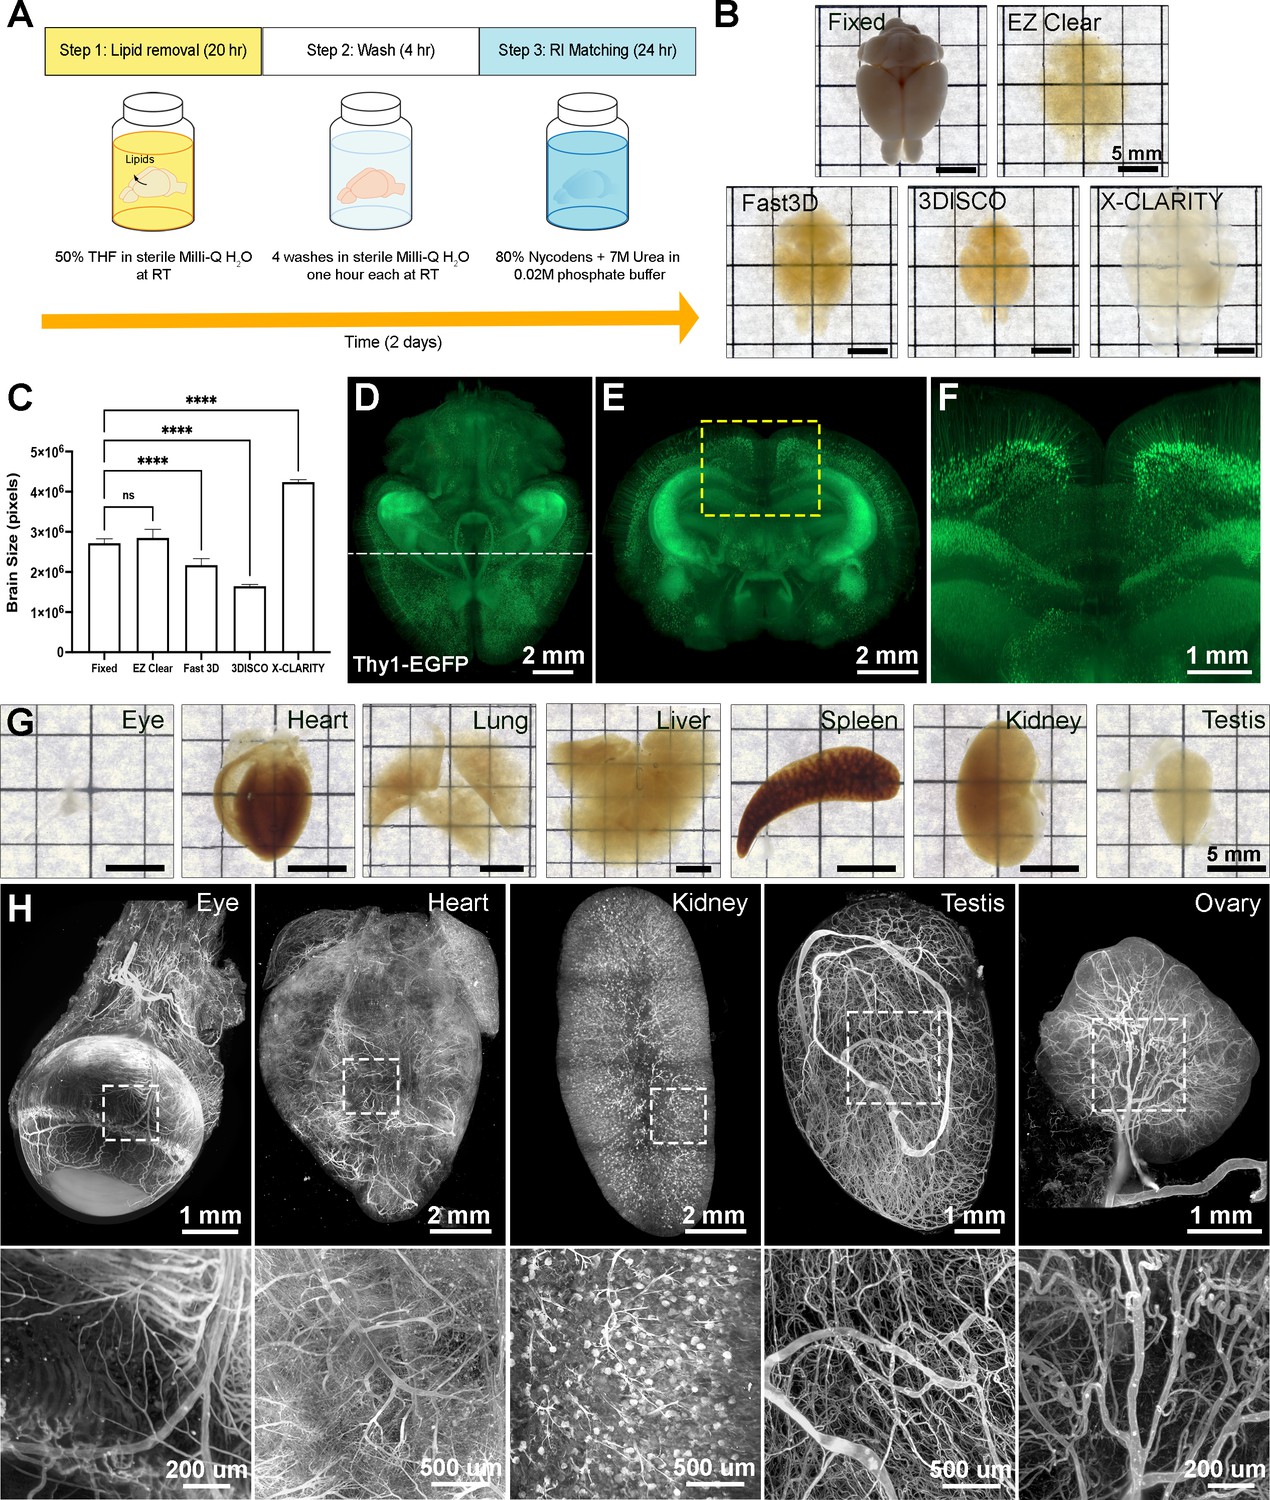
EZ Clear is a simple, rapid, and efficient tissue clearing process.
(A) The three steps, requiring 48 hr of the EZ Clear tissue clearing protocol. (B) Brightfield representative images of adult mouse brains (9 weeks of age) fixed in 4% paraformaldehyde (PFA) only, or fixed and cleared using EZ Clear, Fast 3D, 3DISCO, or X-CLARITY. (C) Quantitative comparison of the volume changes of the mouse brains before and after processing with different clearing protocols. (n=4, one-way ANOVA. Error bars represent standard deviation (SD). ns – not significant, ****p<0.0001.) (D–F) Volume rendering of a wholemount, 4-month-old Thy1-EGFP-M mouse brain processed with EZ Clear and imaged by lightsheet fluorescence microscopy across a total imaging depth of 5 mm, dorsal to ventral axis and presented at (D) dorsal view and (E and F) sectioned digitally at the transverse (coronal) axis. (G) Brightfield representative images of adult mouse organs (eye, heart, lung, liver, spleen, kidney, and testis) processed by EZ Clear. (H) Maximum intensity projections of EZ Clear processed, wholemount lightsheet fluorescent microscopy imaged mouse organs (eye, heart, kidney, testis, and ovary) with the endothelium labeled by fluorescently conjugated Lycopersicon esculentum lectin (lectin-DyLight 649).
-
Figure 1—source data 1
Quantitative comparison of the size changes of the mouse brains before and after processing with 3DISCO, Fast 3D, X-CLARITY, and EZ Clear.
- https://cdn.elifesciences.org/articles/77419/elife-77419-fig1-data1-v2.xlsx
Figure 1—figure supplement 1
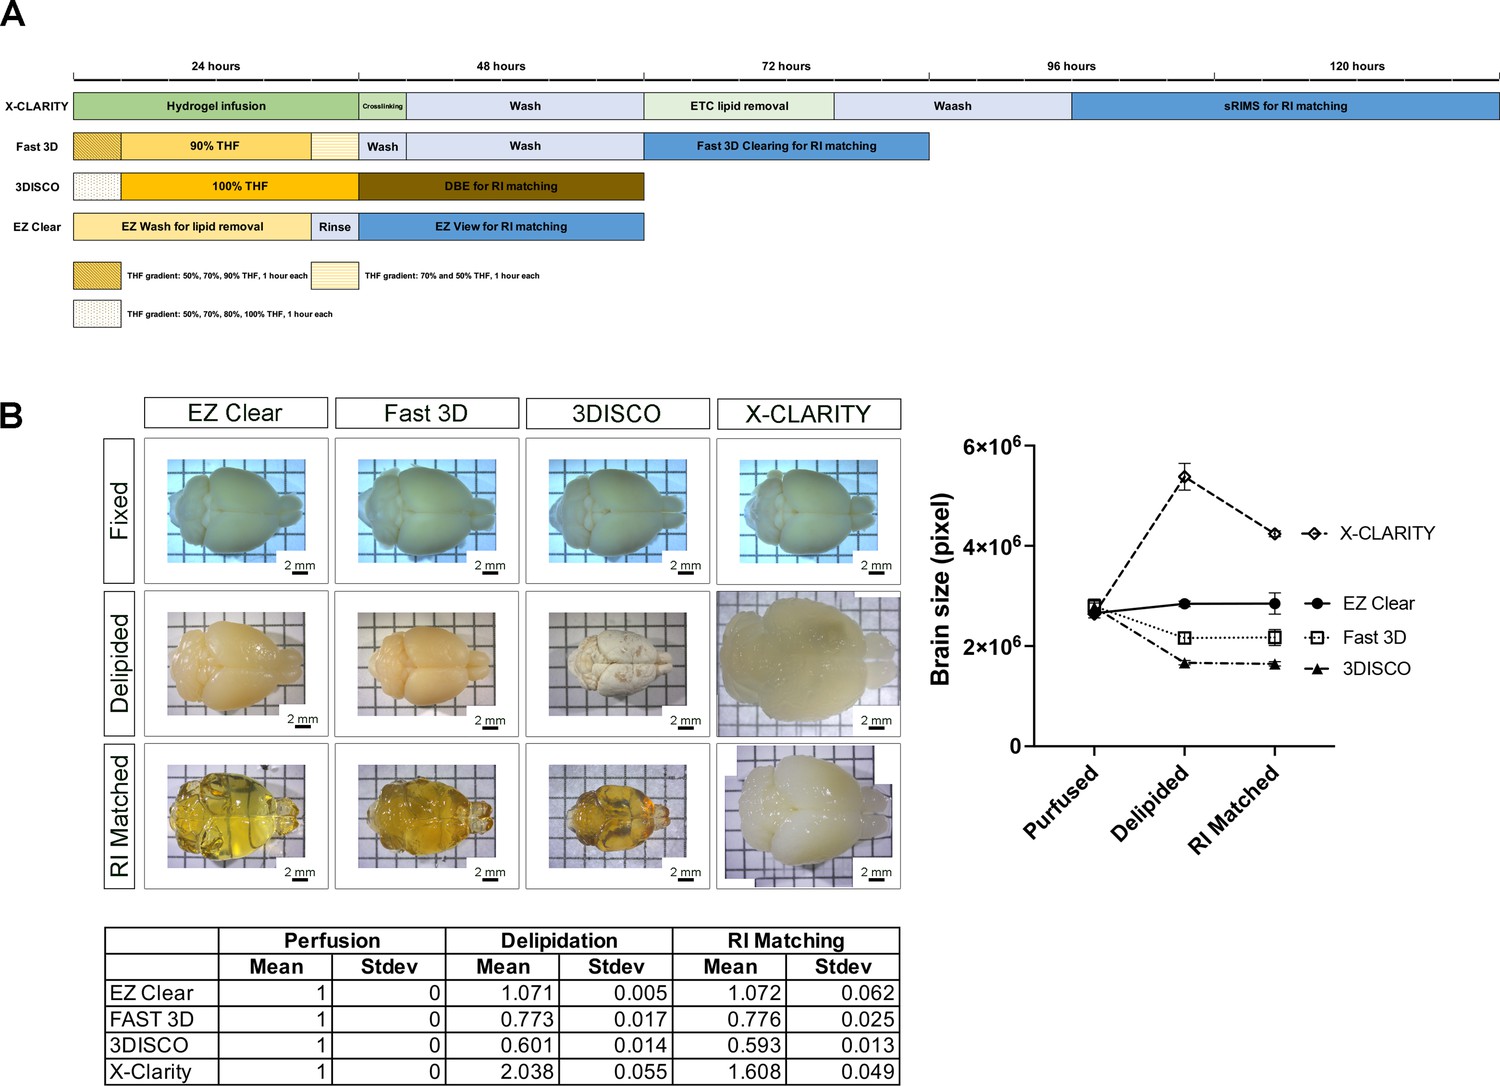
Comparison of EZ Clear to solvent- and aqueous-based clearing methods.
(A) Schematic of required steps and time for tissue clearing with X-CLARITY, Fast 3D, 3DISCO, and EZ Clear. (B) Representative images of brains cleared by X-CLARITY, Fast 3D, 3DISCO, and EZ Clear after 4% paraformaldehyde (PFA) fixation, delipidation, and refractive index (RI) matching with EZ View (EZ Clear), Fast 3D imaging solution (Fast 3D), DEB (3DISCO), and sRIMS (X-CLARITY). The outlined boundary of the brain from each of the captured brightfield images was used to quantify the total pixel number and thus brain size at each step (n=4 brains measured for each solution, error bars represent standard deviation).
-
Figure 1—figure supplement 1—source data 1
Comparison of sample size changes of EZ Clear to solvent- and aqueous-based clearing methods before, during, and after clearing.
- https://cdn.elifesciences.org/articles/77419/elife-77419-fig1-figsupp1-data1-v2.xlsx
Figure 2
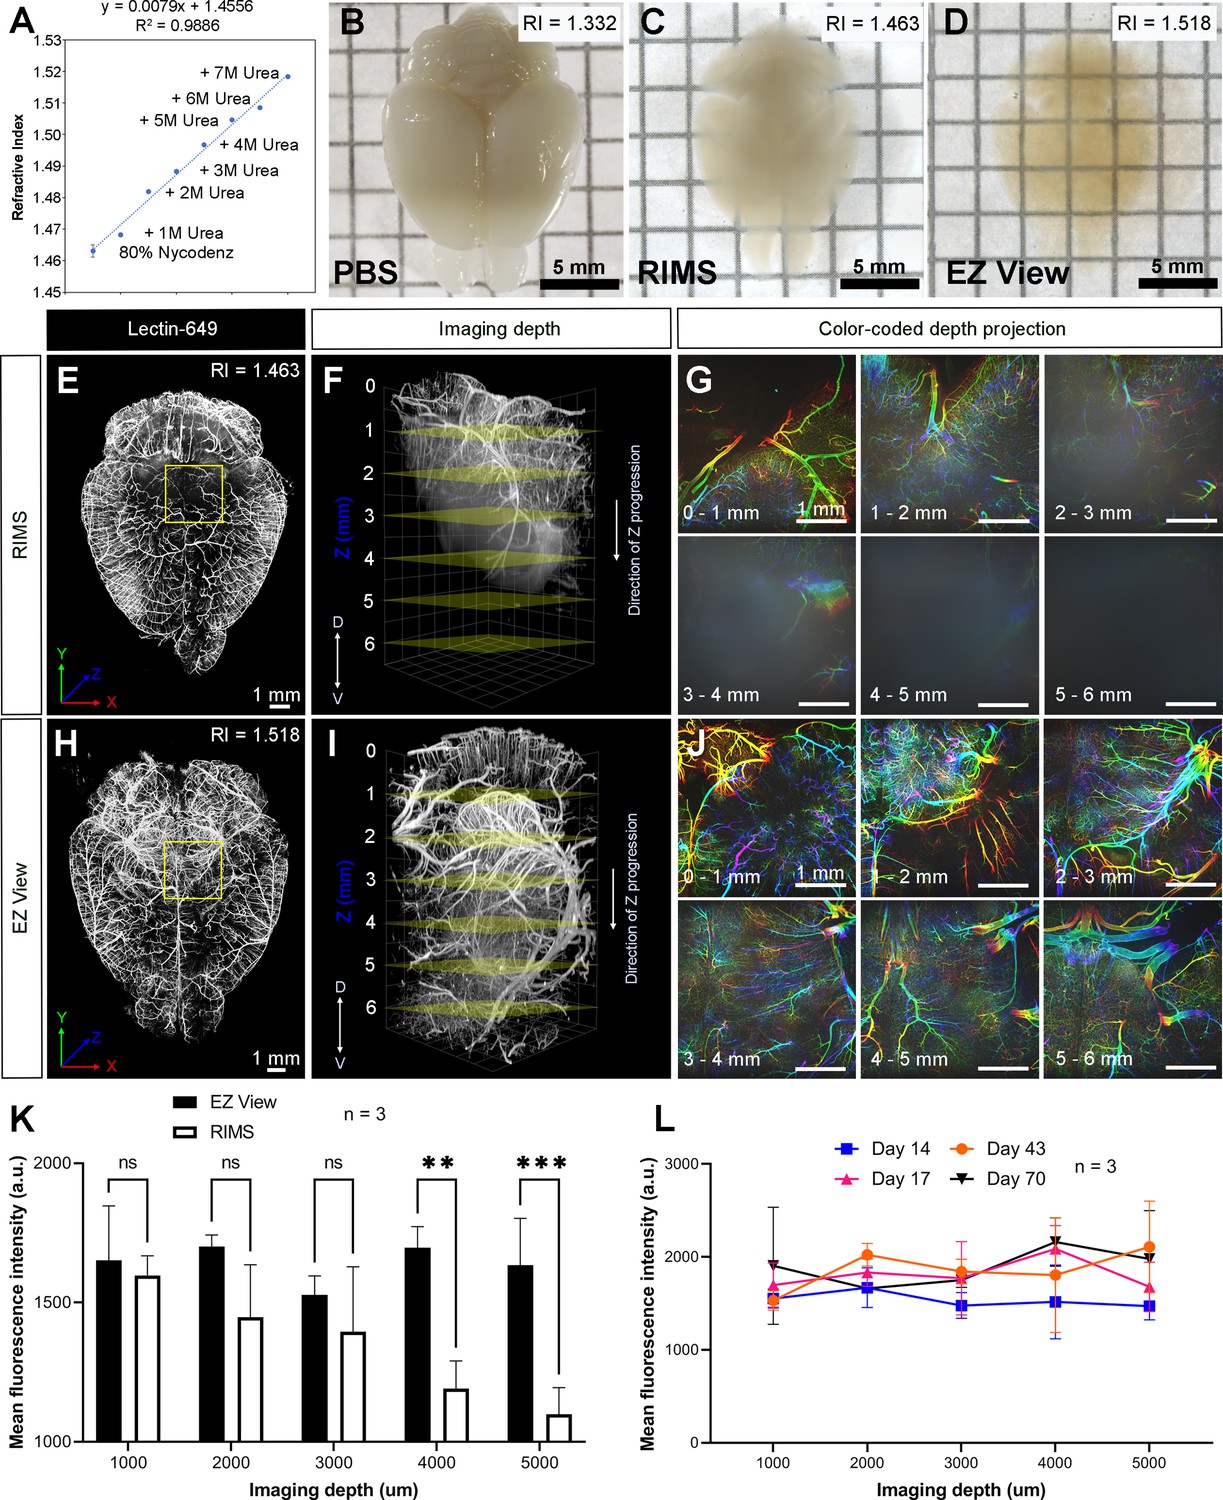
High refractive index imaging buffer EZ View achieves deeper imaging depth and maintains fluorescence stability.
(A) Refractive index (RI) of 80% Nycodenz increases linearly with increasing concentrations of urea (n=3). (B–D) Comparison of transparency of adult mouse brains processed with EZ Clear lipid removal, washing, and then equilibration in (B) PBS (RI = 1.332), (C) refractive index matching solution (RIMS) (RI = 1.463), and (D) EZ View (RI = 1.518) for 24 hr at room temperature. Comparison of 3.5-month-old mouse brains perfused with lectin-649, then treated with delipidation, water washes, equilibrated in (E–G) RIMS and (H–J) EZ View, and imaged by lightsheet fluorescence microscopy (LSFM). (E and H) Comparison of volume rendered whole mouse brains, transverse view, and (F and I) across the imaging axis starting from dorsal to ventral, and (G and J) color-coded depth projection at 1 mm intervals beginning from dorsal (0 mm) to ventral (6 mm) side. (K) Quantitative comparison of mean fluorescence intensity of lectin-694 at different imaging depths (dorsal to ventral) shows the signal intensity gradually decreases along with the imaging depth when the brains were equilibrated in RIMS, unlike those equilibrated in EZ View. (n=3, error bars represent standard deviation [SD]. Two-way ANOVA and multiple comparisons. ns – not significant, **p<0.01, ***p<0.001.) (I) The fluorescence intensity of lectin-694 remain stable when stored in EZ View up to 70 days (n=3, two-way ANOVA and multiple comparisons).
-
Figure 2—source data 1
Measurements for refractive index changes in response to different concentrations of Nycodenz and urea, quantitative comparison of fluorescence intensity of lectin-649 at different imaging depths between brains equalibrated in EZ View and RIMS, and fluorescence intensity measurement of lectin-649 after storing samples in EZ View for 14, 17, 43, and 70 days.
- https://cdn.elifesciences.org/articles/77419/elife-77419-fig2-data1-v2.xlsx
Figure 3
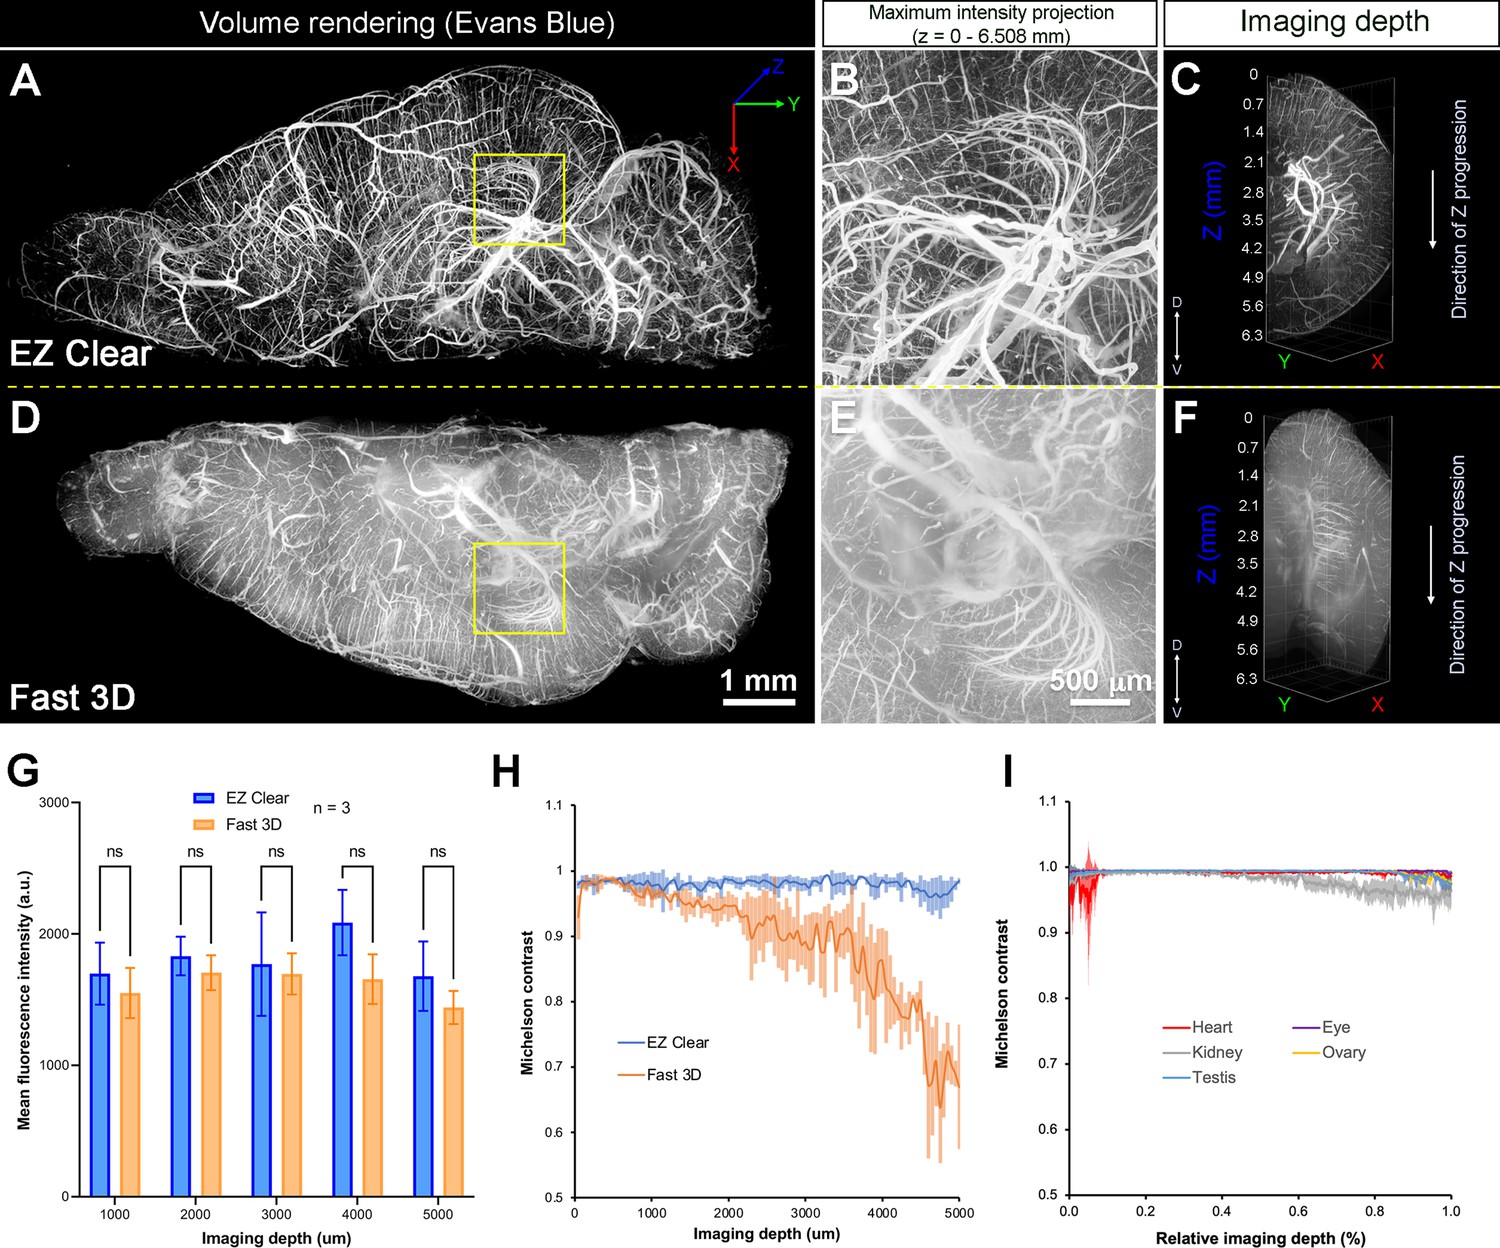
Quantitative comparison of fluorescence intensity and contrast between samples processed by EZ Clear and Fast 3D.
(A–F) Lightsheet imaging of a mouse brain perfused with Evans blue dye and cleared by EZ Clear (right hemisphere, A–C) and Fast 3D (left hemisphere, D–F) shows that tissue processed with EZ Clear has cleaner signal and less light scattering. (G) Quantitative comparison of mean fluorescence intensity of lectin-649 at different imaging depths (dorsal to ventral axis) shows no significant difference between hemispheres treated with EZ Clear and Fast 3D (n=3, two-way ANOVA and multiple comparisons, error bars represent standard deviation [SD], ns – not significant). However, (H) while the lectin-649 fluorescence signal contrast remains sharp in EZ Clear treated brain hemispheres (n=3), the contrast of the signal gradually decreases along with imaging depth in the Fast 3D processed brains. (I) Contrast of the lectin-649 fluorescence signal also remains sharp in EZ Clear treated eye, heart, kidney, testis, and ovary.
-
Figure 3—source data 1
Measurements and comparisons of fluorescent intensity and contrast of lectin-649 between EZ Clear and Fast 3D cleared mouse brains and organs.
- https://cdn.elifesciences.org/articles/77419/elife-77419-fig3-data1-v2.xlsx
Figure 4
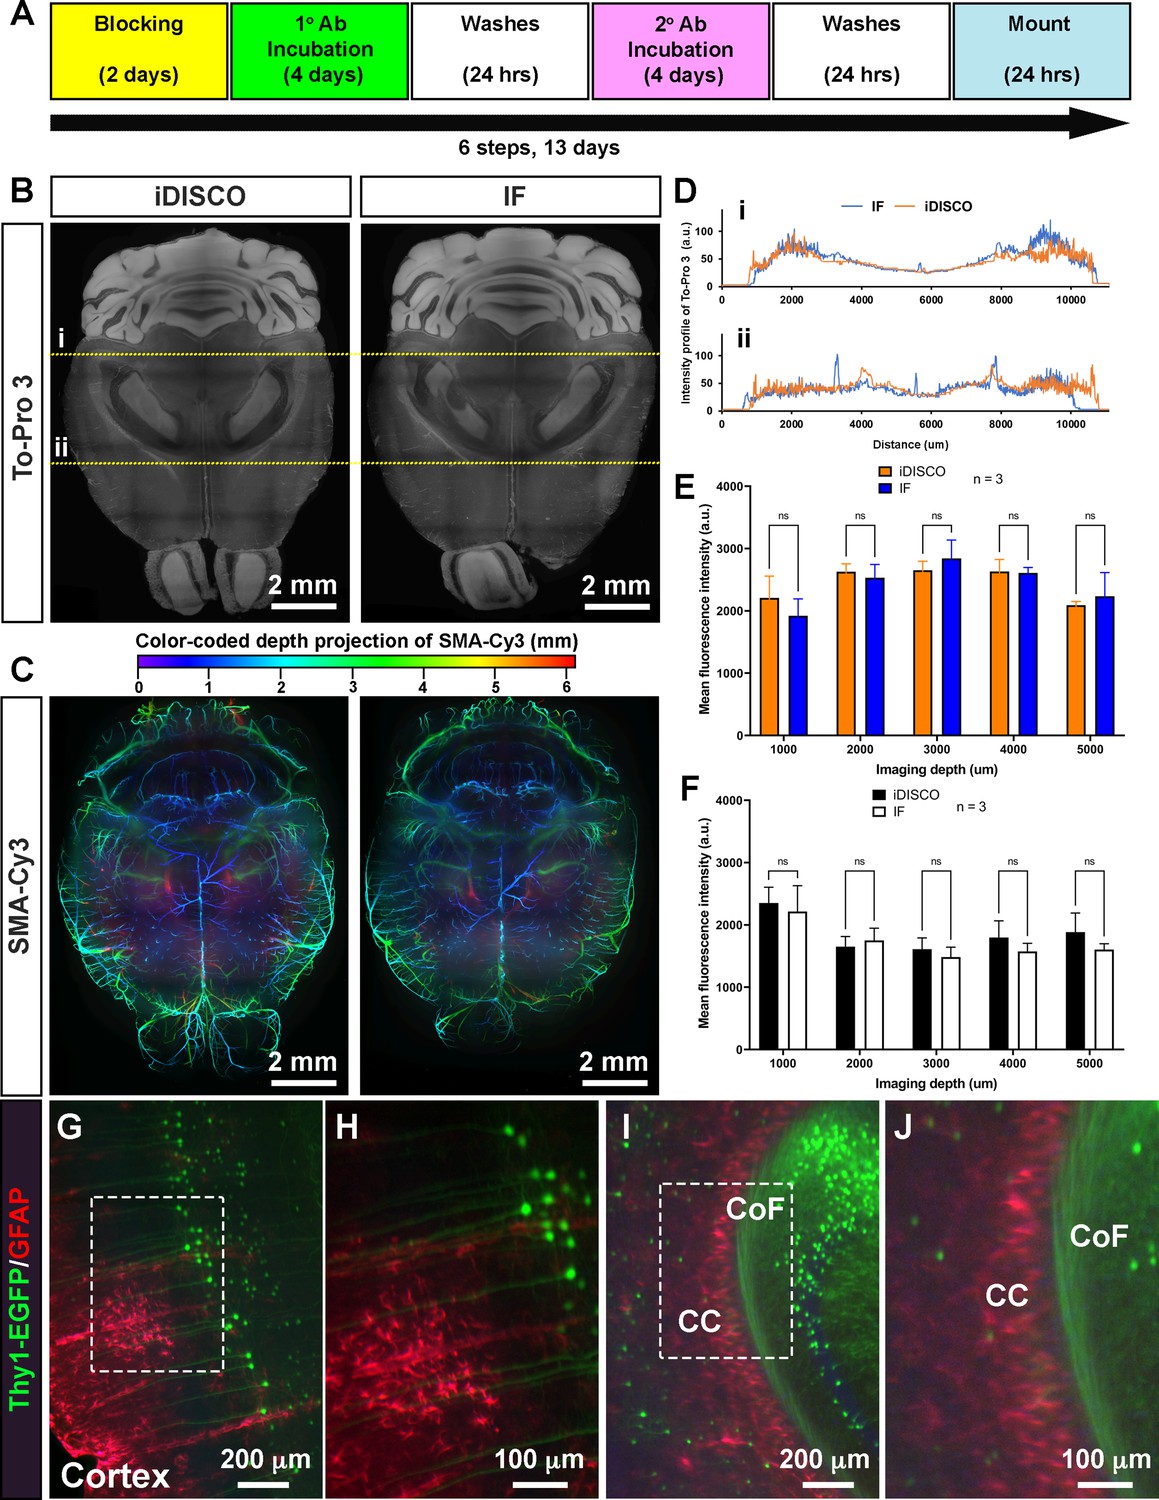
EZ Clear processed samples are compatible with wholemount immunofluorescent staining.
(A) Six-step, standard wholemount immunofluorescent staining procedure for EZ Clear treated mouse brains. (B) Whole organ immunostaining of EZ Clear processed mouse brains using iDISCO or standard immunostaining (direct IHC) protocols along with To-Pro 3 staining to label nuclei (digital sectioned transversely at 2.5 mm) and (C) anti-smooth muscle α-actin conjugated to Cy3 to label smooth muscle cells and arteries (color-coded depth projection). (D) Comparison of the To-Pro 3 penetrance across the lateral axis between iDISCO and standard IHC processed samples. Quantitative comparison of mean fluorescence intensity of (E) To-Pro 3 and (F) αSMA-Cy3 at different imaging depths (dorsal to ventral) shows no significant difference between EZ Clear treated brains stained with iDISCO and standard IHC protocols (n=3, two-way ANOVA and multiple comparisons, error bars represent standard deviation [SD], ns = not significant.). (G–J) Thy1-EGFP-M mouse brain processed with EZ Clear, wholemount immunostained using a standard immunofluorescent protocol with antibodies raised against GFAP (red, glia) and wholemount imaged by lightsheet fluorescence microscopy (LSFM) at the (G and H) cortex and the intersection of the (I and J) corpus callosum (CC) and the commissure of the fornix (CoF).
-
Figure 4—source data 1
Measurements To-Pro 3 penetrance across the lateral axis between iDISCO and standard IHC processed samples.
Quantitative comparison of mean fluorescence intensity of To-Pro 3 and αSMA-Cy3 at different imaging depths (dorsal to ventral) between iDISCO and standard IHC processed samples.
- https://cdn.elifesciences.org/articles/77419/elife-77419-fig4-data1-v2.xlsx
Figure 5 with 1 supplement
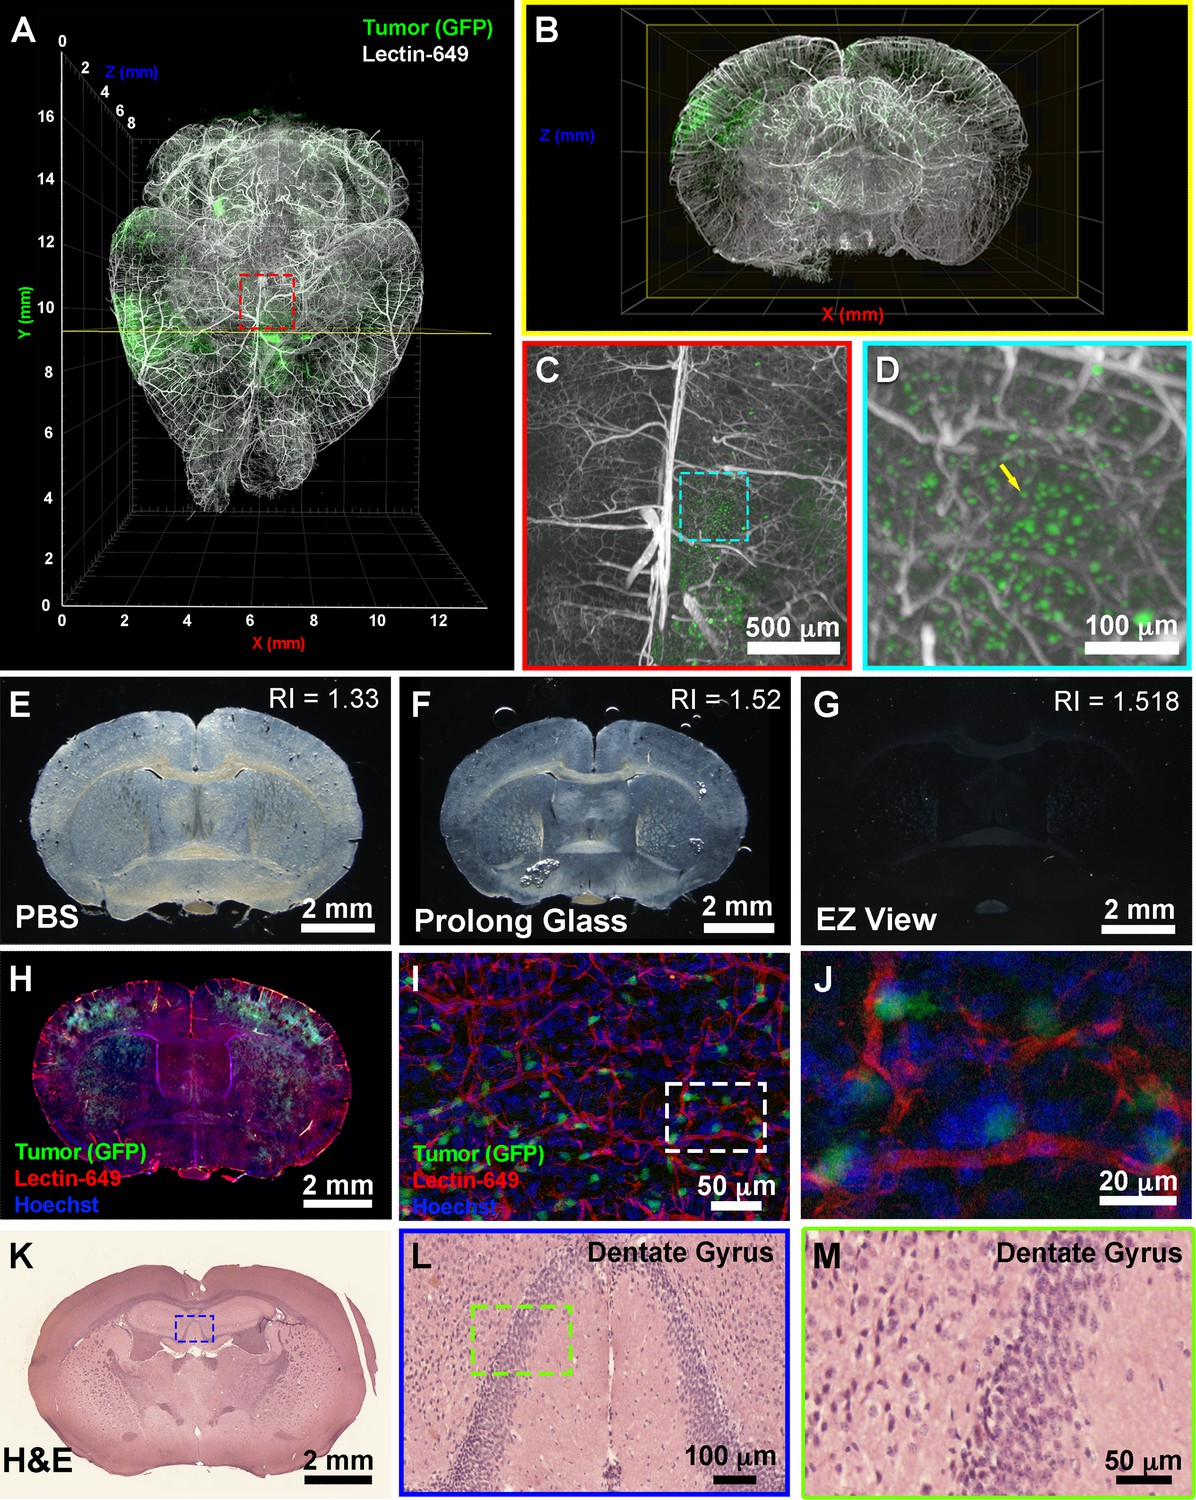
EZ Clear processed and imaged samples can be further processed for downstream cryosection, histology, and immunofluorescence staining.
(A) Volume rendering of a wholemount lightsheet fluorescence microscopy (LSFM) imaged, EZ Clear processed postnatal day 104 (P104) glioblastoma multiforme (GBM) mouse brain with GFP+ tumor cells and lectin-649 labeled vasculature at (A) dorsal view and (B) sectioned digitally in the transverse (coronal) axis. GFP+ tumor cells can be identified in large clusters (A and B), as well as sparse single cells (C and D) from wholemount imaged data. (E–G) EZ Clear processed and imaged brains processed for cryosectioning in the coronal plane, and then mounted in (E) PBS, (F) Prolong Glass Antifade medium (n=1.52), or (G) EZ View. Sections mounted in EZ View are compatible with fluorescence (H) and confocal (I and J) imaging and the signals from GFP+ tumor cells and fluorescent lectin labeled vasculature are preserved. (K–M) Tissues processed for EZ Clear are also compatible with downstream histological applications, as cryosections stained with hematoxylin and eosin (H&E) yielded robust nuclear and cytoplasmic labeling.
Figure 5—figure supplement 1
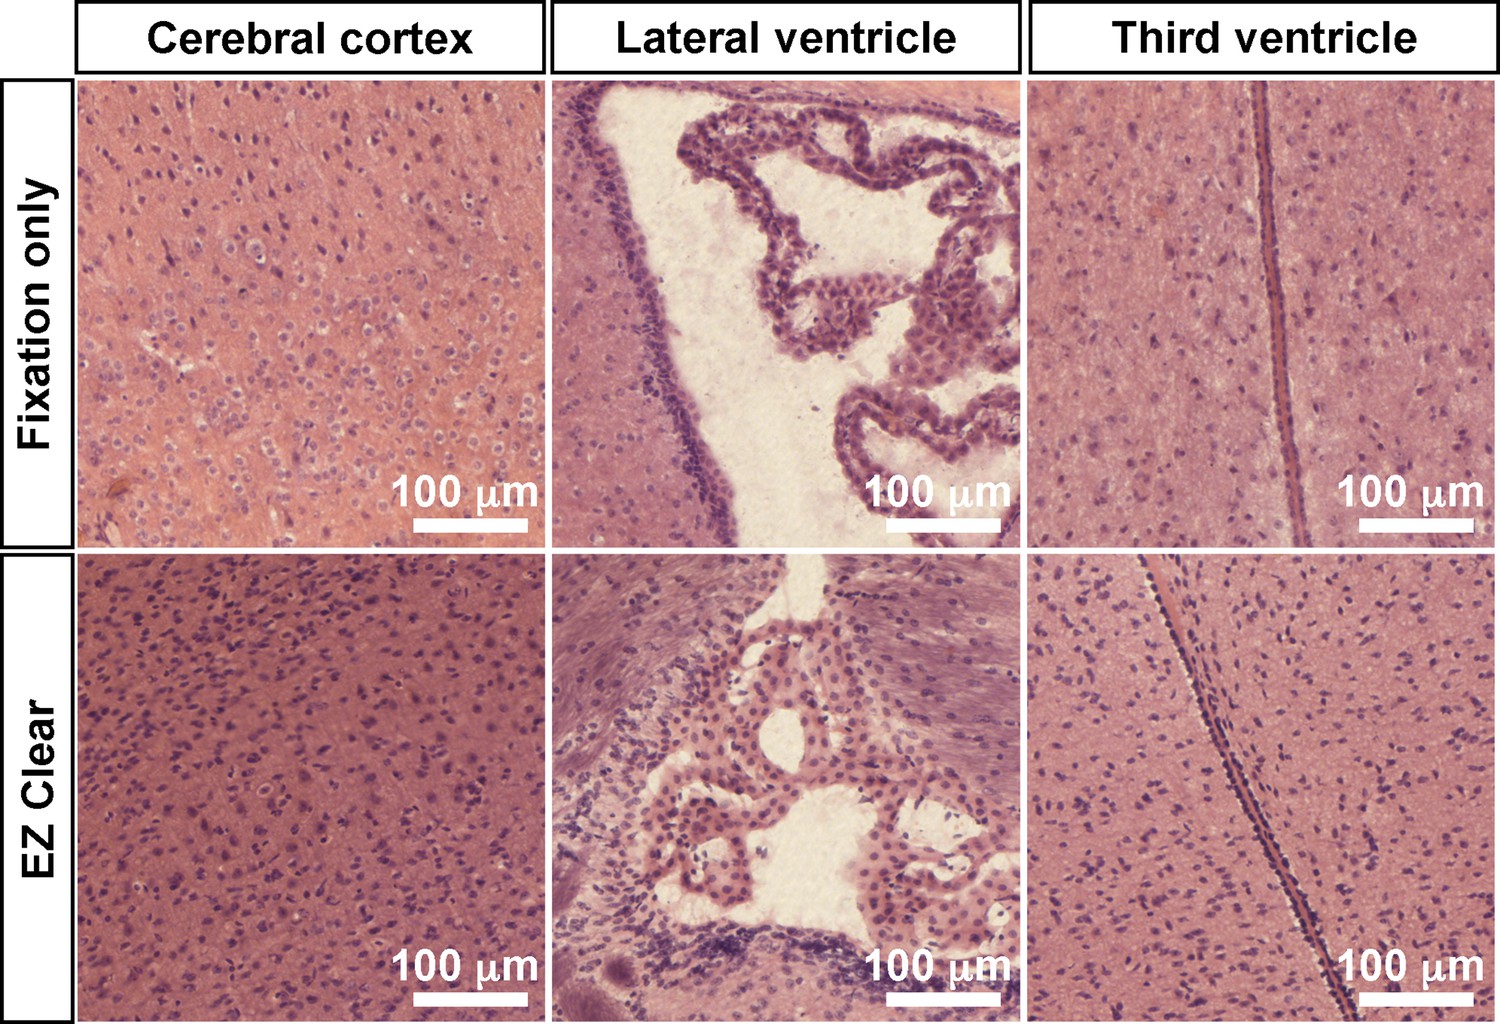
EZ Clear processed and imaged samples processed for cryosectioning and hematoxylin and eosin (H&E) staining.
(A) Comparison of H&E staining of sections from brains that were either fixed in 4% paraformaldehyde (PFA) or processed with EZ Clear and imaged by lightsheet fluorescence microscopy (LSFM) at the cerebral cortex, lateral ventricle, and third ventricle regions.
Figure 6
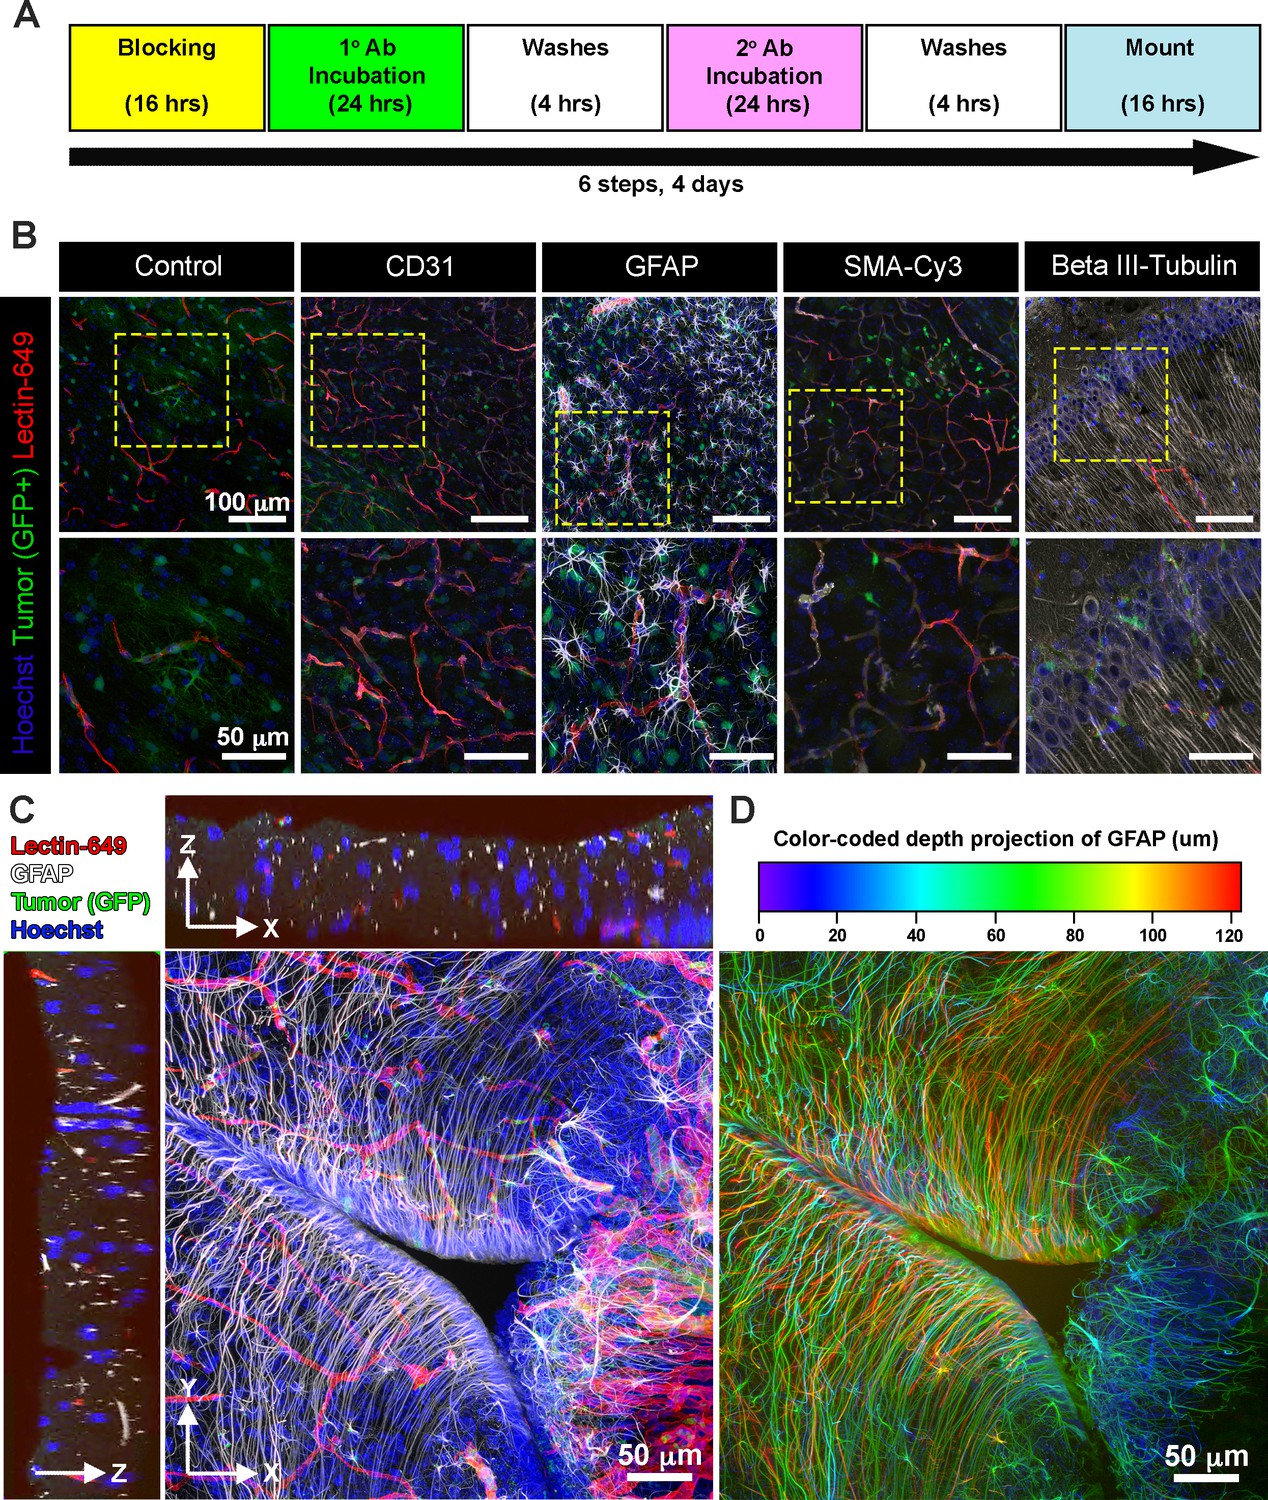
EZ Clear processed and imaged samples are compatible with cryosectioning and immunofluorescent staining.
(A) Six-step immunostaining procedure for processing tissues after EZ Clearing and imaging. (B) Cryosections in the coronal plane from an EZ Clear processed and imaged postnatal day 104 (P104) glioblastoma multiforme (GBM) mouse brain with GFP+ tumor cells and lectin-649 labeled vessels were directly imaged (control) or immunostained to detect CD31 (endothelial), GFAP (astrocytes, glia), smooth muscle α-actin (smooth muscle cells), and β-III tubulin (neurons). Stained sections were mounted on slides with EZ View and imaged on an 880 Airyscan FAST confocal microscope at ×20. (C) Orthogonal and (D) color-coded depth projection views of GFP+ tumor cells and lectin-649 labeled vessels section labeled with GFAP (astrocytes, glia) and Hoechst (nuclei). The GFAP signal was constant throughout the 100 μm section.
Figure 7
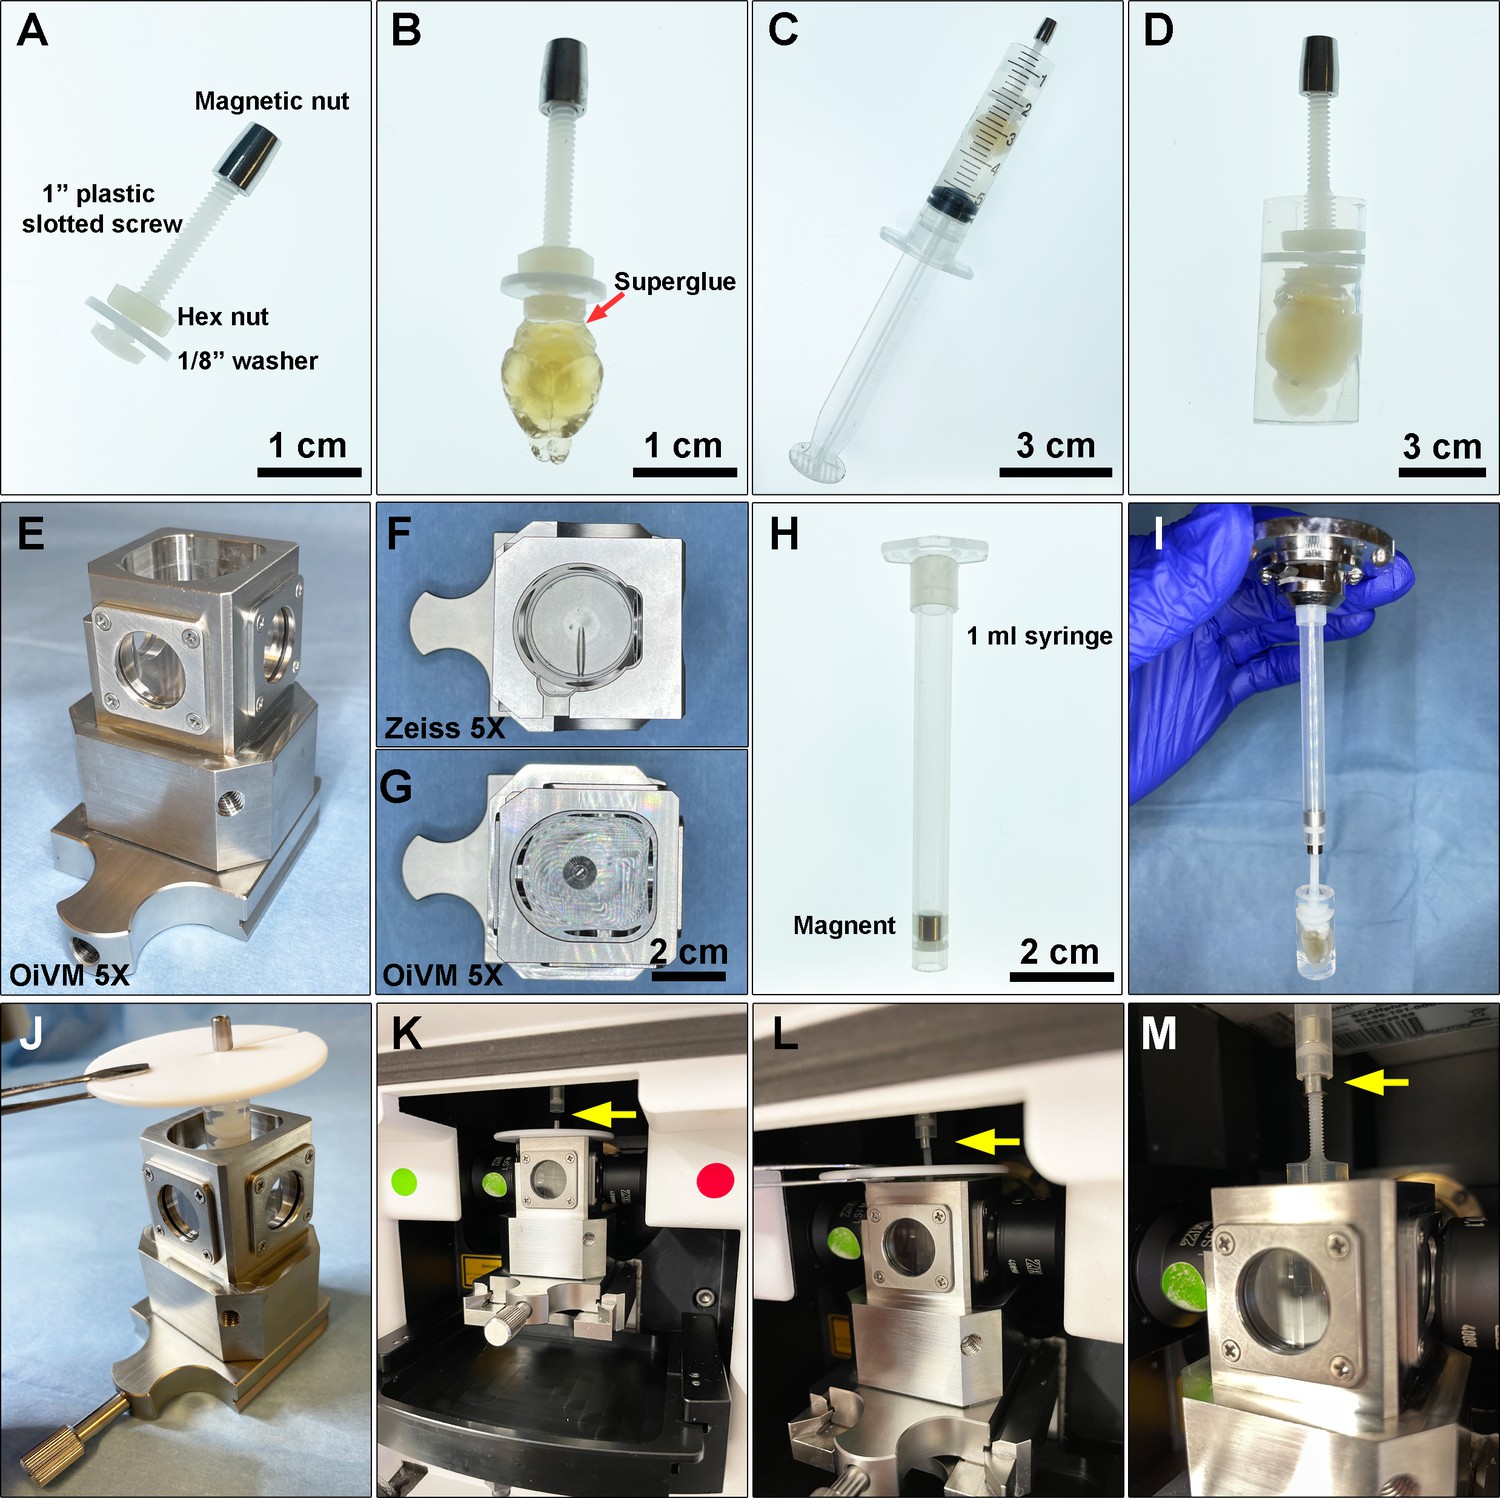
Preparing a cleared mouse brain for imaging on the Zeiss Lightsheet Z.1 platform.
(A) A custom-designed sample holder with a magnetic nut. (B) A cleared brain sample was attached to the head of the plastic screw using superglue. (C) A 5 mL syringe is used as a casting mold for embedding the cleared brain and the tip of the sample holder in melted 1% agarose. (D) A cleared brain and sample holder embedded in 1% agarose. (E) Custom-made Optical Imaging and Vital Microscopy core (OiVM) ×5 lightsheet chamber. Comparison of the imaging chambers between (F) Zeiss ×5 and (G) OiVM ×5. (H) Sample mounting probe with a recessed magnet. (I) Demonstration of how the sample mounting probe and sample holder attach. To load the sample into the lightsheet Z.1 chamber, first (J) the embedded sample and holder are placed in the custom-designed imaging chamber by hanging with a PTFE chamber cover with 3 mm opening (Zeiss) by the magnetic nut, then (K) the imaging chamber with sample hanging was assembled onto lightsheet. (L and M) The sample holder was then attached to the probe by lifting the sample, the cover, and attached the magnetic nut to the magnet in the probe (yellow arrow). The chamber cover is removed and then the sample may be imaged.
Videos
Video 1
Wholemount EZ Clear processed Thy1-EGFP adult mouse brain imaged by lightsheet fluorescent microscopy.
Video 2
Comparison of brain hemispheres following perfusion with Evans blue and clearing with either EZ Clear (right hemisphere) or Fast 3D (left hemisphere).
Video 3
Postnatal day 104 glioma brain perfused with DyLight 649-conjugated Lycopersicon esculentum (tomato) lectin (lectin-649).
Video 4
Three-dimensional (3D) volume rendering of a confocal stack from a glioblastoma multiforme (GBM) brain following cryosectioning and immunostained with GFAP (white) and Hoechst (blue) after EZ Clearing and lightsheet fluorescence microscopy (LFSM) imaging of the tumor (green) and blood vessels (red).
Tables
Key resources table
| Reagent type (species) or resource | Designation | Source or reference | Identifiers | Additional information |
|---|---|---|---|---|
| Antibody | Lycopersicon esculentum (Tomato) Lectin (LEL, TL), DyLight 649 | Vector Laboratories | Cat #: DL-1178–1 | |
| Antibody | Rat Monoclonal Anti-Mouse CD31 | BD Biosciences | Cat #: 550274 | IF (1:200) |
| Antibody | Mouse Monoclonal Anti-actin, alpha-smooth muscle – Cy3 | Millipore-Sigma | Cat #: C6198 | IF (1:200) |
| Antibody | Rat Monoclonal Anti-GFAP | Invitrogen | Cat #: 13-0300 | IF (1:200) |
| Antibody | Rabbit Polyclonal Anti-beta III Tubulin | Abcam | Cat #: ab18207 | IF (1:200) |
| Antibody | Donkey Anti-Rat Alexa Fluor 568 | Abcam | Cat #: Ab175475 | IF (1:500) |
| Antibody | Donkey Anti-Rabbit Alexa Fluor 488 | Invitrogen | Cat #: A21206 | IF (1:500) |
| Antibody | Donkey Anti-Rabbit Alexa Fluor 568 | Invitrogen | Cat #: A10042 | IF (1:500) |
| Chemical compound, drug | Evans blue | Millipore-Sigma | Cat#: E2119 | |
| Chemical compound, drug | Histodenz | Millipore-Sigma | Cat#: D2158-100g | |
| Chemical compound, drug | Hoechst 33342 | Millipore-Sigma | Cat#: 14533 | 10 mg/mL stock at 1:1000 dilution |
| Chemical compound, drug | Diatrizoic acid | Millipore-Sigma | Cat#: D9268-1g | |
| Chemical compound, drug | Benzyl ether | Millipore-Sigma | Cat#: 108014 | |
| Chemical compound, drug | N-methyl-D-glucamine | Millipore-Sigma | Cat#: M2004-100g | |
| Chemical compound, drug | Triethylamine | Millipore-Sigma | Cat#: T0886 | |
| Chemical compound, drug | Tetrahydrofuran | Millipore-Sigma | Cat#: 186562 | |
| Chemical compound, drug | Nycodenz | Accurate Chemical & Scientific | Cat#: 100334–594 | |
| Chemical compound, drug | D-Sorbitol | Millipore-Sigma | Cat#: S1876 | |
| Chemical compound, drug | Urea | Millipore-Sigma | Cat#: U5378 | |
| Chemical compound, drug | Sodium azide | Millipore-Sigma | Cat#: S2002 | |
| Chemical compound, drug | VWR Life Science Agarose I | VWR | Cat#: 0710 | |
| Chemical compound, drug | Triton X-100 | Thermo Fisher Scientific | Cat#: BP-151 | |
| Chemical compound, drug | Donkey serum | Millipore-Sigma | Cat#: D9663 | |
| Chemical compound, drug | Na2HPO4 | Acros Organics | Cat#: 448140010 | |
| Chemical compound, drug | NaH2PO4 | Millipore-Sigma | Cat#: S0751 | |
| Chemical compound, drug | PBS, ×1 solution, pH 7.4, | Thermo Fisher Scientific | Cat#: BP24384 | |
| Chemical compound, drug | Paraformaldehyde | Millipore-Sigma | Cat#: P6148 | |
| Chemical compound, drug | Modified Harris Hematoxylin Solution | Millipore-Sigma | Cat#: HHS32-1L | |
| Chemical compound, drug | Eosin Y Phloxine B Solution | EMS | Cat#: 26051–21 | |
| Chemical compound, drug | Histoclear II | EMS | Cat#: 64111–04 | |
| Chemical compound, drug | DPX New | Millipore-Sigma | Cat#: 100579 | |
| Chemical compound, drug | Tissue-Tek OCT Compound | Sakura | Cat#: 4583 | |
| Software, algorithm | Imaris | Bitplane Inc | RRID:SCR_007370 | Ver. 8.5 |
| Software, algorithm | Vision4D | Arivis | RRID:SCR_018000 | Ver. 2.12 and 3.5 |
| Software, algorithm | Zeiss Zen Blue | Zeiss | RRID:SCR_013672 | Ver. 2.6.76.00000 (LSM 880) Ver. 1.1.2.0 (AxioZoom.V16 and AxioObserver.Z1) |
| Software, algorithm | Zeiss Zen Black | Zeiss | RRID:SCR_018163 | Ver. 9.2.5.54 (Lightsheet Z.1) Ver. 14.0.23.201 (LSM 880) |
| Software, algorithm | Labscope Material | Zeiss | Ver. 2.8.4 | |
| Software, algorithm | ImageJ/Fiji | NIH | RRID:SCR_002285 | Ver. 1.53c |
| Software, algorithm | Prism | GraphPad | RRID:SCR_002798 | Ver. 9.2.0 |
| Other | TO-PRO–3 Iodide (642/661) | Thermo Fisher Scientific | Cat#: T3605 | IF (1:1000) Nuclear counterstain |
| Other | Plastic Binding Head Slotted Screws, Off-White, 4–40 Thread Size, 1" Long | McMaster-Carr | Cat#: 94690A724 | Sample holder parts for lightsheet imaging |
| Other | Nylon Plastic Washer for Number 4 Screw Size, 0.112" ID, 0.206" OD | McMaster-Carr | Cat#: 90295A340 | Sample holder parts for lightsheet imaging |
| Other | Nylon Hex Nut, 4–40 Thread Size | McMaster-Carr | Cat#: 94812 200 | Sample holder parts for lightsheet imaging |
Additional files
Download links
A two-part list of links to download the article, or parts of the article, in various formats.
Downloads (link to download the article as PDF)
Open citations (links to open the citations from this article in various online reference manager services)
Cite this article (links to download the citations from this article in formats compatible with various reference manager tools)
EZ Clear for simple, rapid, and robust mouse whole organ clearing
eLife 11:e77419.
https://doi.org/10.7554/eLife.77419


