Immunopathology and Trypanosoma congolense parasite sequestration cause acute cerebral trypanosomiasis
- Instituto de Medicina Molecular - João Lobo Antunes, Faculdade de Medicina, Universidade de Lisboa, Portugal
Figures
Figure 1 with 1 supplement
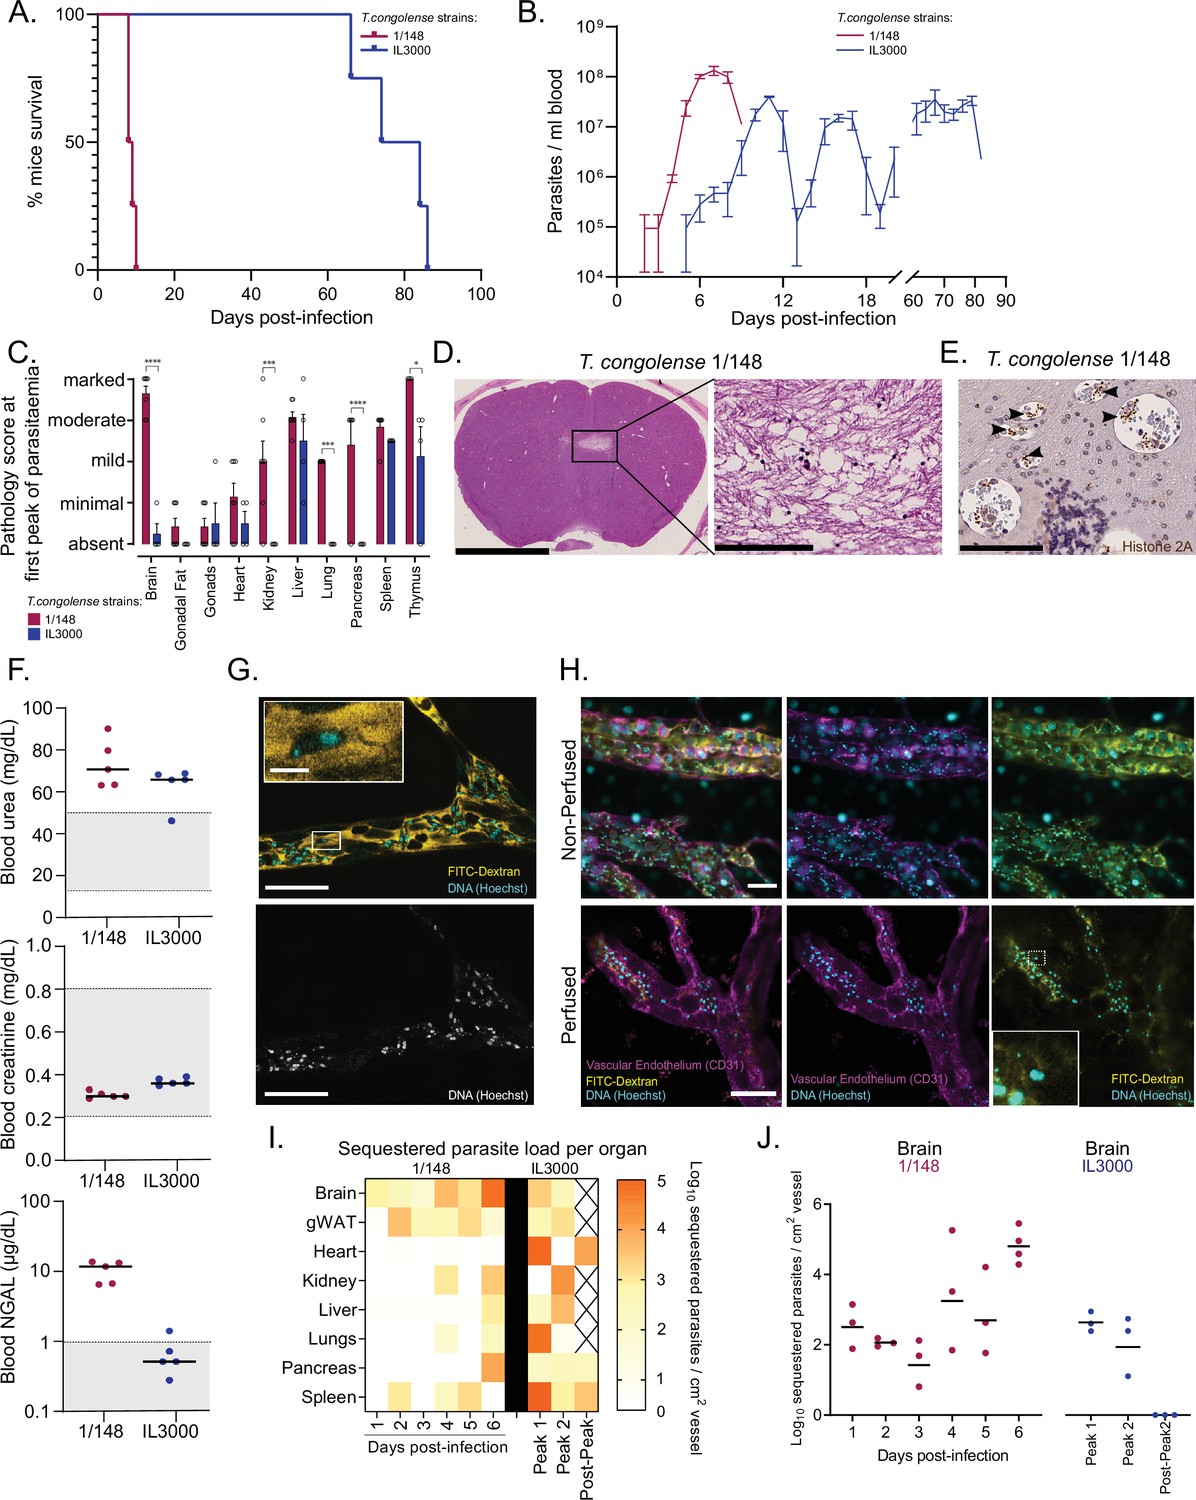
Infection progression and phenotypic differences between T. congolense savannah strains IL3000 (Gibson, 2012) and 1/148 (Young and Godfrey, 1983).
(a). Mice survival curves following infection with T. congolense strains 1/148 and IL3000 (average of 9.0±0.4 and 77.5±4.0 (Mean ± SEM) days respectively) (N=4). (b). Parasitemia throughout infection with 1/148 and IL3000 parasites estimated by hemocytometry shows that infections with strain 1/148 do not progress past the first peak of parasitemia, whereas parasitemia with strain IL3000 oscillates from below the level of detection to 5 × 10⁷ parasites/mL for up to 84 days. Mean ± SEM (c). Pathological report at the first peak of parasitemia of each strain, scored based on the degree of organ damage from absent to marked. Stars indicate statistically significant results; two-way ANOVA with Sidak’s multiple comparisons test, * p<0.05; ** p<0.01; *** p<0.001; **** p<0.0001. N=4–7, 2 independent experiments. (d). Right: Representative histological hematoxylin and eosin staining of brain of a mouse infected with strain 1/148, showing a large lesion (Scale bar = 2.5 mm). Right: high-magnification of lesion, showing cell loss (scale bar = 100 µm) (e). Immuno-histochemical staining of trypanosome H2A (brown), showing parasite sequestration in the brain vasculature. Scale bar = 100 µm (f). Serum levels of urea, creatinine, and neutrophil gelatinase-associated lipocalin (NGAL) in mice infected with either T. congolense strains 1/148 or IL3000, at the first peak of parasitemia. Grey area represents normal range for non-infected, healthy mice. (g). Representative image of T. congolense parasites in a vessel of the brain by intravital microscopy at day 6 post-infection. 70 kDa FITC-Dextran is used for vascular flow labeling (shown in yellow); cell nuclei are stained with Hoechst (shown in cyan). Bottom panel shows nuclei staining only. Scale = 20 μm. On top-left, a zoomed-in section showing a T. congolense parasite. Scale = 4 μm. (h). Representative images of T. congolense 1/148 parasites in brain vessels by intravital microscopy at day 6 post-infection, without (top) and with (bottom) perfusion. Seventy kDa FITC-Dextran is used for vascular flow labeling (shown in yellow); cell nuclei are stained with Hoechst (shown in cyan), vascular endothelium is stained with α-A637-CD31. Scale = 30 μm. On bottom-right, a zoomed-in section showing a sequestered T. congolense parasite after perfusion. (i). Heatmap showing sequestered parasite load per organ over the course of the infection in strains 1/148 and IL3000, quantified by intravital microscopy and represented as log10 sequestered parasites per cm2 of vessel, adjusted for the vascular density of each organ. (J). Sequestered parasite load in the brain vasculature over the course of the infection in strains 1/148 and IL3000, quantified by intravital microscopy.
Figure 1—figure supplement 1
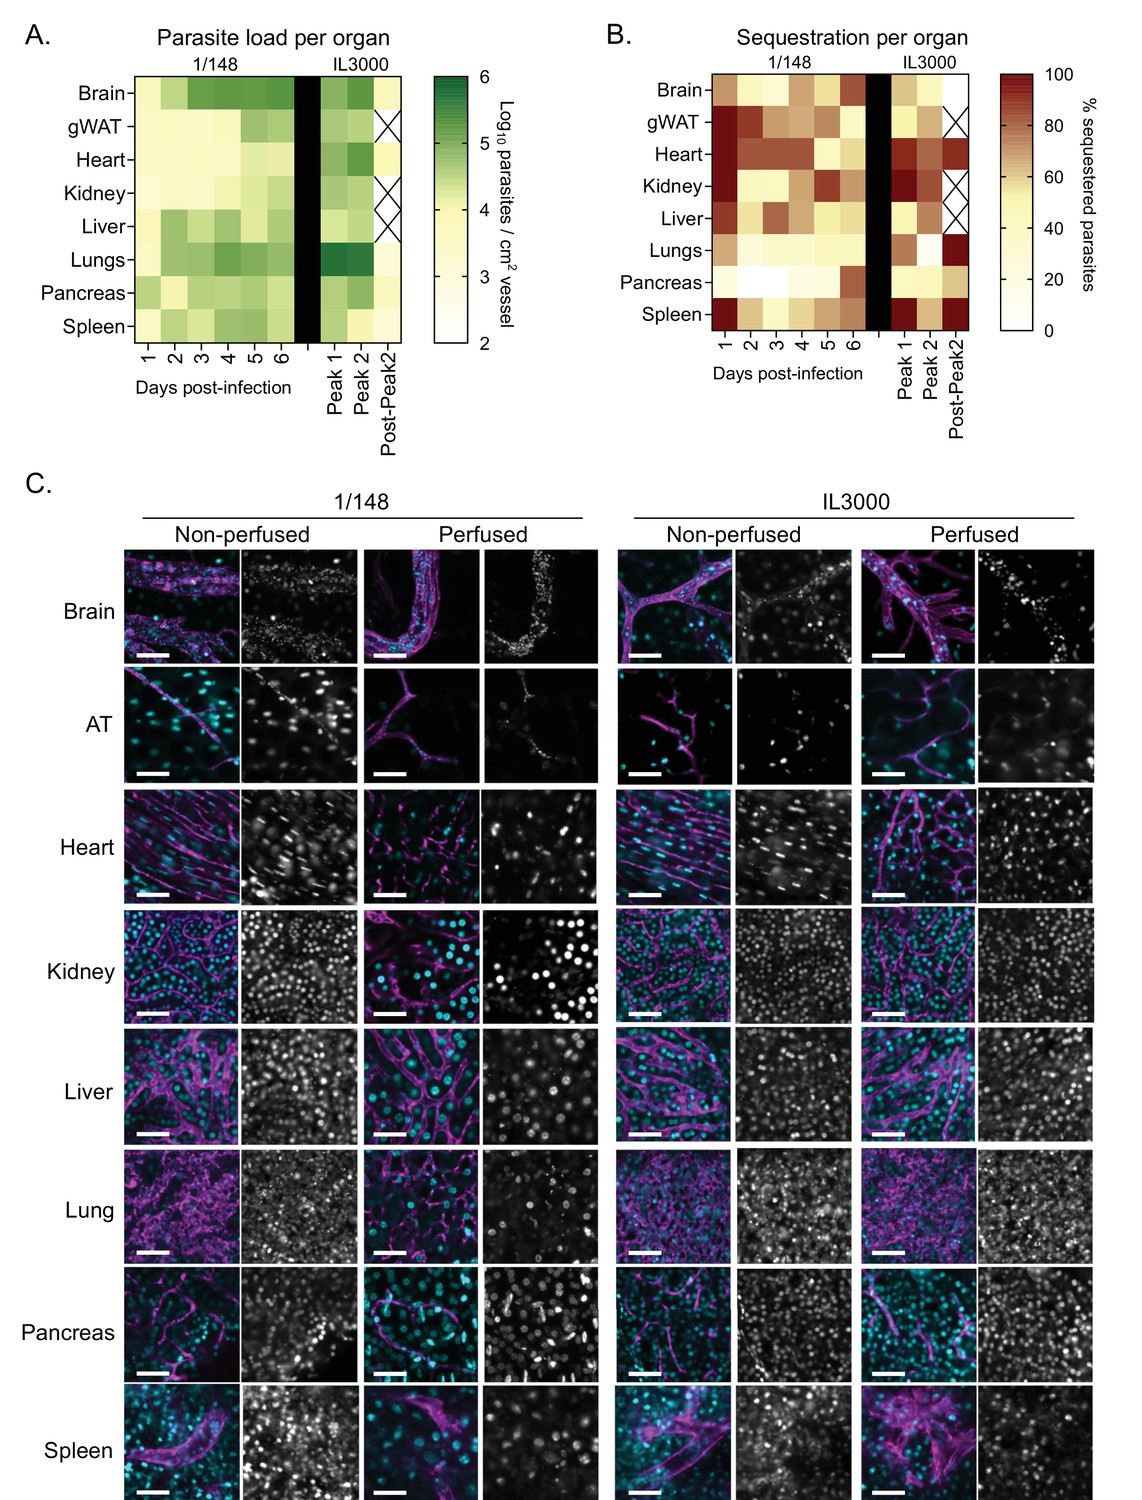
Parasite load and sequestration in the vasculature of mice infected with T. congolense 1/148 and IL3000, at day 6 post-infection.
(a). Heatmap showing total parasite load per organ over the course of the infection in strains 1/148 and IL3000, quantified by intravital microscopy and represented as log2 parasites per cm2 of vessel, adjusted for the vascular density of each organ. (b). Heatmap showing percentage of cytoadhered parasites per organ over the course of the infection in strains 1/148 and IL3000, quantified by intravital microscopy. (c). Representative images of intravital microscopy analysis. AT stands for gonadal adipose tissue. DNA is stained with Hoechst (shown in cyan); vascular endothelium is stained with anti-CD31 (shown in purple). Scale bar = 30 μm.
Figure 2
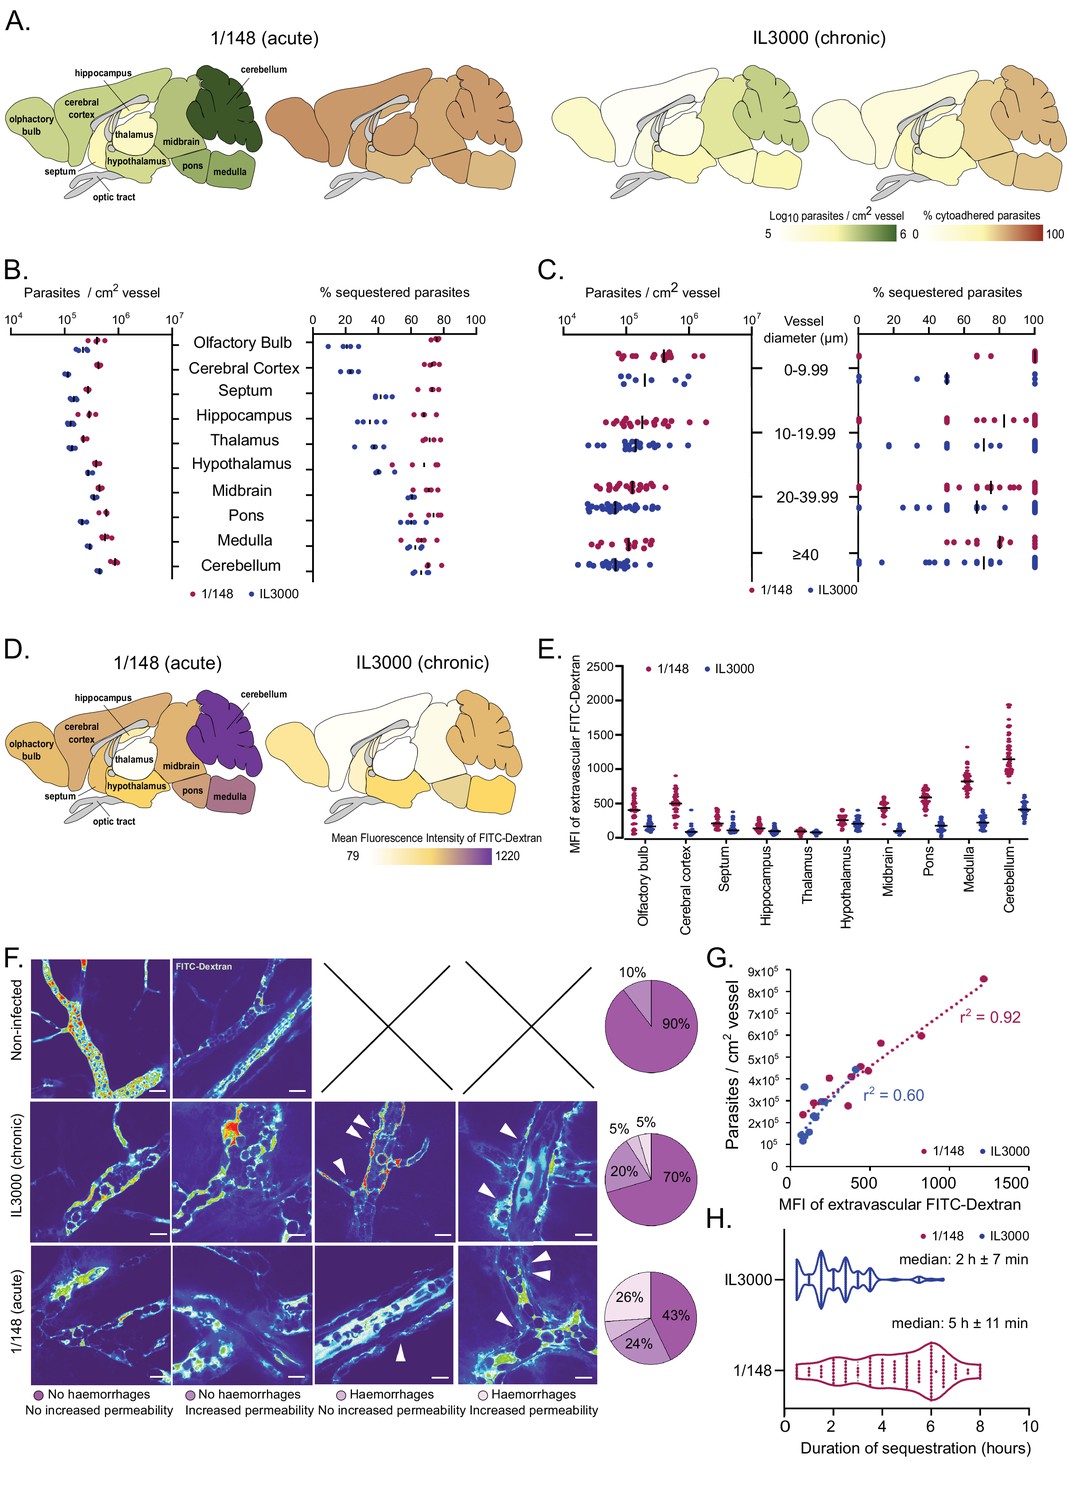
Distribution and characterization of Trypanosoma congolense sequestration in the brain.
(a). Total parasite load (green) and percentage of parasite sequestration (orange) in different parts of the brain at the first peak of parasitemia of strains 1/148 and IL3000, quantified by ex-vivo microscopy in a minimum of 100 independent images in three to four independent mice. (b). Quantitative values corresponding to (a) at the first peak of parasitemia. (c). Parasite load (left) and sequestration proportion (right) in vessels of different diameters. (d). Mean fluorescence intensity in the extravascular area of different parts of the brain at the first peak of parasitemia of strains 1/148 and IL3000, quantified by intravital and ex-vivo microscopy in a minimum of 100 independent images in three to four mice, independently infected. (e). Quantitative values corresponding to (d) at the first peak of parasitemia. Values were measured within 10 µm of the nearest vessel. (f). Percentage of brain area displaying four types of vascular pathology (or lack thereof): no hemorrhages and no increased permeability; no hemorrhages and increased permeability; hemorrhages and no increased permeability; hemorrhages and increased permeability and their representative images. (g). Correlation between parasite sequestration and vascular permeability as measured by FITC-Dextran MFI. (h). Time (in hr) that individual parasites remain cytoadhered. Images were obtained every 30 min, for 12 hr. Black line indicates the mean. N=3, 3 independent infections, 100 vessels per mouse.
Figure 3 with 1 supplement
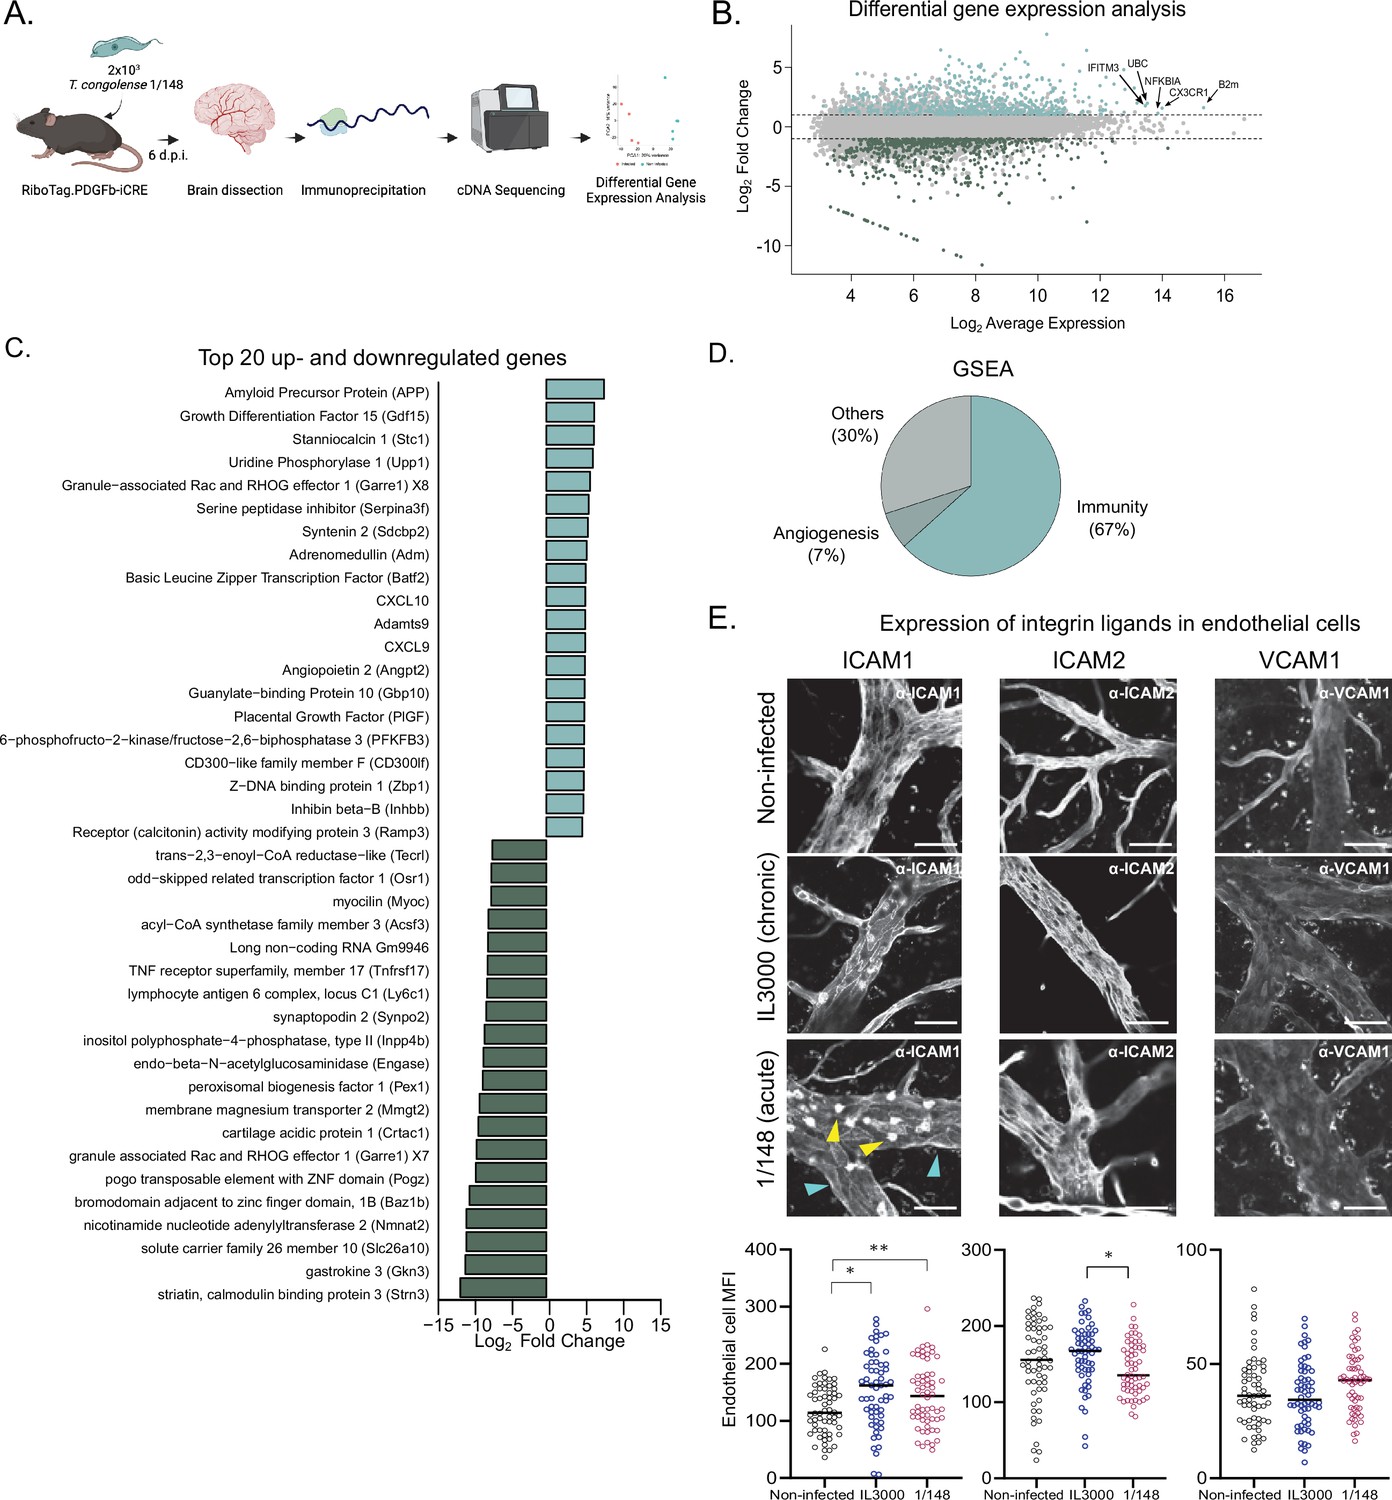
T. congolense infection induces a pro-inflammatory profile in brain endothelial cells.
(a). Schematics of the methodology used to compare the transcriptomes of brain endothelial cells. RiboTag.PDGFb.iCRE mice, under Cre recombinase induction, were infected with 2 × 10³ T. congolense 1/148 parasites intra-peritoneally. At day 6 post-infection, mice were euthanized, perfused and brains were dissected and homogenized. The polysomes of endothelial cells were immunoprecipitated and the RNA extracted and converted into cDNA, which was sequenced on a NextSeq 500 platform as 75 bp single-end reads (N=4–5). Figure created with https://biorender.com/. (b). Distribution of detected transcripts in terms of average expression and fold change between infected and non-infected conditions. Transcripts upregulated in infection are shown in red (N=612), downregulated transcripts are shown in blue (N=588). The top most abundant upregulated transcripts are identified: beta-2 microglobulin (B2m), chemokine (C-X3-C motif) receptor 1 (Cx3cr1), nuclear factor of kappa light polypeptide gene enhancer in B cells inhibitor, alpha (Nfkbia), ubiquitin C (UBC), and interferon induced transmembrane protein 3 (Ifitm3). (c). The 20 most up- and downregulated transcripts detected upon infection, ordered by log2 fold change. (d). Enriched gene sets upon infection (FDR < 0.05) detected by gene ontology-based gene set enrichment analysis (Subramanian et al., 2005), produced by WEBgestalt (Wang et al., 2017), and ordered by the normalized enriched score. (e). Mean fluorescent intensity of ICAM1, ICAM2, and VCAM in the brain endothelium in non-infected mice and in mice infected with T. congolense 1/148 or IL3000, at the first peak of parasitemia, and respective representative images. Black lines represent mean. Stars indicate statistically significant results; repeated measures one-way ANOVA with Tukey’s multiple comparisons test, * p<0.05; ** p<0.01; *** p<0.001; **** p<0.0001.
Figure 3—figure supplement 1
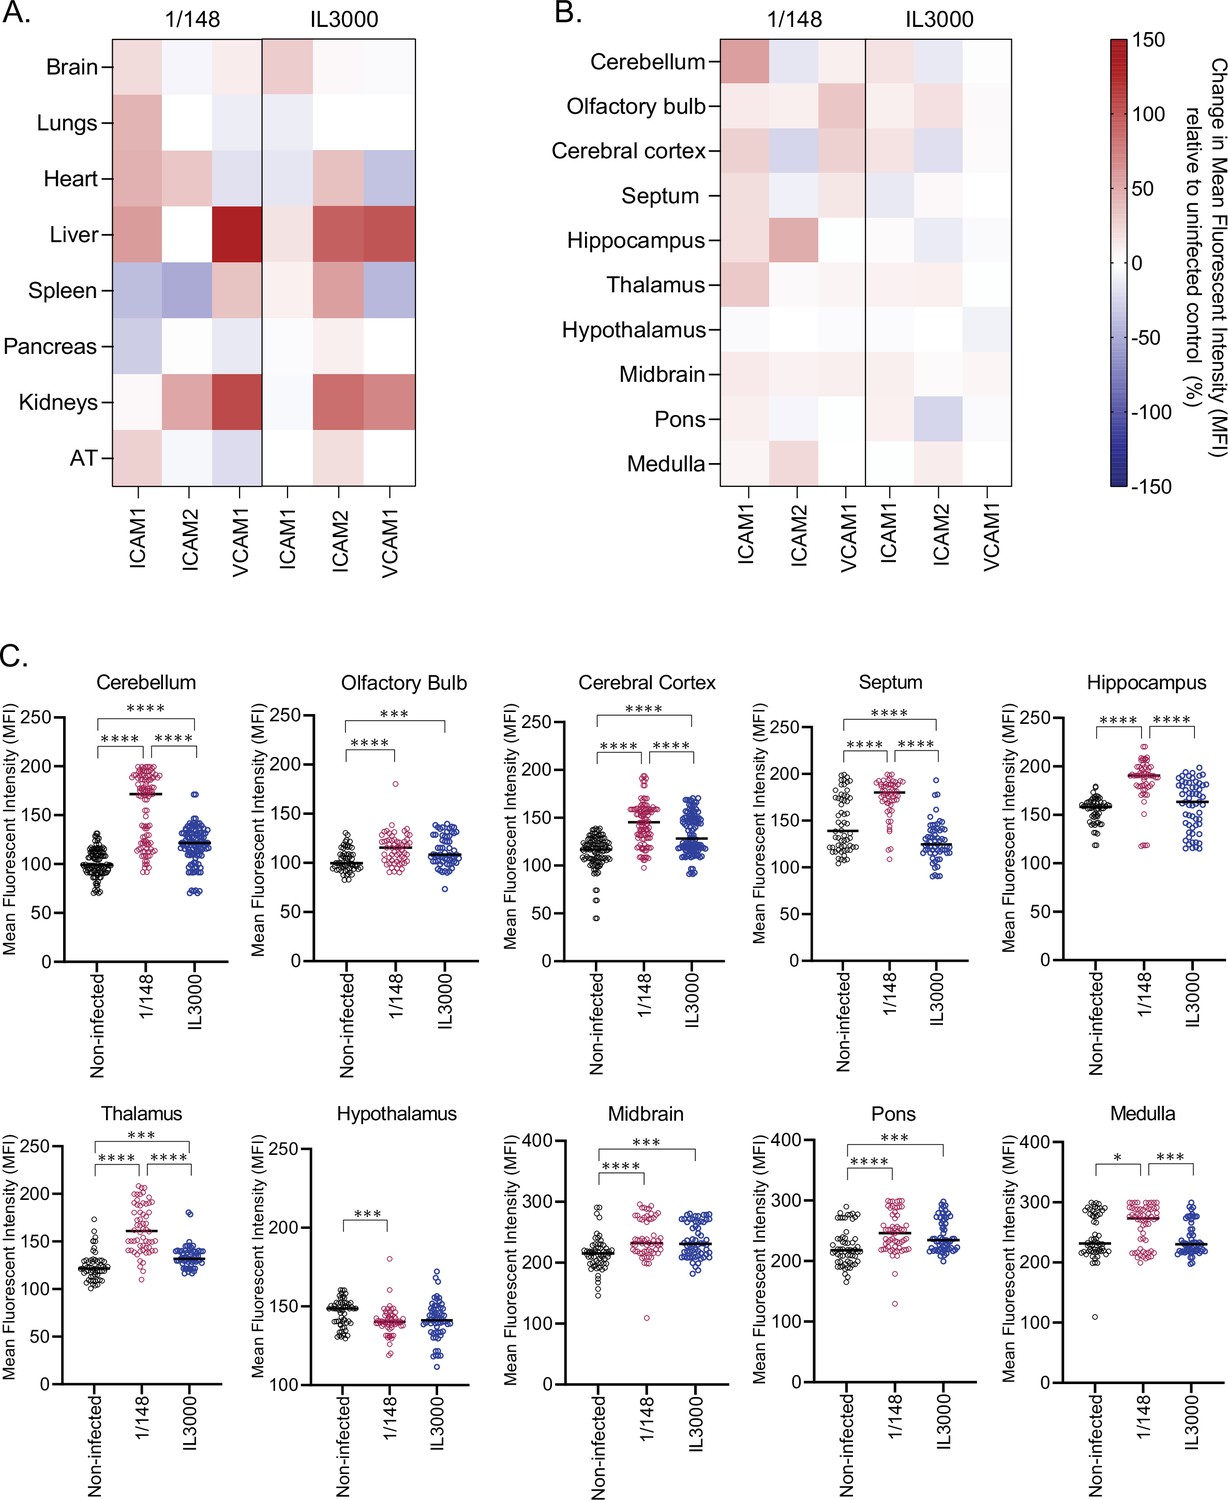
Expression of endothelial cell surface integrin ligands ICAM1, ICAM2, and VCAM1 at the first peak of infection with either T. congolense 1/148 or IL3000.
(a). Mean fluorescent intensity of endothelial ICAM1, ICAM2, and VCAM1 in major organs, relative to uninfected control (%). (b). Mean fluorescent intensity of endothelial ICAM1, ICAM2, and VCAM1 in distinct anatomical regions of the brain, relative to uninfected control (%). (c). Mean fluorescent intensity of endothelial ICAM1 in distinct anatomical regions of the brain. Stars indicate statistically significant results; Repeated Measures One Way ANOVA with Tukey’s Multiple Comparisons Test, * p<0.05; ** p<0.01; *** p<0.001; **** p<0.0001.
Figure 4 with 2 supplements
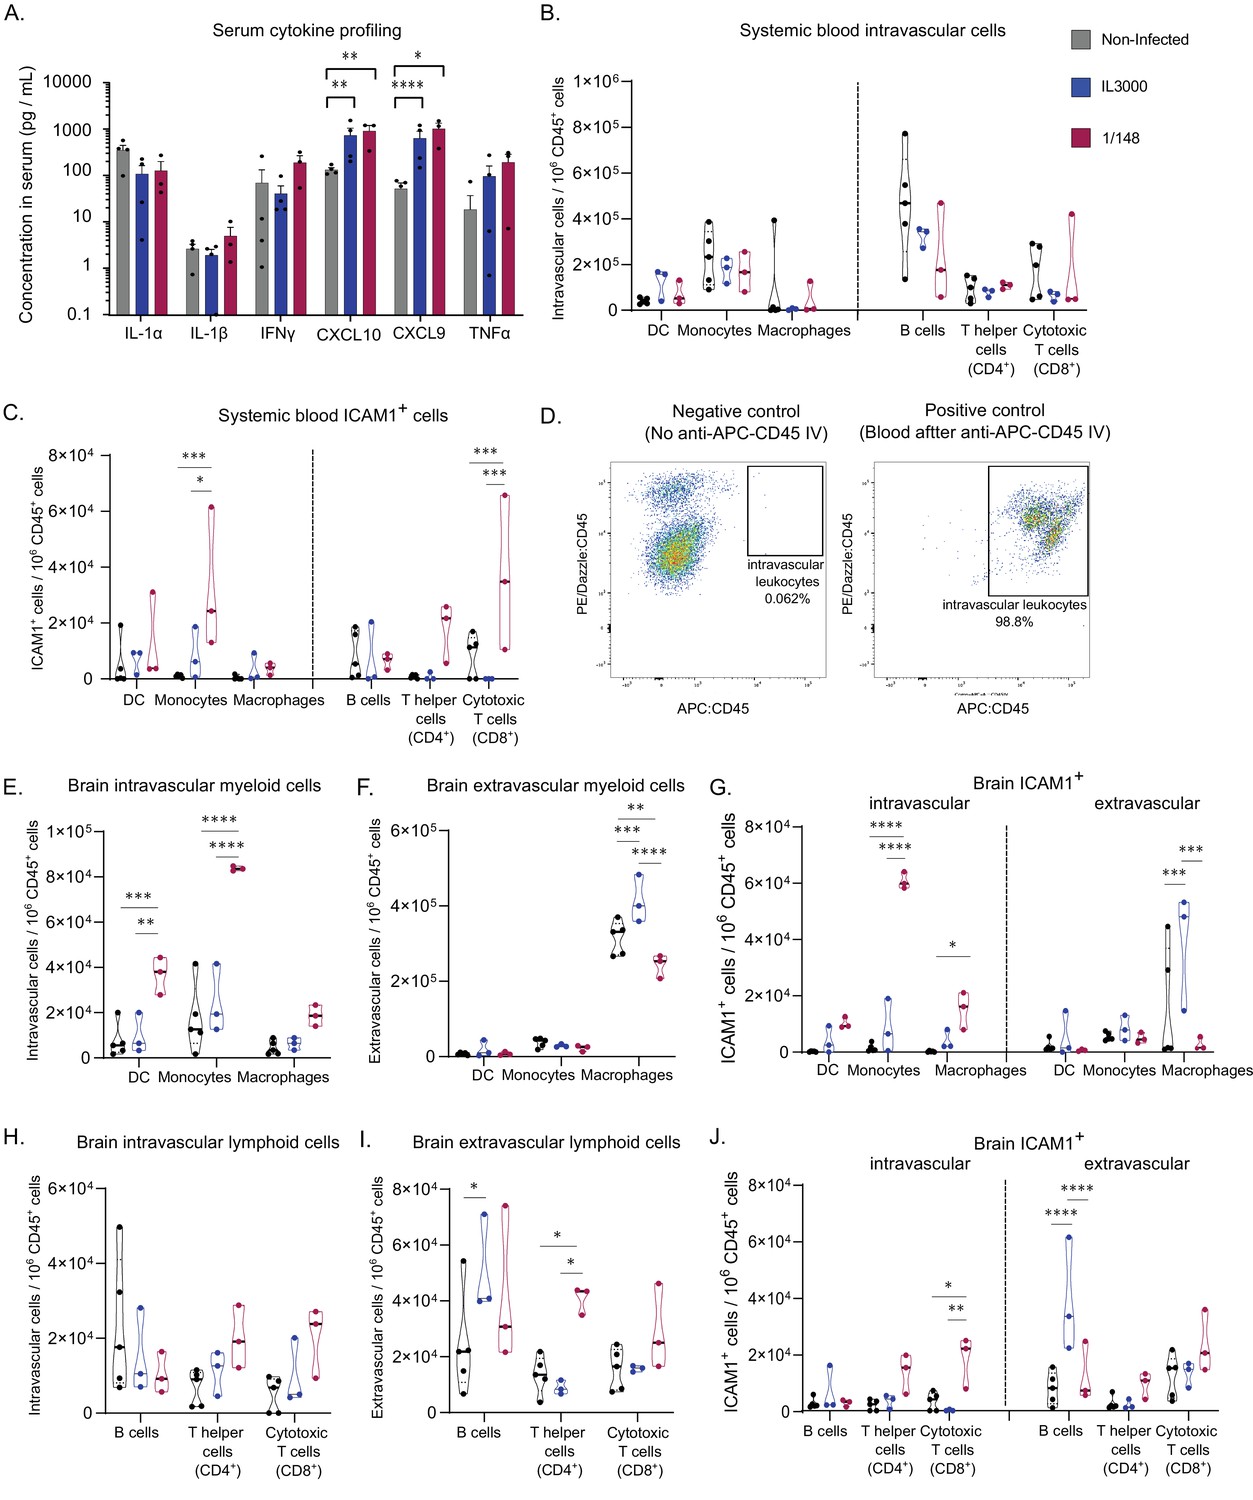
Characterization of immune response in the systemic blood and brain at the first peak of parasitemia post-infection with T. congolense 1/148 or IL3000.
(a). Serum concentration of IL-1α, IL-1β, IFNγ, CXCL10, CXCL9, TNFα in non-infected mice and mice infected with either 1/148 or IL3000, at the first peak of parasitemia (Mean ± SEM; N=3–4). (b). Number of myeloid (CD11b+) and lymphoid (CD3+, CD19+) cells per mL of blood, separated by cell type (CD11c+ Dendritic Cells, Ly6C+ Monocytes, and F4/80 Macrophages, CD19+ B cells, CD3+CD4+ T cells, CD3+CD8+ T cells) in non-infected and infected mice. (c). Number of leukocytes (CD45+) expressing ICAM1 per mL of blood, separated by cell type, in non-infected and infected mice. (d). Left: Representative graph of brain cells from an infected mouse that did not receive APC-CD45 intravenous injection, showing no cells on the APC-CD45 gate (negative control). Right: Representative image of blood cells from an infected mouse that received APC-CD45 intravenous injection, showing that, as expected, almost all cells were APC-CD45+ (positive control). (e). Number of intravascular (APC:CD45-) myeloid (CD11b+) cells per brain of mice, separated by cell type in non-infected and infected mice. (f). Number of extravascular (APC:CD45+) myeloid (CD11b+) cells per brain of mice, separated by cell type, in non-infected and infected mice. (g). Number of intravascular (APC:CD45-) and extravascular (APC:CD45+) myeloid (CD11b+) cells expressing ICAM1 per brain of mice, separated by cell type, in non-infected and infected mice. (h). Number of intravascular (APC:CD45-) non-myeloid (CD11b-) cells per brain of mice, separated by cell type in non-infected and infected mice. (i). Number of extravascular (APC:CD45+) non-myeloid (CD11b-) cells per brain of mice, separated by cell type, in non-infected and infected mice. (j). Number of intravascular (APC:CD45-) and extravascular (APC:CD45+) non-myeloid (CD11b-) cells expressing ICAM1 per brain of mice, separated by cell type, in non-infected and infected mice. Stars indicate statistically significant results; unpaired t-test, * p<0.05; ** p<0.01; *** p<0.001; **** p<0.0001. Black line indicates mean. N=3.
Figure 4—figure supplement 1
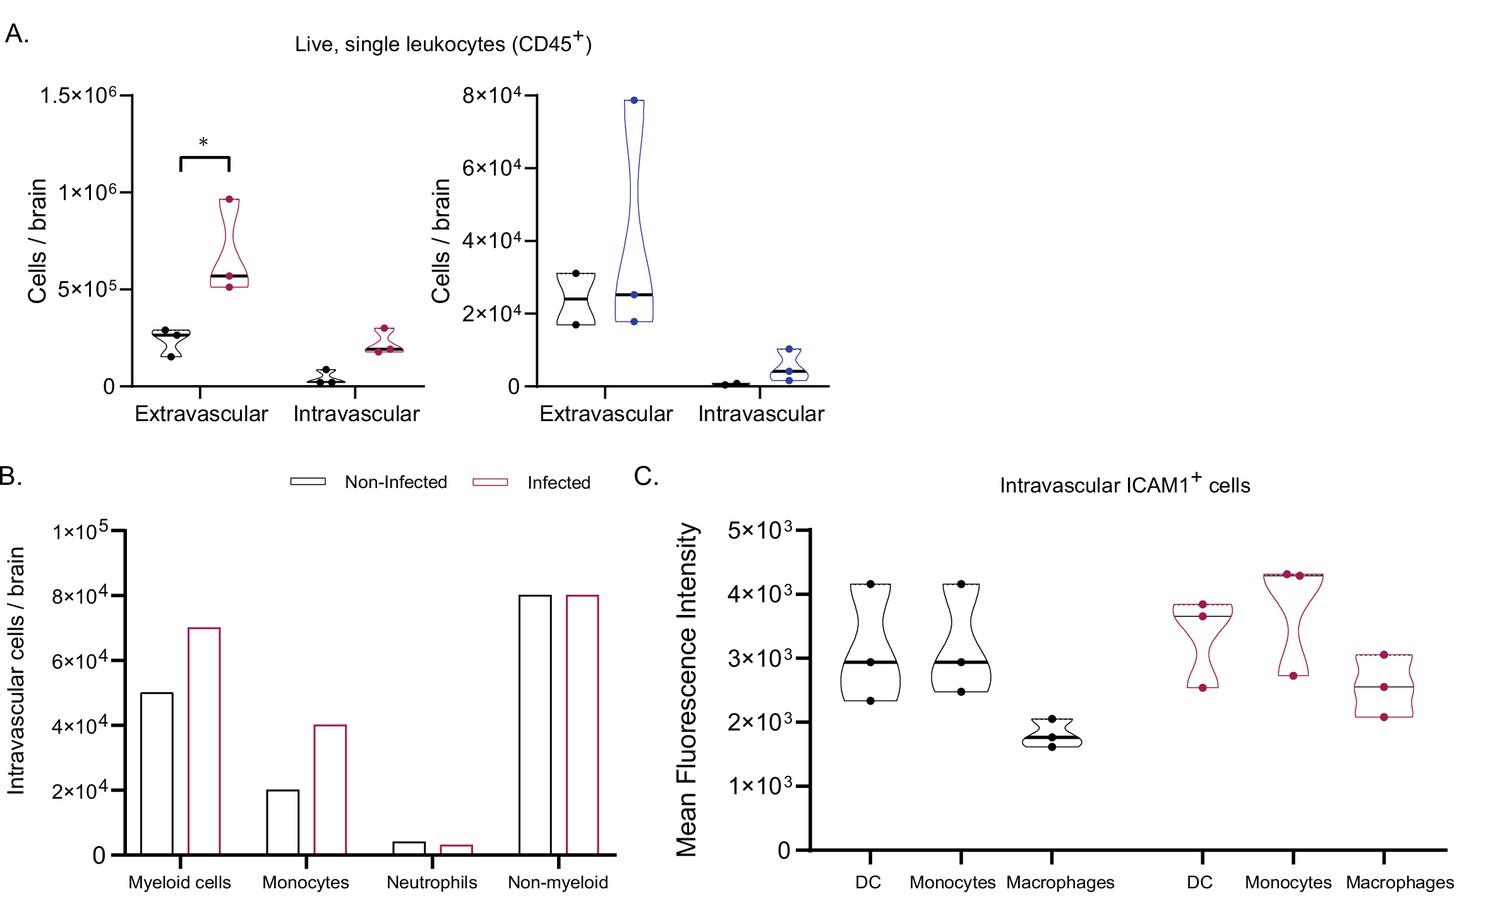
Analysis of extra and intravascular leukocytes in the brain.
(a). Number of extra- and intravascular live, single leukocytes (CD45+) in non-infected and infected mice, at first peak of parasitemia in 1/148 (red) or IL3000 (blue) infections. (b). Number of intravascular (APC:CD45+) cells in the brain of one non-infected mouse and one mouse infected with T. congolense 1/148, at day 6 post-infection. Myeloid cells are CD11b+, non-myeloid cells are CD11-, Monocytes are Ly6G-Ly6+, and Neutrophils are Ly6G+. Mean, N=1 (c). Mean fluorescent intensity (MFI) of intravascular ICAM1 +myeloid cells in non-infected and infected mice. Stars indicate statistically significant results; two-way ANOVA and unpaired t-test, ** p<0.01; *** p<0.001; **** p<0.0001. Black line indicates mean. N=3.
Figure 4—figure supplement 2
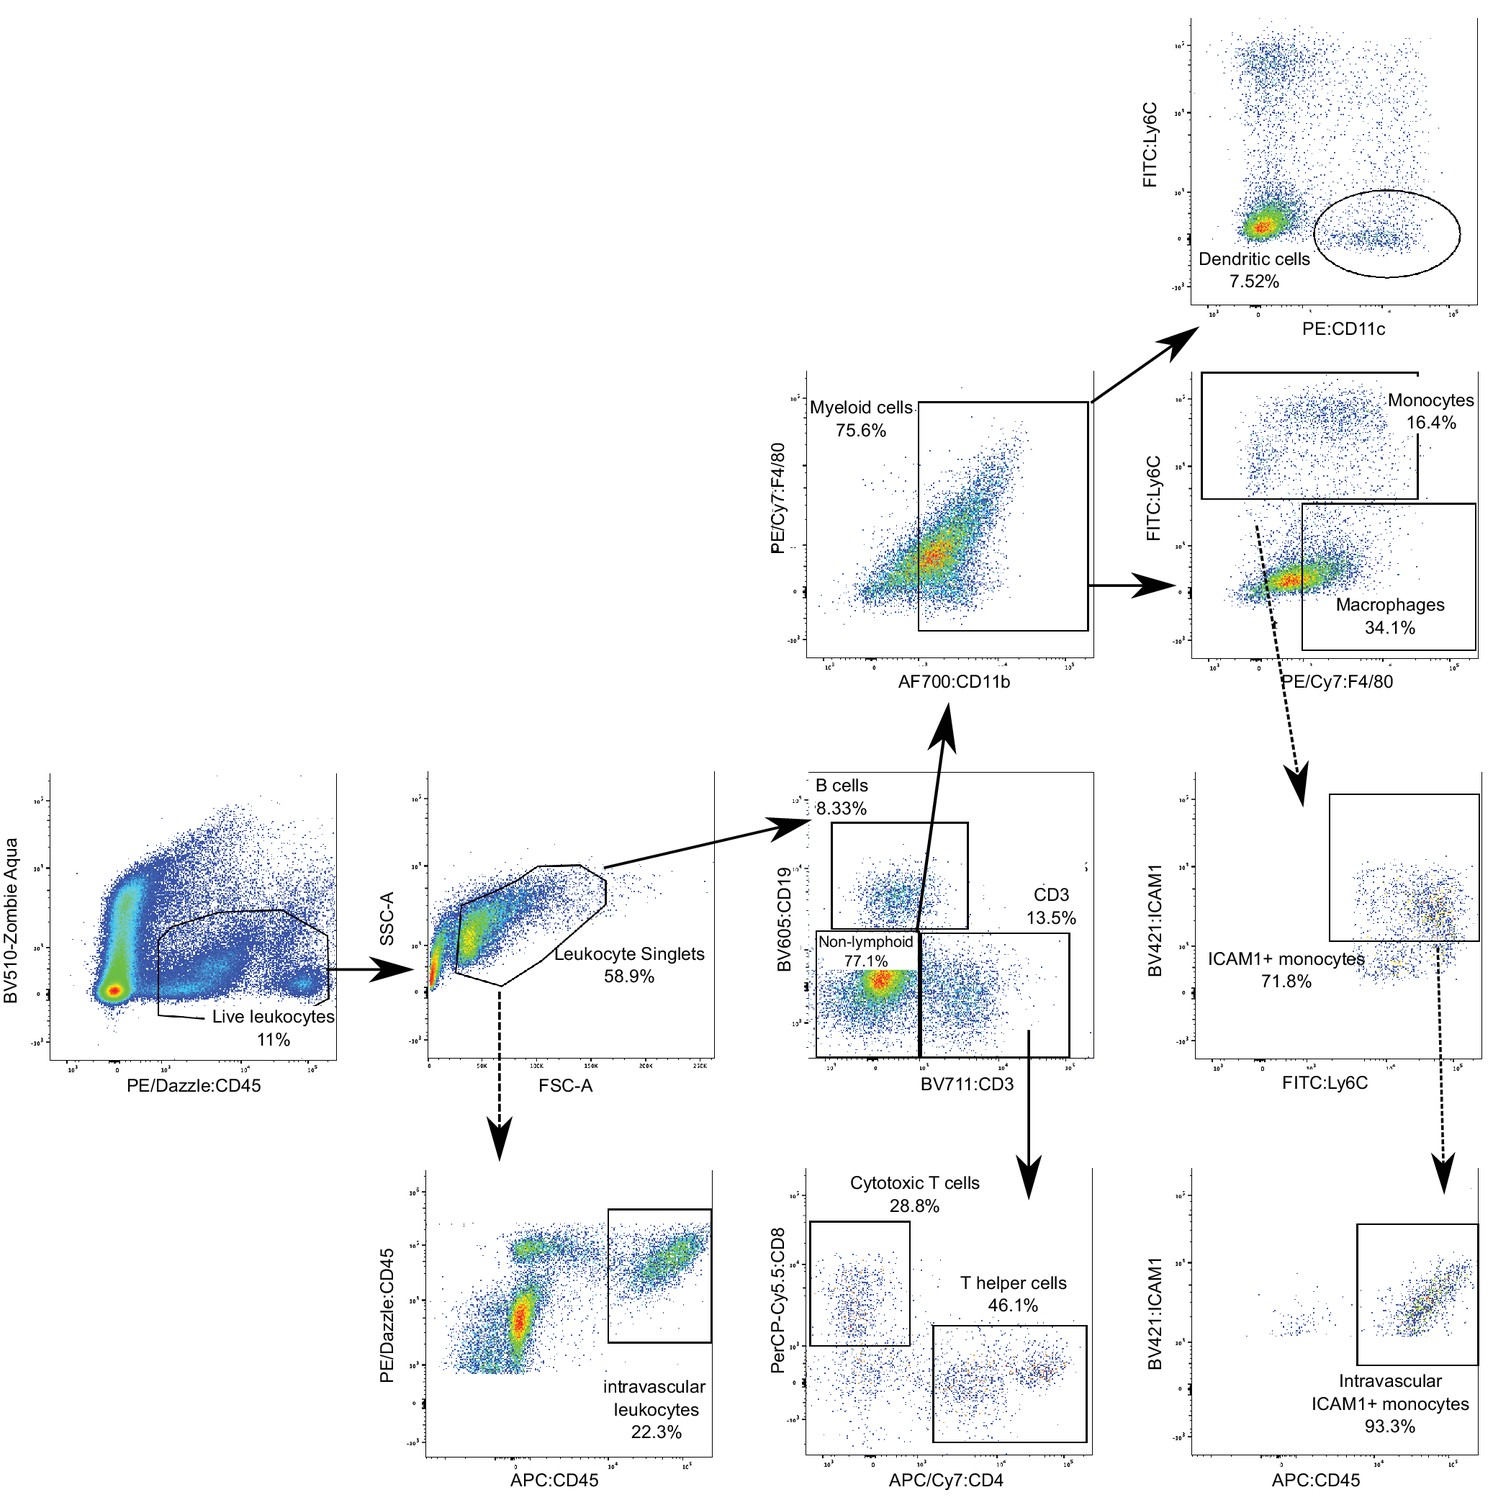
Gating strategy for the characterization of systemic and brain leukocyte populations.
Live leukocytes were gated as positive for PE/Dazzle:CD45 and negative for zombie aqua cell viability dye; Leukocyte single cells were selected based on a proportional forward (FSC-A) versus side scatter (SSC-A) area. Intravascular leukocytes were considered if positive for APC:CD45, which had been previously administered intravenously. Extravascular leukocytes were quantified as the difference of total leukocytes and intravascular leukocytes. This strategy was repeated for all cell subsets, although only one example is shown. From the leukocyte singlets, we selected lymphoid (CD3+ for T cells or CD19+ for B cells) cells and non-lymphoid cells. From the non-lymphoid cells, myeloid cells were selected based on positive CD11 expression. Myeloid cells were further divided into dendritic cells, based on the CD11c marker, monocytes (Ly6C marker), or macrophages (F4/80 marker). CD3+ cells were further divided into CD4+ or CD8+ to detect T helper or cytotoxic T cells, respectively. Each of these subsets were further gated on BV421:ICAM1 to quantify the proportion of ICAM1+ cells. This strategy was repeated for all subsets, although only one example is shown.
Figure 5 with 1 supplement
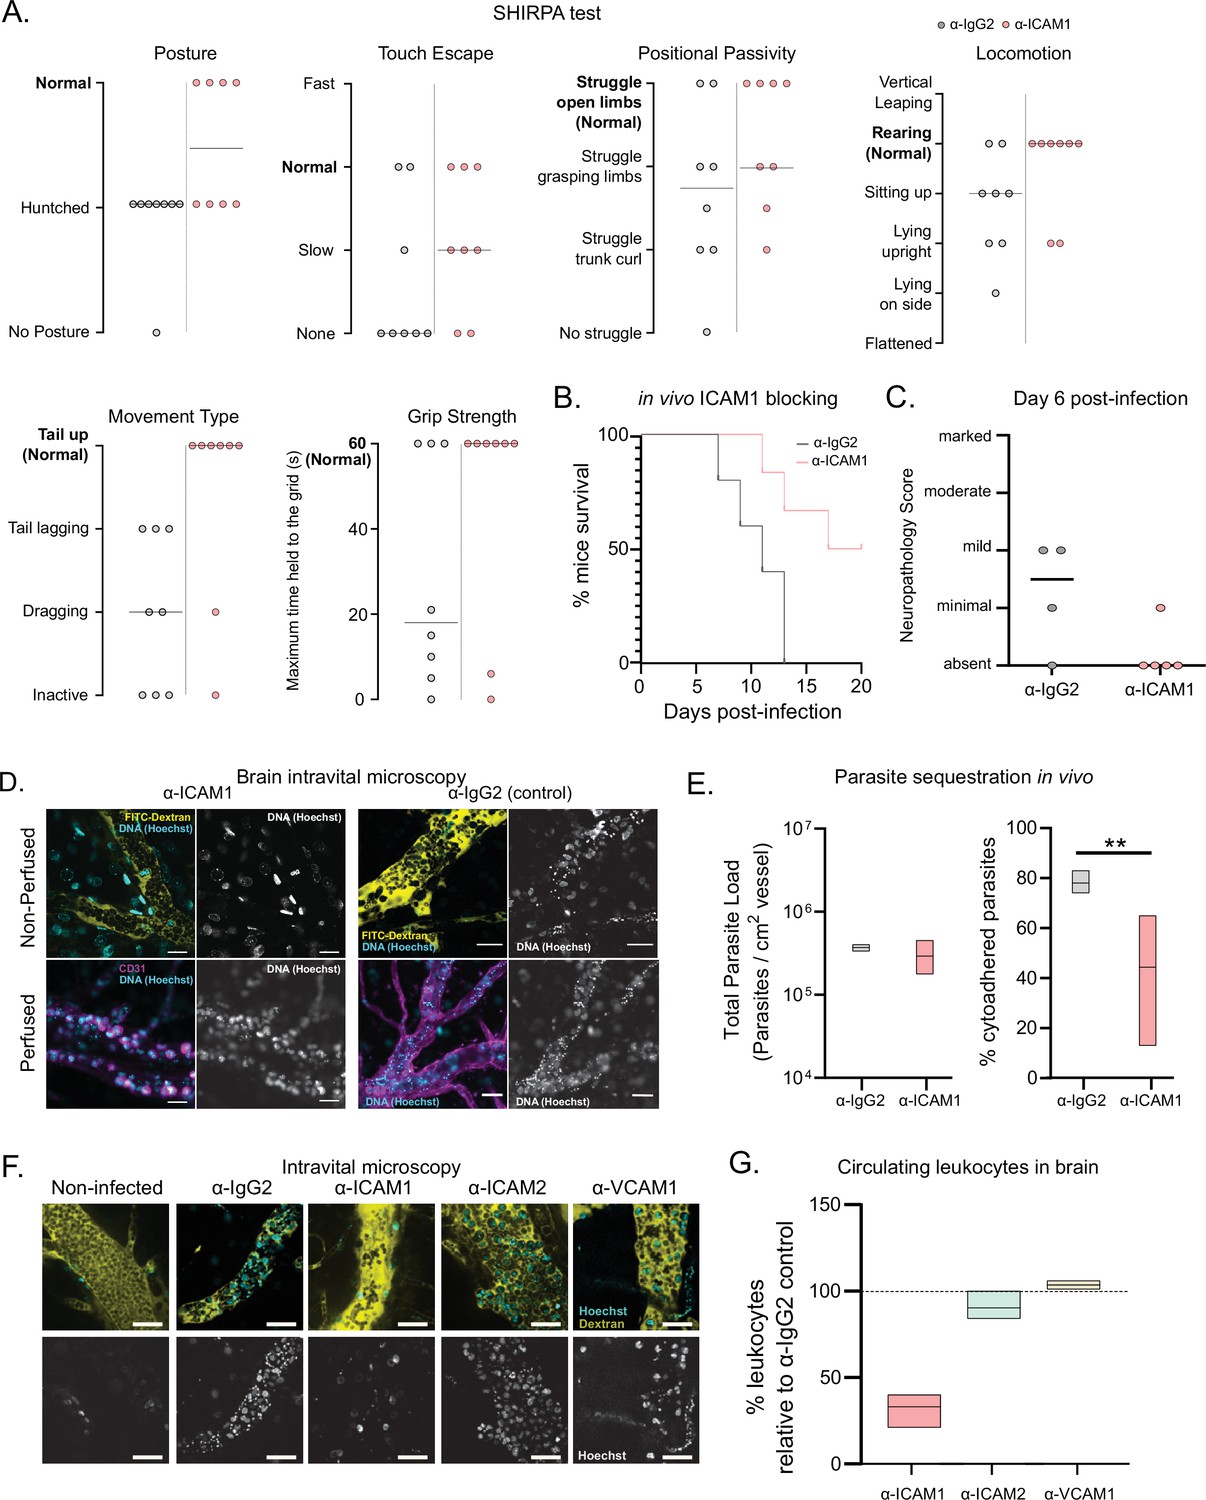
Phenotypic effects of anti-ICAM1 antibody treatment in mice infected with T. congolense 1/148.
(a). Behavioral assessment of mice treated with either α-ICAM1 antibody or its isotype control (α-IgG2), based on the SHIRPA protocol. The parameters assessed and shown are: Posture, Touch Escape, Positional Passivity, Locomotion, Movement Type (and tail posture), and Grip Strength: Time (in s) that mice can hold upside down on a grid (maximum of 1 min). Black line indicates median. (b). Mice survival curves following treatment with α-ICAM1 or its isotype control α-IgG2. Results were pooled from two independent experiments (N=6). (c). Neuropathology score at day 6 post-infection of mice infected with T. congolense 1/148, treated with α-ICAM1 antibody or its isotype control (N=4–5). Black line indicates median. (d). Representative images obtained by intravital microscopy, of parasite sequestration in the brain vasculature upon treatment with α-ICAM1 antibody or its isotype control with and without perfusion, at day 6 post-infection. Scale bar = 30 µm. (e). Parasite load (left) and percentage of parasite sequestration (right) in the brain of mice at day 6 post-infection upon treatment with α-ICAM1 antibody or its isotype control, quantified by intravital microscopy (N=3 in 3 independent infections). Stars indicate statistically significant results; mixed models, ANOVA, multiple comparisons test, * p<0.05; ** p<0.01; *** p<0.001; **** p<0.0001. (f). Representative images obtained by intravital microscopy, of leukocytes in the brain vasculature in non-infected mice, and mice infected with T. congolense 1/148, but treated with antibodies against IgG2 (isotype control), ICAM1, ICAM2, or VCAM1. Nuclei are stained with Hoechst dye and shown in green. (g). Percentage of nucleated cells (leukocytes) found circulating in the brain vasculature at day 6 post-infection in mice treated with α−ICAM1, ICAM2, or VCAM1, relative to the isotype control (represented as 100%). Black line indicates mean. (N=3 in 3 independent infections).
Figure 5—figure supplement 1
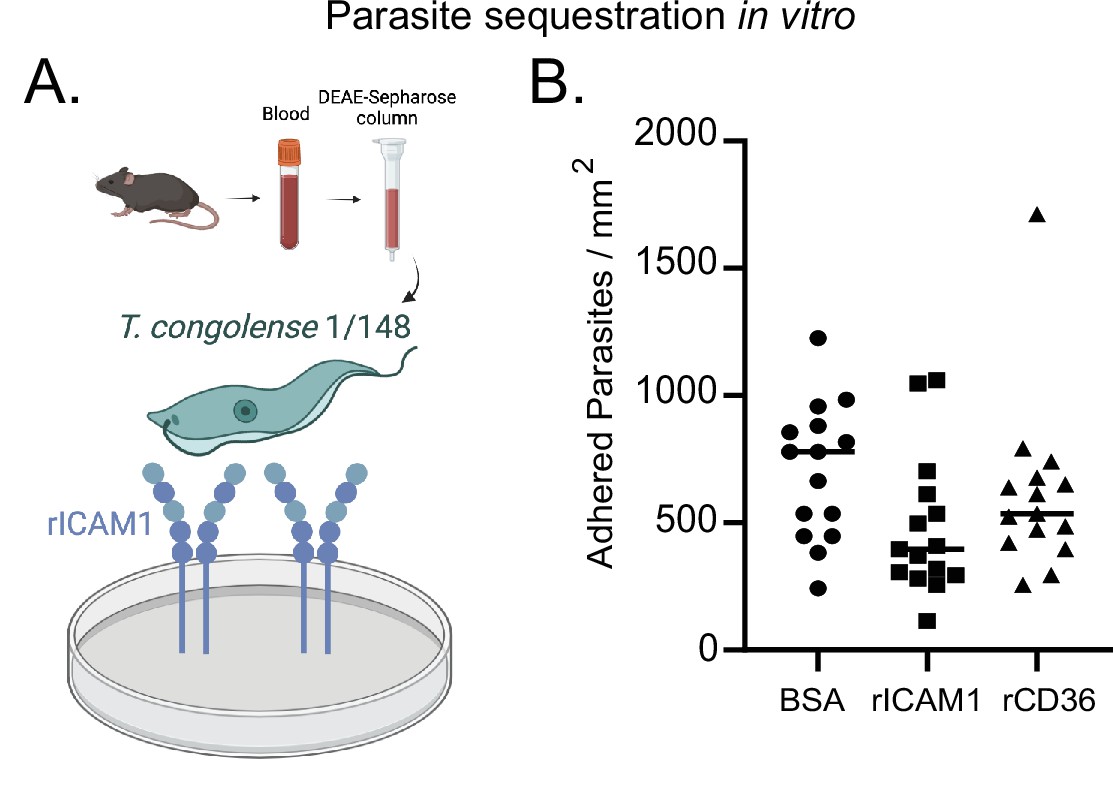
Quantification of parasite binding to recombinant ICAM1 protein in vitro.
(a) Schematics of in vitro recombinant ICAM1 binding assay used to assess parasite sequestration in vitro. T. congolense 1/148 parasites in blood were collected from a donor mouse and separated from the blood by anion exchange chromatography on a DEAE-sepharose column. Parasites were added to culture plates previously coated with recombinant ICAM1 and parasite binding was assessed by microscopy. Figure created with https://biorender.com/. (b). Quantification of parasite binding to bovine serum albumin (blocking protein), recombinant ICAM1 (rICAM1), or recombinant CD36 (rCD36) (negative control). Black line indicates mean.
Figure 6 with 1 supplement
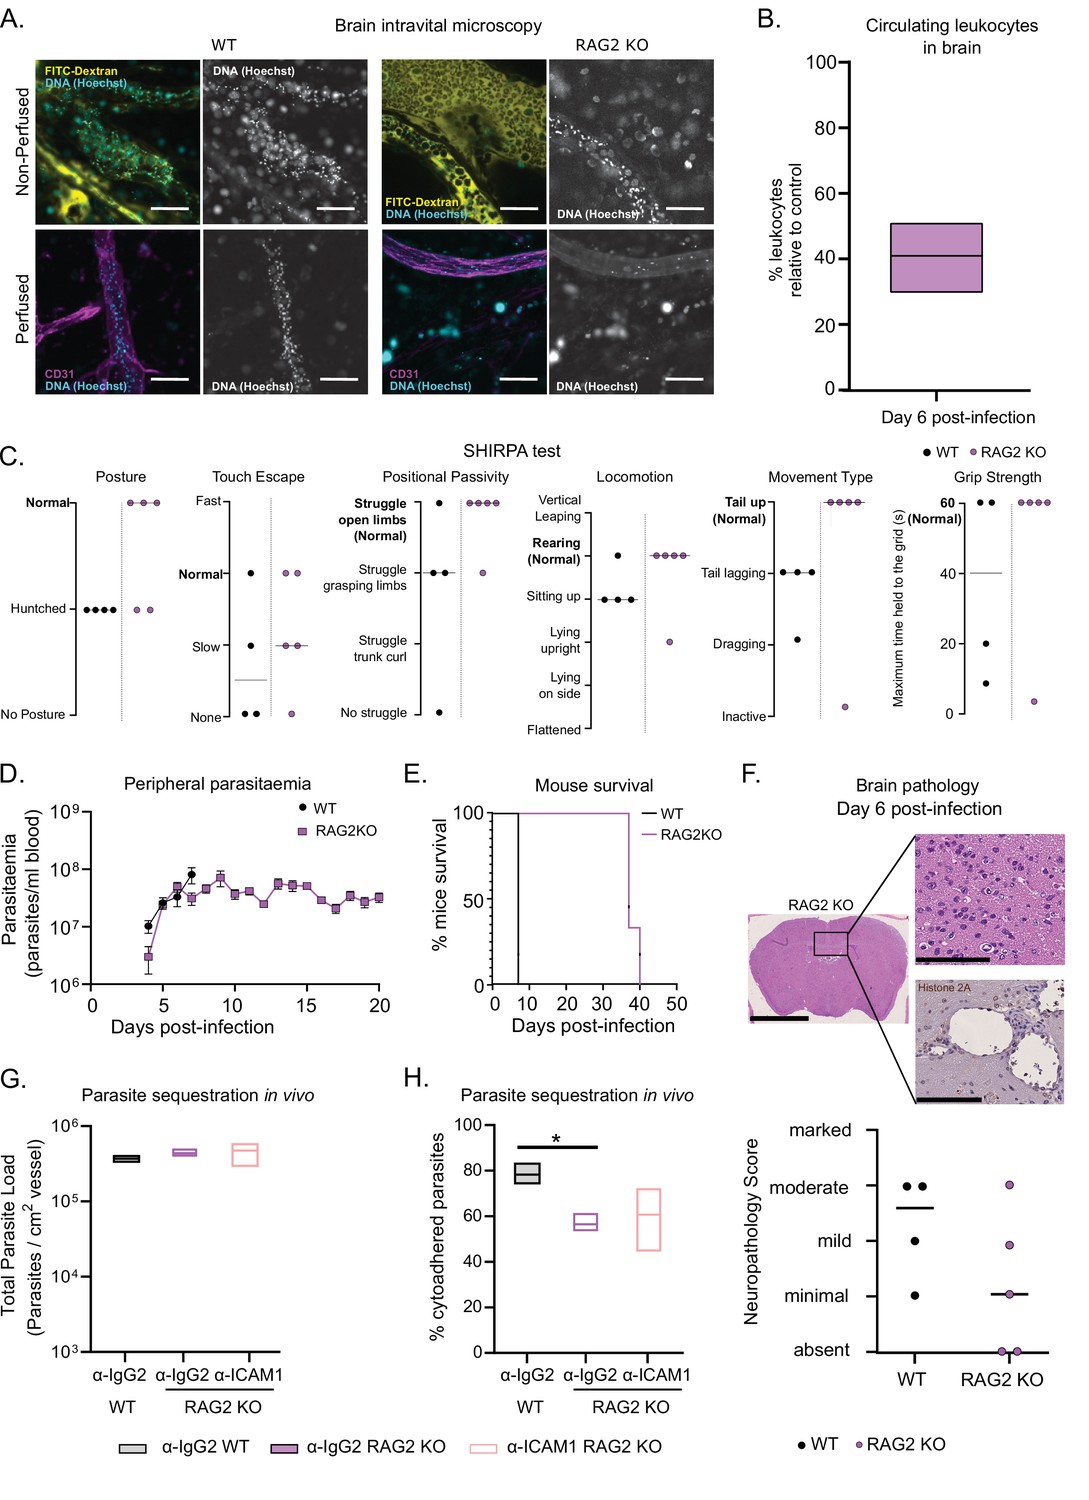
T. congolense 1/148 sequestration and infection progression in RAG2 KO mice.
(a). Representative images of parasite sequestration in brains of WT and RAG2 KO mice with and without perfusion, at day 6 post-infection. Scale bar = 30 µm. (b). Percentage of leukocytes found in the brain vasculature at day 6 post-infection in RAG2 KO mice relative to WT control. (c). Behavioral assessment of mice treated with either a-ICAM1 antibody or its isotype control (a-IgG2), based on the SHIRPA protocol. Black line indicates median. (d). Parasitemia curve of T. congolense 1/148 in WT or RAG2 KO mice, measured by hemocytometry. Mean ± SEM (e). Mice survival curves of WT and RAG2 KO mice (N=4). (f). Top: Neuropathology score at day 6 post-infection of RAG2 KO and WT mice infected with T. congolense 1/148 (N=4–5). Black line indicates median. Bottom right: Representative histological hematoxylin nd eosin staining of brain of a RAG2 KO mouse infected with strain 1/148, showing absence of lesions in the brain parenchyma (Scale bar = 2.5 mm). Top right: high-magnification of brain parenchyma (scale bar = 100 µm). Bottom right: Immuno-histochemical staining of trypanosome H2A (brown) showing little parasite sequestration in the brain vasculature. Scale bar = 100 µm. (g). Parasite load in the brain of WT or RAG2 KO mice, treated with either α-IgG2 or α-ICAM1 antibody, quantified by intravital microscopy, at day 6 post-infection. (h). Percentage of cytoadhered parasites in the brain of WT or RAG2 KO mice, treated with either α-IgG2 or α-ICAM1 antibody, quantified by intravital microscopy. Stars indicate statistically significant results; two-way ANOVA, multiple comparisons test, * p<0.05; ** p<0.01; *** p<0.001; **** p<0.0001. (N=3 in 3 independent infections).
Figure 6—figure supplement 1

Effect of monocyte/macrophage depletion on T. congolense 1/148 infections.
(a). Parasitemia curve of T. congolense 1/148 in mice treated with clodronate liposomes, PBS liposomes, or PBS only, measured by hemocytometry. Mean ± SEM. (b). Mice survival curves of mice treated with clodronate liposomes, PBS liposomes, or PBS only (N=3–4). (c). Neuropathology score at day 6 post-infection of mice infected with T. congolense 1/148 and treated with clodronate liposomes, PBS liposomes, or PBS only (N=3–4). Black line indicates median. Groups are color-coded according to key.
Figure 7
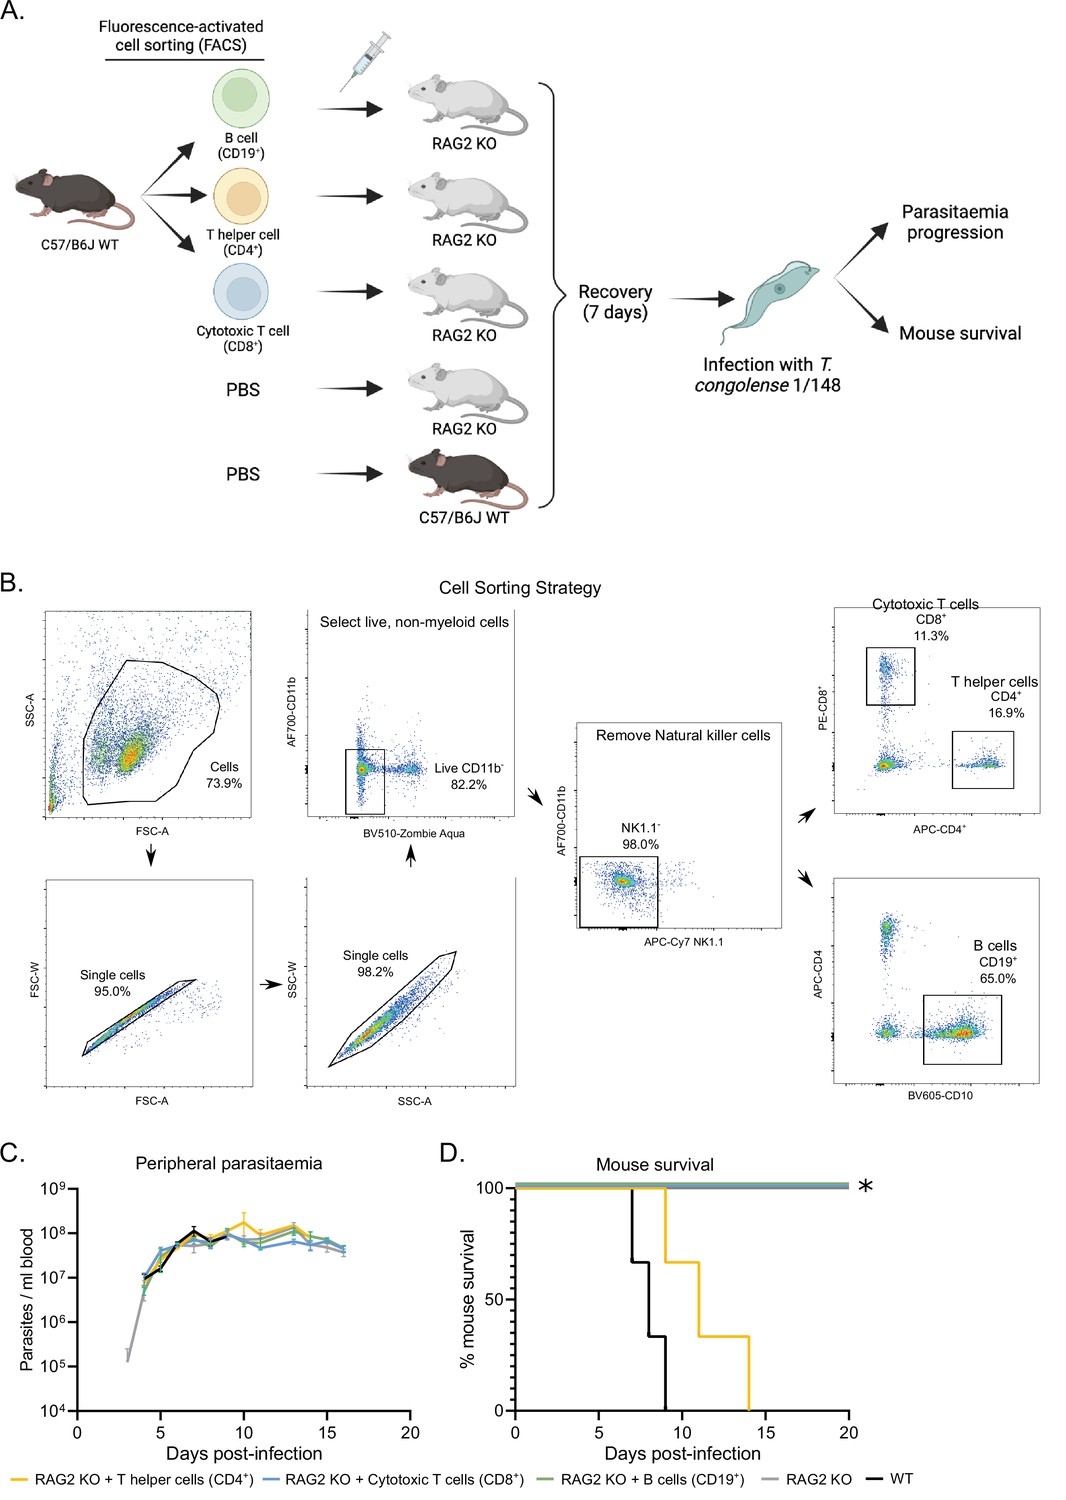
Phenotypic effects of adoptive lymphoid cell transfer into RAG2 KO mice before infection with T. congolense 1/148.
(a). Schematics depicting experimental procedure. Cells were harvested from the spleens and lymph nodes of three C57BL/6 J wild-type mice and stained for different lymphoid cell subsets. (B) cells (CD19+), T helper cells (CD4+), and cytotoxic T cells (CD8+) were sorted and collected by flow cytometry, and injected intravenously into naïve RAG2 KO mice. Two control groups comprising either RAG2 KO mice or wild-type mice received a similar volume of vehicle. Mice were allowed to recover for 7 days, after which they were infected with T. congolense 1/148. Infection progression was assessed daily. Figure created with https://biorender.com/. (b). Gating strategy used for fluorescence-activated cell sorting, in order to select pure B cells, T helper cells and cytotoxic T cells. (c). Parasitemia curve of mice infected with T. congolense 1/148, estimated by hemocytometry. (d). Mouse survival following infection with T. congolense 1/148. Experiment was terminated at day 20 post-infection. N=3.
Figure 8
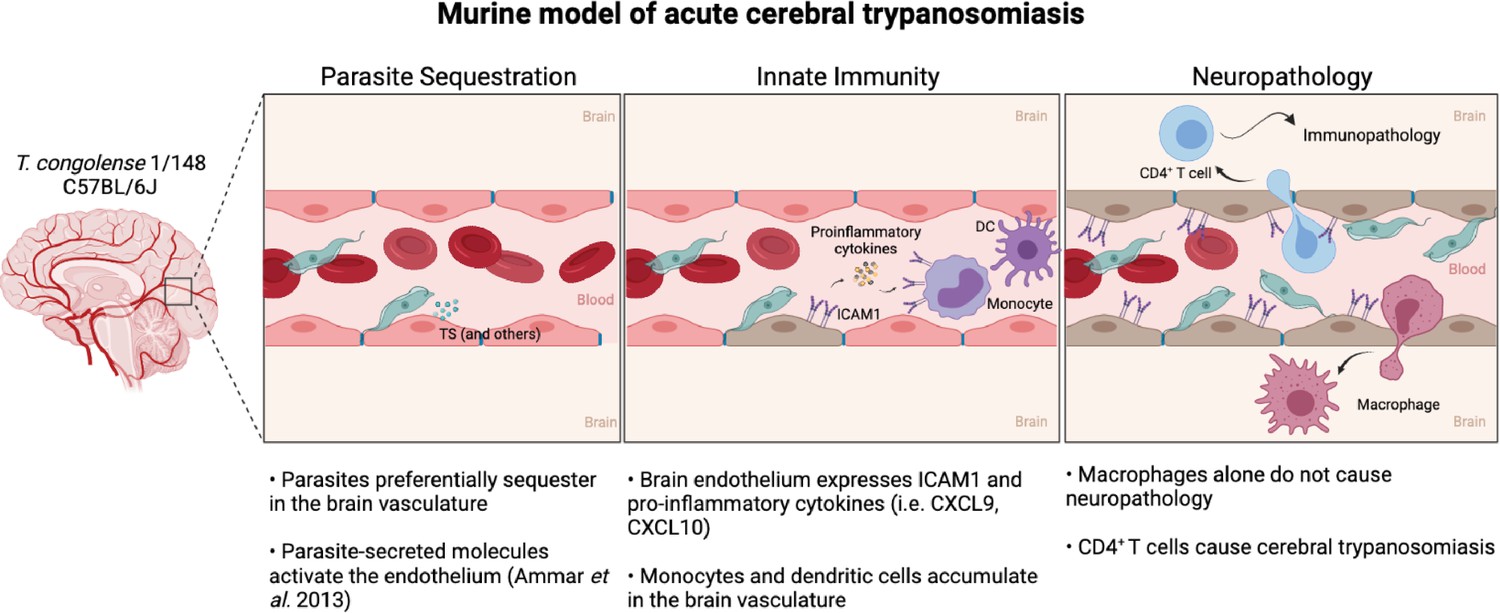
Murine model of cerebral animal African trypanosomiasis.
Upon infection of C57BL/6 J mice with T. congolense 1/148 parasites cytoadhere to the brain vasculature (‘Parasite Sequestration’). The physical damage caused by sequestration and the release of parasitic molecules, like trans-sialidases, activates the endothelium leading to an increase in expression and secretion of pro-inflammatory molecules (e.g. ICAM1, IFNγ, CXCL9, CXCL10), as well as the recruitment of innate cells (i.e. DC, monocytes) (‘Innate Immunity’). Innate cells and activated endothelial cells recruit T cells to the brain vasculature and promote monocyte differentiation into inflammatory macrophages. Although both T cells and inflammatory macrophages can cross the blood-brain-barrier and infiltrate the brain parenchyma, only CD4+ T cells cause the neuropathology associated with acute disease (‘Neuropathology’). Figure created with https://biorender.com/.
Videos
Video 1
Intravital imaging of mouse brain microvasculature at day 6 post-infection with T. congolense 1/148, showing differentiation between parasites and leukocytes.
Imaging was done in a non-perfused mouse, under blocked flow. DNA is stained with Hoechst (yellow); intravascular environment is stained with FITC-Dextran (black and white).
Video 2
3D reconstruction (Z-stack) of brain vasculature at day 6 post-infection with T. congolense 1/148.
DNA is stained with Hoechst (cyan); intravascular environment is stained with FITC-Dextran (green); vascular walls are labelled with anti-CD31 (purple).
Video 3
Intravital imaging of mouse brain microvasculature at day 6 post-infection with T. congolense 1/148.
Imaging was done in a non-perfused mouse, under unblocked flow. DNA is stained with Hoechst; intravascular environment is stained with FITC-Dextran.
Video 4
Intravital imaging of a mouse pancreatic arteriole at day 6 post-infection with T. congolense 1/148.
Imaging was done in a non-perfused mouse, under unblocked flow. DNA is stained with Hoechst; intravascular environment is stained with FITC-Dextran.
Video 5
Intravital imaging of mouse brain microvasculature at day 6 post-infection with T. congolense 1/148, showing parasite motility under fast flow.
Imaging was done in a non-perfused mouse, under unblocked flow along the vascular endothelium. Parasites can be observed moving against flow. DNA is stained with Hoechst (cyan); intravascular environment is stained with FITC-Dextran (yellow).
Video 6
Intravital imaging of mouse pancreatic microvasculature at day 6 post-infection with T. congolense 1/148, showing parasite motility under slow flow.
Imaging was done in a non-perfused mouse, under unblocked flow. DNA is stained with Hoechst (cyan); intravascular environment is stained with FITC-Dextran (yellow).
Video 7
Intravital imaging of mouse brain microvasculature at day 6 post-infection with T. congolense 1/148, showing parasite attached to the endothelial cell with the distal flagellum.
Imaging was done in a non-perfused mouse, under unblocked flow. DNA is stained with Hoechst; intravascular environment is stained with FITC-Dextran.
Tables
Author response table 1
Mean fluorescent intensity of anti-ICAM1 in the brain.
| Intact Brain | Surgically-sectioned Brain | |||
|---|---|---|---|---|
| Extravascular | Intravascular | Extravascular | Intravascular | |
| Non-infected | 3.33 ± 0.39 | 165.45 ± 9.19 | 2.42 ± 0.15 | 171.6 ± 9.25 |
| 1/148 (acute) | 3.12 ± 0.44 | 243.35 ± 6.18 | 2.65 ± 0.18 | 248.00 ± 7.55 |
| IL3000 (chronic) | 2.48 ± 0.15 | 235.40 ± 12.71 | 2.87 ± 0.27 | 224.50 ± 13.32 |
Author response table 2
Mean fluorescent intensity of anti-ICAM1, anti-ICAM2, and anti-VCAM1 in the brain vascular endothelium and circulating leukocytes.
| Endothelium | Leukocytes | |||||
|---|---|---|---|---|---|---|
| Non-infected | 1/148 | IL3000 | Non-infected | 1/148 | IL3000 | |
| ICAM1 | 118.96 ± 9.43 | 144.19 ± 12.61 | 155.15 ± 14.50 | 108.18 ± 5.54 | 504.50 ± 18.33 | 511.03 ± 17.35 |
| ICAM2 | 153.59 ± 11.91 | 143.51 ± 7.72 | 161.87 ± 8.72 | 147.48 ± 10.16 | 336.58 ± 16.59 | 306.17 ± 15.56 |
| VCAM1 | 37.99 ± 3.48 | 42.15 ± 2.92 | 36.35 ± 3.25 | Undetectable | Undetectable | Undetectable |
Additional files
-
Supplementary file 1
Sequencing statistics and transcripts detected from ribosome profiling of the brain endothelial cells at day 6 post-infection with T. congolense 1/148.
- https://cdn.elifesciences.org/articles/77440/elife-77440-supp1-v2.xlsx
-
Supplementary file 2
Input gene list, gene set results, and annotation of the Gene Set Enrichment Analysis (GSEA) of transcripts upregulated in the brain endothelial cells upon infection with T. congolense 1/148.
- https://cdn.elifesciences.org/articles/77440/elife-77440-supp2-v2.xlsx
-
Transparent reporting form
- https://cdn.elifesciences.org/articles/77440/elife-77440-transrepform1-v2.docx
-
Source data 1
Source data of main figures.
- https://cdn.elifesciences.org/articles/77440/elife-77440-data1-v2.xlsx
-
Source data 2
Source data of figure supplements.
- https://cdn.elifesciences.org/articles/77440/elife-77440-data2-v2.xlsx
Download links
A two-part list of links to download the article, or parts of the article, in various formats.
Downloads (link to download the article as PDF)
Open citations (links to open the citations from this article in various online reference manager services)
Cite this article (links to download the citations from this article in formats compatible with various reference manager tools)
Immunopathology and Trypanosoma congolense parasite sequestration cause acute cerebral trypanosomiasis
eLife 11:e77440.
https://doi.org/10.7554/eLife.77440


