DNA damage independent inhibition of NF-κB transcription by anthracyclines
- Instituto de Medicina Molecular, Faculdade de Medicina, Universidade de Lisboa, Portugal
- Innate Immunity and Inflammation Laboratory, Instituto Gulbenkian de Ciência, Portugal
- Institute of Structural Biology, Molecular Targets and Therapeutics Center, Helmholtz Zentrum München, Germany
- Bavarian NMR Centre, Department of Bioscience, School of Natural Sciences, Technical University of Munich, Germany
- NOVA Medical School (NMS), Portugal
- Centro Hospitalar Lisboa Norte - Hospital de Santa Maria, EPE, Avenida Professor Egas Moniz, Portugal
- Serviço de Cirurgia, Centro Hospitalar de Setúbal, Portugal
- EMBL Genomics Core Facilities, Germany
- Feil Family Brain and Mind Research Institute, Weill Cornell Medicine, United States
- Institute for Infectious Disease and Infection Control, Friedrich-Schiller University, Germany
- Department of Anesthesiology and Intensive Care Medicine, Jena University Hospital, Friedrich-Schiller University, Germany
- Leibniz Institute for Natural Product Research and Infection Biology, Hans Knöll Institute (HKI), Germany
- Inflammation Laboratory, Instituto Gulbenkian de Ciência, Portugal
- Department of Cell and Chemical Biology, LUMC, Netherlands
- Instituto de Histologia e Biologia do Desenvolvimento, Faculdade de Medicina da Universidade de Lisboa, Portugal
Figures
Figure 1 with 2 supplements
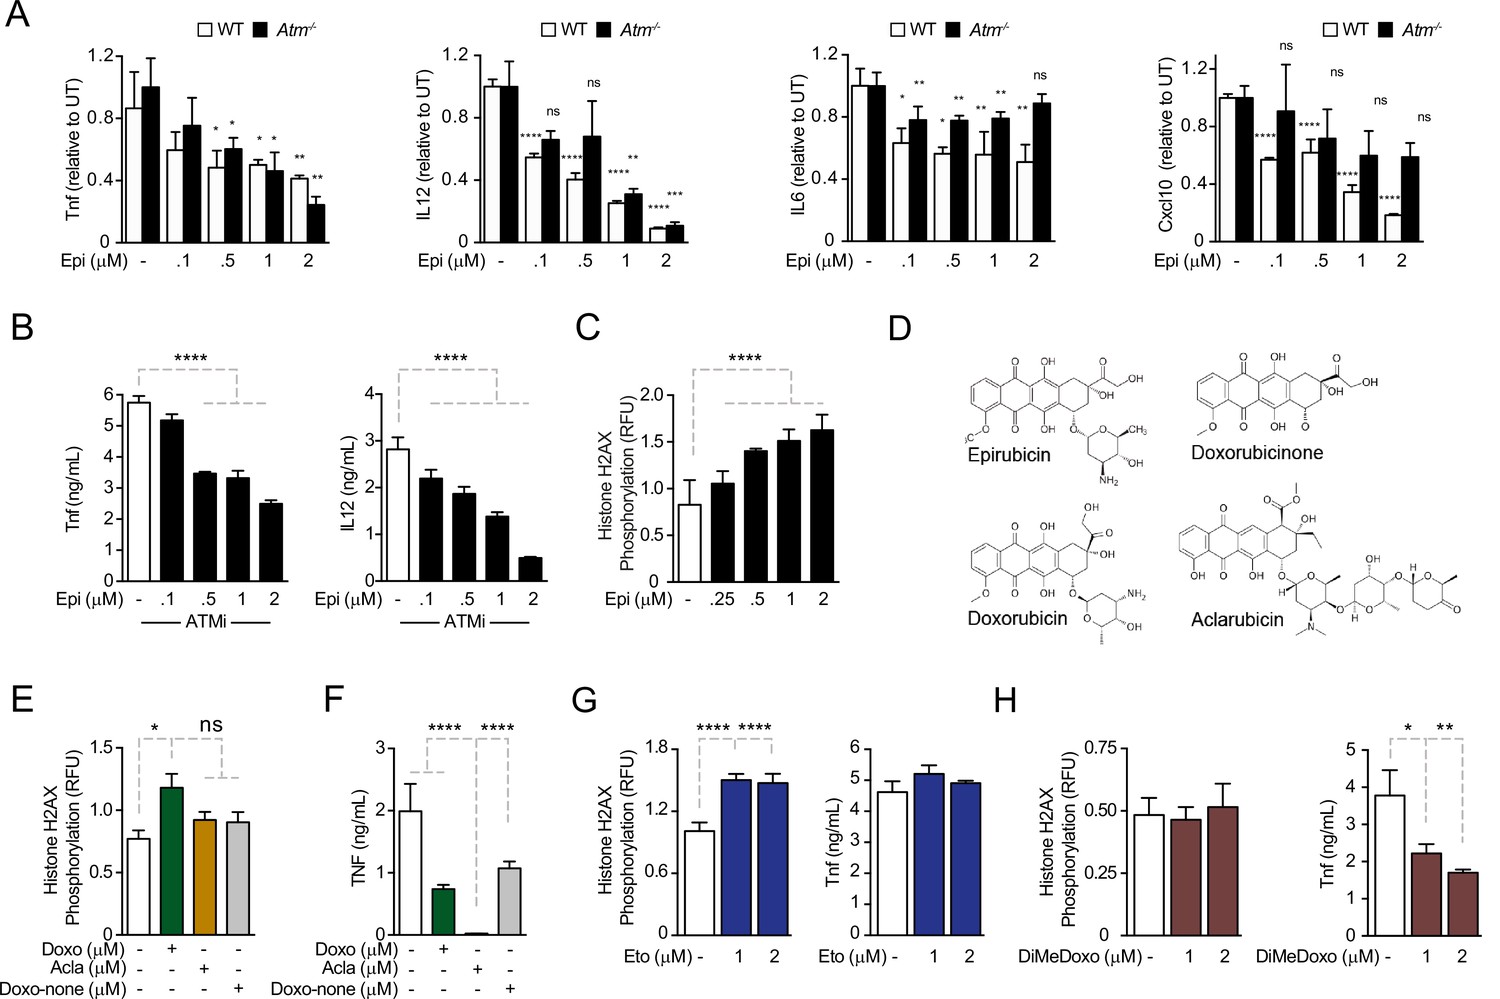
Anthracyclines regulate cytokine secretion independently of ATM in bone marrow-derived macrophages following E. coli challenge.
(A) Cytokine secretion of TNF, IL12, IL6, and Cxcl10 was quantified by ELISA following E. coli challenge in the presence of various doses of Epirubicin (Epi) in WT and Atm−/− macrophages. (B) Secretion of TNF and IL12 was quantified in macrophages treated with various doses of Epi and the ATM inhibitor KU-55933. (C) H2AX phosphorylation was quantified by ELISA in Epi-treated macrophages, normalized to total H2AX and shown as relative fluorescence intensities (RFU). (D) Schematic representation of the molecular structures of the anthracyclines Epi, Aclarubicin (Acla), Doxorubicin (Doxo), and Doxorubicinone (Doxo-none). (E) H2AX phosphorylation was quantified in the presence of Doxo, Acla, and Doxo-none. (F) TNF secretion was quantified in the presence of Doxo, Acla, and Doxo-none. (G, H) H2AX phosphorylation and TNF secretion were quantified in macrophages treated with Etoposide (Eto) and Dimethyl-doxorubicin (diMe-Doxo) following E. coli challenge. The assays show arithmetic means and standard deviations of technical replicates from one representative animal of at least three independent animals tested. *p < 0.05; **p < 0.01; ***p < 0.001; ****p < 0.0001.
Figure 1—figure supplement 1
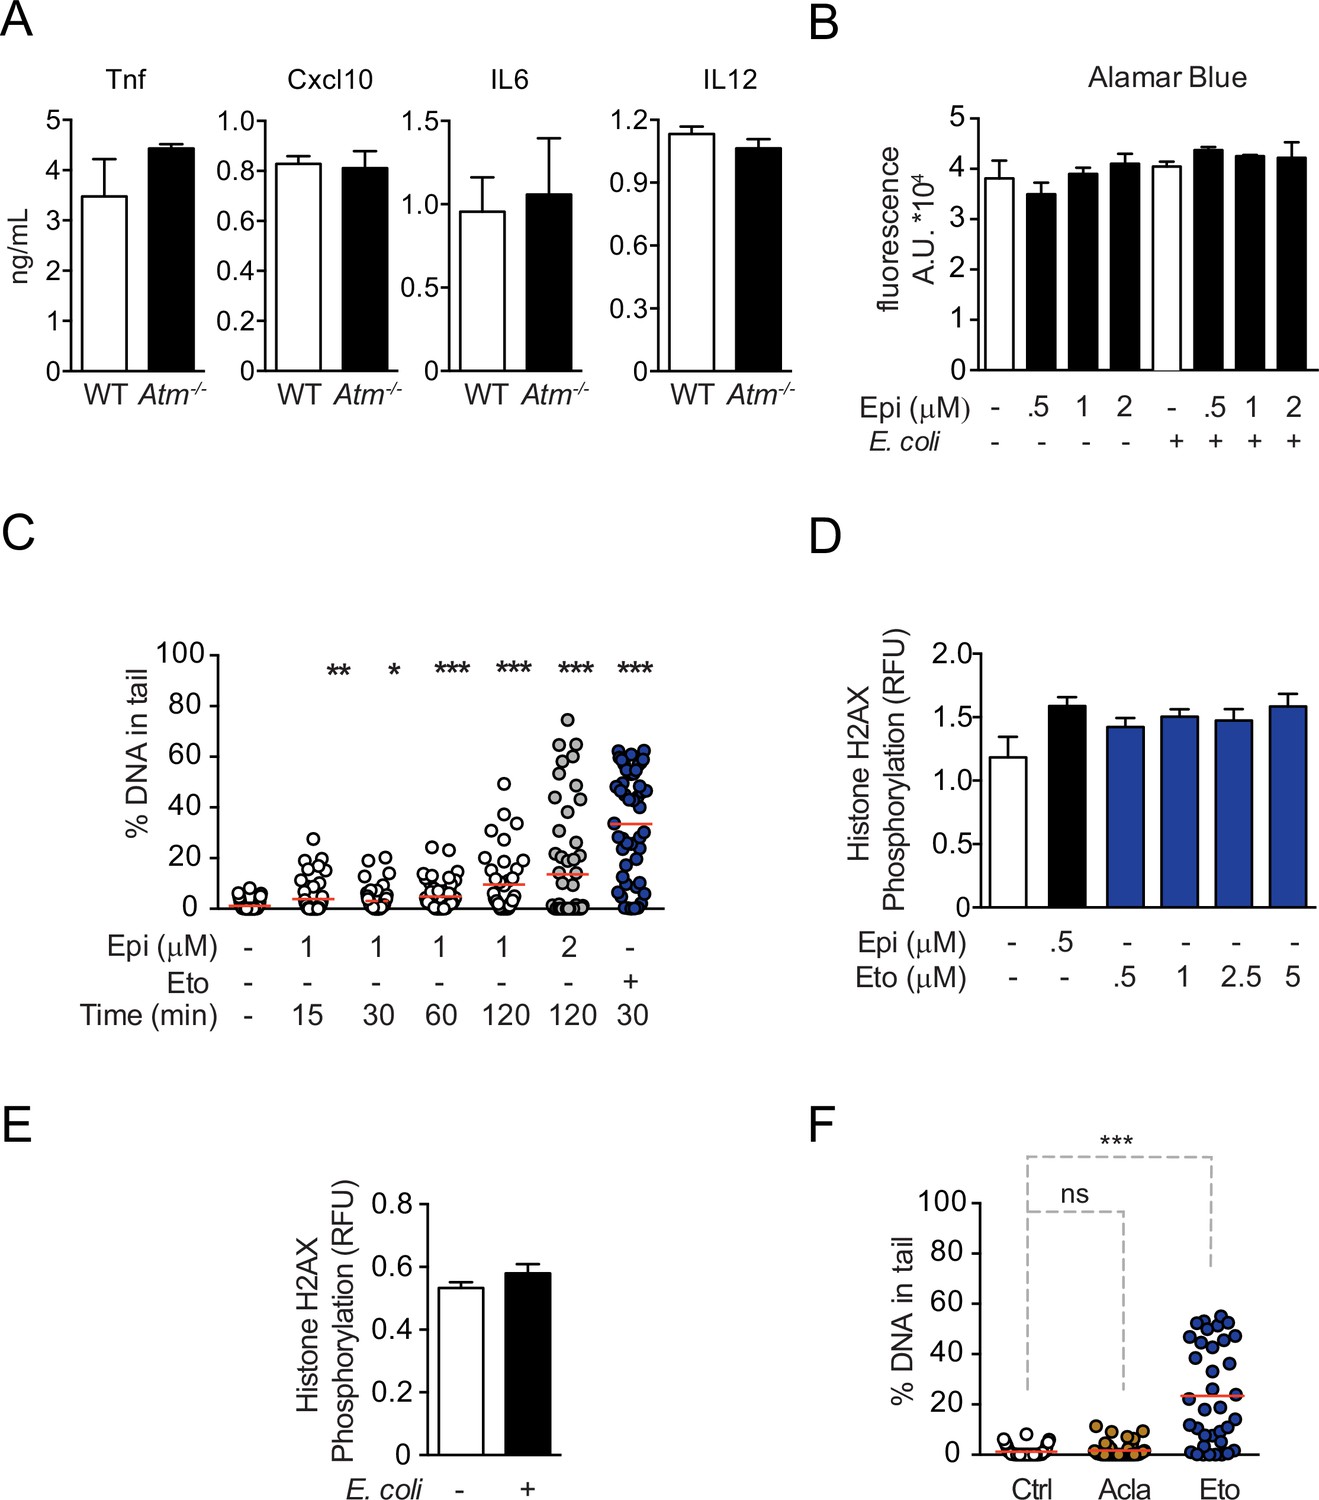
Control experiments for cytokine regulation by Epirubicin (Epi) and Aclarubicin (Acla) and characterization of DNA damage.
(A) Following stimulation with E. coli for 4 hr, WT and Atm−/− macrophages secrete similar amounts of the cytokines TNF, IL12, IL6, and Cxcl10, as observed by ELISA. (B) Cell number quantification using Alamar Blue fluorescence in unstimulated macrophages or macrophages stimulated with E. coli for 4 hr, both treated with various doses of Epi. (C) Percentage of broken DNA in the comet tail as quantified by Comet Assay in THP-1 cells treated for 15, 30, 60, and 120 min with 1 or 2 μM of Epi or 10 μM of Etoposide (Eto). (D) H2AX phosphorylation was quantified by ELISA in macrophages treated for 2 hr with various doses of Epi and Eto. (E) H2AX phosphorylation was quantified by ELISA in macrophages stimulated with E. coli for 4 hr. (F) Similar to (C) but the macrophages were treated for 2 hr with 1 μM of Acla or Eto. The graphs show arithmetic means and standard deviations of technical replicates from one representative experiment of at least three independent experiments performed. Statistical tests performed in A, B, D, and E showed no statistically significant differences between the different conditions. For C and F: *p < 0.05; **p < 0.01; ***p < 0.00.
Figure 1—figure supplement 2
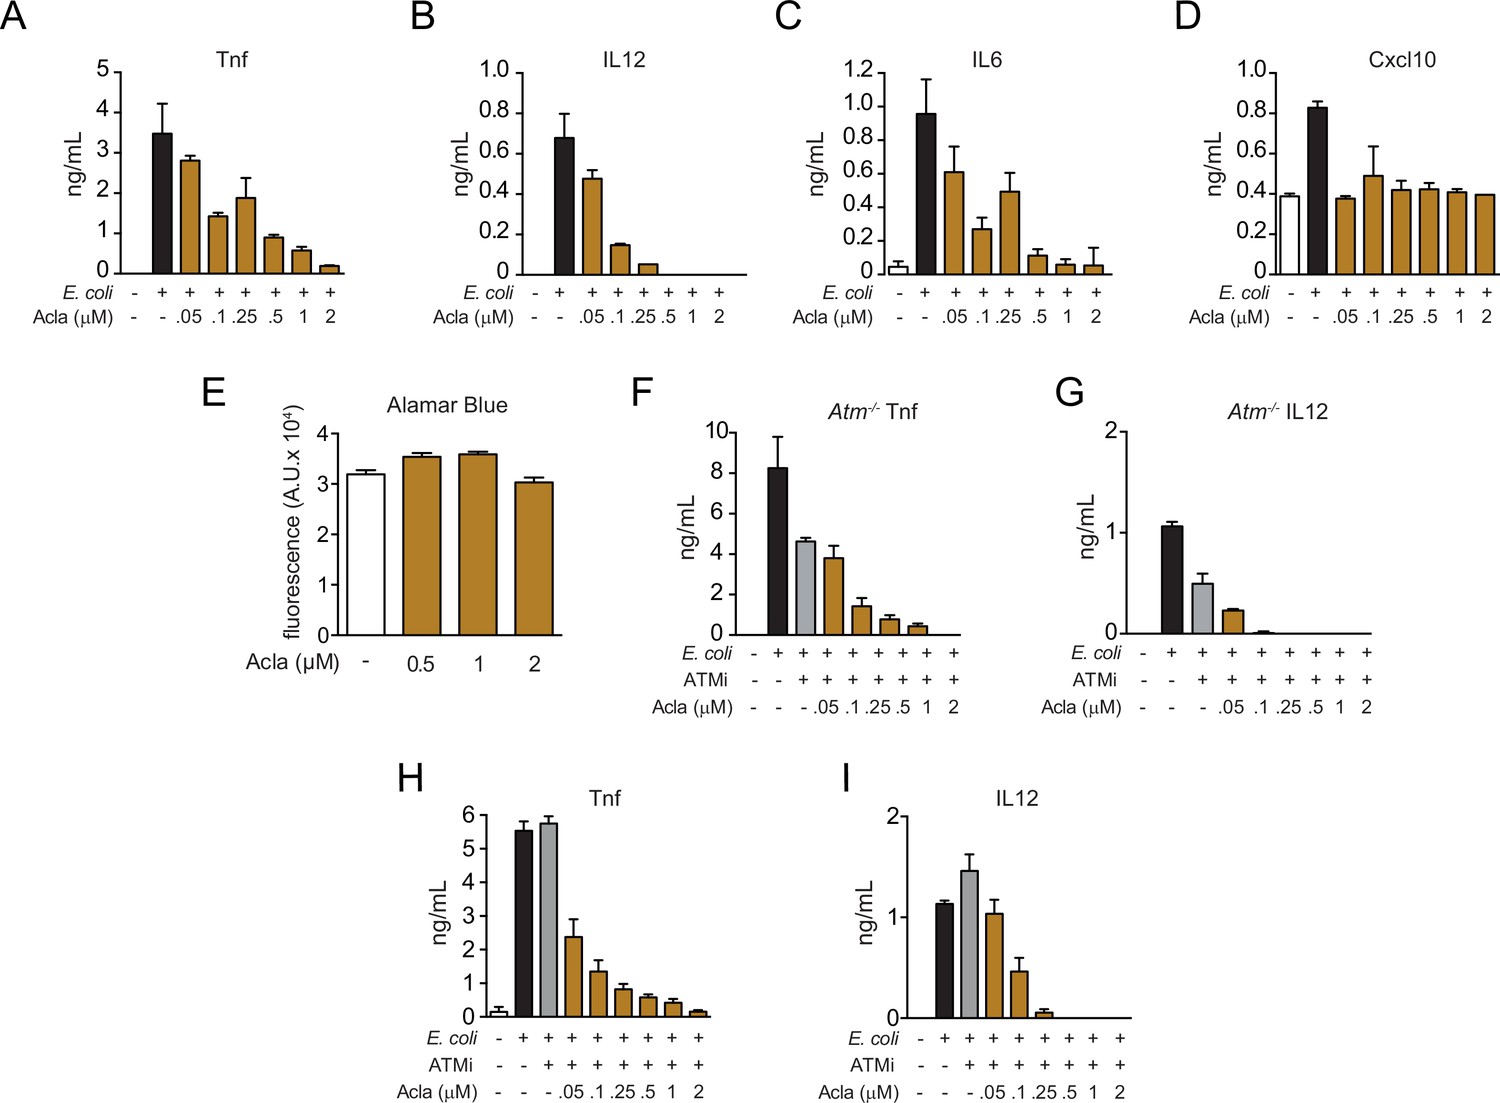
Similar to Epirubicin (Epi), Aclarubicin (Acla) regulates cytokine secretion independently of ATM.
(A–D) Cytokine secretion of Tnf, IL12, IL6, and Cxcl10 in macrophages was quantified by ELISA following 4 hr of incubation with E. coli challenge in the presence of various doses of Acla. (E) Cell number quantification using Alamar Blue fluorescence in unstimulated macrophages treated with various doses of Acla. (F) Tnf and (G) IL12 secretion were quantified by ELISA following E. coli challenge in the presence of various doses of Acla in Atm−/− macrophages. (H) Tnf and (I) IL12 secretion were quantified by ELISA following E. coli challenge in macrophages treated with various doses of Acla and the ATM inhibitor (ATMi) KU-55933. The assays show arithmetic means and standard deviations of technical replicates from one representative animal of at least three independent animals tested. Statistical tests performed in E showed no statistically significant differences in cell viability between the different conditions tested. In the other graphs, Acla concentrations of 0.1 μM and lower were significantly different (p < 0.05) from controls without Acla, both controls with E. coli (in A–D and F–I) and with ATMi (F–I).
Figure 2 with 2 supplements
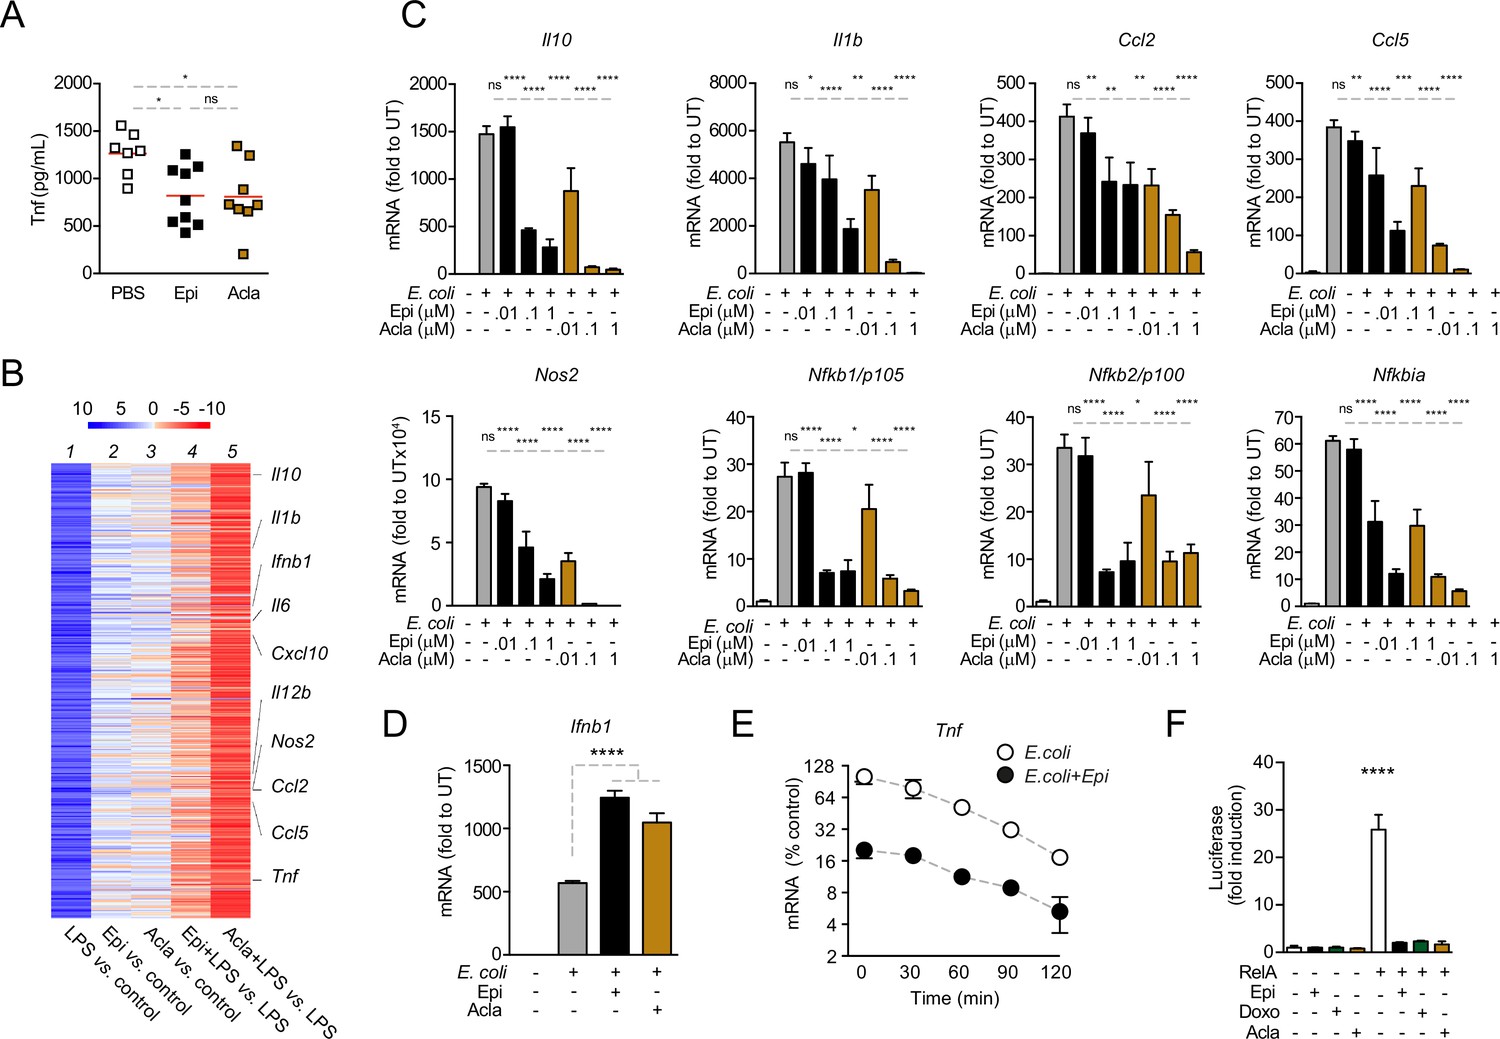
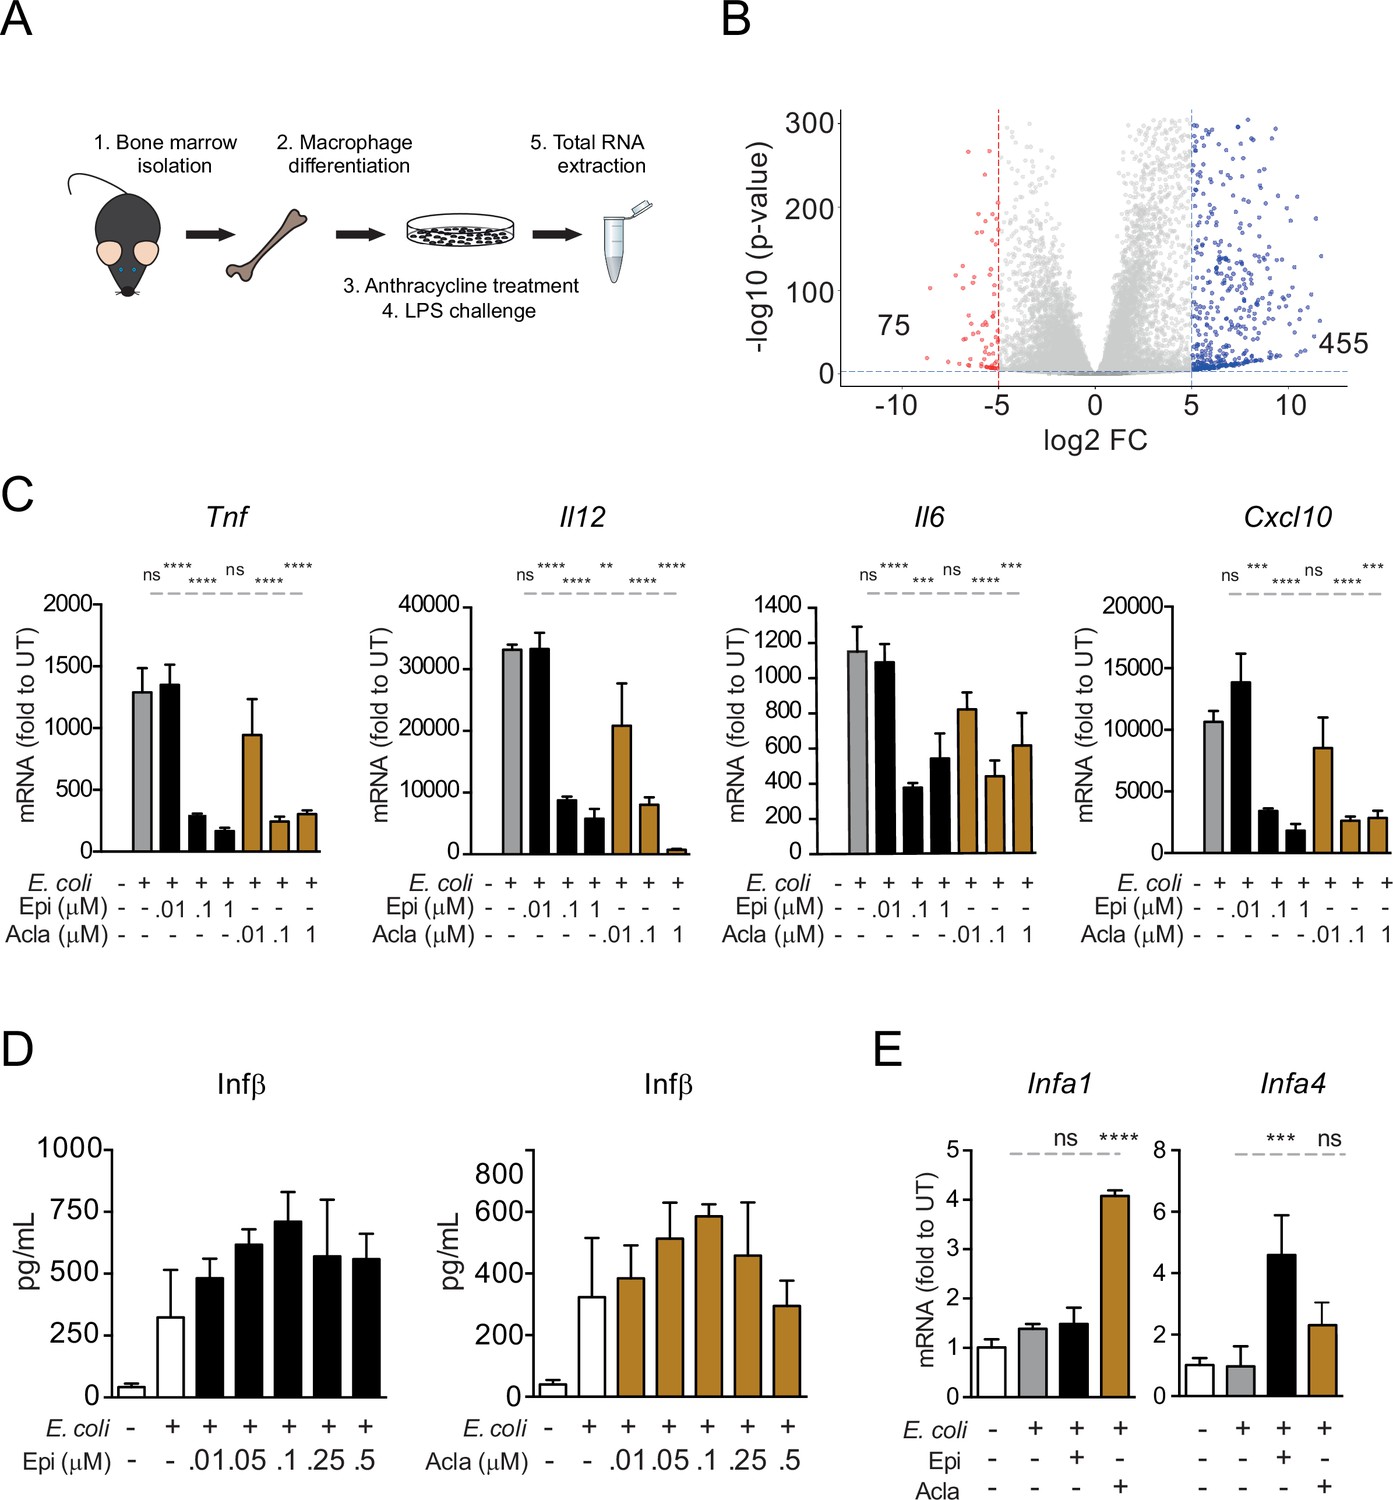
Anthracyclines lower circulating TNF levels in an in vivo model of sepsis and downregulate nuclear factor kappa B (NF-κB)-dependent transcription.
(A) TNF concentrations in serum 8 hr post E. coli challenge in mice treated with phosphate-buffered saline (PBS, n = 7), Epirubicin (Epi, n = 9), or Aclarubicin (Acla, n = 8). (B) RNA sequencing (RNA-seq) in macrophages stimulated with lipopolysaccharide (LPS) for 4 hr and treated with Epi or Acla. (C) Gene expression was quantified by quantitative RT-PCR in macrophages following E. coli challenge and treated with various doses of Epi and Acla; results were normalized to expression in untreated conditions (UT). (D) Gene expression of Ifnb1 was quantified as in C. (E) Analysis of Tnf mRNA stability in macrophages treated with 2 µM of Epi for 1 hr or left untreated; Actinomycin D was added 2 hr after E. coli stimulation. (F) Luciferase quantification of a κB reporter in HEK293 cells treated with 2 µM of Epi, Doxo, and Acla in the absence or presence of a vector overexpressing RelA. C–E show arithmetic means and standard deviations of technical replicates from one representative animal of at least three independent animals tested. F shows one representative experiment of two independently performed assays. *p < 0.05; **p < 0.01; ***p < 0.001; ****p < 0.0001.
-
Figure 2—source data 1
Functional analysis of the RNA sequencing (RNA-seq) data.
DAVID functional analysis of the RNA-seq data in macrophages stimulated with lipopolysaccharide (LPS) for 4 hr showing representative clusters of genes downregulated by Epirubicin (Epi) and Aclarubicin (Acla).
- https://cdn.elifesciences.org/articles/77443/elife-77443-fig2-data1-v2.docx
Figure 2—figure supplement 1
Testing specificity of transcriptional regulation by anthracyclines.
(A) RNA sequencing (RNA-seq) analysis workflow. (B) Volcano plot of lipopolysaccharide (LPS)-regulated genes from the RNA-seq. (C) Gene expression was quantified by quantitative RT-PCR in macrophages following E. coli challenge and treated with various doses of Epirubicin (Epi) and Aclarubicin (Acla); results were normalized to expression in untreated conditions (UT). (D) Interferon beta (IFN-β) secretion was quantified by ELISA following E. coli challenge in macrophages treated with various doses of Epi (left) and Acla (right). (E) Gene expression was quantified as in C. The assays in C–E show arithmetic means and standard deviations of technical replicates from one representative experiment of at least three independent experiments performed. Statistical tests performed in D showed no statistically significant differences between the different E. coli-treated samples. For C and E: **p < 0.01; ***p < 0.001; ****p < 0.0001.
Figure 2—figure supplement 2
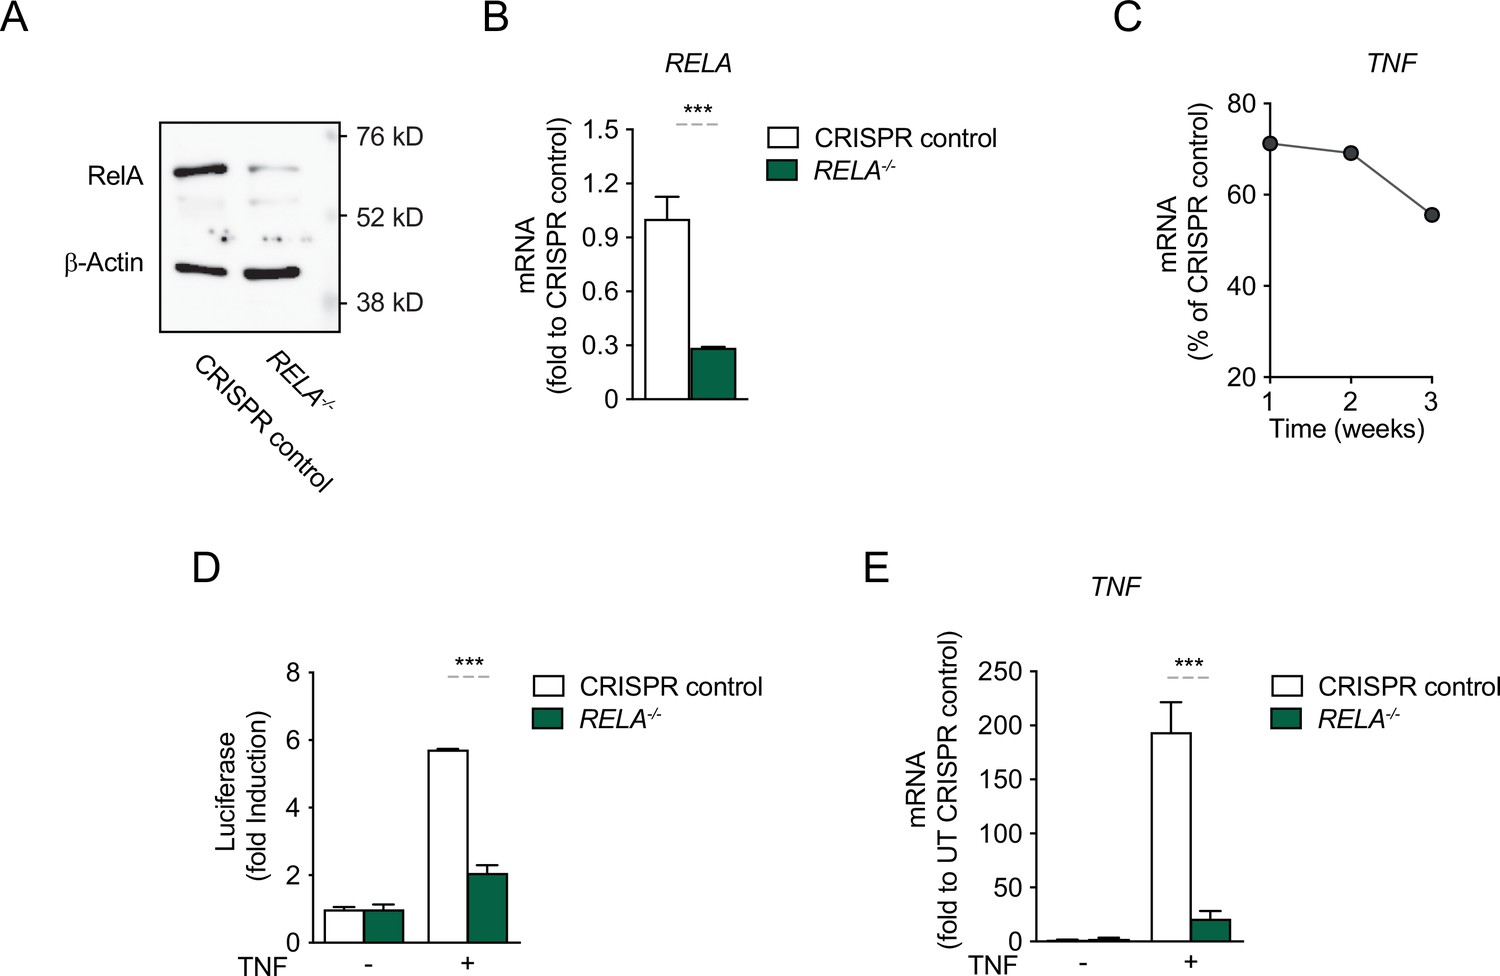
CRISPR/Cas9-mediated knock-out (KO) of RelA in HEK293 cells abolishes the response to TNF.
CRISPR/Cas9 was employed to knock out RelA in HEK293 cells and because no single clones were selected, the mixed-clone populations were tested, at week 1 post KO for (A) protein expression and (B) RNA levels. (C) For one round of deletions shown as example, the percentage of KO cells in the population was assessed by RNA over time; this result was the basis for choosing to work with the KO population only during the first week after the KO. (D) CRISPR control cells and RelA KO cells were stimulated with TNF for 8 hr and the induction of the luciferase reporter was assessed as fold change over empty vector. (E) Endogenous TNF expression, as assessed by mRNA levels, in CRISPR control cells and RelA KO cells, stimulated with TNF for 4 hr. The assays in B, D, and E show arithmetic means and standard deviations of technical replicates of at least two independent experiments. ***p < 0.001.
-
Figure 2—figure supplement 2—source data 1
Western blot in Figure 2—figure supplement 2.
- https://cdn.elifesciences.org/articles/77443/elife-77443-fig2-figsupp2-data1-v2.zip
-
Figure 2—figure supplement 2—source data 2
Original blot in Figure 2—figure supplement 2.
- https://cdn.elifesciences.org/articles/77443/elife-77443-fig2-figsupp2-data2-v2.zip
-
Figure 2—figure supplement 2—source data 3
Molecular weight marker in original blot in Figure 2—figure supplement 2.
- https://cdn.elifesciences.org/articles/77443/elife-77443-fig2-figsupp2-data3-v2.zip
Figure 3 with 1 supplement
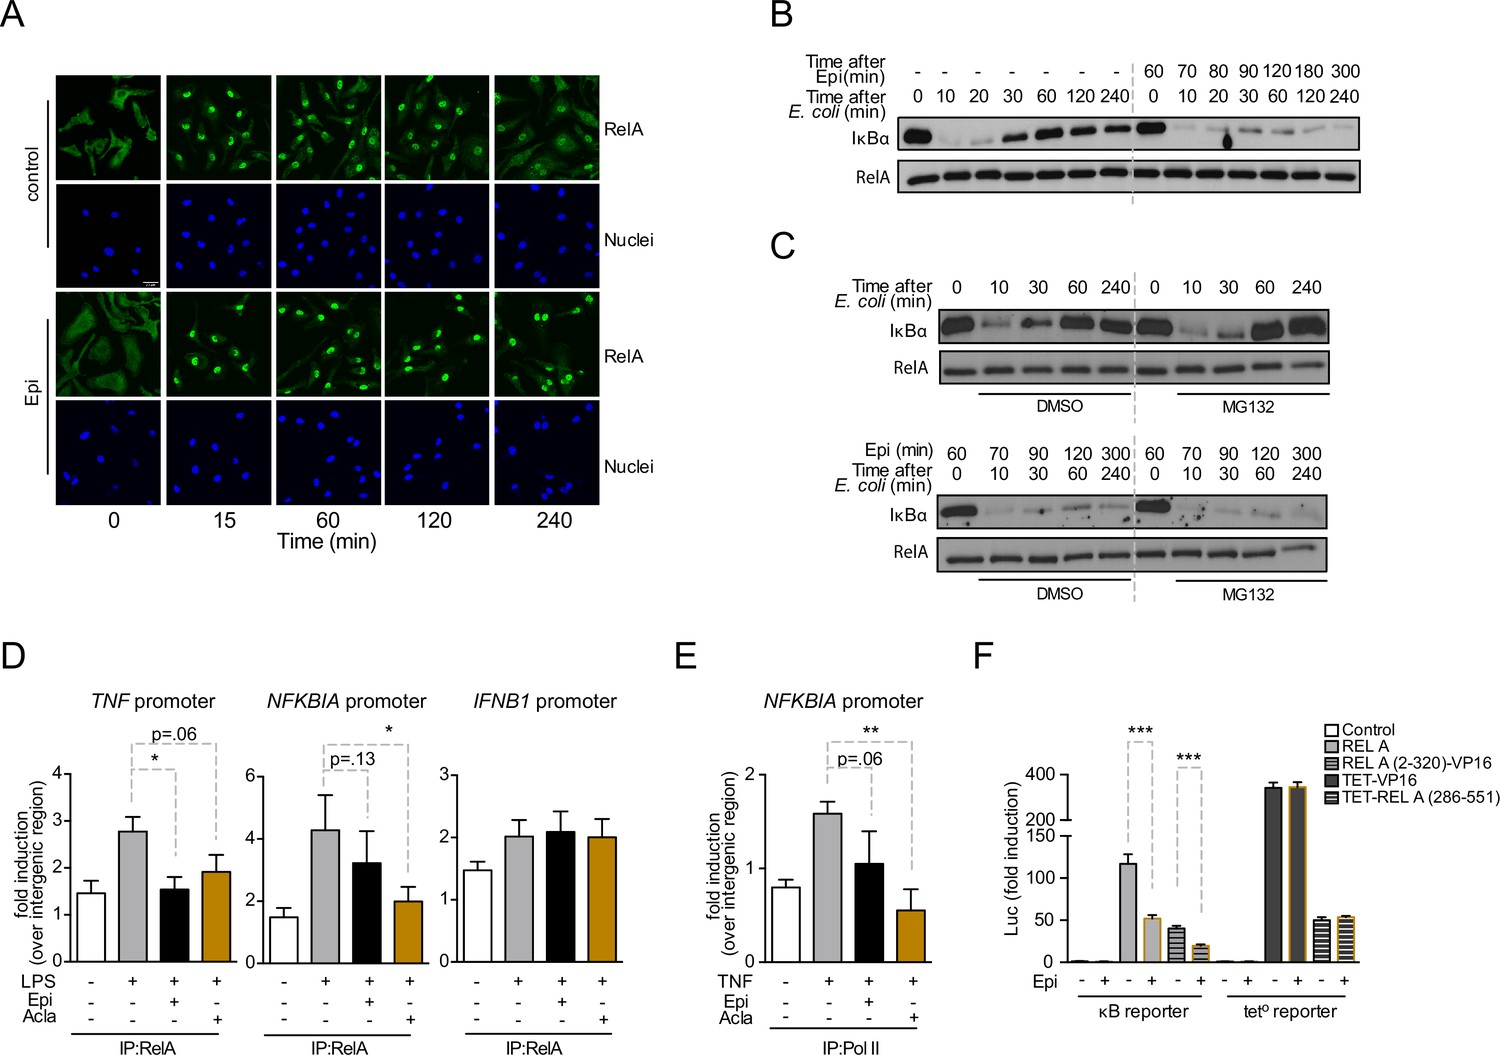
Anthracyclines affect RelA subcellular localization and compromise RelA binding to NFKBIA and TNF promoters, but not to IFNB1 promoter.
Reporter assays suggest that the RelA domain targeted by Epirubicin is the REL-homology domain (RHD). (A) RelA immunolocalization in macrophages challenged with E. coli for 4 hr and left untreated (control) or treated with 2 µM of Epirubicin (Epi); scale bar = 20 μm. (B) IκBα degradation kinetics in macrophages following E. coli challenge in the absence or presence of 2 µM of Epi for 1 hr at the time of E. coli challenge and using total RelA levels as loading control. (C) Macrophages were either left untreated (top panel) or treated with Epi (bottom panel) and challenged with E. coli for the indicated times in the presence of the proteasome inhibitor MG132 (10 μM) or its vehicle DMSO; IκBα degradation was assessed using total RelA as loading control. (D) Macrophages were challenged with lipopolysaccharide (LPS), treated with 2 µM of Epi or Aclarubicin (Acla) and an anti-RelA antibody was used to immunoprecipitate the associated chromatin, from where the promoter sequences of NFKBIA, TNF, and IFNB1 were amplified. (E) HEK293 cells were challenged with TNF, treated with 2 µM of Epi or Acla and an anti-PolII antibody was used to immunoprecipitate the associated chromatin, from where the promoter sequence of NFKBIA promoter was amplified. (F) HEK293 cells were transiently transfected with a κB-luciferase reporter alone or in conjunction with full-length RelA or RelA (2-320)-VP16 or TET-RelA (268-551) and cells were left untreated or treated with 2 µM of Epi for 16 hr. A–C show one representative experiment using macrophages from at least three independent animals tested; D and E show arithmetic means and standard deviations of technical replicates from one representative experiment of at least four independently performed assays; F shows arithmetic means and standard deviations of technical replicates from one representative experiment of two independently performed assays. *p < 0.05; **p < 0.01; ***p < 0.001.
-
Figure 3—source data 1
Western blot in Figure 3B.
- https://cdn.elifesciences.org/articles/77443/elife-77443-fig3-data1-v2.zip
-
Figure 3—source data 2
Original blot of IκBα in Figure 3B.
- https://cdn.elifesciences.org/articles/77443/elife-77443-fig3-data2-v2.zip
-
Figure 3—source data 3
Original blot of total RelA in Figure 3B.
- https://cdn.elifesciences.org/articles/77443/elife-77443-fig3-data3-v2.zip
-
Figure 3—source data 4
Western blot in Figure 3C.
- https://cdn.elifesciences.org/articles/77443/elife-77443-fig3-data4-v2.zip
-
Figure 3—source data 5
Original blot of IκBα in Figure 3C, no Epirubicin (upper panel, no Epi).
- https://cdn.elifesciences.org/articles/77443/elife-77443-fig3-data5-v2.zip
-
Figure 3—source data 6
Original blot of IκBα in Figure 3C, with Epirubicin (lower panel, Epi).
- https://cdn.elifesciences.org/articles/77443/elife-77443-fig3-data6-v2.zip
-
Figure 3—source data 7
Original blots of total RelA in Figure 3C (both panels).
- https://cdn.elifesciences.org/articles/77443/elife-77443-fig3-data7-v2.zip
Figure 3—figure supplement 1

Epirubicin (Epi) modulates nuclear factor kappa B (NF-κB) activity in HEK293 cells.
(A) TNF, CXCL10, and NFKBIA mRNA levels in HEK293 cells challenged with TNF for 4 hr and treated with Epi; the graphs show arithmetic means and standard deviations of technical replicates from one representative experiment of at least three independent experiments performed; TNF-stimulated samples were significantly different (p < 0.05) from TNF-stimulated cells that were treated with Epi. (B) HEK293 cells were left untreated (control) or exposed to Epi for 16 hr. Cell viability was evaluated by flow cytometry based on Live/Dead and Annexin V staining. (C) RELA immunolocalization in HEK293 cells left untreated (control) or exposed to 5 μM of Epi for 1 hr, at the indicated time points, followed by TNF challenge. (D) Schematic representation of RelA sequence with functional domains.
Figure 4 with 3 supplements
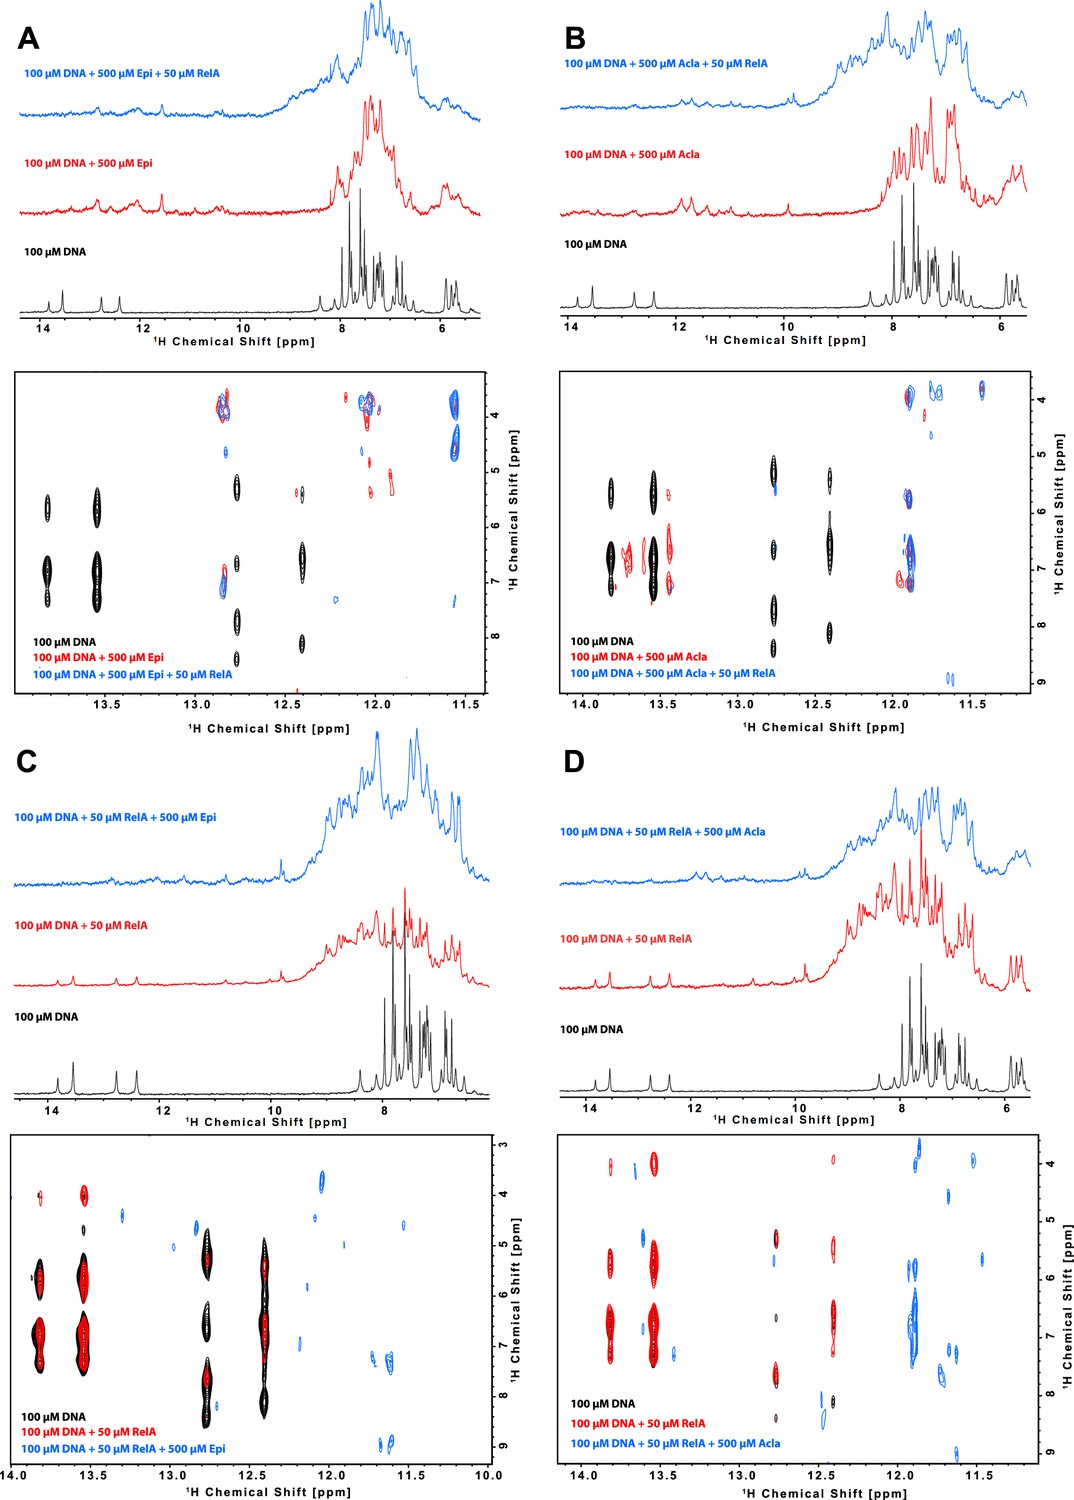
Characterization of the binding of anthracyclines to NF-κB-33 promoter DNA sequence and their effect on RelA–DNA complex as assessed by following the DNA imino protons by NMR.
1D 1H spectrum (top) and zoom of the cross peaks of the imino protons with the deoxyribose in a 2D 1H, 1H-NOESY (bottom) of a 100 μΜ 14-mer duplex DNA solution and subsequent addition of (A) 500 μΜ Epirubicin (Epi, red) and 50 μΜ 2H, 15N-RelA19-291 dimer (blue), (B) 500 μΜ Aclarubicin (Acla, red) and 50 μΜ 2H, 15N-RelA19-291 dimer (blue), (C) 50 μΜ 2H, 15N-RelA19-291 dimer (red) and 500 μΜ Epi (blue), and (D) 2H, 15N-RelA19-291 dimer (red) and 500 μΜ Acla (blue). Experiments were recorded at 800 MHz and 10°C in 100 mM d11-Tris–HCl pH 7.5, 75 mM NaCl, 5 mM d10-DTT, and 10% D2O.
-
Figure 4—source data 1
Molecular weight values of RelA19-291, κB-33 DNA, κB-33 DNA + Epirubicin (Epi), and κB-33 DNA + Aclarubicin (Acla) using SEC in combination with static light scattering (SLS).
- https://cdn.elifesciences.org/articles/77443/elife-77443-fig4-data1-v2.docx
Figure 4—figure supplement 1

Isothermal titration calorimetry (ITC)-binding measurements.
(A) 500 μΜ Epirubicin (Epi) titrated to 25 μΜ of duplex 14-mer κB-33 DNA; (B) 500 μΜ Aclarubicin (Acla) titrated to 25 μΜ of duplex 14-mer κB-33 DNA; (C) 125 μΜ duplex 14-mer κB-33 DNA titrated to 25 μΜ of RelA; (D) 125 μΜ duplex 14-mer κB-33 DNA titrated to 25 μΜ RelA with 200 μΜ Epi; (E) 125 μΜ duplex 14-mer κB-33 DNA titrated to 25 μΜ RelA with 200 μΜ Acla; and (F) 125 μM duplex 14-mer κB-33 DNA with 250 μM Epirubicin titrated to 25 μΜ of RelA.
Figure 4—figure supplement 2
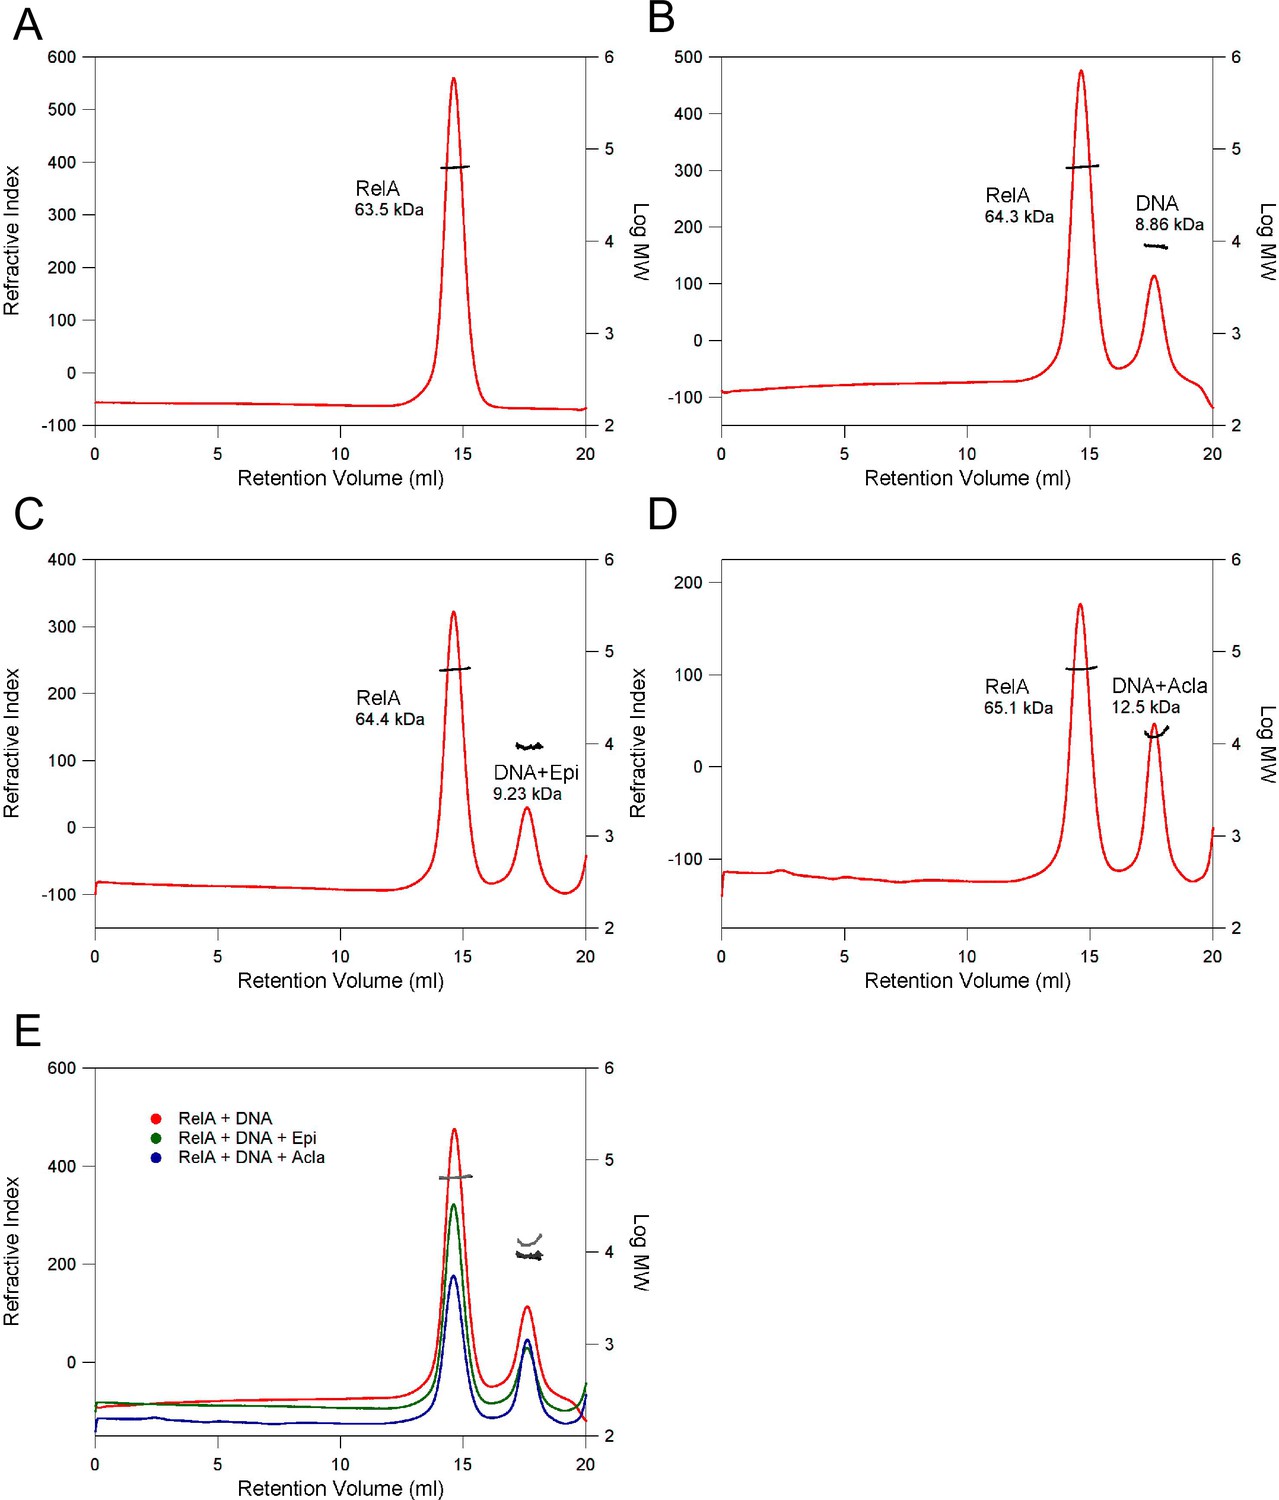
Determination of the molecular weight (MW) of complexes using size-exclusion chromatography (SEC) in combination with static light scattering (SLS).
(A) RelA19-291; (B) RelA19-291 with κB-33 DNA (1:2 RelA:DNA); (C) RelA19-291 with κB-33 DNA and Epi (1:2:6 RelA:DNA:Epi); (D) RelA19-291 with κB-33 DNA and Acla (1:2:6 RelA:DNA:Acla). The refractive index (red) and right-angle light scattering (not shown) signals were monitored and used to determine the MWs (black). (E) Superimposition of B–D. The refractive index and MW are shown in red and black (B); green and dark gray (C); blue and light gray (D), respectively.
Figure 4—figure supplement 3

RelA REL-homology domain (RHD) binding to κB-33 promoter DNA.
(A) 3D structure of RelA RHD in complex with κB-33 promoter DNA (PDB 1RAM). The dimerization domain (DD) domain and DNA-binding domain (DBD) are shown in yellow and cyan, respectively. The residues that interact with the DNA are represented in dark red. The DNA is shown in green with nucleotides contacting the protein colored orange. The sequence of the 14-mer κB-33 DNA derived from the 18-mer used for this crystal structure is shown below. (B) NMR-binding studies on RelA RHD domain with the 14-mer κB-33 DNA. 2D 1H,15N correlation spectra of 100 μΜ 2H, 15N RelA19-291 dimer recorded without (black) and with 100 μΜ DNA duplex (red) (800 MHz, 20°C, 16 scans).
Figure 5 with 5 supplements

The RelA REL-homology domains (RHDs) of Epi and Acla are shown in a complex with the κB-33 promoter.
Epirubicin (Epi) and Aclarubicin (Acla) are capable of disturbing RelA–DNA binding as assessed by NMR chemical shift changes. (A) Crystal structure of RelA RHD, containing the DNA-binding domain (DBD) and the dimerization domain (DD), in complex with κB-33 promoter DNA target (PDB code 1RAM). The RelA DBD and DD are represented as cartoon in cyan and yellow, respectively, whereas the DNA in olive green and pink. DNA highlighted in pink corresponds to the two half sites recognized by each RelA monomer. DNA-binding residues are depicted in red, whereas the amino acid residues that shift after addition of Epi (A, left) and Acla (A, right) are depicted in blue. (B) Superposition of 2D 1H,15N NMR correlation spectra of 100 μΜ 2H, 15N-RelA19-291-free dimer (black), and in the presence of 100 μΜ κB-33 14-mer DNA duplex (red) and upon additional presence of 500 μΜ Epi (green, left) or 500 μΜ Acla (green, right). All spectra were recorded at 800 MHz, 20°C, 16 scans.
Figure 5—figure supplement 1

Saturation transfer difference (STD)-NMR experiments to test the interaction of RelA with the anthracyclines Epirubicin (Epi), Aclarubicin (Acla), and Doxorubicinone (Doxo-none).
Epi and Acla interact through the methyl groups(s) in the sugar rings with RelA. Doxo-none lacks a sugar ring and does not interact with RelA. (A) Epi, (B) Acla, and (C) Doxo-none. The blue spectra correspond to the reference buffer. The green spectra are recorded with 500 μM of each compound in 100 mM d11-Tris–HCl pH 7.5, 75 mM NaCl, and 10% D2O buffer (600 MHz, 20°C, 128 scans). Red spectra correspond to the 1D spectra of the compounds with protein in buffer. The black spectra correspond to the STD spectra of the 10 μM RelA with the 500 μM anthracyclines. On the right side of each set of spectra, a zoomed view is shown highlighting the methyl groups showing STD signals (see above compound structure). In all STD experiments, the arrow indicates the irradiation region (0.05 ppm) (600 MHz, 20°C, 800 scans).
Figure 5—figure supplement 2

Comparison of the effect of the order of addition in NMR-binding studies of Epirubicin (Epi) and Aclarubicin (Acla) with RelA and κB-33 DNA.
Superposition of 2D 1H,15N correlation spectra of 100 μΜ 2H, 15N RelA19-291 with 100 μΜ DNA (black) with (A) 2H, 15N 100 μΜ RelA19-291 with 100 μΜ DNA and 100 μΜ Epi (red) and 2H, 15N 100 μΜ RelA19-291 with 500 μΜ Epi and 100 μΜ DNA (green); and with (B) 2H, 15N 100 μΜ RelA19-291 with 100 μΜ DNA and 500 μΜ Acla (red) and 2H, 15N 100 μΜ RelA19-291 with 500 μΜ Acla and 100 μΜ DNA (green) (800 MHz, 20°C, 16 scans). The addition order of anthracyclines and DNA to RelA leads to spectra that are not completely superimposable suggesting that the complexes are different. Note that Aclarubicin causes protein precipitation, leading to larger spectral differences, especially when it is added directly to the protein.
Figure 5—figure supplement 3

NMR-binding studies on RelA19-291 with Epirubicin (Epi) and Aclarubicin (Acla).
Superposition of 2D 1H,15N NMR correlation spectra of 100 μΜ 2H, 15N RelA19-291 recorded without (black) and with (left) 500 μΜ of Epi (red) or (right) 500 μΜ of Acla (red) (800 MHz, 20°C, 16 scans).
Figure 5—figure supplement 4
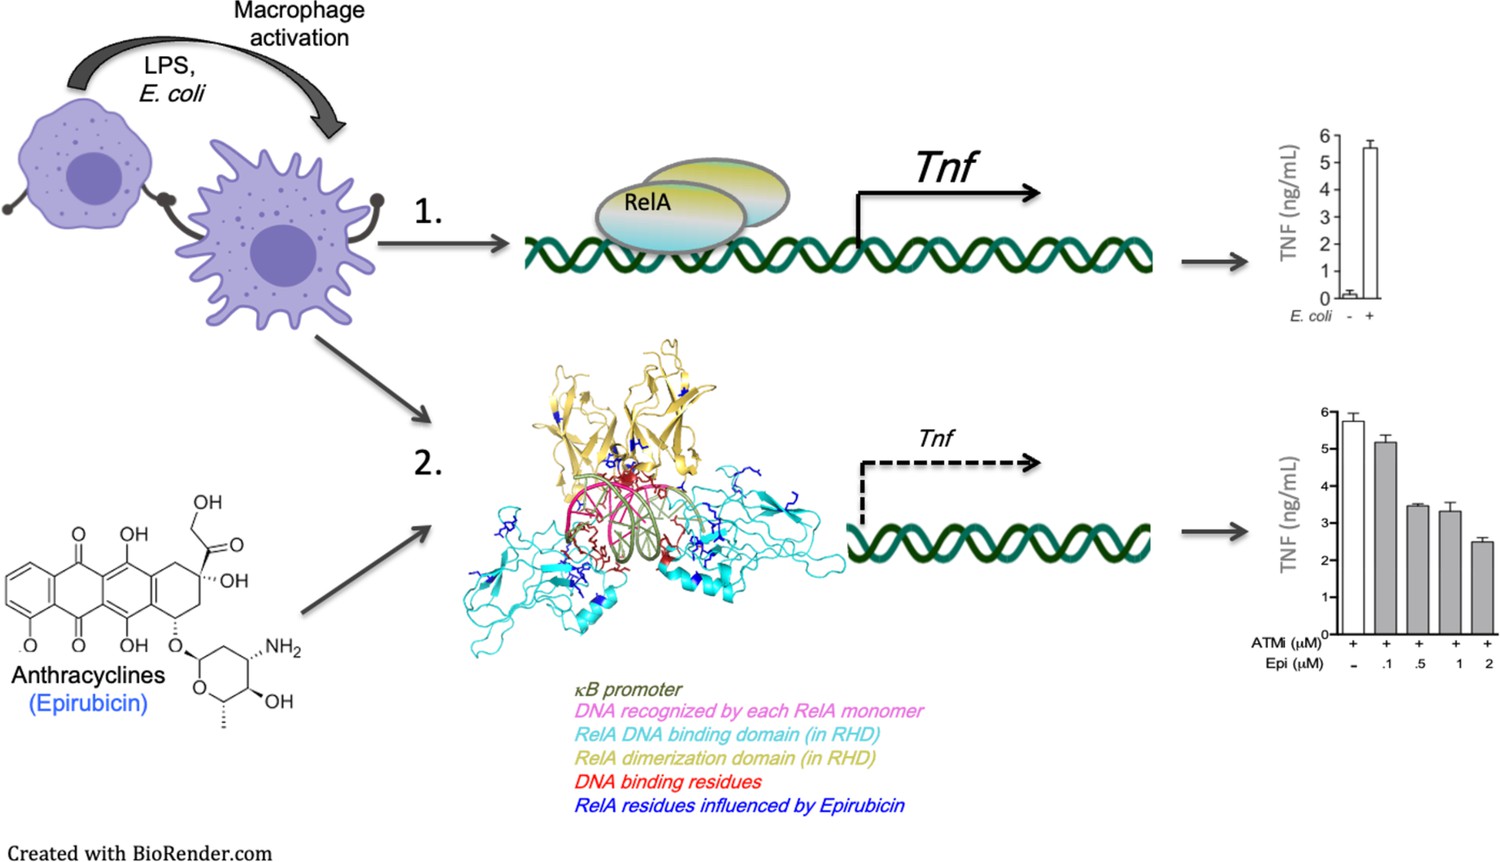
Model for the regulation of nuclear factor kappa B (NF-κB) binding to target promoters by Epirubicin (Epi).
Following inflammatory stimulation, macrophages – and possibly other cytokine-responsive cells – activate pro-inflammatory transcriptional programs, partly initiated by the master regulator of inflammation NF-κB. Dimers of NF-κB factors, including RelA/p65, are known to activate a wide variety of genes by binding to (multi)-κB sites at the promoters of target genes (1). Our work shows for the first time that anthracyclines, including Epirubicin (Epi) and Aclarubicin (Acla), form complexes with the NF-κB factor RelA/p65 which may compromise activation of target genes by NF-κB (2). We also show that these effects of the anthracyclines are independent of their roles in DNA damage. Anthracyclines are DNA-binding drugs and our data suggest that κB sites also participate in the anthracycline–RelA/p65 complexes. More work, in particular structural studies as the ones we present here, are required to establish the order of formation of these DNA–Anthracycline–RelA/p65 complexes and the rules they obey. Importantly, anthracycline interactions with RelA/p65 are likely to limit the extent of pro-inflammatory responses, which may have beneficial consequences in conditions associated with exacerbated inflammation.
Figure 5—figure supplement 5

Model of the effect of anthracyclines on RelA RHD binding to the κB-33 promoter DNA.
(Left) The RelA dimer binds tightly to DNA with a nM affinity. (Right) Effect of Epirubicin (Epi) on RelA complex with DNA. Epi intercalates its rings between the “T” and “G” bases and the sugar interacts with the DNA minor groove altering positioning of the bases and their Watson-Crick hydrogen bonds. In the presence of Epi RelA still binds to DNA but with a 8-fold weaker affinity. The sugar of anthracyclines interacts weakly with RelA, and might be important for modulating the affinity of the RelA to the DNA and ultimately transcription. For simplicity only the TG motifs and their base-pairing nucleootides in the κB-33 promoter DNA are represented.
Author response image 1
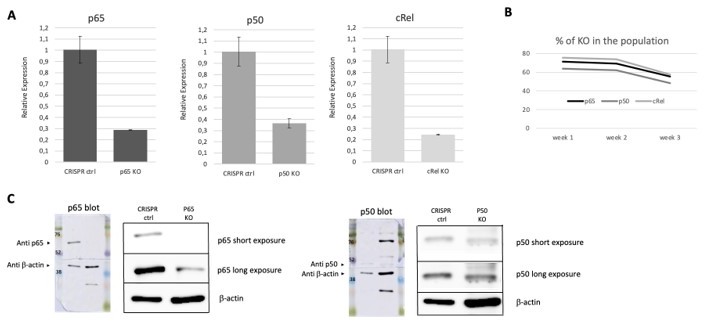
CRISPR/Cas 9 mediated KOs of NF-κB, subunits in HEK293 cells as described in the methods section of this reply.
The resulting populations were tested, at week one post KO, for RNA levels and protein expression of the different subunits. For one round of deletions that we show as an example, we concluded from our and a quantifications that the KO cells in the population were 71% in the case of RelA/p65, 63% in the case of p50 and 75% in the case of c-Rel (A). The percentage of KO cells in the population tended to decrease overtime, as assessed by RNA (B), and for this were only cultured for short periods following gene editing. These KOs were corroborated at the protein level, as shown by WB (C), except for c-Rel, as the antibody that we had available was only able to detect overexpression of the protein (see Author response image 4) and we were never able to detect the much lower levels of the endogenous c-Rel protein.
Author response image 2
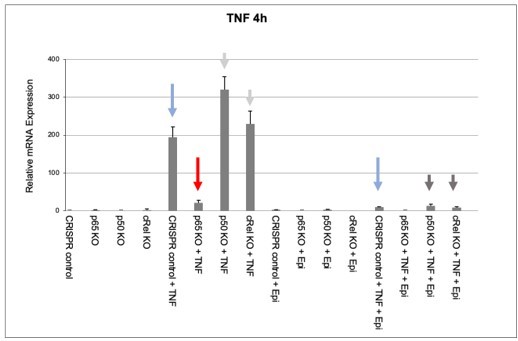
Effects of epirubicin (Epi) on endogeneous TNF expression as assessed by nRNA levels.
CRISPR/Cas9-mediated KO populations of HEK293 cells (rel/p65 KO, p50 KO, c-Rel KO, and CRISPR control) which generated as shown in Author response image 1 and were either treated with vehicle or with 2µM of Epi for 4 hours. TNF was added to the medium 1 hour after Epi or cells were left out without any stimulus. mRNA levels of TNF were quantified by qRT-PCR in two independent experiments. One representative experiment is shown with averages and standard deviations of technical replicates. Blue, red and grey arrows are discussed in the text.
Author response image 3
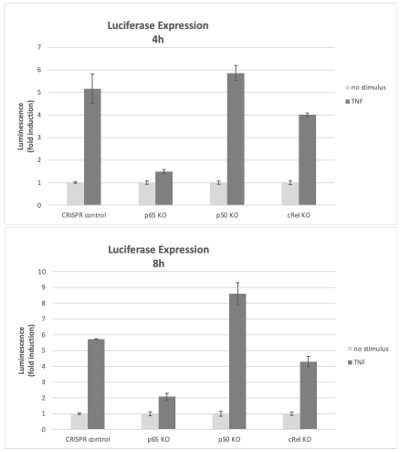
Effects of NF-κB subunits on reporter gene expression.
HEK293 KO cells (rel/p65 KO, p50 KO, c-Rel KO, and CRISPR control) were stimulated with TNF 4h or 8h and the induction of the luciferase reporter was assessed as fold change over empty vector control.
Author response image 4
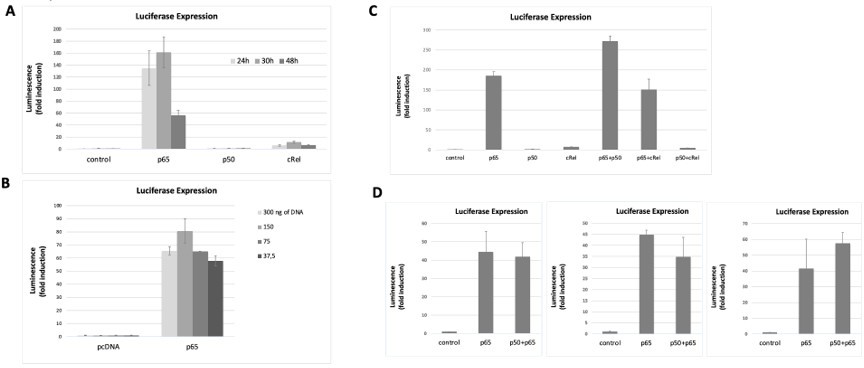
NF-κB subunits were overexpressed either alone or two subunits were simultaneously overexpressed and the induction of the luciferase reporter was assessed as fold change over empty vector control.
Transfection conditions for reporter and NF-κB subunits were optimised over time (A) and the total amount of transfected DNA was transfected (B) to find the optimal conditions for luciferase signal detection within non-saturating conditions. First, the reporter vector was transfected into HEK293 cells and 24h later the vectors for the overexpressions of the subunits were transacted. Luciferase was read at several time points (eventually we decided to read luciferase signals at 24 hours post transfection, A) and with different amounts of transfected DNA 150 ng of total DNA was chosen as the preferred DNA amount, (B). (C) Both single overexpressions and overexpressions of two subunits simultaneously were performed; overexpression of combinations of two NF-κB subunits aimed at promoting the formation of heterodimers – although we cannot exclude that only homodiners formed in these conditions. (D) We tested luciferase induction after overexpressing combinations of the subunits, D, luciferase induction after the combined overexpression of RelA/p65 and p50 was tested several times in addition to the experiment shown in C; luciferase induction following the double transactions was comparable to the induction by RelA/p65 alone, as shown in three independent experiments, in addition to the experiment in C. Here we show representative assays of at least two independent experiments; I D three independent experiments are shown for comparison. Data refers to averages and standard deviations of technical triplicates.
Author response image 5
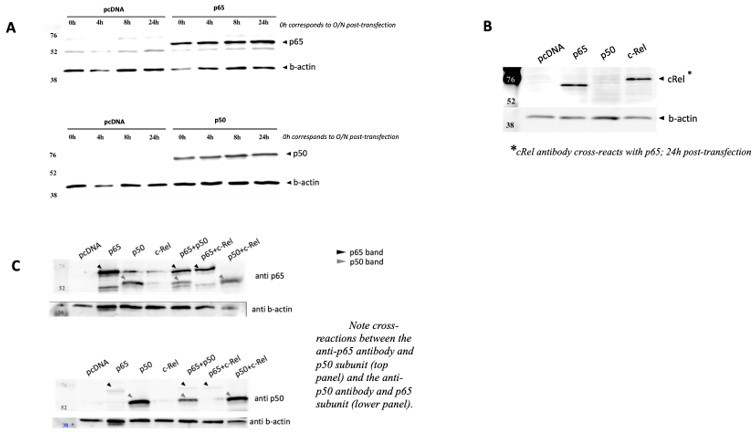
NF-κB subunits were overexpressed either alone or two subunits were solved simultaneously over expressed and the protein levels were assessed by WB full stop transfection conditions for reporter and NF-κB subunits were the same as in Author response image 3.
(A) Time courses of protein levels were performed for RelA/p65 and for p50 single transactions and compared with empty vector pcDNA. (B) c-Rel overexpression was also detected in cells 24h post transfection, but this antibody showed strong cross reaction with RelA/p65, and therefore limited tests were performed. (C) Simultaneous overexpression of p65 and p50 subunits did not seem to compromise protein levels of any of them.
Author response image 6
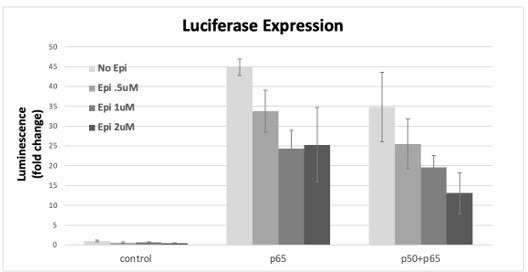
RelA/p65 was overexpressed either alone or simultaneously with p50 and the induction of the luciferase reporter was assessed as fold induction over empty vector control after incubation with several concentrations of AP from stock transactions were performed as described in the previous Author response images, Epi or vehicle were added 24h post transfection of the subunits and luciferase signal was read at 16h post Epi.
Author response image 7
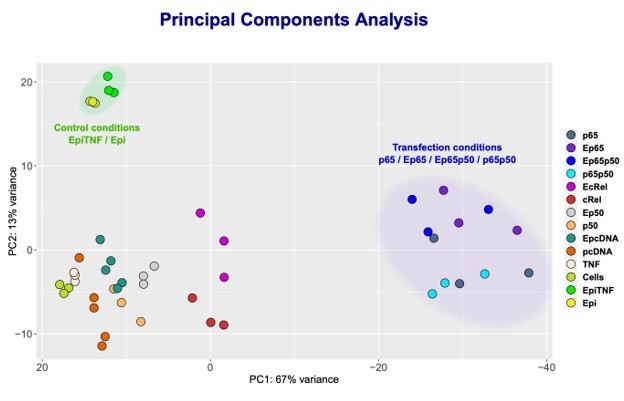
NF-κB subunits were overexpressed either alone or simultaneously and RNA-seq was performed.
Principle Component Analysis (PCA) of the sequencing data was obtained for the following samples: HEK293 cells without any treatment (Cells); TNF stimulated cells (TNF); Epi-treated cells (Epi); TNF-stimulated, Epi-treated cells (EpiTNF); pcDNA (empty vector) -transfected controls (pcDNA); RelA/p65 overexpressing (p65); P50 overexpressing (p50); c-Rel-overexpressing (c-Rel); RelA/p65 on p50 simultaneous transfection (p65p50); Epi-treated pcDNA (empty vector) -transfected controls(EpcDNA); Epi-treated RelA/p65 overexpressing (E65); Epi-treated P50 overexpressing (Ep50); Epi-treated c-rel-overexpressing (c-Rel); and Epi-treated RelA/p65 and P50 simultaneous transfection EP65P50.
Author response image 8
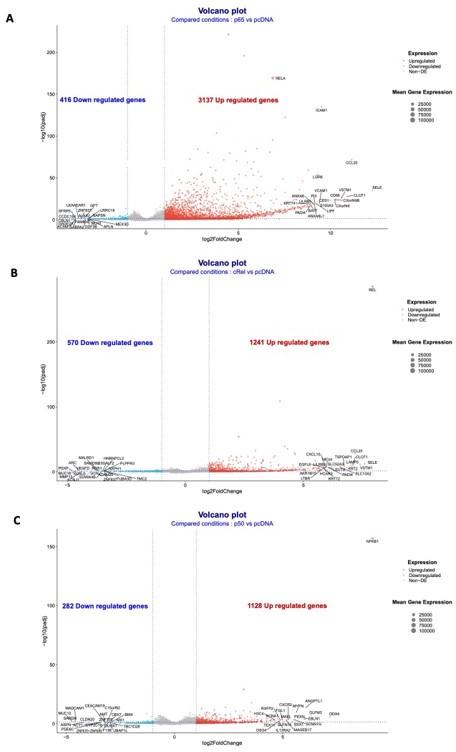
Volcano plots of the RNA-seq data for the overexpressions of RelA/p65, p50 and cRel.
Volcano plots of the conditions: (A) overexpression of RelA/p65 vs pcDNA; (B) overexpression of p50 vs pcDNA; and (C) overexpression of p50 vs pcDNA. Geenes with log2FoldChange expression above 2 or below -2 were considered to be upregulated or downregulated.
Author response image 9
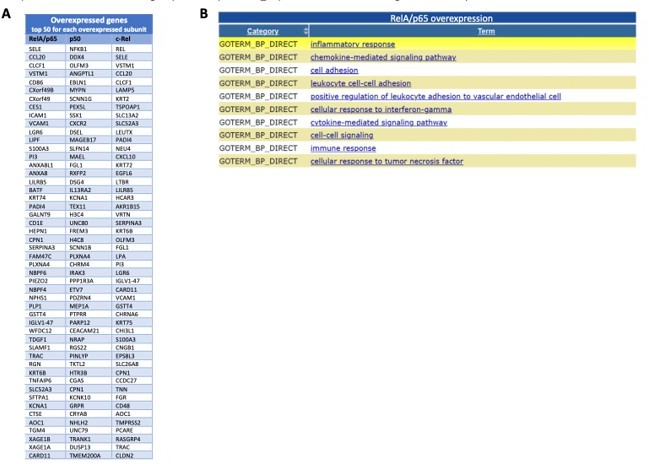
Most induced genes from the RNA-seq following overexpression of the NF-κB subunits and GO TERMS of the most significantly upregulated RelA/p65 targets.
I list of the 50 most significantly upregulated genes from the RNA-seq for each of the subunits overexpressed when compared with this expression in control P DNA; The lists start with the most significantly induced mRNA in the top of each column the top 200 upregulated mRNAs in RelA/p65 overexpression where analysed with the use of DAVID (https://david.ncifcrf.gov) and the 10 most represented GO TERMS for biological processes (GOTERM_BP) or shown from the most significant at the top.
Author response image 10

RNA-seq data for the expression of TNF in the different conditions tested, shown as an example of Epirubicin (Epi)-regulated NF-κB target gene.
The mRNA levels corresponding to TNF expression, as obtained by the RNA-seq. Controls were untransfected cells: HEK293 cells without any treatment (Cells); TNF-stimulated cells (TNF); Epi-treated cells (Epi); TNF-stimulated, Epi-treated cells (EpiTNF); HEK293 sounds where transfected and treated as follows: pcDNA (empty vector) -transfected controls (pcDNA); RelA/p65 overexpressing (p65); P50 overexpressing (p50); c-Rel-overexpressing (c-Rel); RelA/p65 and p50 simultaneous transfection P65P50; epi-treated pcDNA (empty vector) -transfected controls (EpcDNA); epi-treated RelA/p65 overexpressing (Ep65); Epi-treated P50 overexpressing (Ep50); Epi-treated c-Rel-overexpressing (EcRel); and Epi-treated RelA/p65 and P50 simultaneous transfection (Ep65p50). Values are arbitrary and represent fold induction over the condition “cells” alone, for which basal mRNA levels were considered to be zero.
Tables
Table 1
Summary of the data obtained by isothermal titration calorimetry (ITC).
The ligand (or titrant) was titrated to the analyte (or titrand) in the cell, for example Epi to DNA. The measured thermodynamic properties were: KD, dissociation constant; N, stoichiometry of the titrant; ΔH, enthalpy change; and ΔS, entropy change. T is the measurement temperature.
| KD (μM) | N | ΔH (kJ/mol) | −TΔS (kJ/mol) | |
|---|---|---|---|---|
| Epi to DNA | 11.3 ± 4.6 | 1.83 ± 0.14 | −14.1 ± 2.2 | −14.2 |
| Acla to DNA | 11.7 ± 2.0 | 2.13 ± 0.07 | −38.4 ± 2.0 | 10.3 |
| DNA to RelA | 0.23 ± 0.03 | 0.90 ± 0.01 | 40.7 ± 0.9 | −78.6 |
| (DNA + Epi) to RelA | 1.9 ± 0.17 | 0.88 ± 0.04 | 59.4 ± 3.0 | −92.1 |
| DNA to (RelA + Epi) | 0.98 ± 0.12 | 0.81 ± 0.01 | −305 ± 9 | 271 |
| DNA to (RelA + Acla) | 0.74 ± 0.32 | 0.91 ± 0.07 | −335 ± 40 | 300 |
| Epi to RelA | ND. Too weak. | |||
| Acla to RelA | ND. Too weak. | |||
Key resources table
| Reagent type (species) or resource | Designation | Source or reference | Identifiers | Additional information |
|---|---|---|---|---|
| Strain, strain background (male Mus musculus) | C57BL/6J | Instituto Gulbenkian de Ciência | JAX:000664 | |
| Strain, strain background (male Mus musculus, background C57BL/6J) | Atm−/− | Borghesani et al., 2000 doi:10.1073/pnas.97.7.3336 | From Frederick W. Alt (Harvard Medical School, Boston, MA, USA) | |
| Cell line (Homo sapiens) | HEK293 | ATCC | CRL-1573 | |
| Cell line (Homo sapiens) | THP-1 | TCC | TIB-202 | |
| Antibody | Anti-RelA (rabbit polyclonal) | Santa Cruz | sc-372 | 1:2000 |
| Antibody | Anti-RNAPolII (mouse monoclonal) | Santa Cruz | sc-17798 | 1:1000 |
| Antibody | Anti-IκBα (rabbit polyclonal) | Santa Cruz | sc-371 | 1:2000 |
| Antibody | Anti-β-actin (mouse monoclonal) | Santa Cruz | sc-58673 | 1:4000 |
| Peptide, recombinant protein | Lipopolysaccharide (LPS) from E. coli 055:B5 | Santa Cruz | sc-221855B | |
| Peptide, recombinant protein | Human TNF-alpha | Peprotech | 300-01A | |
| Commercial assay or kit | AlamarBlue Cell Viability Reagent | Invitrogen | DAL1100 | |
| Commercial assay or kit | RNeasy Mini Kit | Qiagen | 50974106 | |
| Commercial assay or kit | Taq Universal SYBR Green Supermix | Bio-Rad | 1725125 | |
| Commercial assay or kit | Superscript II | Invitrogen | 18064014 | |
| Commercial assay or kit | Lipofectamine 3000 Transfection Reagent | Invitrogen | L3000-001 | |
| Commercial assay or kit | Luciferase Assay System | Promega | PROME1500 | |
| Commercial assay or kit | Mouse TNF-α ELISA MAX Standard | BioLegend | 430902 | |
| Commercial assay or kit | Mouse IL-6 ELISA MAX Standard | BioLegend | 431302 | |
| Commercial assay or kit | Mouse IL-12(p40) ELISA MAX Standard | BioLegend | 431602 | |
| Commercial assay or kit | LEGEND MAX Mouse IFN-β ELISA Kit | BioLegend | 439407 | |
| Commercial assay or kit | Mouse CXCL10 DuoSet ELISA | R&D Systems | DY466 | |
| Commercial assay or kit | Human/Mouse/Rat Phospho-Histone H2AX | R&D Systems | KCB2288 | |
| Commercial assay or kit | CometAssay Kit 25 × 2 well slides | Trevigen | 4250-050K | |
| Chemical compound, drug | Epirubicin | Target Mol | 282T0125 | |
| Chemical compound, drug | Aclarubicin | FOCUS Biomolecules | 21910-1099 | |
| Chemical compound, drug | Doxorubicin | FOCUS Biomolecules | 21910-2130 | |
| Chemical compound, drug | Etoposide | Sigma-Aldrich | E1383 | |
| Chemical compound, drug | DMSO | Sigma-Aldrich | D2650 | |
| Chemical compound, drug | KU-55933 | Sigma-Aldrich | SML1109 | |
| Chemical compound, drug | MG-132 | Sigma-Aldrich | M7449 | |
| Chemical compound, drug | Actinomycin D | Sigma-Aldrich | A9415 | |
| Chemical compound, drug | D-(+)-Glucose solution | Sigma-Aldrich | G8769 | |
| Chemical compound, drug | cOmplete, EDTA-free | Roche | 11873580001 | |
| Chemical compound, drug | DL-Dithiothreitol-d10 | Cortecnet | CD4035P1 | |
| Chemical compound, drug | Dimethylsulfoxide D6 | Eurisotop | D010 | |
| Chemical compound, drug | Tris-D11 | Cortecnet | CD4035P1 | |
| Other | Ni-NTA Agarose | Qiagen | 30210 | Purification resin |
| Other | HiLoad 16/600 Superdex | Merck | GE28-9893-33 | Purification resin |
| Other | Superdex 200 10/300 GL | Merck | GE17-5175-01 | Purification resin |
| Other | RPMI 1640 Medium, no glutamine | Life Technologies | 31870-025 | Component of cell culture media |
| Other | DMEM, high glucose, pyruvate | Life Technologies | 41966-052 | Component of cell culture media |
| Other | Fetal bovine serum (FBS) | Life Technologies | 10500-064 | Component of cell culture media |
| Other | Penicillin–streptomycin | Life Technologies | 15140-122 | Component of cell culture media |
| Other | Sodium pyruvate | Life Technologies | 11360-039 | Component of cell culture media |
| Other | L-Glutamine | Life Technologies | 25030-024 | Component of cell culture media |
| Other | Non-essential aminoacids solution | Life Technologies | 11140-035 | Component of cell culture media |
| Other | HEPES buffer | Life Technologies | 15630-056 | Component of cell culture media |
| Other | 2-Mercaptoethanol | Life Technologies | 31350-010 | Component of cell culture media |
Author response table 1
Tools for CRISPR/Cas9 in HEK293 cells.
| Human Gene | Protein | Double Nickase Plasmid |
|---|---|---|
| RELA | p65 (RelA) subunit | sc-400004-NIC-2 |
| NFKB1 | P50 subunit | sc-400087-NIC-2 |
| REL | c-Rel | sc-400478-NIC-2 |
| Scrambled control RNA sequence | - | sc-437281 |
Author response table 2
Human primers used.
| Human Gene | Forward Primer | Reverse Primer |
|---|---|---|
| RELA/ p65 | ATGTGGAGATCATTGAGCAGC | CCTGGTCCTGTGTAGCCATT |
| NFKB1/ p50 | GAAGCACGAATGACAGAGGC | GCTTGGCGGATTAGCTCTTTT |
| REL/ c-Rel | CAACCGAACATACCCTTCTATCC | TCTGCTTCATAGTAGCCGTCT |
| GAPDH | GAGTCAACGGATTTGGTCGT | TTGATTTTGGAGGGATCTCG |
Additional files
Download links
A two-part list of links to download the article, or parts of the article, in various formats.
Downloads (link to download the article as PDF)
Open citations (links to open the citations from this article in various online reference manager services)
Cite this article (links to download the citations from this article in formats compatible with various reference manager tools)
DNA damage independent inhibition of NF-κB transcription by anthracyclines
eLife 11:e77443.
https://doi.org/10.7554/eLife.77443


