Neural tracking of phrases in spoken language comprehension is automatic and task-dependent
- Language and Computation in Neural Systems group, Max Planck Institute for Psycholinguistics, Netherlands
- Language and Computation in Neural Systems group, Donders Centre for Cognitive Neuroimaging, Netherlands
- Department of Cognitive Neuroscience, Faculty of Psychology and Neuroscience, Maastricht University, Netherlands
- ADAPT Centre, School of Computer Science and Statistics, University of Dublin, Trinity College, Ireland
- CIMeC - Center for Mind/Brain Sciences, University of Trento, Italy
Figures
Figure 1 with 1 supplement
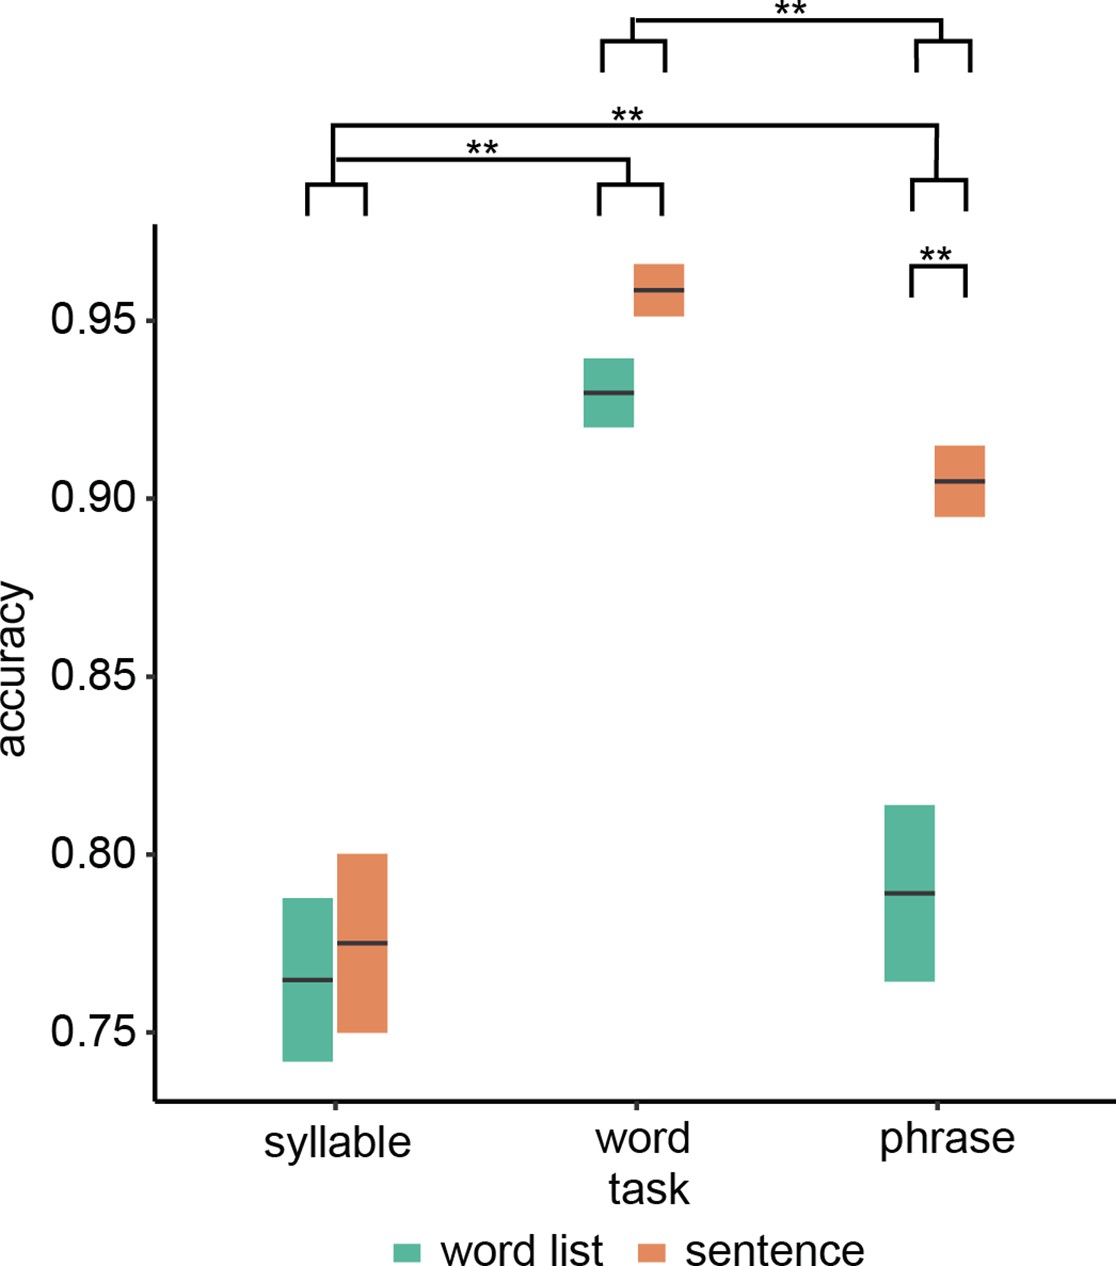
Behavioural results.
Accuracy for the three different tasks. Double asterisks indicate significance at the 0.01 level using a paired samples t-test (n=19). Box edges indicate the standard error of the mean.
Figure 1—figure supplement 1
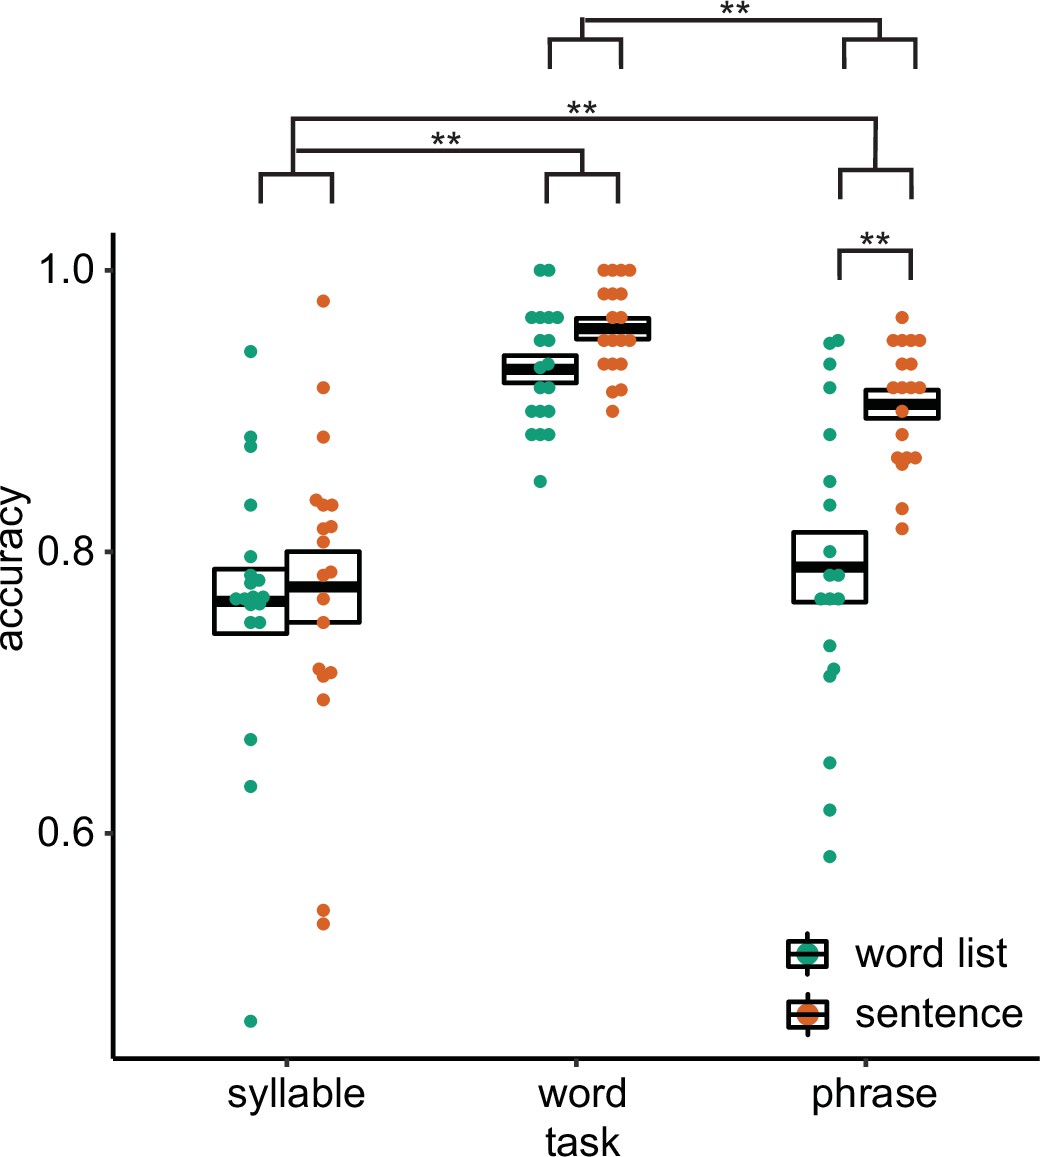
Behavioural results with individual data.
Accuracy for the three different tasks. Double asterisks indicate significance at the 0.01 level using a paired samples t-test (n=19).
Figure 2
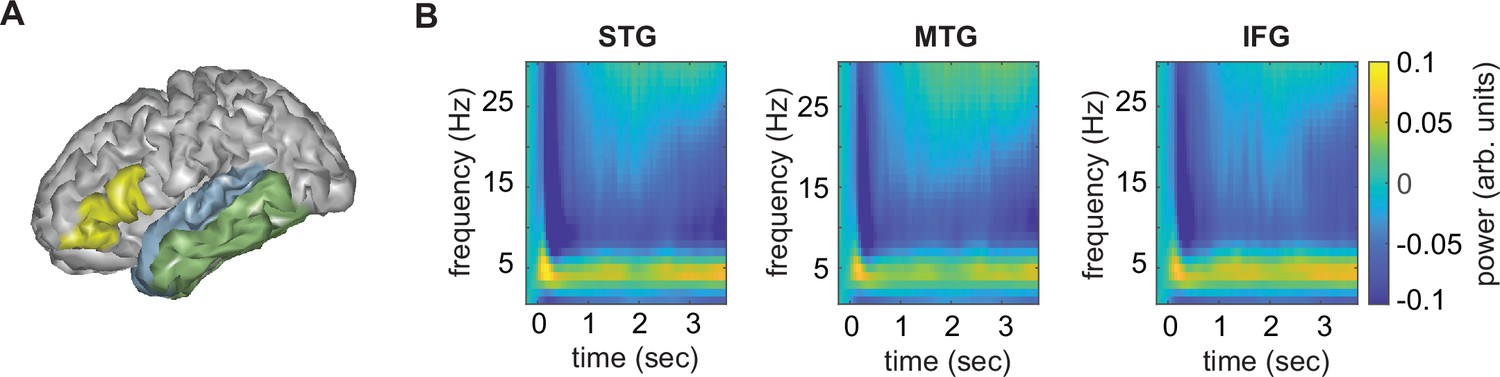
Anatomical regions of interests (ROIs).
(A) ROIs displayed on one exemplar participant surface. (B) Time–frequency response at each ROI. STG = superior temporal gyrus, MTG = medial temporal gyrus, IFG = inferior frontal gyrus.
Figure 3 with 2 supplements
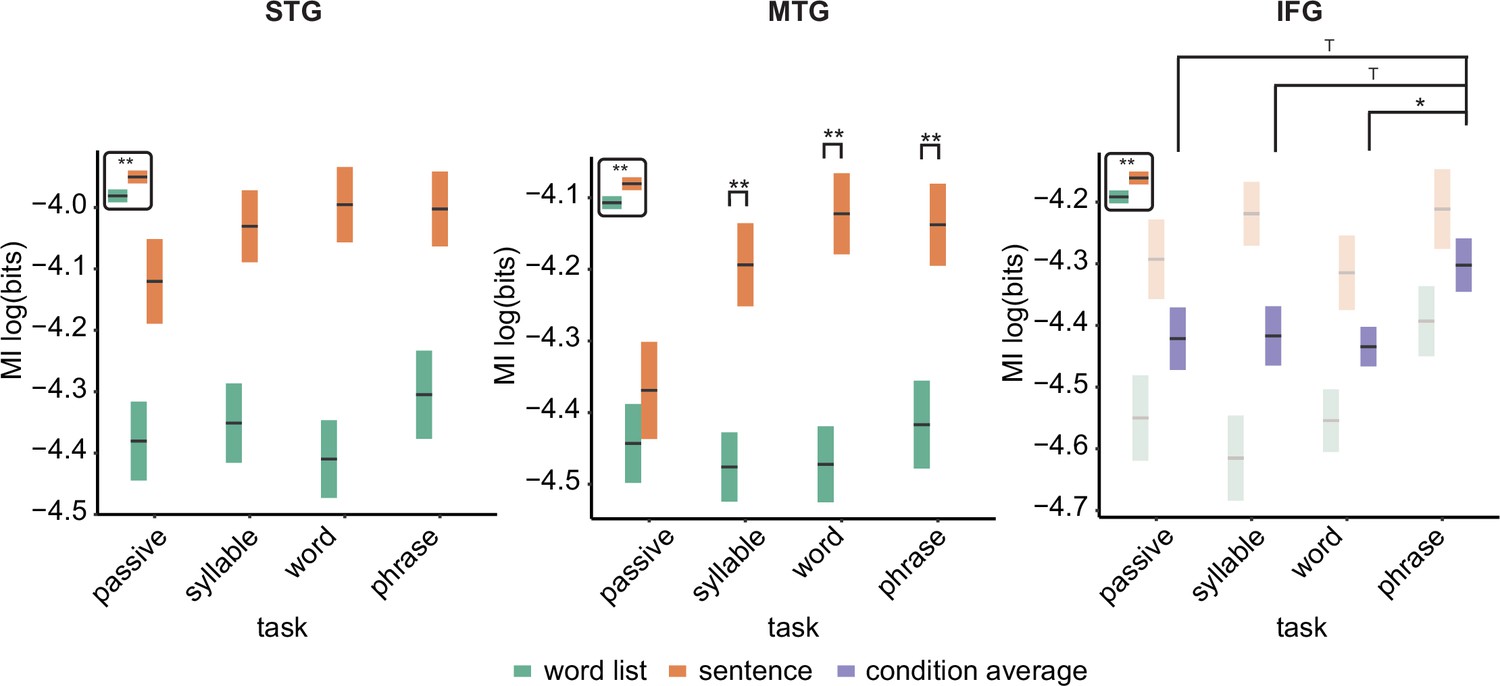
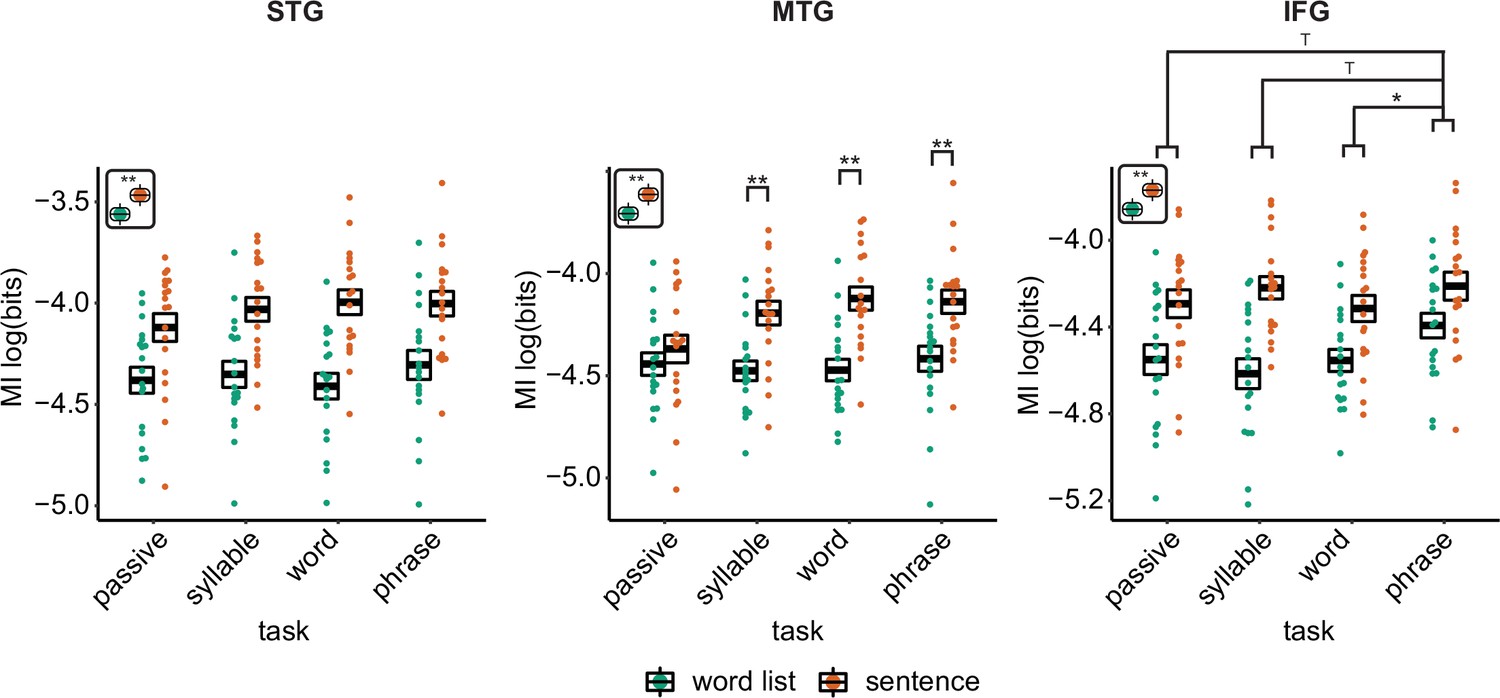
Mutual information (MI) analysis at the phrasal band (0.8–1.1 Hz) for the three different regions of interests (ROIs).
Single and double asterisks indicate significance at the 0.05 and 0.01 level using a paired samples t-test (n=19). T indicates trend level significance (p < 0.1). Inset at the top left of the graph indicates whether a main effect of condition was present (with higher MI for sentences versus word lists; this inset does not reflect real data). Averages of conditions are only shown if there was a main task effect without an interaction. Box edges indicate the standard error of the mean.
Figure 3—figure supplement 1
Mutual information (MI) analysis at the phrasal band (0.8–1.1 Hz) for the three different regions of interests (ROIs) with individual data.
Single and double asterisks indicate significance at the 0.05 and 0.01 level using a paired samples t-test (n=19). T indicates trend level significance (p < 0.1). Inset at the top left of the graph indicates whether a main effect of condition was present (with higher MI for sentences versus word lists; this inset does not reflect real data). Averages of conditions are only shown if there was a main task effect.
Figure 3—figure supplement 2
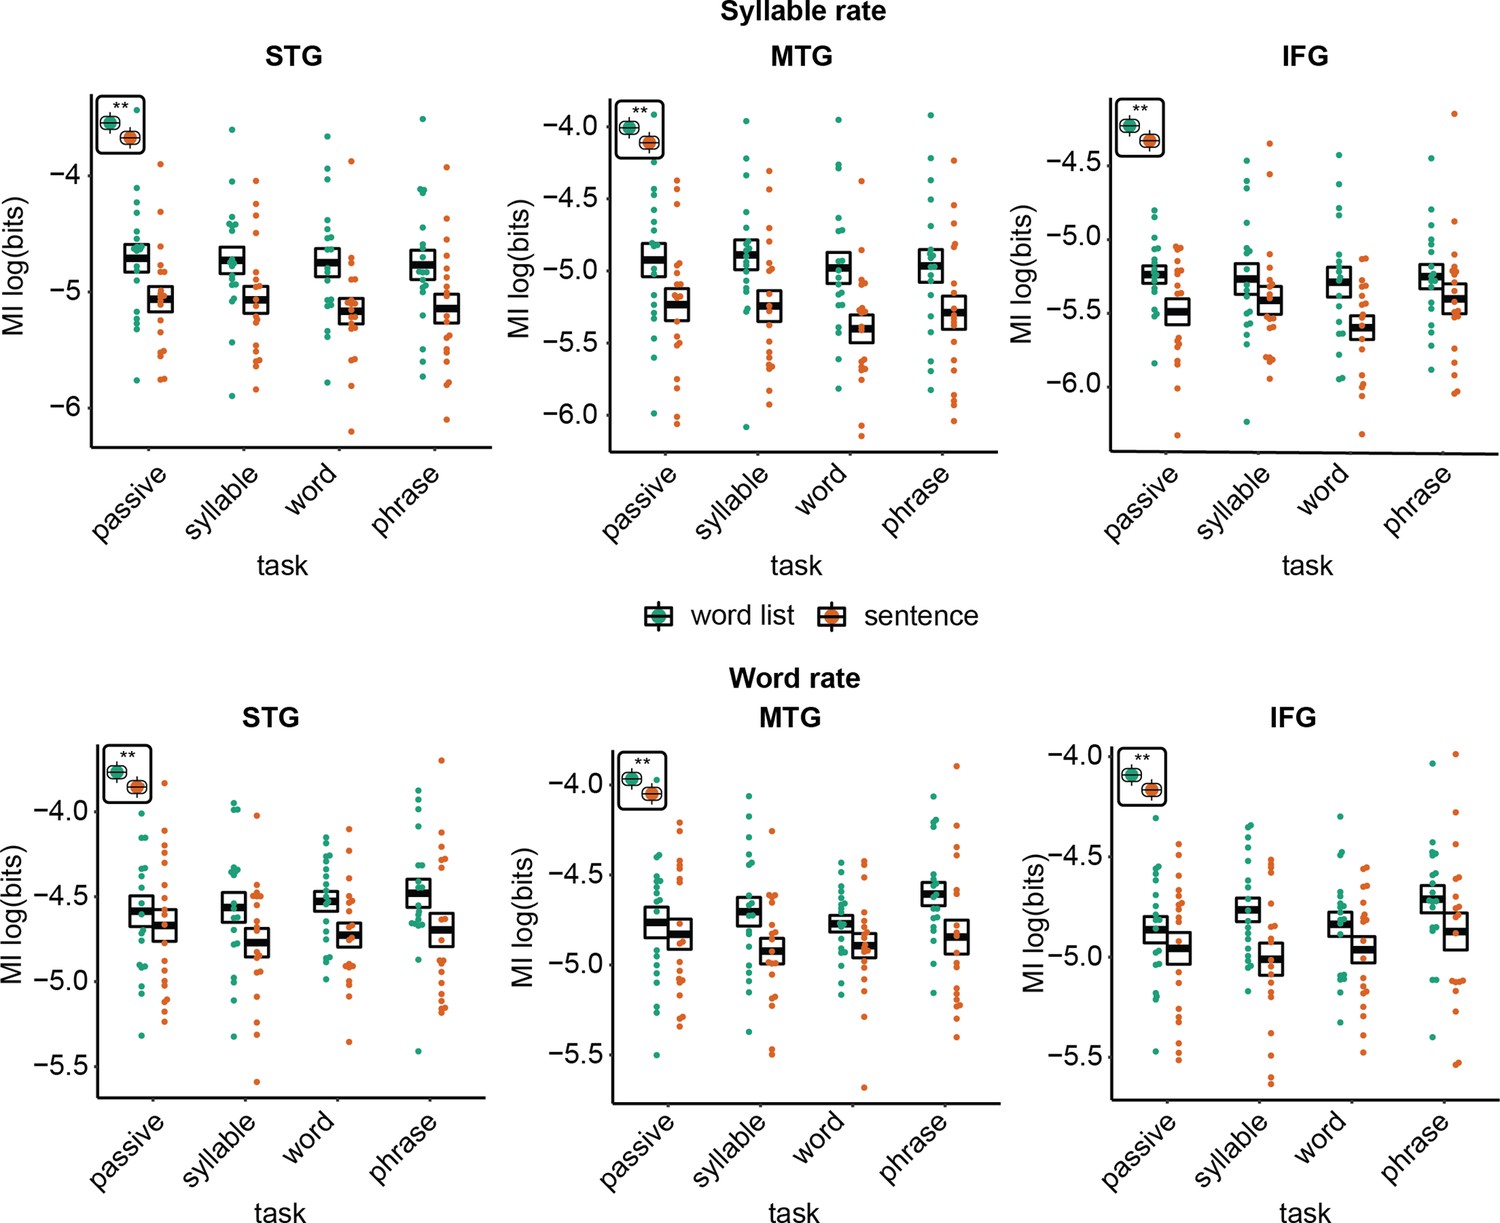
Mutual information (MI) analysis at the syllable (3.5–5.0 Hz) and word rate (1.9–2.8 Hz) for the three different regions of interests (ROIs).
Double asterisks indicate significance at the 0.01 level using a paired samples t-test (n=19). Inset at the top left of the graph indicates whether a main effect of condition was present (with higher MI for word lists versus sentences; this inset does not reflect real data).
Figure 4 with 2 supplements
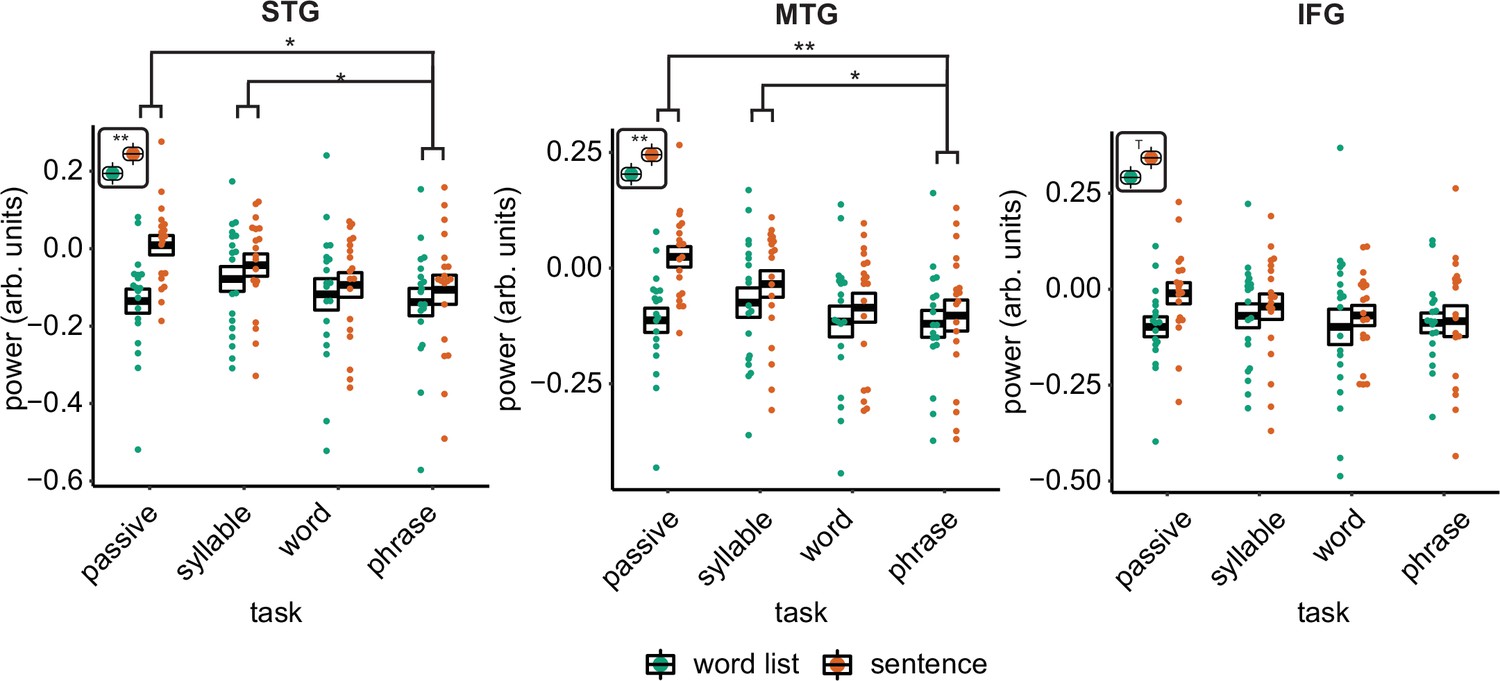
Power effects for the different regions of interests (ROIs).
Single and double asterisks indicate significance at the 0.05 and 0.01 level using a paired samples t-test (n=19). T indicates trend significance (p < 0.1) Inset at the right top of the graph indicates whether a main effect of condition was present (with higher activity for sentences versus word lists; this inset does not reflect real data). Averages of conditions are only shown if there was a main task effect. Box edges indicate the standard error of the mean.
Figure 4—figure supplement 1
Power effects for the different regions of interests (ROIs) with individual data.
Single and double asterisks indicate significance at the 0.05 and 0.01 level using a paired samples t-test (n=19). T indicates trend significance (p < 0.1) Inset at the left top of the graph indicates whether a main effect of condition was present (with higher activity for sentences versus word lists; this inset does not reflect real data). Averages of conditions are only shown if there was a main task effect.
Figure 4—figure supplement 2
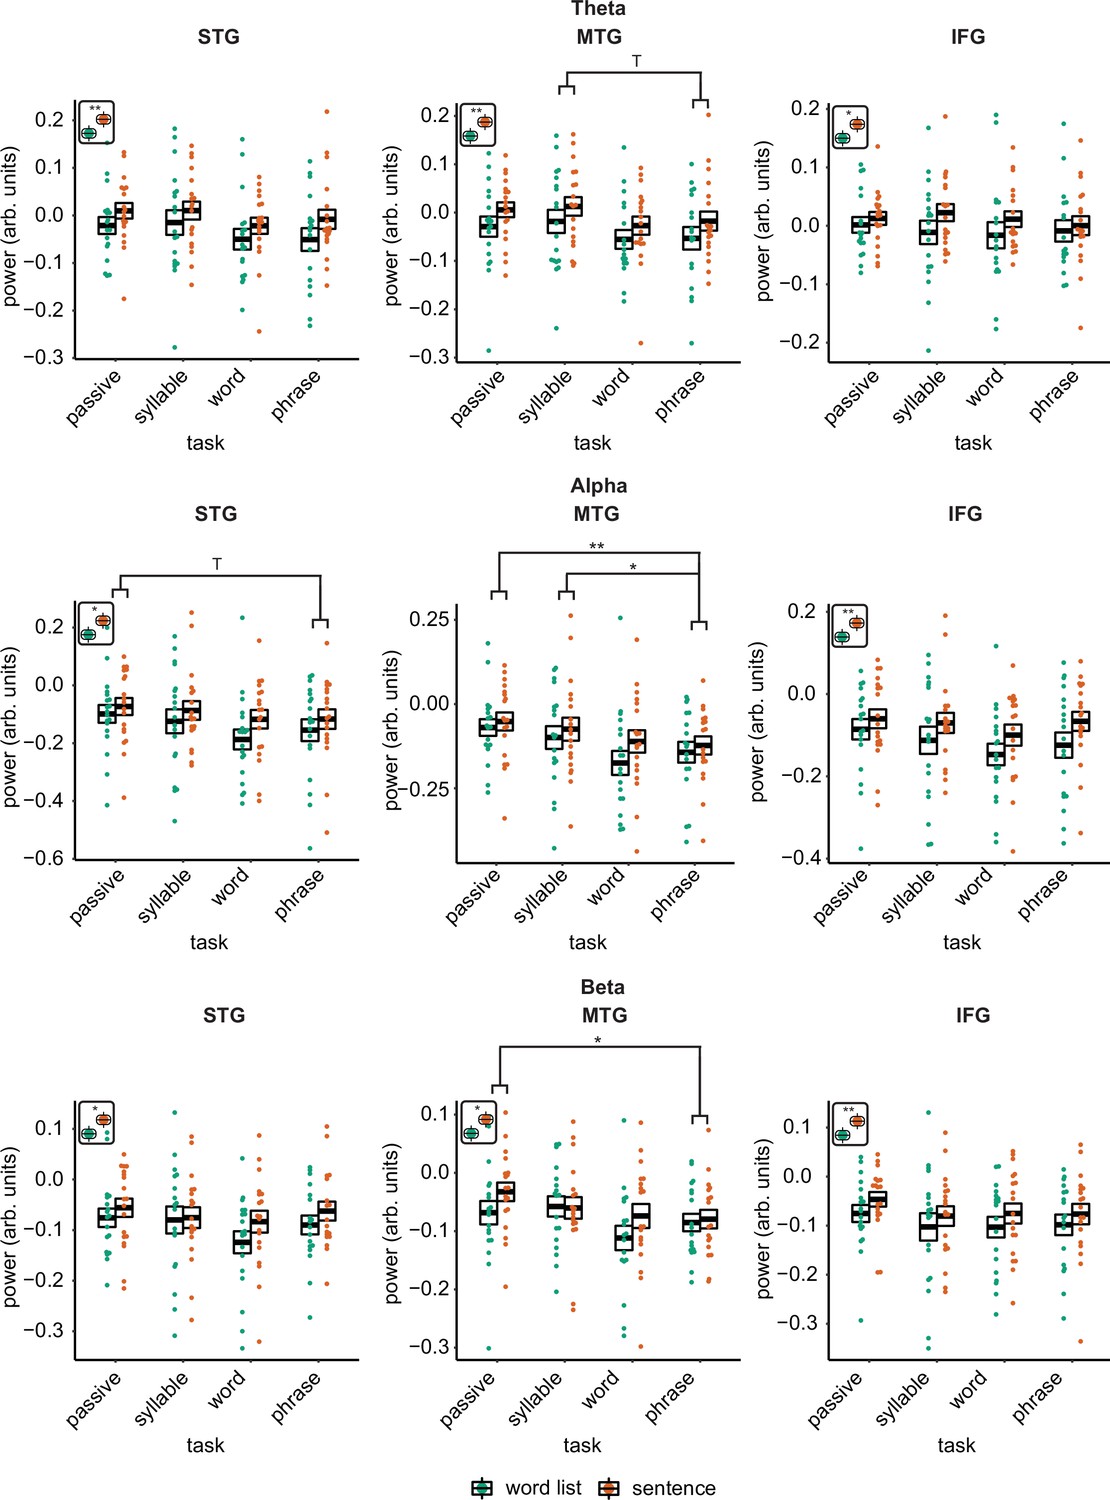
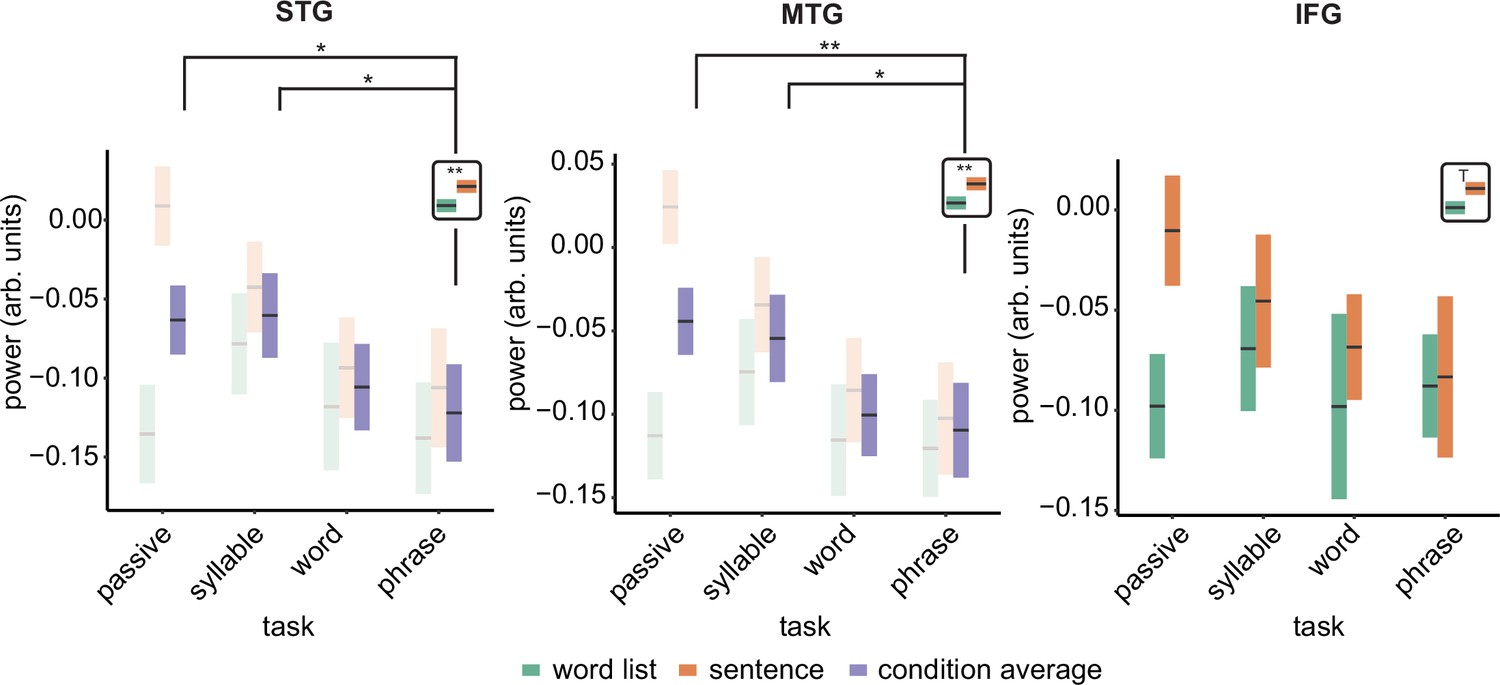
Power effects for the different regions of interests (ROIs) and different bands.
Single and double asterisks indicate significance at the 0.05 and 0.01 level using a paired samples t-test (n=19). T indicates trend significance (p < 0.1) Inset at the top left of the graph indicates whether a main effect of condition was present (with higher activity for sentences versus word lists; this inset does not reflect real data).
Figure 5
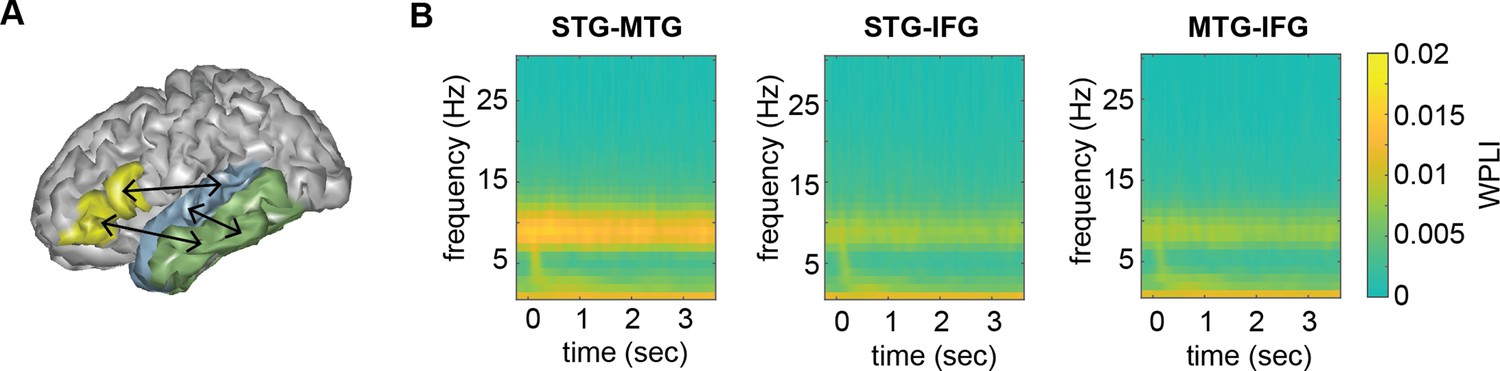
Connectivity pattern between anatomical regions of interests (ROIs).
(A) ROI connections displayed on one exemplar participant surface. (B) Time–frequency weighted phase-lagged index (WPLI) response at each ROI.
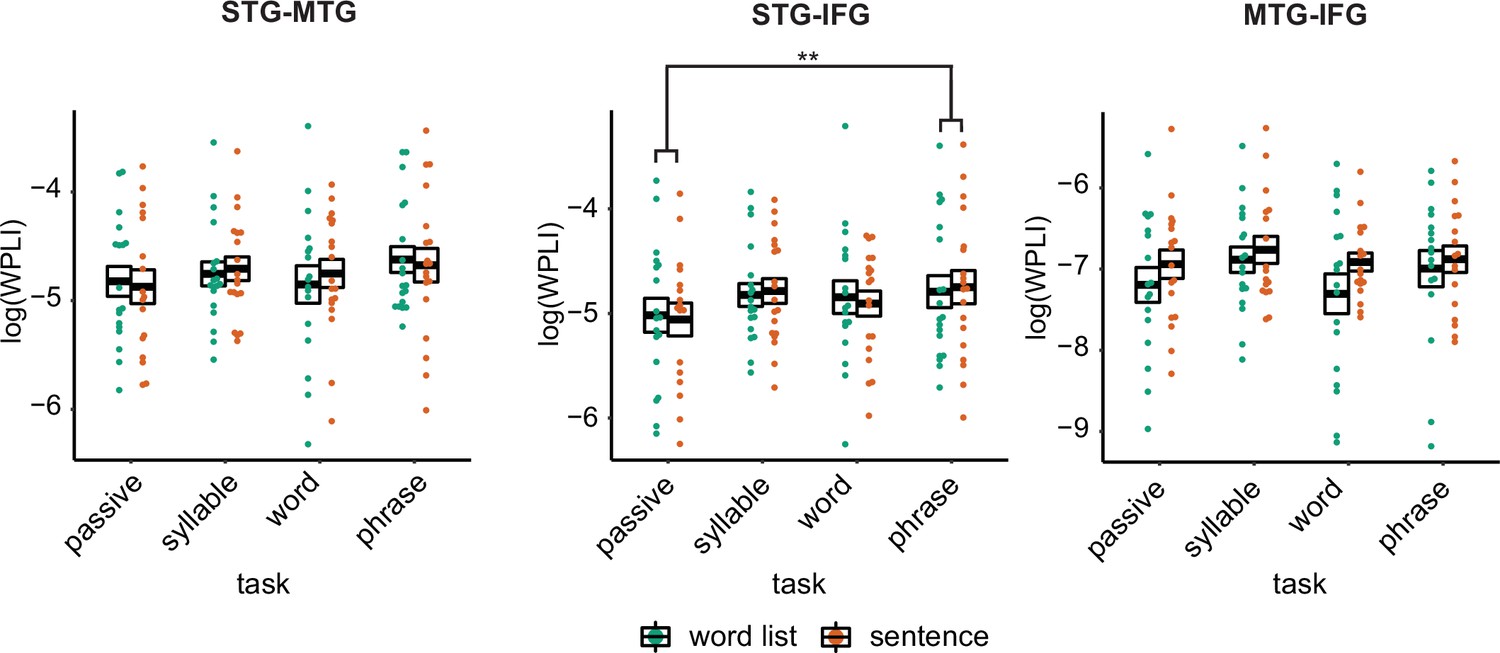
Figure 6 with 2 supplements
Weighted phase lag index (WPLI) effects for the different regions of interests (ROIs).
Double asterisks indicate significance at the 0.01 level using a paired samples t-test (n=19) after correcting for power differences between the two conditions (we plot the original data, not corrected for power, as we can only perform pairwise power and consequently data will be different for each control). Averages of conditions are only shown if there was a main task effect. Box edges indicate the standard error of the mean.
Figure 6—figure supplement 1
Weighted phase lag index (WPLI) effects for the different regions of interests (ROIs) with individual data.
Single and double asterisks indicate significance 0.01 level using a paired samples t-test (n=19) after correcting for power differences between the two conditions (we plot the original data, not corrected for power, as we can only perform pairwise power and consequently data will be different for each control). Averages of conditions are only shown if there was a main task effect.
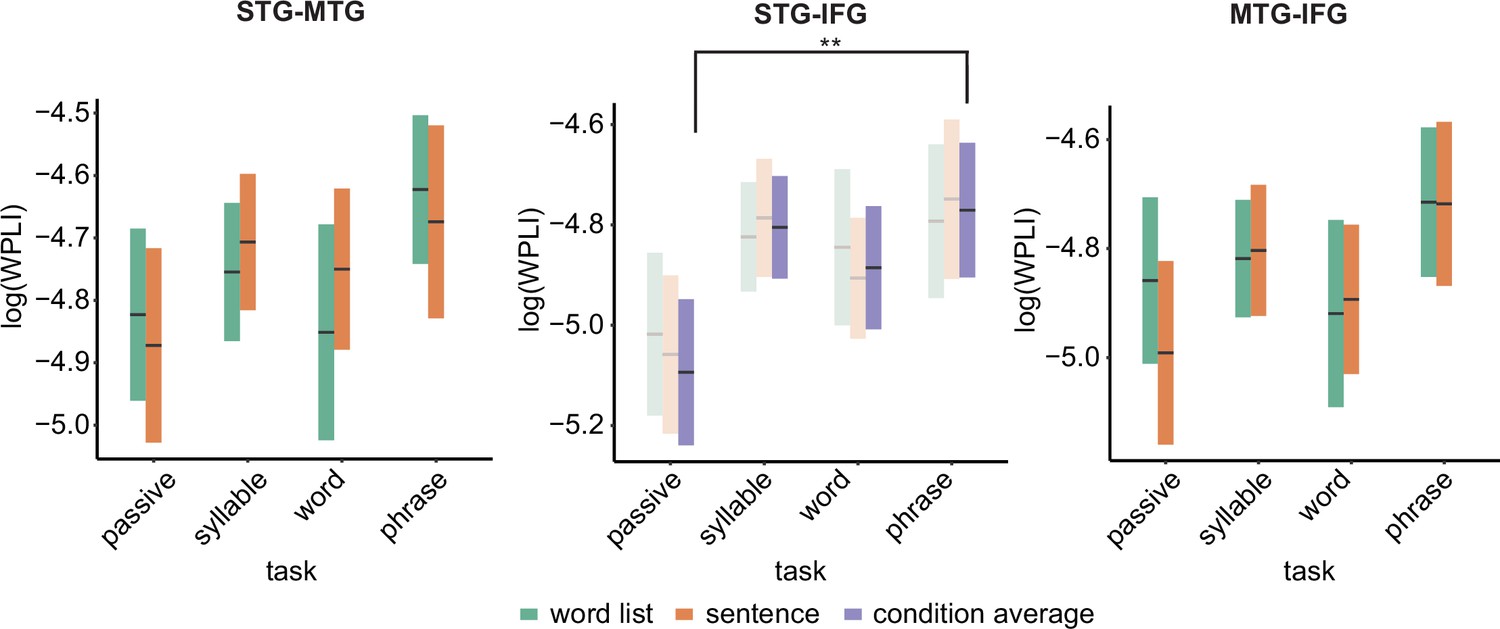
Figure 6—figure supplement 2
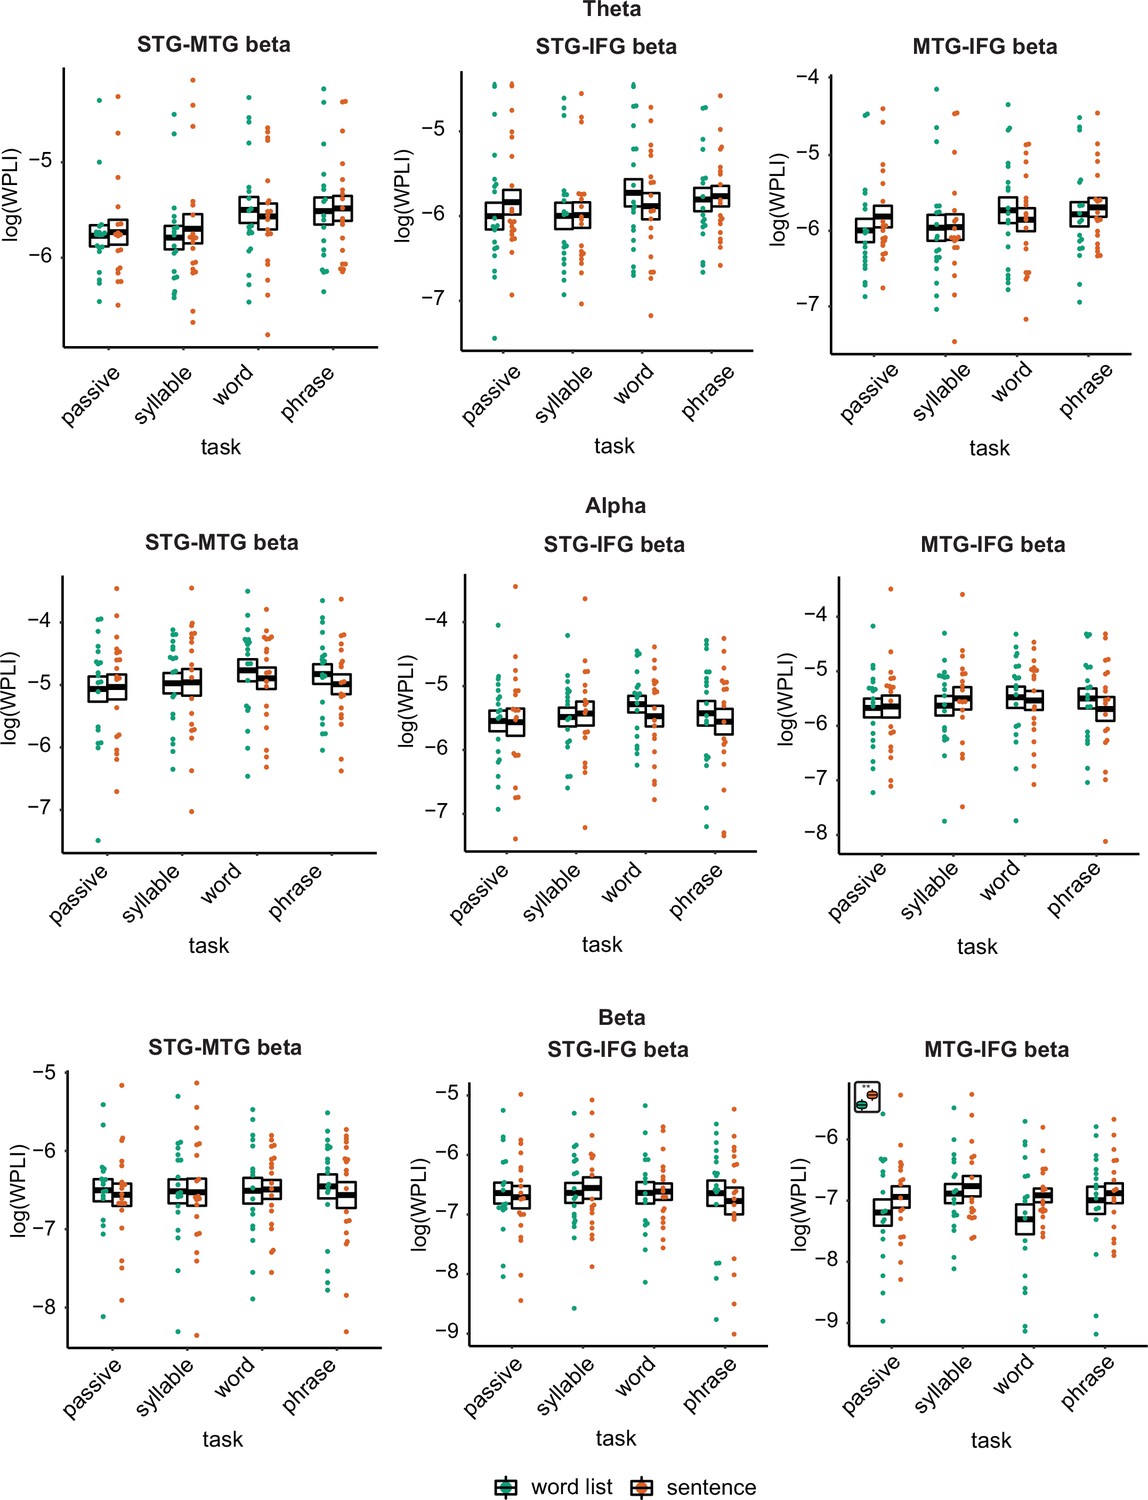
Weighted phase lag index (WPLI) effects for the different regions of interests (ROIs) and different bands.
Connectivity is displayed before correcting for power differences. None of the effects survived correcting for power differences. Inset at the top left of the graph indicates whether a main effect of condition was present (with higher activity for sentences versus word lists; this inset does not reflect real data).
Figure 7 with 1 supplement
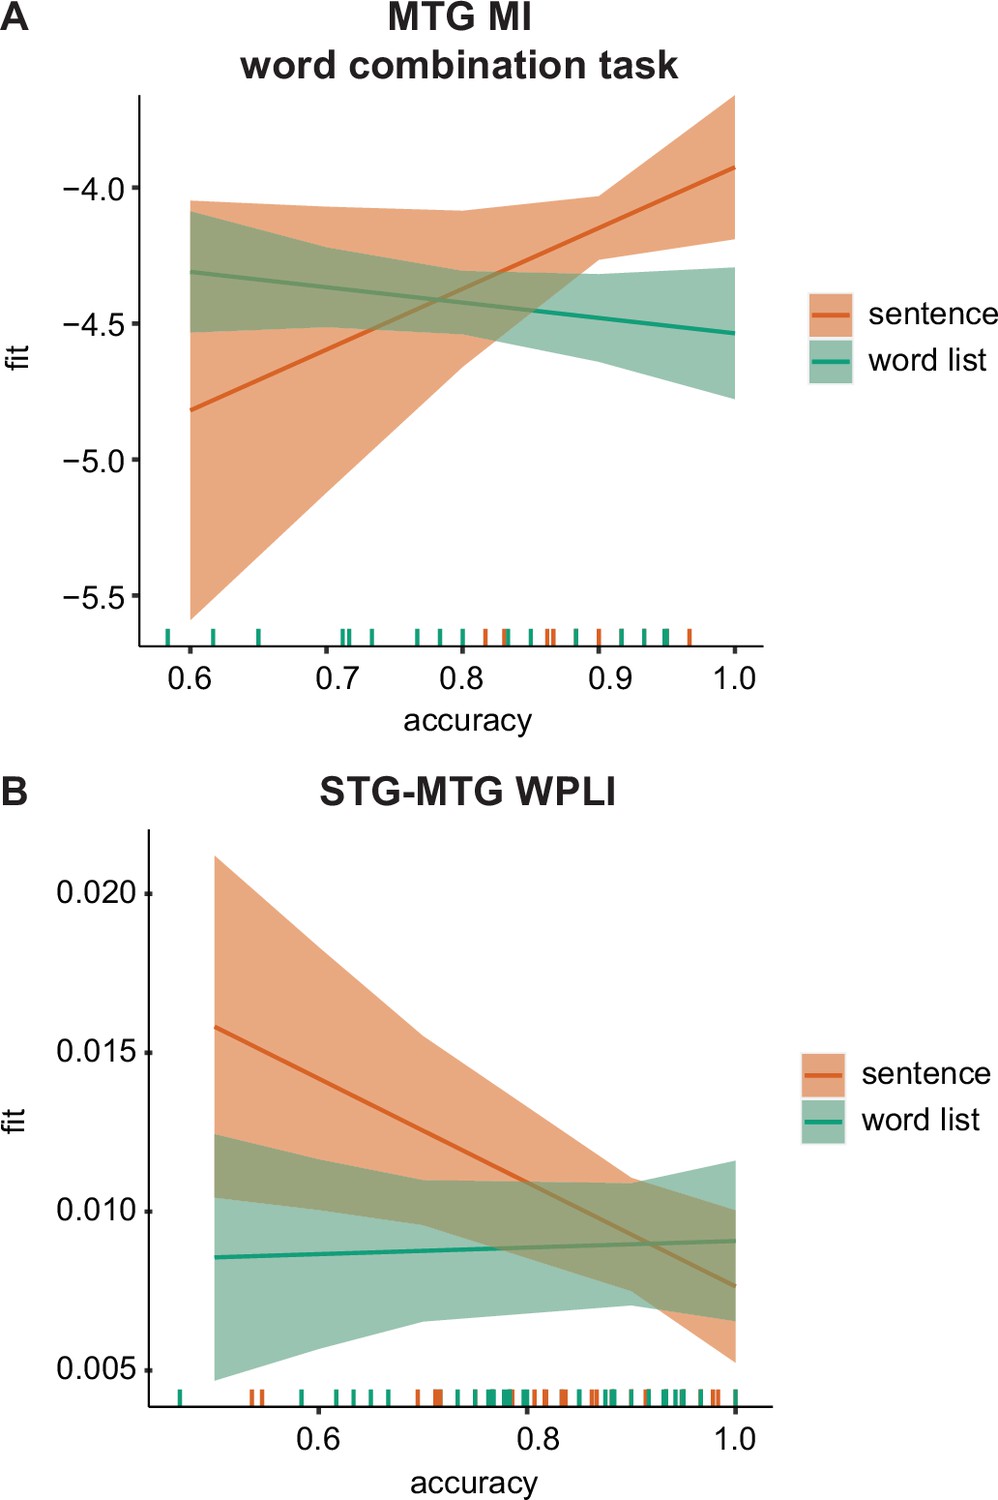
MEG–behavioural performance relation.
(A) Predicted values for the phrasal band MI in the middle temporal gyrus (MTG) for the word-combination task separately for the two conditions. (B) Predicted values for the delta-band weighted phase lag index (WPLI) in the superior temporal gyrus (STG)–MTG connection separately for the two conditions. Error bars indicate the 95% confidence interval of the fit. Coloured lines at the bottom indicate individual datapoints.
Figure 7—figure supplement 1
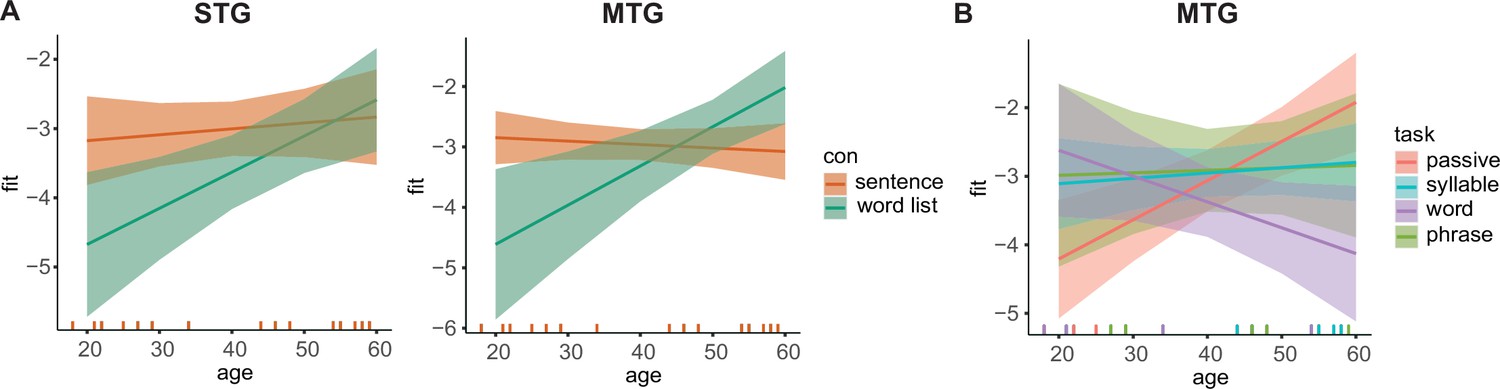
Age effects on power estimates.
(A) Predicted values for delta power for the two conditions dependent on age in superior temporal gyrus (STG, left) and middle temporal gyrus (MTG, right). (B) Predicted values for delta power for the four tasks dependent on age in MTG. Error bars indicate the 95% confidence interval of the fit. Coloured lines at the bottom indicate individual datapoints.
Author response image 1

Age effects on power estimates.
(A) Predicted values for δ power for the two conditions dependent on age in STG (left) and MTG (right). (B) Predicted values for δ power for the four tasks dependent on age in MTG. Error bars indicate the 95% confidence interval of the fit. Colored lines at the bottom indicate individual datapoints.
Author response image 2
Tables
Table 1
Stimuli and task examples.
| Sentence | [bange helden] [plukken bloemen] en de [bruine vogels] [halen takken] [timid heroes] [pluck flowers] and the [brown birds] [gather branches] | |||
| Word list | [helden bloemen] [vogels takken] de en [plukken halen] [bange bruine] [heroes flowers] [birds branches] and the [pluck gather] [timid brown] | |||
| Sentence | Word list | |||
| Correct | Incorrect | Correct | Incorrect | |
| Syllable | /bɑ/ | /lɑ/ | /bɑ/ | /lɑ/ |
| Word | bloemen [flowers] | vaders [fathers] | bloemen [flowers] | vaders [fathers] |
| Word combination | bange helden [timid heroes] | halen bloemen [gather flowers] | helden bloemen [heroes flowers] | vogels bloemen [birds flowers] |
-
For each condition (sentence and word list) one example stimulus (top) and corresponding tasks are shown (bottom).
Additional files
Download links
A two-part list of links to download the article, or parts of the article, in various formats.
Downloads (link to download the article as PDF)
Open citations (links to open the citations from this article in various online reference manager services)
Cite this article (links to download the citations from this article in formats compatible with various reference manager tools)
Neural tracking of phrases in spoken language comprehension is automatic and task-dependent
eLife 11:e77468.
https://doi.org/10.7554/eLife.77468


