Intrinsic excitability mechanisms of neuronal ensemble formation
- Department of Biological Sciences, Columbia University, United States
Figures
Figure 1
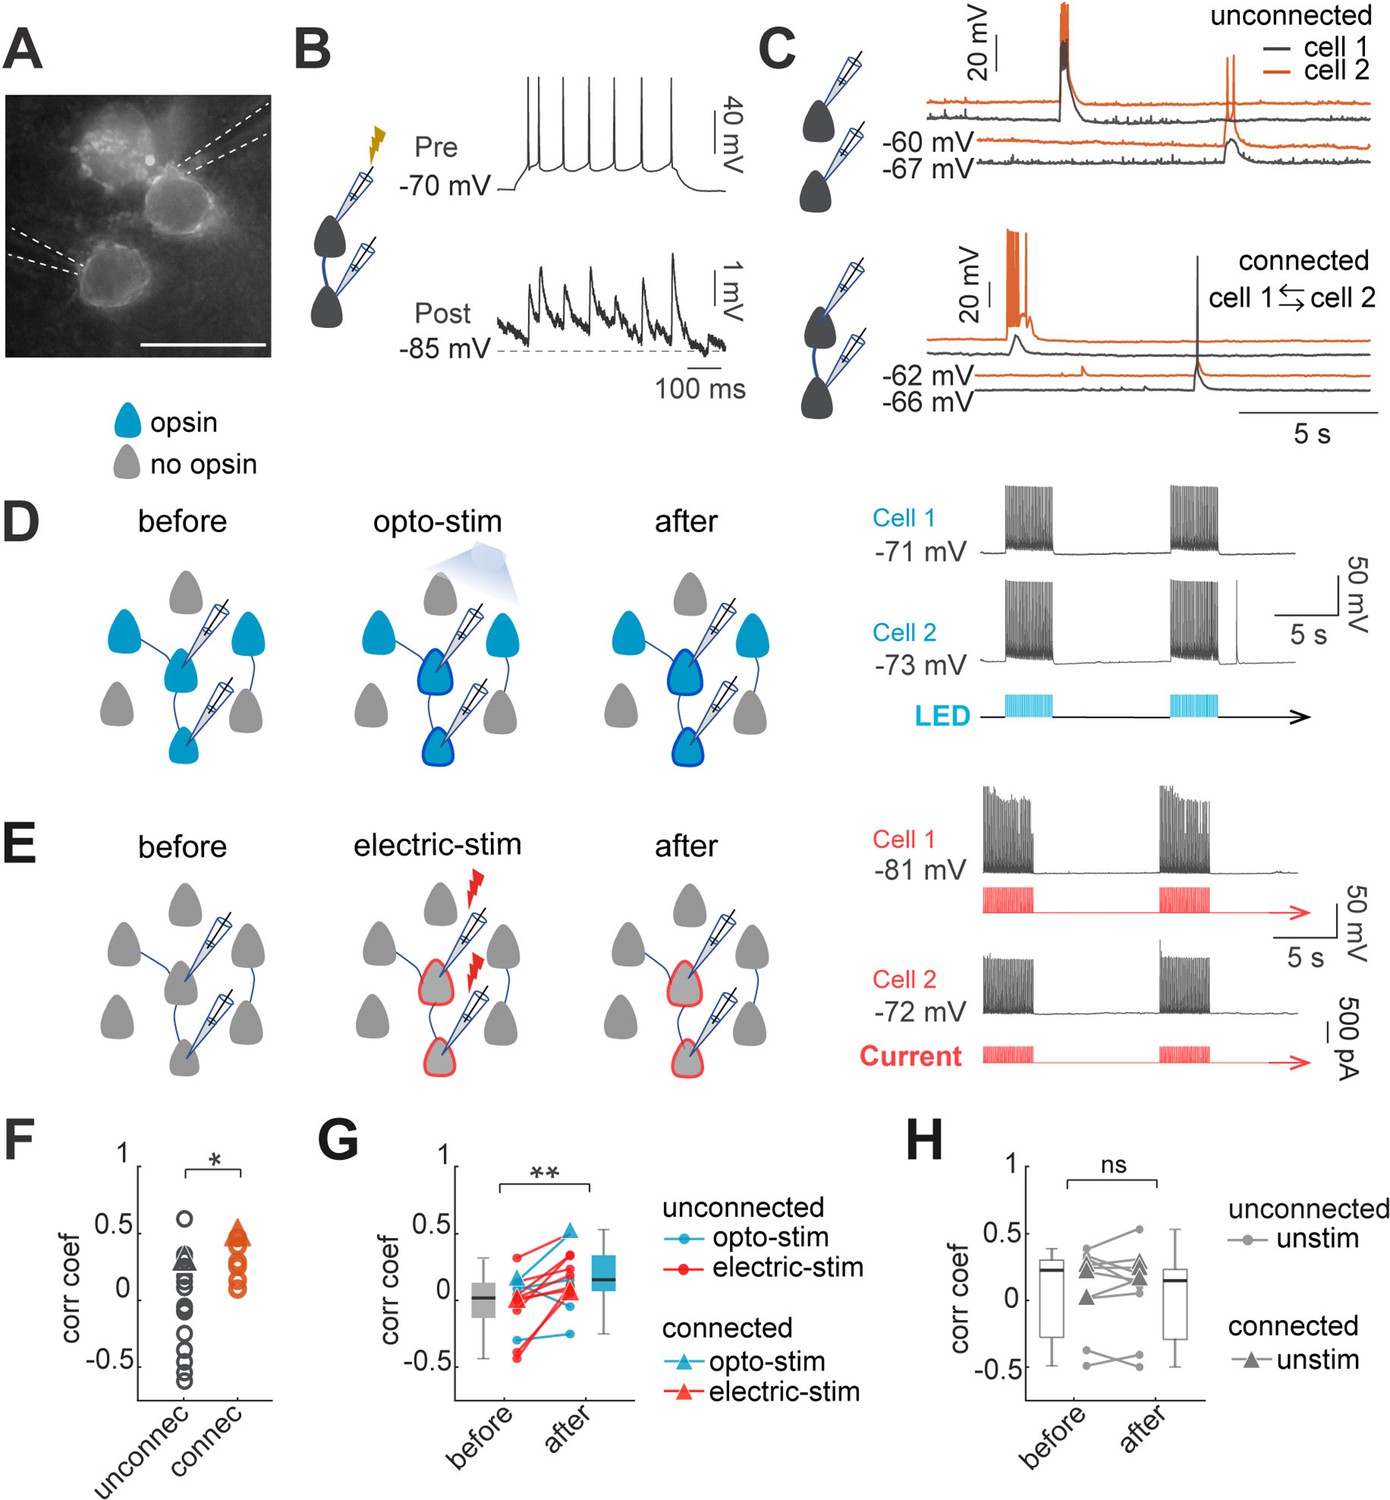
Optogenetic and electrical co-stimulation increases correlations of spontaneous activity.
(A) Image of Ruby3 reporter fluorescent of ST-ChroMe opsin expression in L2/3 pyramidal neurons in primary visual cortex, in a brain slice of an in-utero electroporated mice. Scale bar: 40 μM. (B) Paired recording measurements of monosynaptic connectivity. Perforated patch-clamp recording of presynaptic action potentials elicited by 100 pA current injections (500ms), followed by identification of a monosynaptic connection, generating postsynaptic potentials, time-locked to presynaptic spikes. (C) Spontaneous activity of two pairs. Top: current-clamp spontaneous activity of unconnected neurons (correlation coefficient = 0.33). Bottom: Representative paired recording from neurons that were bi-directionally connected (correlation coefficient = 0.49). (D) Experimental design of optogenetic protocol. Perforated current-clamp recording of two neurons with opsin expression in blue: 1–30 min of 10 Hz train, 5ms light pulses for 4 s followed by 10 s of rest. (E) Experimental design of electrical stimulation protocol. Perforated current-clamp recording of two neurons without opsin expression in gray: 1–30 min of 10 Hz train, 5ms current pulses for 4 s followed by 10 s of rest. (F) Correlation coefficients of connected and unconnected neurons. Correlation coefficients were calculated for the first 3 min of simultaneous recording in each pair; triangles represent correlation values of pairs showed in C. Correlation coefficients of connected (n=7 pairs) vs. unconnected (n=21 pairs) showed significant differences p=0.049 by Mann Whitney; 15 mice. (G) Correlation between pairs increased after continued co-stimulation. The graph shows an increase in the correlation coefficient before and after 20–30 min of continuous optogenetic (blue) or electrical stimulation (red) (p=0.004 by Wilcoxon test; n=13 pairs, 12 mice). (H) Correlation before and after 20–30 min without stimulation (gray) (p=0.7 by Wilcoxon; n=11 pairs, 8 mice). Triangles represent synaptically connected pairs.
-
Figure 1—source data 1
Correlation coefficients of connected and unconnected neurons.
- https://cdn.elifesciences.org/articles/77470/elife-77470-fig1-data1-v2.xlsx
-
Figure 1—source data 2
Correlation coefficients of pair of neurons before and after optogenetic or electrical stimulation.
- https://cdn.elifesciences.org/articles/77470/elife-77470-fig1-data2-v2.xlsx
Figure 2
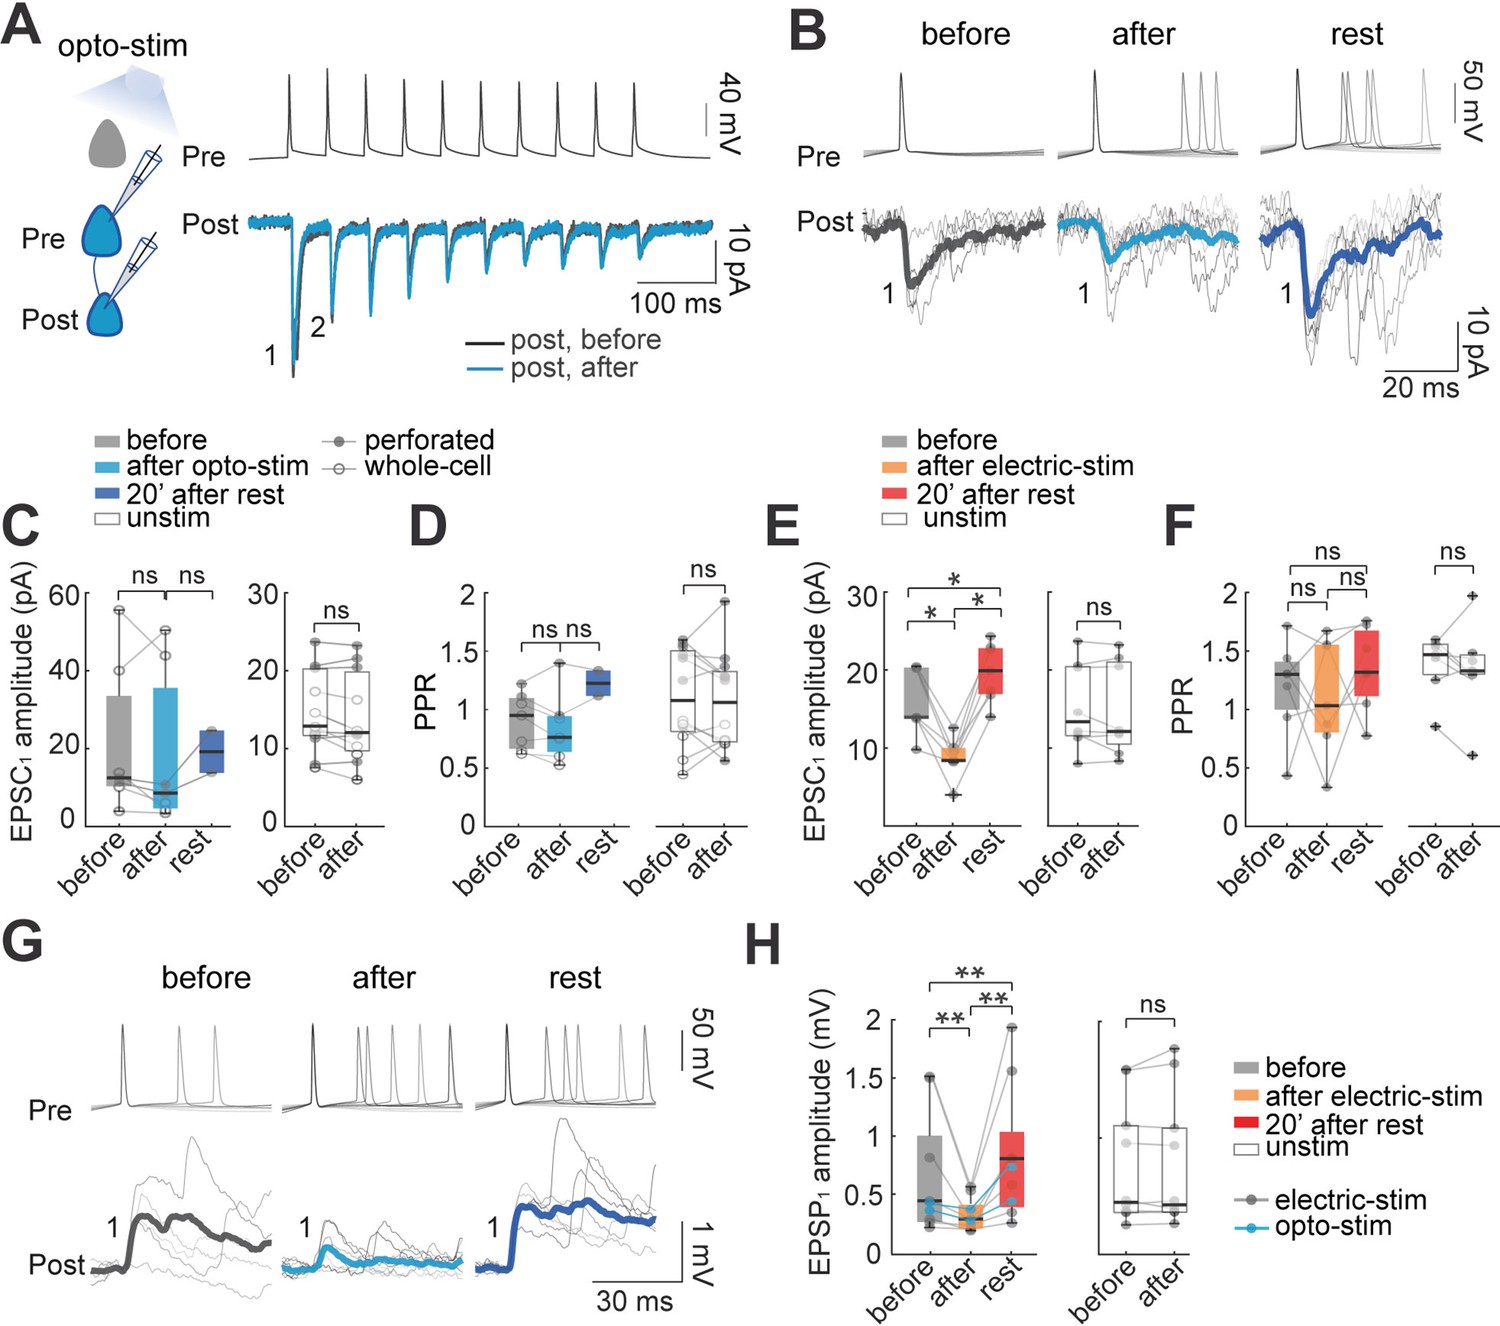
Effect of optogenetic and electrical stimulation in monosynaptic EPSCs and EPSPs.
(A) Representative paired whole-cell recording of synaptically connected neurons. Top: current-clamp recording of presynaptic action potentials in response to 10 current injections (5ms each; 20 Hz). Bottom: voltage-clamp recording of evoked EPSC before (black) and after (blue) 30 min of optogenetic stimulation. Each trace is average of 30 successive responses evoked by presynaptic current injection. (B) Representative paired recording of evoked EPSCs (perforated patch-clamp). Top: current-clamp recording of presynaptic action potentials induced by positive current steps of the I-V curve (20–120 pA). Bottom: voltage-clamp recording of evoked EPSCs before and after optogenetic stimulation and after 20 min of rest post-stimulation. Thick line is average of successive responses to the first presynaptic action potentials, for every current step of the I-V curve. (C) EPSC1 amplitudes without significant changes before and after optogenetic stimulation. Left: mean EPSC1 amplitude before and after optogenetic stimulation. Open dots correspond to whole-cell recordings, n=5; filled dots correspond to perforated patch-clamp recordings; n=2. Medians and blue box plot: p=0.2 by Wilcoxon; n=7 neurons, 5 mice. Right: Unstimulated neurons, n=7 neurons with whole-cell and n=4 neurons with perforated patch-clamp. Medians and white box plots; p=0.1 by Wilcoxon; n=11 postsynaptic neurons, 8 mice. (D) Comparison of mean Paired Pulse Ratio (PPR). Left: Mean PPRs before and after optogenetic stimulation and after 20 min post-stimulation. PPR show no significant differences between before and after, p=0.4; Wilcoxon; n=7 cells, 5 mice. Right: PPR of unstimulated neurons did not show significant differences, p=0.6 by Wilcoxon, n=11 cells, 8 mice. (E) The amplitude of evoked EPSC1 after electrical stimulation. Comparable to optogenetic stimulation, electrical stimulation protocol consisted of 30 min of 10 Hz train, 5ms current pulses for 4 s followed by 10 s of rest in two neurons simultaneously, this protocol was done in brain slices without opsin expression and using only perforated patch-clamp. Left: the average EPSC1 amplitude decreased after electrical stimulation (p=0.015 by Wilcoxon; n=7 postsynaptic neurons, 5 mice). EPSC1 amplitudes recovered with a moderate increase, after 20 min of rest post-stimulation (p=0.015), and also compared to the period before stimulation (p=0.015). Right: EPSC1 amplitude of unstimulated neurons (p=0.7 by Wilcoxon; n=8 neurons, 5 mice). (F) PPR remains unchanged: before and after electrical stimulation (p=0.7 Wilcoxon; n=8 cells, 5 mice); also, after electrical stimulation and rest post-stimulation (p=0.2); comparison before and rest post-stimulation did not show differences either (p=0.1), as well as PPR of unstimulated neurons; p=0.6 by Wilcoxon, n=12 cells, 8 mice. (G) Representative paired recording of evoked EPSPs (perforated patch-clamp). Top: current-clamp recording of presynaptic action potentials. Bottom: current-clamp recording of evoked EPSPs before, after optogenetic stimulation and, after 20 min of rest post-stimulation. Thicker lines are average of successive responses to presynaptic action potentials. (H) Comparison of mean EPSP1 amplitude after optogenetic stimulation (blue dots; n=2) and after electrical stimulation (gray dots; n=7). Left: average EPSP1 amplitude decreased after stimulation (p=0.004 by Wilcoxon; n=9 neurons, 5 mice). EPSP1 amplitudes recovered with a moderate increase after 20 min of post-stimulation (p=0.004 by Wilcoxon) and also compared to before stimulation (p=0.008 by Wilcoxon). Right: EPSP1 amplitude of unstimulated neurons (p=0.7 by Wilcoxon; n=10 postsynaptic neurons, 5 mice).
-
Figure 2—source data 1
Evoked unitary EPSC before and after optogenetic stimulation.
- https://cdn.elifesciences.org/articles/77470/elife-77470-fig2-data1-v2.xlsx
-
Figure 2—source data 2
Evoked unitary EPSC before and after electrical stimulation.
- https://cdn.elifesciences.org/articles/77470/elife-77470-fig2-data2-v2.xlsx
-
Figure 2—source data 3
Evoked unitary EPSP before and after optogenetic and electrical stimulation.
- https://cdn.elifesciences.org/articles/77470/elife-77470-fig2-data3-v2.xlsx
Figure 3
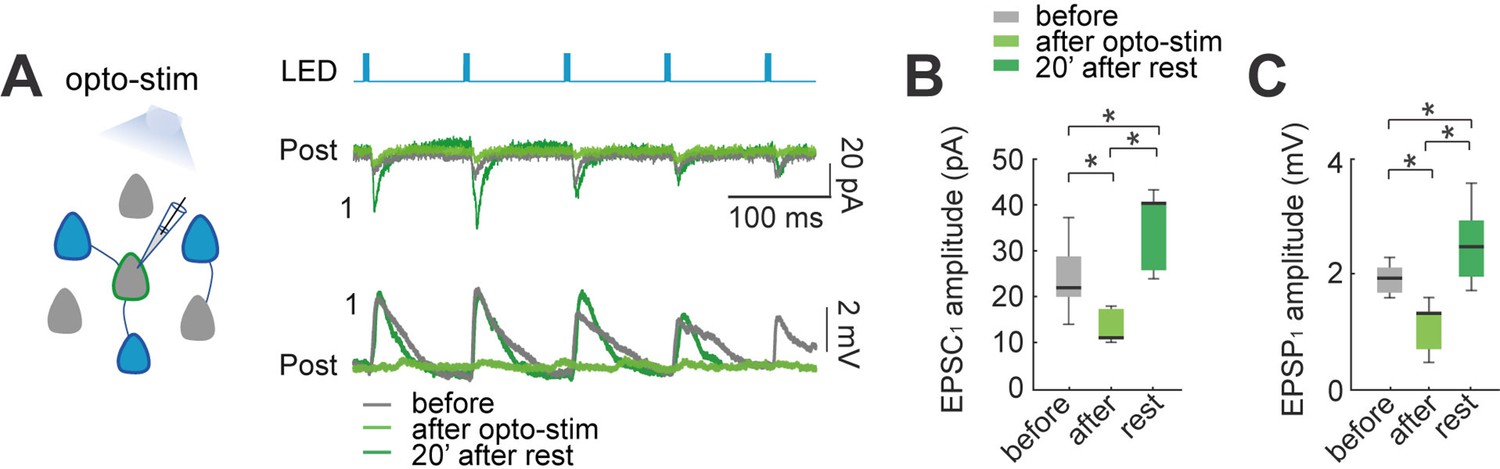
Effect of optogenetic stimulation in synaptic plasticity of the local circuit.
(A) Activation of opsin expressing neuronal population in the slice by LED pulses generates evoked EPSCs and EPSPs in non-expressing pyramidal neurons. Voltage-clamp recording (top) and current-clamp recording (bottom) of a representative non-expressing neuron. Evoked EPSCs and EPSPs before (gray); after 30 min of optogenetic stimulation (green), and 20 min post stimulation (dark green). (B) The amplitude of population light-evoked EPSC1 (left) and (C) light-evoked EPSP1 (right) decreased after 30 min of optogenetic stimulation (p=0.01 and p=0.01 respectively, by Wilcoxon; n=7 postsynaptic neurons; 7 mice), and recovered with a moderate increase after 20 min of rest (p=0.01 and p=0.01, respectively).
-
Figure 3—source data 1
Evoked local circuit EPSP and EPSC before and after optogenetic stimulation.
- https://cdn.elifesciences.org/articles/77470/elife-77470-fig3-data1-v2.xlsx
Figure 4

Optogenetic and electrical stimulation increases frequency and amplitudes of spontaneous EPSPs.
(A) Representative perforated patch-clamp recording of a neuron in current-clamp. Top: spontaneous EPSPs of a neuron before and after optogenetic stimulation. Bottom: Section of top trace shows spontaneous EPSPs amplitude >0.3 mV before (gray) and after (blue) optogenetic stimulation. Arrow shows a putative EPSP <0.3 mV below threshold (0.3 mV). (B) Frequency histogram of spontaneous EPSPs amplitudes shows that, after optogenetic stimulation, the number of events increased, as well as the number of events with higher amplitudes. (C) Frequency histogram of spontaneous EPSPs amplitudes shows that the number of events of a non-expressing pyramidal neuron remained unchanged before and after optogenetic stimulation of expressing neuronal population. (D) The number of spontaneous EPSPs increased in optogenetically stimulated neurons but not in non-expressing neurons. Left: Optogenetic stimulation of neurons: blue median and box plot; p=0.004 by Wilcoxon; 8 mice, n=10. Right: Number of spontaneous EPSPs of non-expressing pyramidal neurons before and after optogenetic stimulation protocol: green median and box plot; p=0.06 by Wilcoxon; 5 mice, n=7 (E) The amplitude of spontaneous EPSPs increased in optogenetically stimulated neurons but not in non-expressing neurons. Right: Optogenetic stimulated neurons: blue median and box plot; p=0.04 by Wilcoxon. Left: Non-expressing neurons: green median and box plot; p=0.5 by Wilcoxon. (F) The number of spontaneous EPSPs increased after electrical stimulation. Electrical stimulated neurons: red medians and box plot; p=0.0012 by Wilcoxon; 9 mice, n=13. Unstimulated neurons: white medians and box plot; p=0.4 by Wilcoxon; n=12; 9 mice. (G) The amplitude of spontaneous EPSPs increased after electrical stimulation, n=13. Electrical stimulated neurons: red median and box plot; p=0.003 by Wilcoxon. Unstimulated neurons: white medians and box plots; p=0.4 by Wilcoxon.
-
Figure 4—source data 1
Spontaneous EPSPs before and after optogenetic stimulation.
- https://cdn.elifesciences.org/articles/77470/elife-77470-fig4-data1-v2.xlsx
-
Figure 4—source data 2
Spontaneous EPSPs before and after electrical stimulation.
- https://cdn.elifesciences.org/articles/77470/elife-77470-fig4-data2-v2.xlsx
Figure 5
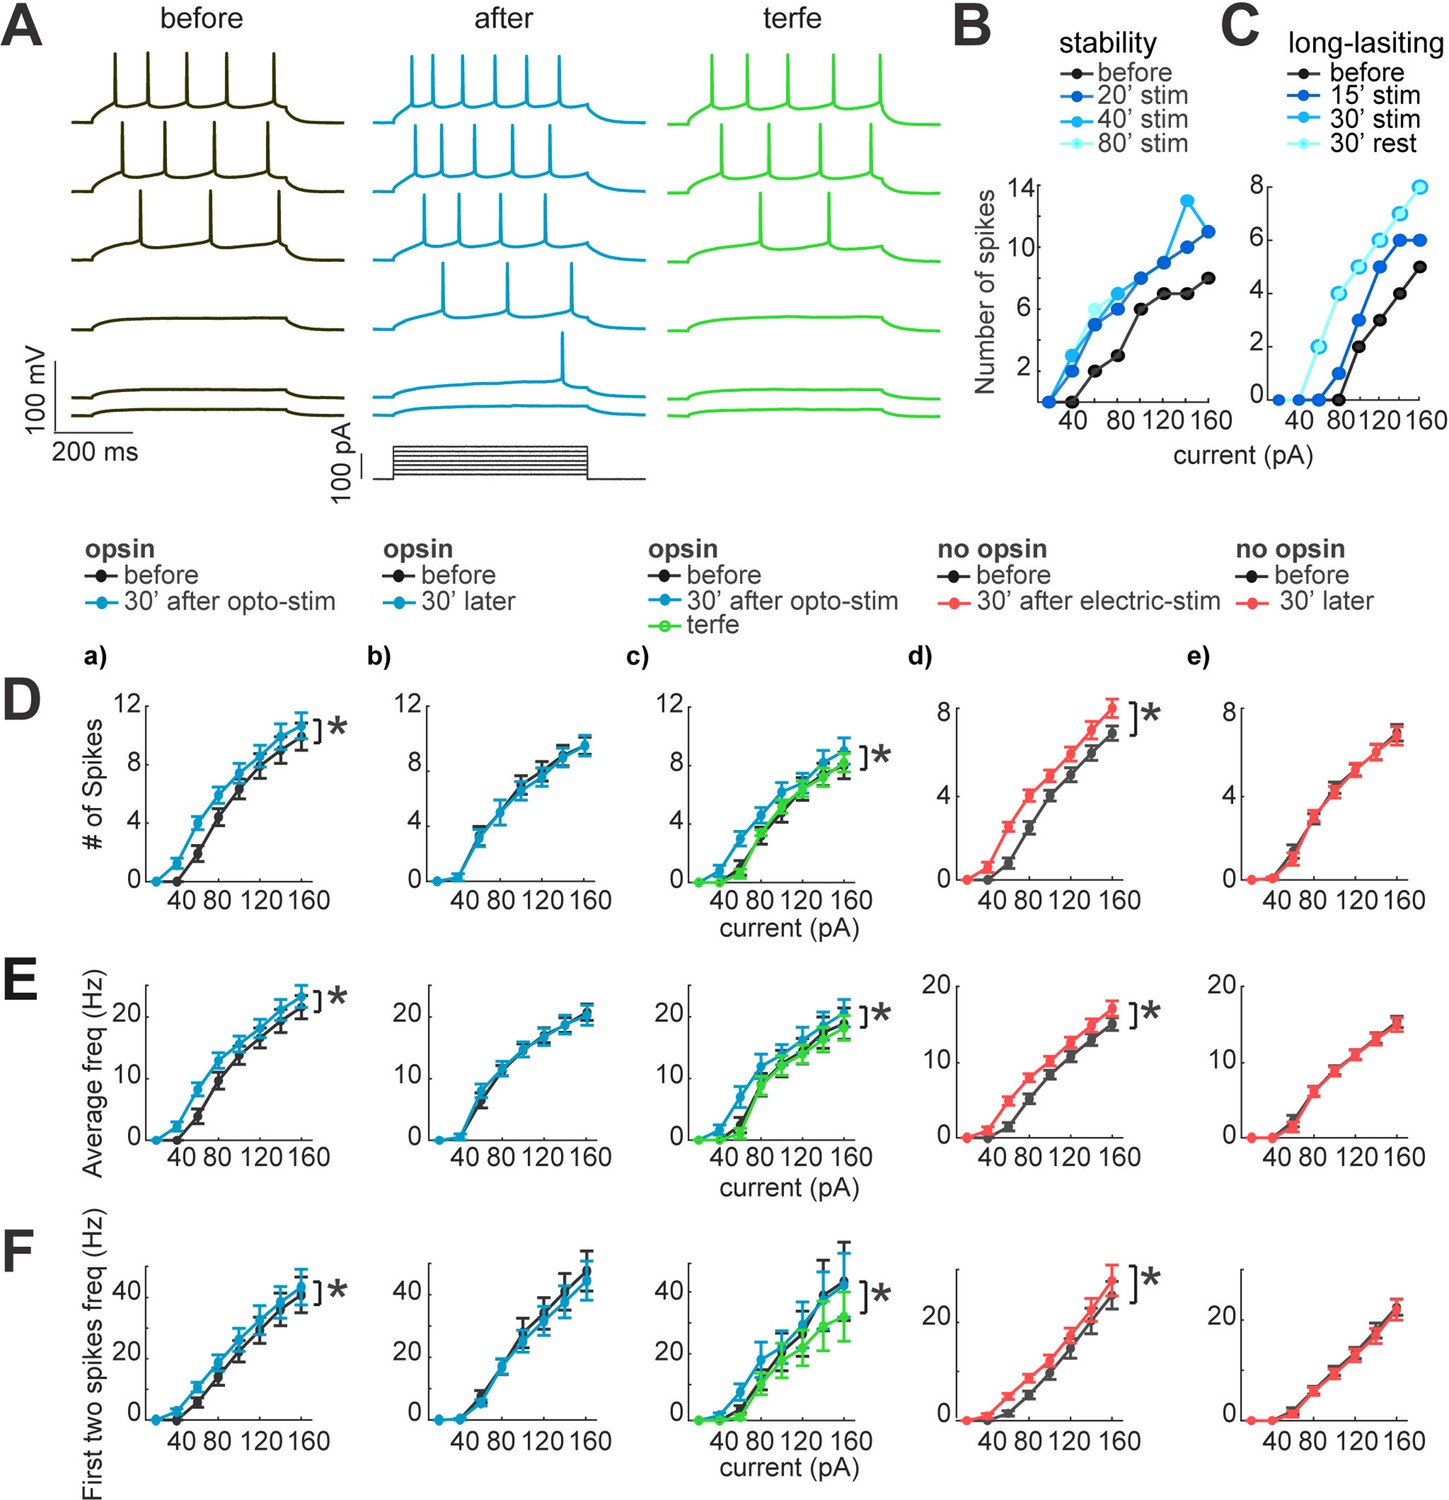
Neuronal excitability increases after optogenetic or electrical stimulation.
(A) Current dependence firing rate increases after optogenetic or electrical stimulation. Firing rate increases returns to basal conditions after the application of terfenadine. Representative membrane voltage recordings with perforated patch-clamp (top) in response to 500ms series of 20 pA current steps (20–120 pA, bottom). Black traces show membrane potential in response to current steps before stimulation. Blue traces represent membrane voltage recordings of neurons with opsin expression and responses after 30 min of optogenetic stimulation. The green traces show effect of the terfenadine (10 µM) in membrane potential post-stimulation. (B) Decrease in rheobase after stimulation is stable. Current-dependent firing rate increased in a representative neuron after 20 min of continuous optogenetic stimulation. This firing rate did not show more changes even after 80 min of continued stimulation (p=0.4 by Wilcoxon; n=7 neurons, 5 mice). (C) Decrease in rheobase after stimulation is long-lasting. Gradual increase in firing rate of a representative neuron after 15 min of optogenetic stimulation and then after 30 min. Increases in firing rate were stable 30 min post-stimulation (rest), (p=0.4 by Wilcoxon; n=7 neurons, 5 mice). (D) Neuronal activity increase after optogenetic or electrical stimulation. For every graph (a–e), thicker black lines are average spikes of all neurons before stimulation protocol. Thicker lines correspond to (a) blue, optogenetic stimulation; (b) blue, 30 min without stimulation in neurons with opsin expression; (c) green, terfenadine (10 µM) effect after optogenetic stimulation; (d) red, electrical stimulation in neurons without opsin expression; (e) red, 30 min without stimulation in neurons without opsin expression. Data represent mean ± SEM. *p<0.05 by Wilcoxon. (E) Same as D but for average frequency for each current step. *p<0.05 by Wilcoxon. (F) The frequency of the first two action potentials increased for the lower current steps after stimulation. Same as D but for the average of the first two action potentials frequency. *p<0.05 by Wilcoxon.
-
Figure 5—source data 1
Neuronal excitability increases after optogenetic or electrical stimulation.
- https://cdn.elifesciences.org/articles/77470/elife-77470-fig5-data1-v2.xlsx
Figure 6
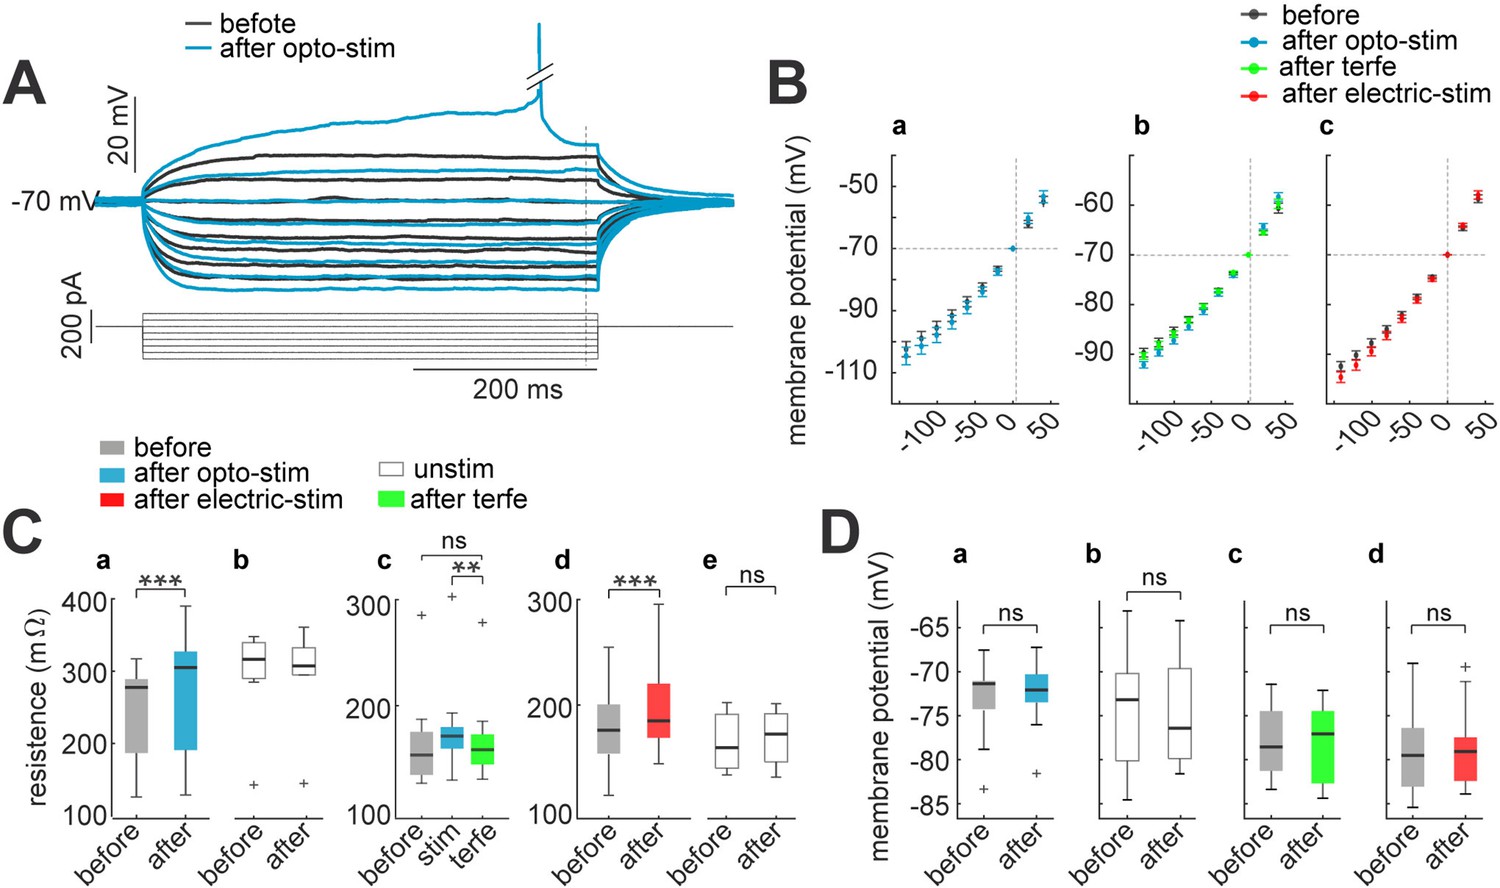
Membrane input resistance increases after optogenetic or electrical stimulation.
(A) Membrane resistance increases after optogenetic or electrical stimulation; these returns to control condition after terfenadine application. Representative membrane voltage recordings with perforated patch-clamp in response 500ms series of 20 pA current pulses from 40 to –100 pA (bottom). Black traces show membrane potential before optogenetic stimulation, and blue traces correspond to 30 min after (B) I-V plots show relation between current injection and membrane potential. For every graph (a–c), black dots are average voltage membrane response to current steps before stimulation protocol. Blue average voltage membrane corresponds to (a) optogenetic stimulation; (b) green, effect of terfenadine (10 µM) after optogenetic stimulation; (c) red, electrical stimulation in neurons without opsin expression. Data represent mean ± SEM. (C) Membrane resistance increased after optogenetic or electrical stimulation. (a) Optogenetic stimulated neurons: median and blue box plot; p=0.0001 by Wilcoxon; n=10 neurons, 9 mice. (b) Unstimulated neurons with opsin expression: median and gray box plots; p=0.7 by Wilcoxon, n=13 neurons, 5 mice. (c) Terfenadine (10 µM) effect after optogenetic stimulation: median and green box plot; p=0.003 by Wilcoxon; n=8 neurons, 5 mice. (d) Electrical stimulated neurons: median and red box plot; p=0.00004 by Wilcoxon; n=22 neurons, 15 mice. (e) Unstimulated neurons without opsin expression: median and gray box plot; p=0.5 by Wilcoxon; n=11 neurons, 8 mice. (D) Resting membrane potential remain without changes after stimulation. (a) Optogenetic stimulated neurons: median and blue box plot; p=0.4 by Wilcoxon; n=10 neurons. (b) Unstimulated neurons: median and gray box plots; p=0.8 by Wilcoxon; n=13 neurons. (c) Terfenadine (10 µM) effect after stimulation: median and green box plot; p=0.8 by Wilcoxon; n=9 neurons. (d) Electrical stimulated neurons: median and red box plot; p=0.9 by Wilcoxon; n=13.
-
Figure 6—source data 1
Membrane voltage responses to current injections, before and after optogenetic or electrical stimulation.
- https://cdn.elifesciences.org/articles/77470/elife-77470-fig6-data1-v2.xlsx
-
Figure 6—source data 2
Input resistance before and after optogenetic or electrical stimulation.
- https://cdn.elifesciences.org/articles/77470/elife-77470-fig6-data2-v2.xlsx
-
Figure 6—source data 3
Resting membrane potential before and after optogenetic or electrical stimulation.
- https://cdn.elifesciences.org/articles/77470/elife-77470-fig6-data3-v2.xlsx
Figure 7
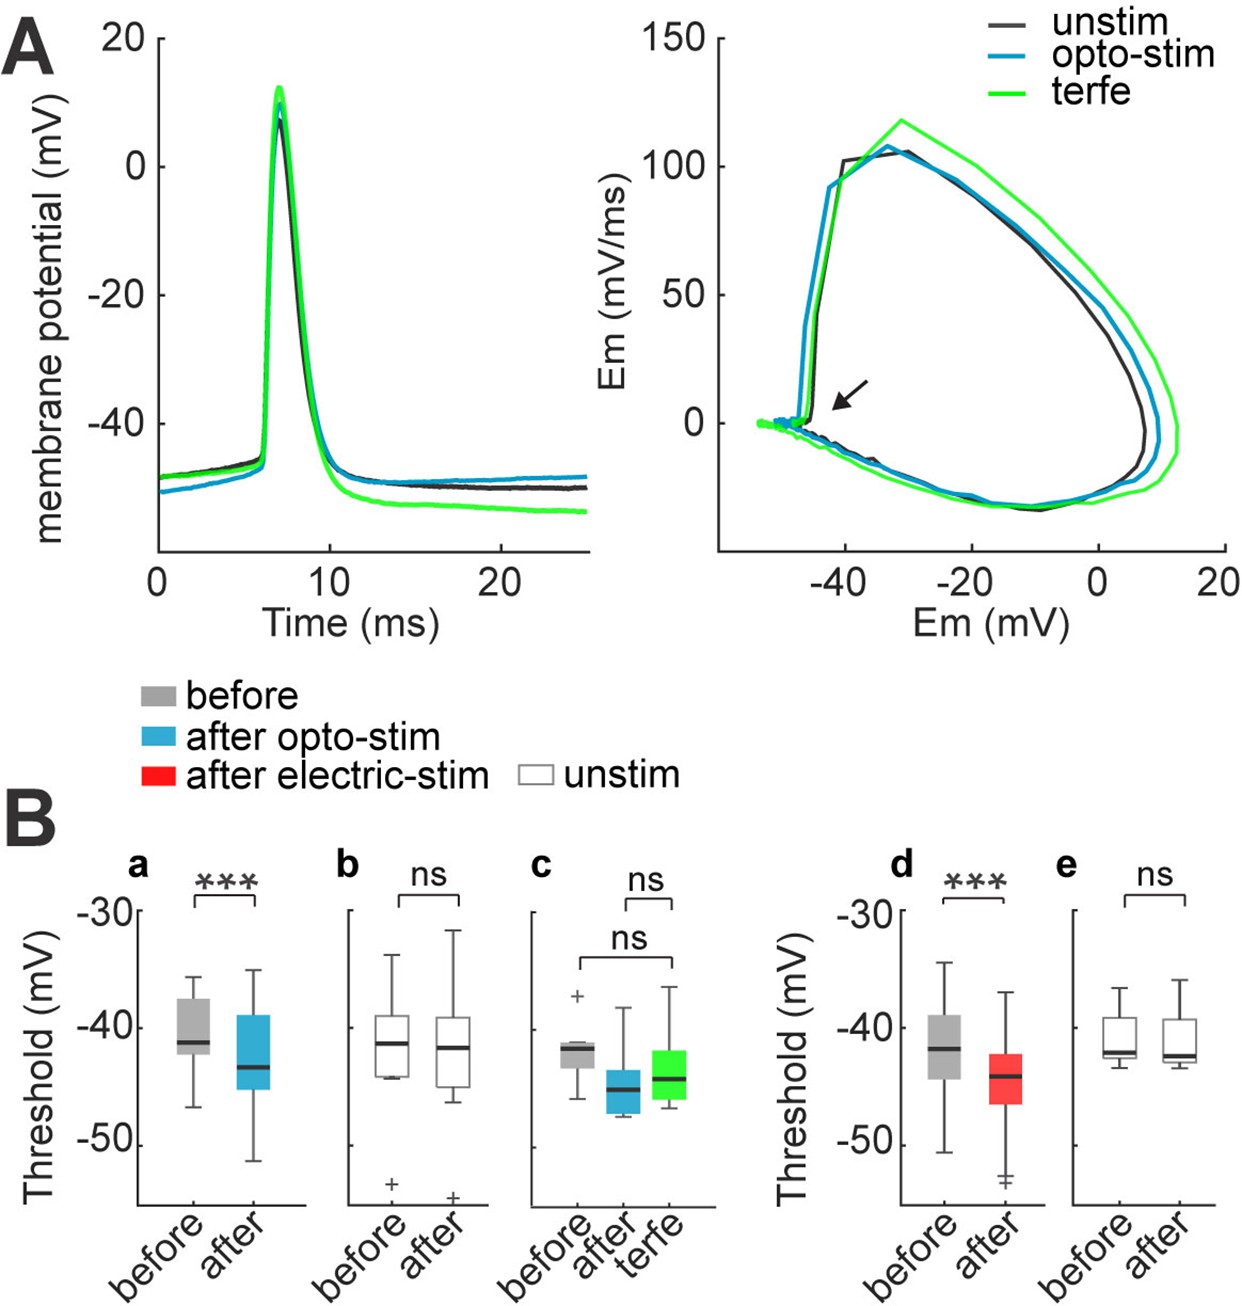
Spike threshold decreases after optogenetic and electrical stimulation.
(A) Firing threshold shifts to more negative potentials after optogenetic and electrical stimulation. Left: firing threshold was measured as the first action potential generated with 60 pA current step: before (black), after 30 min of optogenetic stimulation (blue) and terfenadine post-stimulation (green). Right: phase plot of action potentials: before (black), after (blue), and terfenadine (green). The arrow shows firing threshold. (B) Firing threshold was measured for every cell before and after: (a) optogenetic stimulation, median and blue box plot (p=0.0009 by Wilcoxon, n=13 cells, 9 mice); (b) Unstimulated neurons with opsin expression, median and gray box plots (p=0.7 by Wilcoxon; n=8 cells, 5 mice). (c) Terfenadine (10 µM) post-stimulation, median and green box plot; p=0.003 by Wilcoxon; n=8 neurons, 5 mice; firing threshold before stimulation and after terfenadine (p=0.1 by Wilcoxon); (d) electrical stimulation, median and red box plot (p=0.00004 by Wilcoxon; n=22 cells, 15 mice). (e) Unstimulated neurons without opsin, median and gray box plot (p=0.7 by Wilcoxon; n=11 cells, 8 mice).
-
Figure 7—source data 1
Firing threshold before and after optogenetic or electrical stimulation.
- https://cdn.elifesciences.org/articles/77470/elife-77470-fig7-data1-v2.xlsx
Figure 8
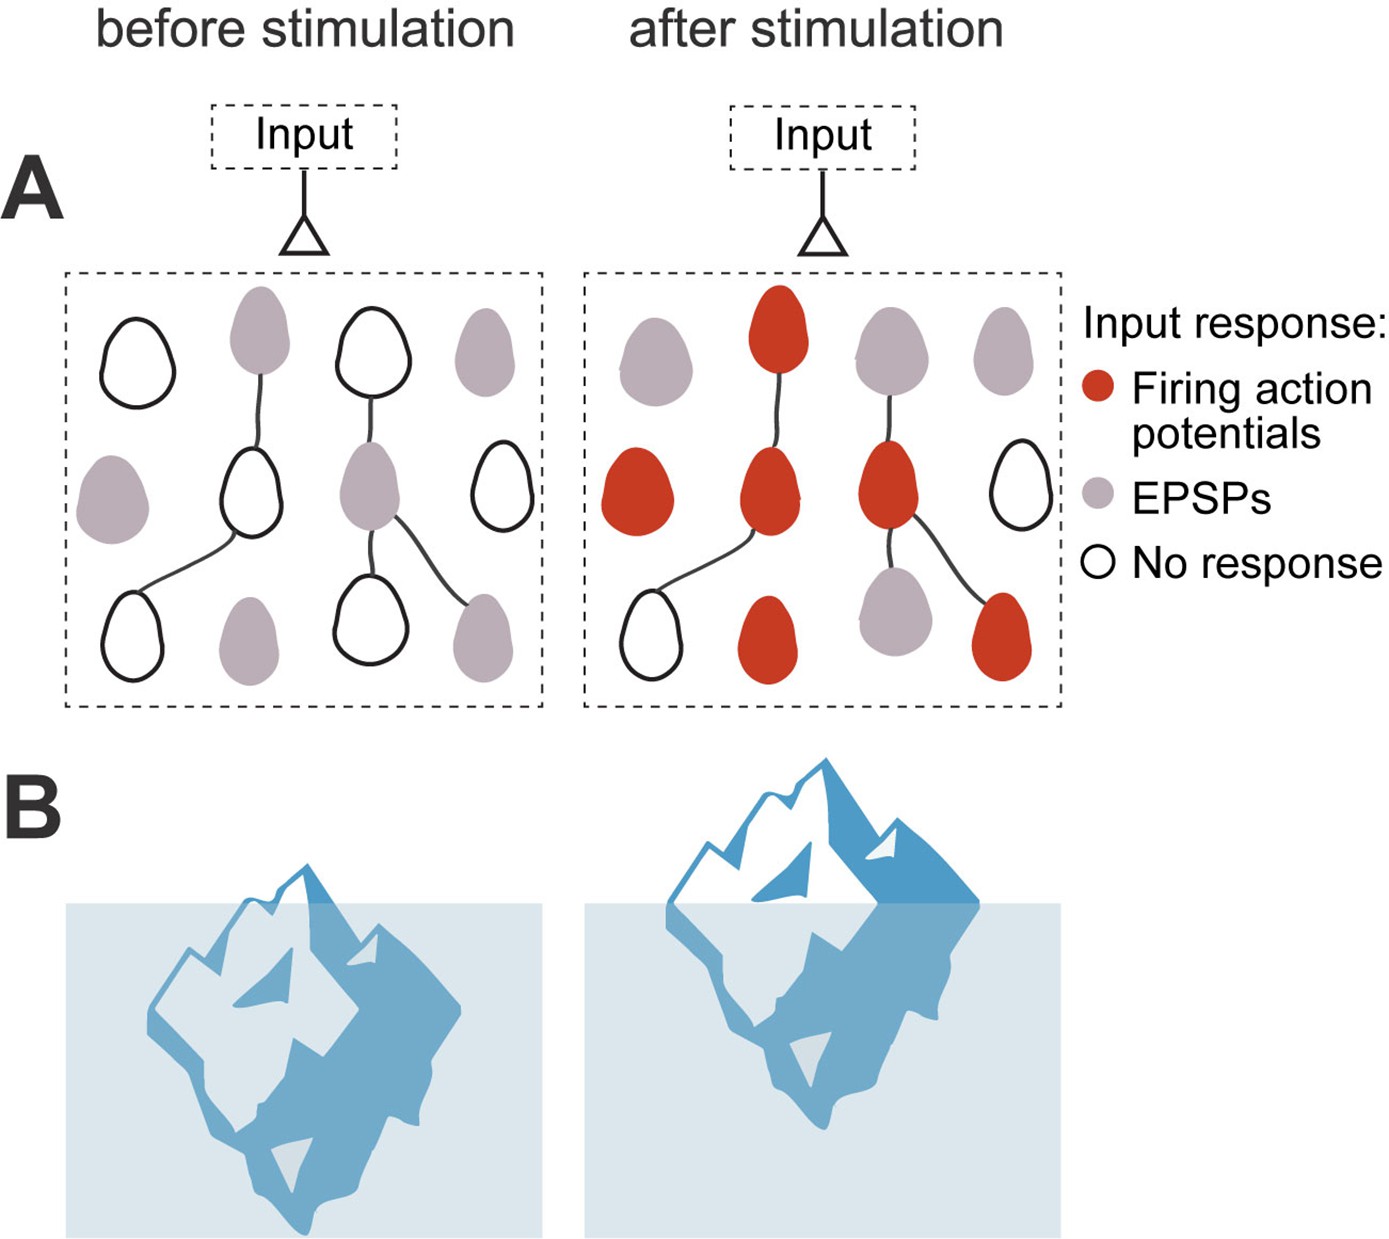
Iceberg model of ensemble formation.
(A) Emergence of ensembles after increases in neuronal excitability. Neurons shift to a more excitable state after stimulation, so neuronal responses are amplified and the circuit now responds to an external input by activating a neuronal ensemble. Color corresponds to membrane potential response to a synaptic input: white is resting membrane potentials, gray are subthreshold responses, and red are suprathreshold ones, with firing of action potentials. Stimulated neurons become more excitable, so the same inputs induce some of them to fire (red cells), while other cells have increased subthreshold responses (gray cells). The model explains how an ensemble is formed but does not assume any changes in numbers of strength of local synapses. (B) Left: Iceberg emergence: An iceberg keeps underwater. Right: But if its weight decreases, the iceberg emerges above water. Weight (or density) is an intrinsic property of the iceberg and, by changing it, the iceberg changes its response to the same environment. Likewise, for a neuronal ensemble, membrane resistance and firing threshold are intrinsic neuronal properties that can be modified, and they enhance its response to the same excitatory input intensity, resulting in an increased depolarization and generation of action potentials.
Additional files
Download links
A two-part list of links to download the article, or parts of the article, in various formats.
Downloads (link to download the article as PDF)
Open citations (links to open the citations from this article in various online reference manager services)
Cite this article (links to download the citations from this article in formats compatible with various reference manager tools)
Intrinsic excitability mechanisms of neuronal ensemble formation
eLife 11:e77470.
https://doi.org/10.7554/eLife.77470


