Native American genetic ancestry and pigmentation allele contributions to skin color in a Caribbean population
- Department of Pathology, Penn State College of Medicine, United States
- Jake Gittlen Laboratories for Cancer Research, Penn State College of Medicine, United States
- Department of Family & Community Medicine, Penn State College of Medicine, United States
- Department of Biochemistry and Molecular Biology, Penn State College of Medicine, United States
- Department of Pharmacology, Penn State College of Medicine, United States
- Institute of Personalized Medicine, Penn State College of Medicine, United States
- Department of Public Health Sciences, Penn State College of Medicine, United States
- Salybia Mission Project, Dominica
Figures
Figure 1 with 3 supplements
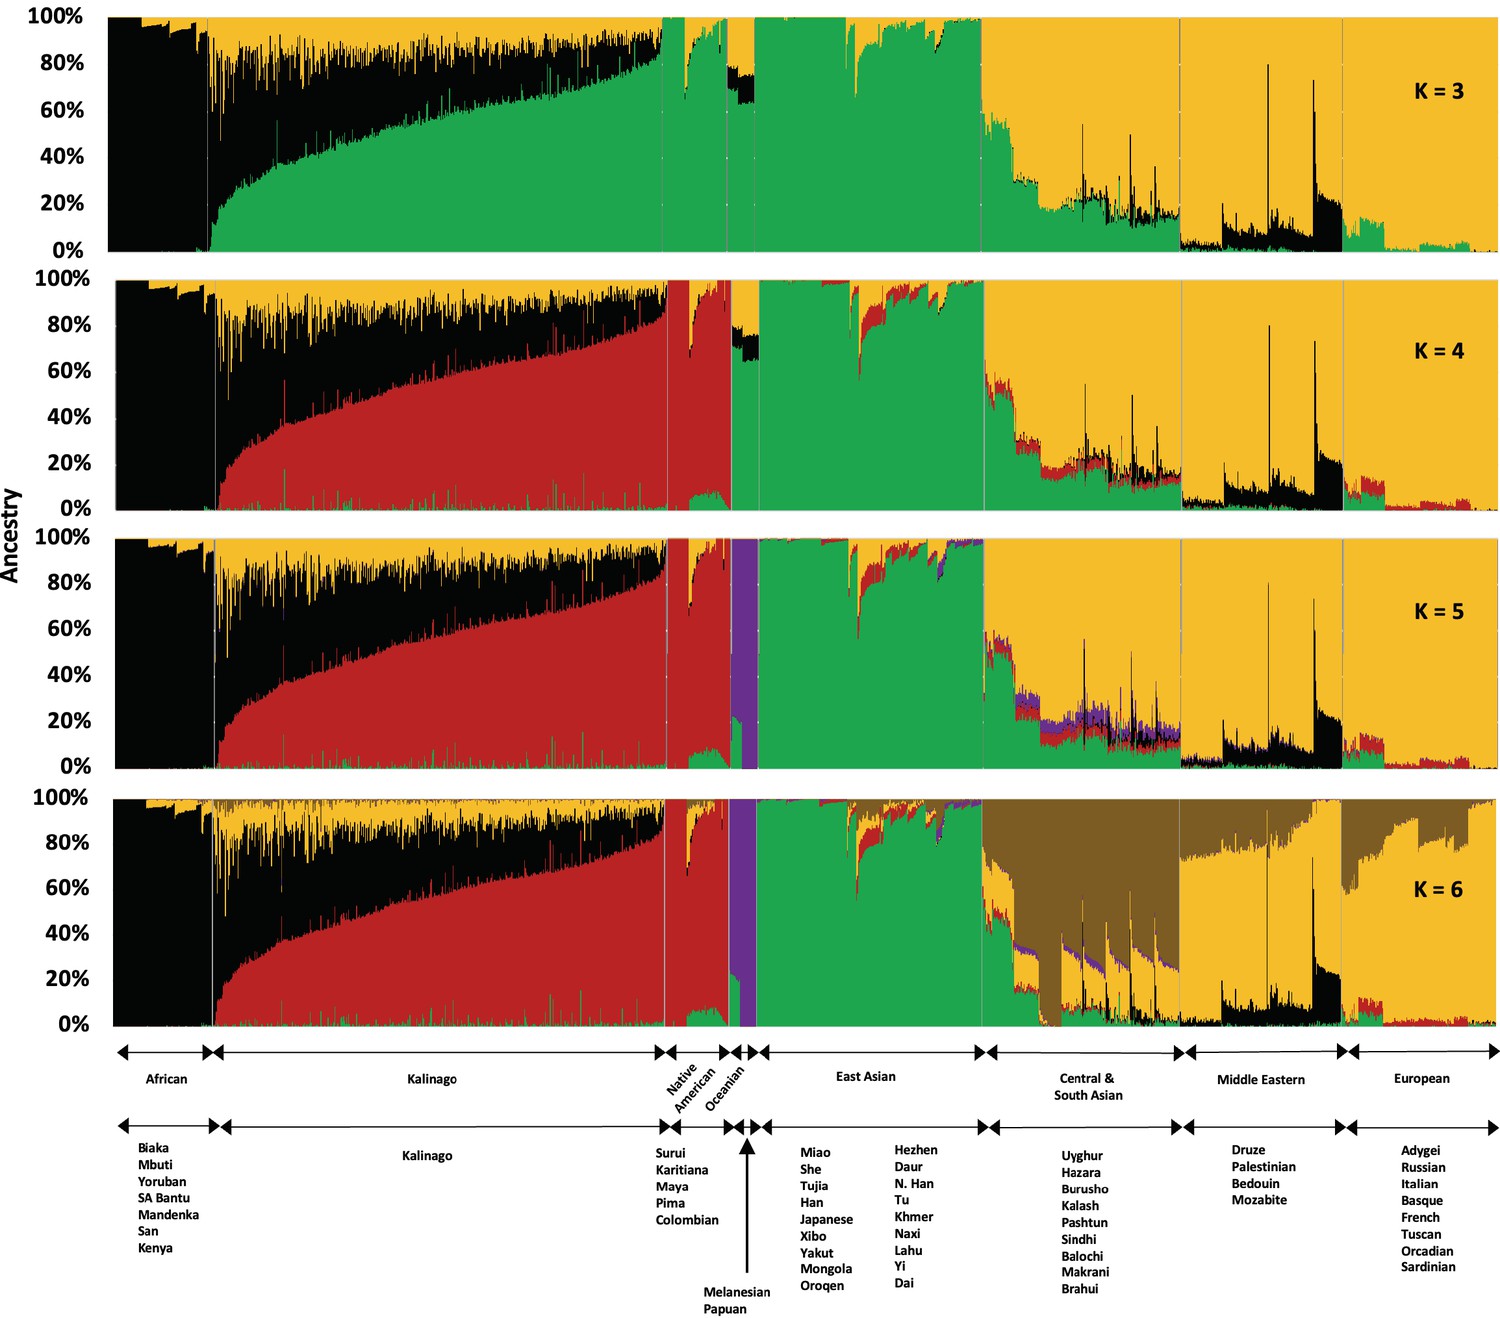
Admixture analysis of Kalinago compared with Human Genome Diversity Project populations.
Results are depicted using stacked bar plots, with one column per individual. At K=3, the Kalinago, Native Americans, Oceanians, and East Asians fall into the same green cluster. At K=4, the Native Americans (red cluster) are separated from the East Asians (green cluster). Figure 1—figure supplement 1 shows the expanded admixture plot for K=6 with each populations labeled. Figure 1—figure supplement 2 shows the location of Kalinago Territory where fieldwork was performed.
-
Figure 1—source data 1
The source data contains results from Admixture analysis.
- https://cdn.elifesciences.org/articles/77514/elife-77514-fig1-data1-v3.xlsx
Figure 1—figure supplement 1
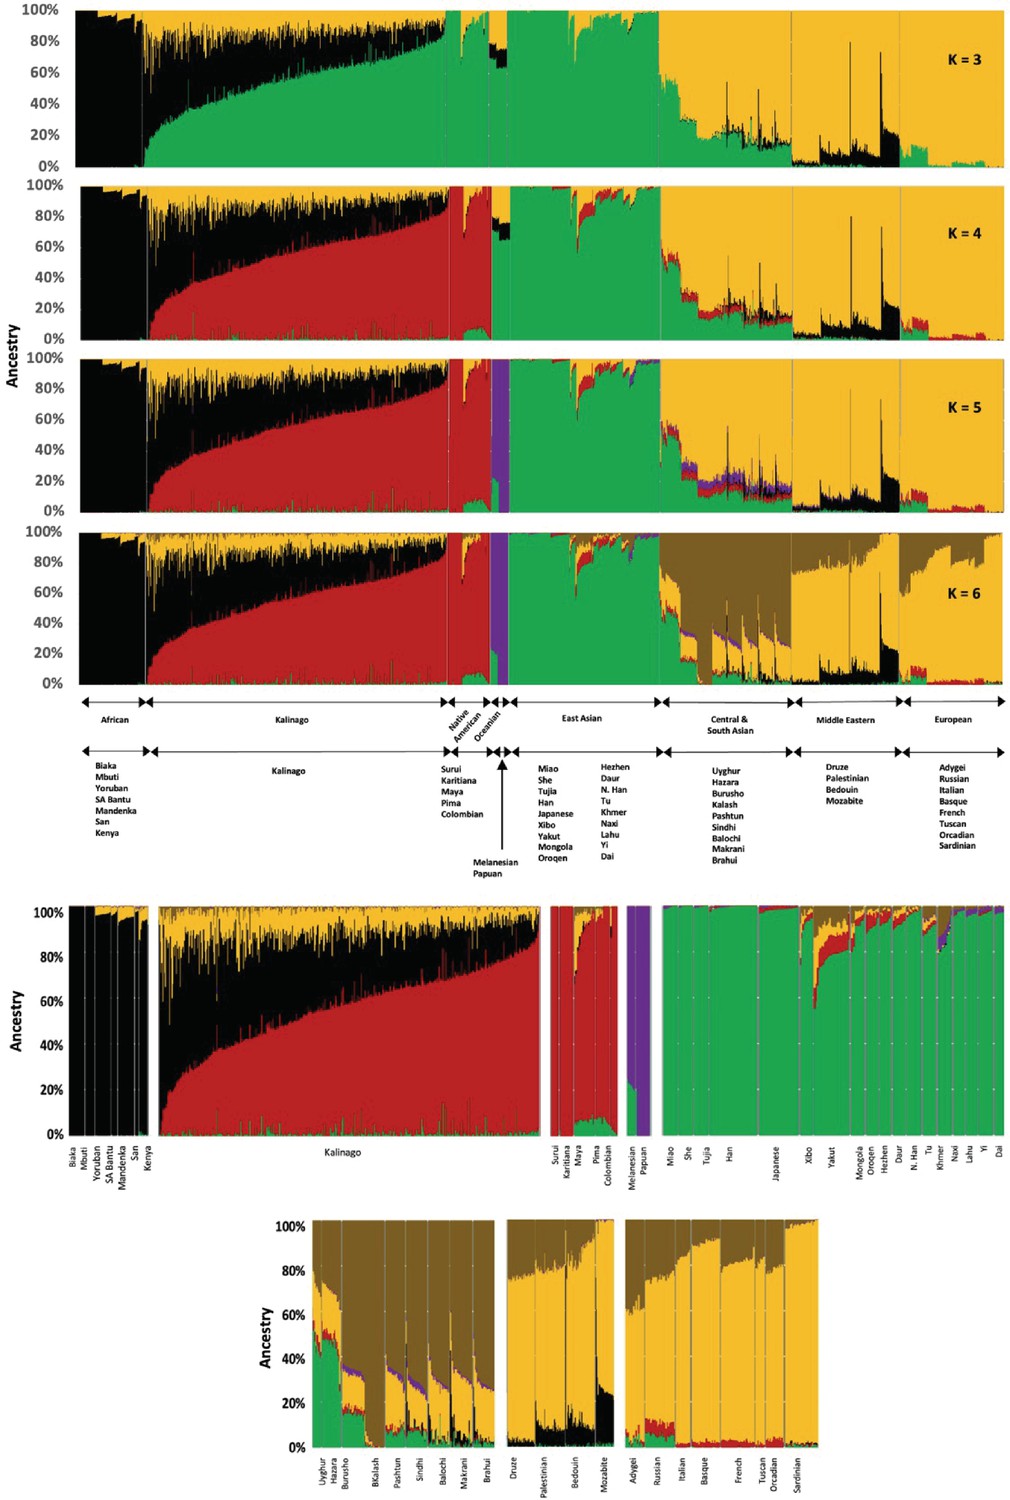
Admixture plot of Kalinago compared to Human Genome Diversity Project data from K=3 to K=6.
Expended admixture plot at K=6 labeled each of the populations used, from panels (A) to (F).
Figure 1—figure supplement 2
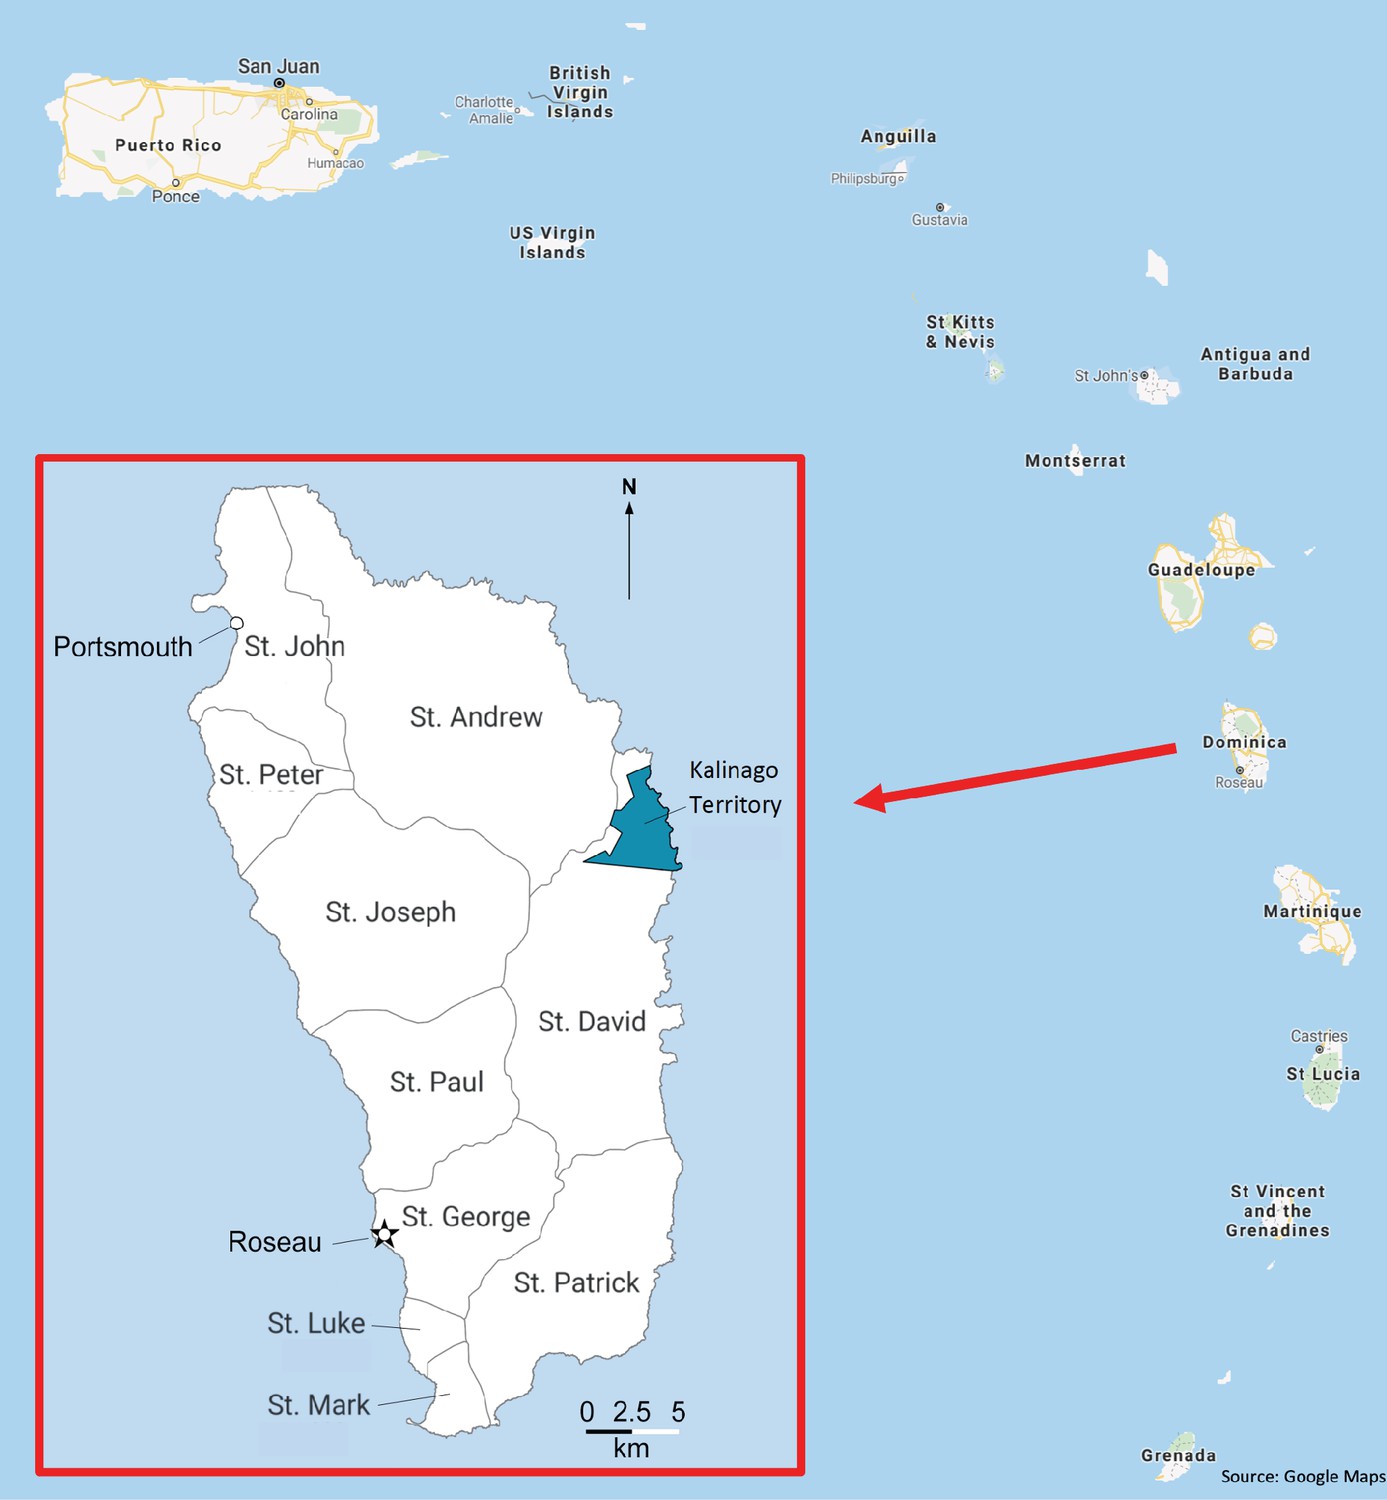
Map showing the location of Kalinago Territory in the Commonwealth of Dominica.
Dominica, also known as Wai’tu kubuli in the Kalinago language, is clustered with the Leeward Islands in the Lesser Antilles archipelago of the Caribbean Sea. Main map situates Dominica within the Eastern Caribbean. Inset shows Dominica, with location of Kalinago Reservation (blue) in relation to parishes and principal towns. (Map modified from SESA CROP Report and Google Maps.)
Figure 1—figure supplement 3
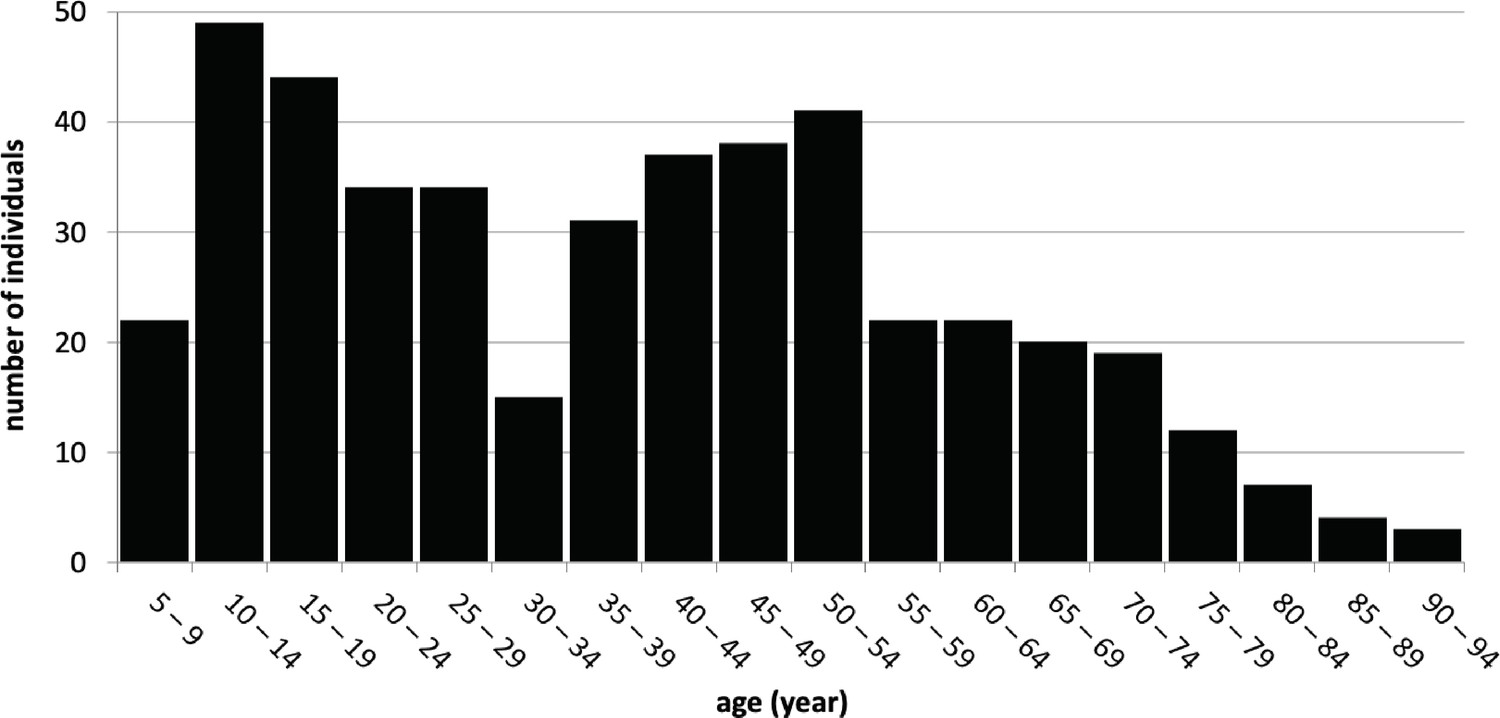
Age distribution of sampled Kalinago individuals.
Histogram shows age in years at last birthday for all sampled individuals for whom this information was collected (n=455).
Figure 2 with 2 supplements
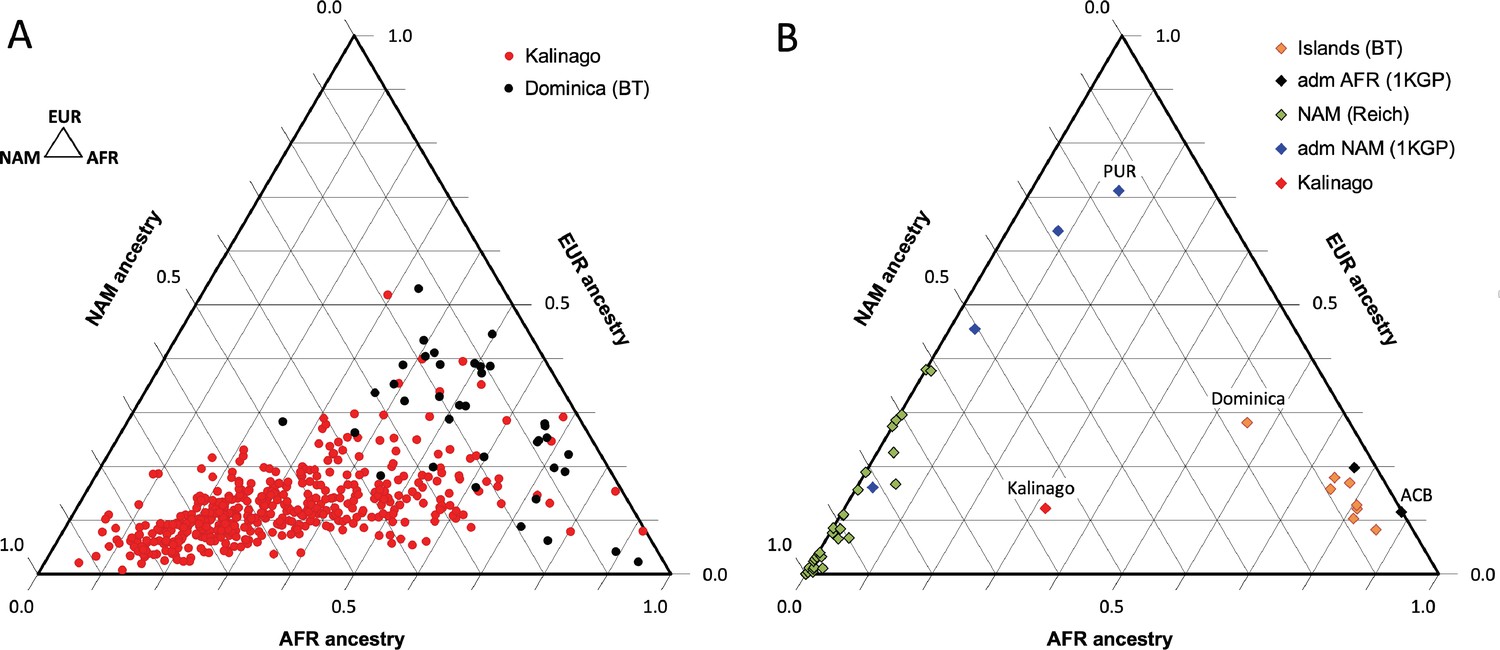
Comparison of Kalinago genetic ancestry with that of other populations in the Western Hemisphere.
Ternary plots of genetic ancestry from our work and the literature show estimated proportions of African (AFR), European (EUR), and Native American (NAM) genetic ancestry. (A) Comparison of individuals (n=452, omitting 6 individuals with EAS >0.1) genotyped in this study to individuals (n=38) from southern Dominica sampled by Benn Torres et al., 2013. (B) Comparison of the Kalinago average genetic ancestry with other Native American populations. Kalinago, this study (n=458); Islands (BT) indicates Caribbean islanders reported in Benn Torres et al., 2013, with Dominica labeled; admixed (adm) AFR (1000 Genomes Project [1KGP]) and admixed NAM (1KGP) represent admixed populations from Auton et al., 2015, with Caribbean samples PUR (Puerto Rico) and ACB (Barbados) labeled; and AMR (Reich) indicates mainland Native American samples reported in Reich et al., 2012. Inset (top left) shows ancestries at vertices.
-
Figure 2—source data 1
Source data contains result from PCA analysis for Kalinago versus other Native American populations in the Western Hemisphere.
- https://cdn.elifesciences.org/articles/77514/elife-77514-fig2-data1-v3.xlsx
Figure 2—figure supplement 1
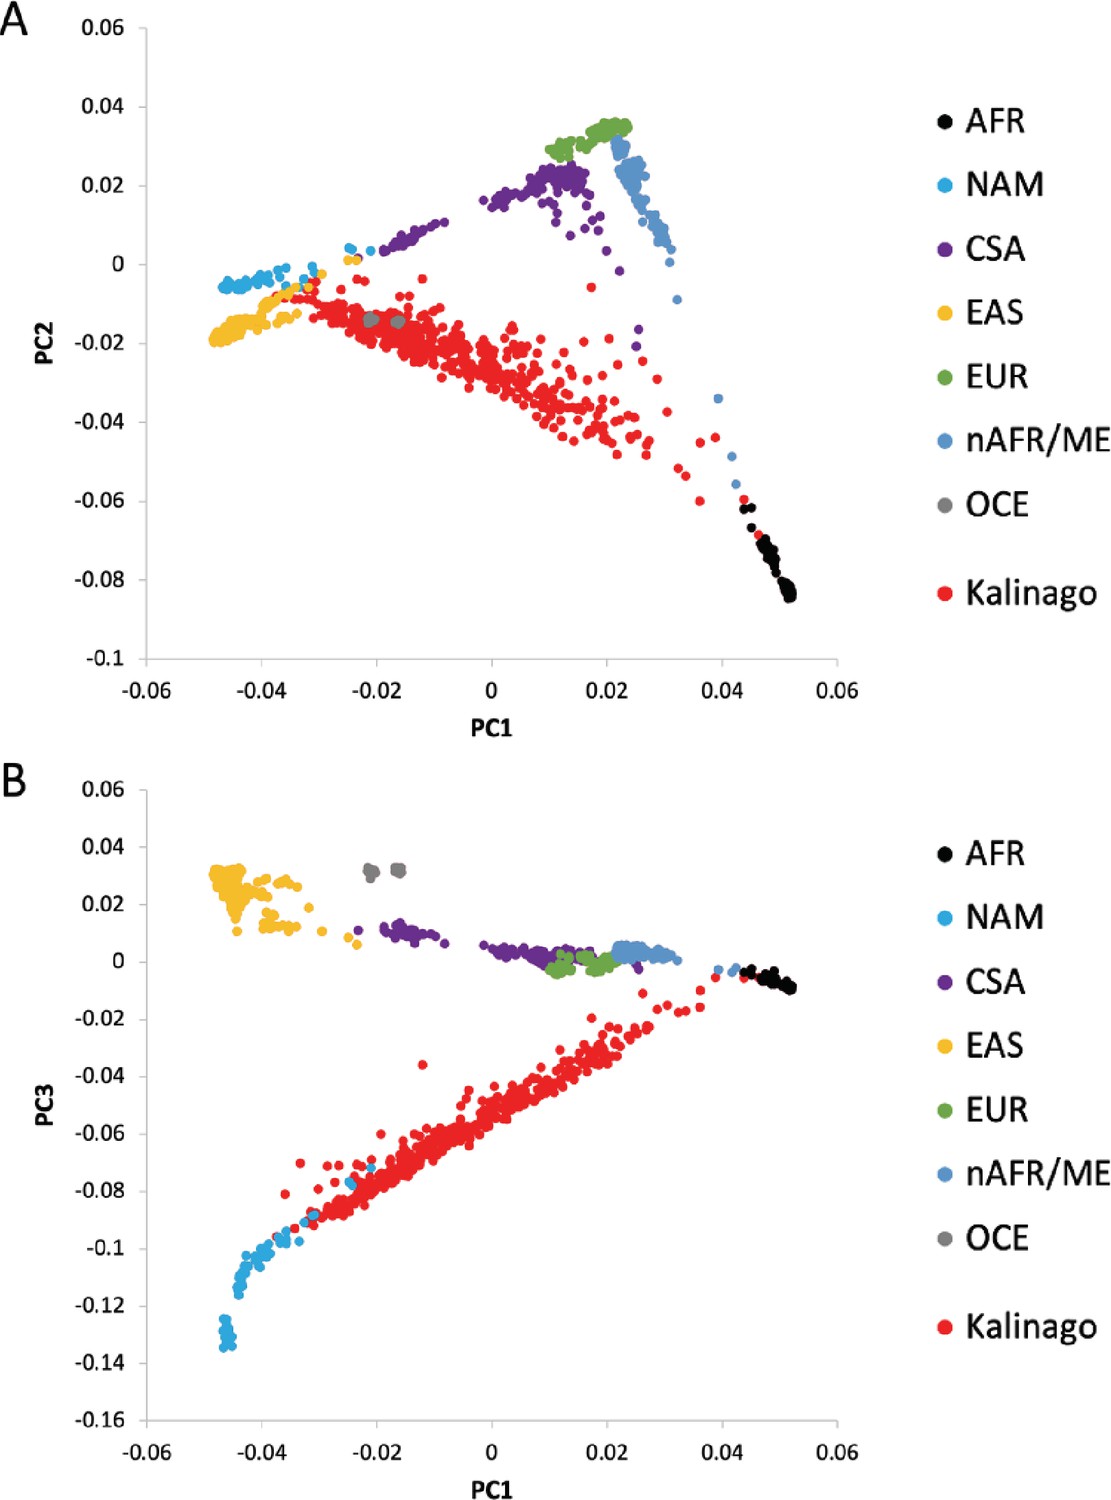
Principal components (PCs) analysis (PCA) of Kalinago and comparison populations.
PCA was performed on HGDP sample (940 individuals), with 458 Kalinago individuals projected on the same axes. (A) PC1 and PC2; (B) PC1 and PC3. In both panels, HGDP individuals are colored to indicate cluster membership (AFR, African; nAFR/ME, Northern Africa and Middle East; EUR, Europe; CSA, Central and Southern Asia; EAS, East Asia; OCE, Oceania; NAM, Native American). Genetic ancestry was represented by the first 10 PCs because AFR and NAM ancestries are not independent of each other. The first PC correlated strongly with AFR or NAM genetic ancestry (r2=0.94 and 0.97, respectively), but also with EUR genetic ancestry (r2=0.32). Several other PCs displayed considerably lower levels of correlation with genetic ancestry (r2<0.1 for EUR and r2<0.05 for EAS). Individuals homozygous for the albino variant were excluded from association analyses. Association analysis did not reveal any novel variants that reached genome-wide significance, after correction for statistic inflation. The inflation factor (lambda) for the full genotyped sample excluding the albinos (n=444) sample was 1.349. Values of lambda for the nine N=50 subsets ranged from 1.001 to 1.184 (median 1.075), suggesting that the elimination of second-order relatives did not remove all effects of relatedness.
Figure 2—figure supplement 2

Genetic ancestry distribution as function of community-defined ancestry.
Individual genetic ancestry fraction was estimated using admixture (K=4) as described. Individuals identified as (A) ‘Kalinago’ (n=72) have higher NAM and lower AFR and EUR genetic ancestry than those identified as (B) ‘Mixed’ (n=36). Despite considerable overlap in genetic ancestry proportions between individuals, the distributions are distinctly different. Compared to individuals identified as ‘Mixed,’ those identified as ‘Kalinago’ have on average more Native American genetic ancestry (67% vs 51%), less European genetic ancestry (10% vs 14%), and less African genetic ancestry (23% vs 34%). Similarly, the phenotypic distributions of the two groups differed.
Figure 3
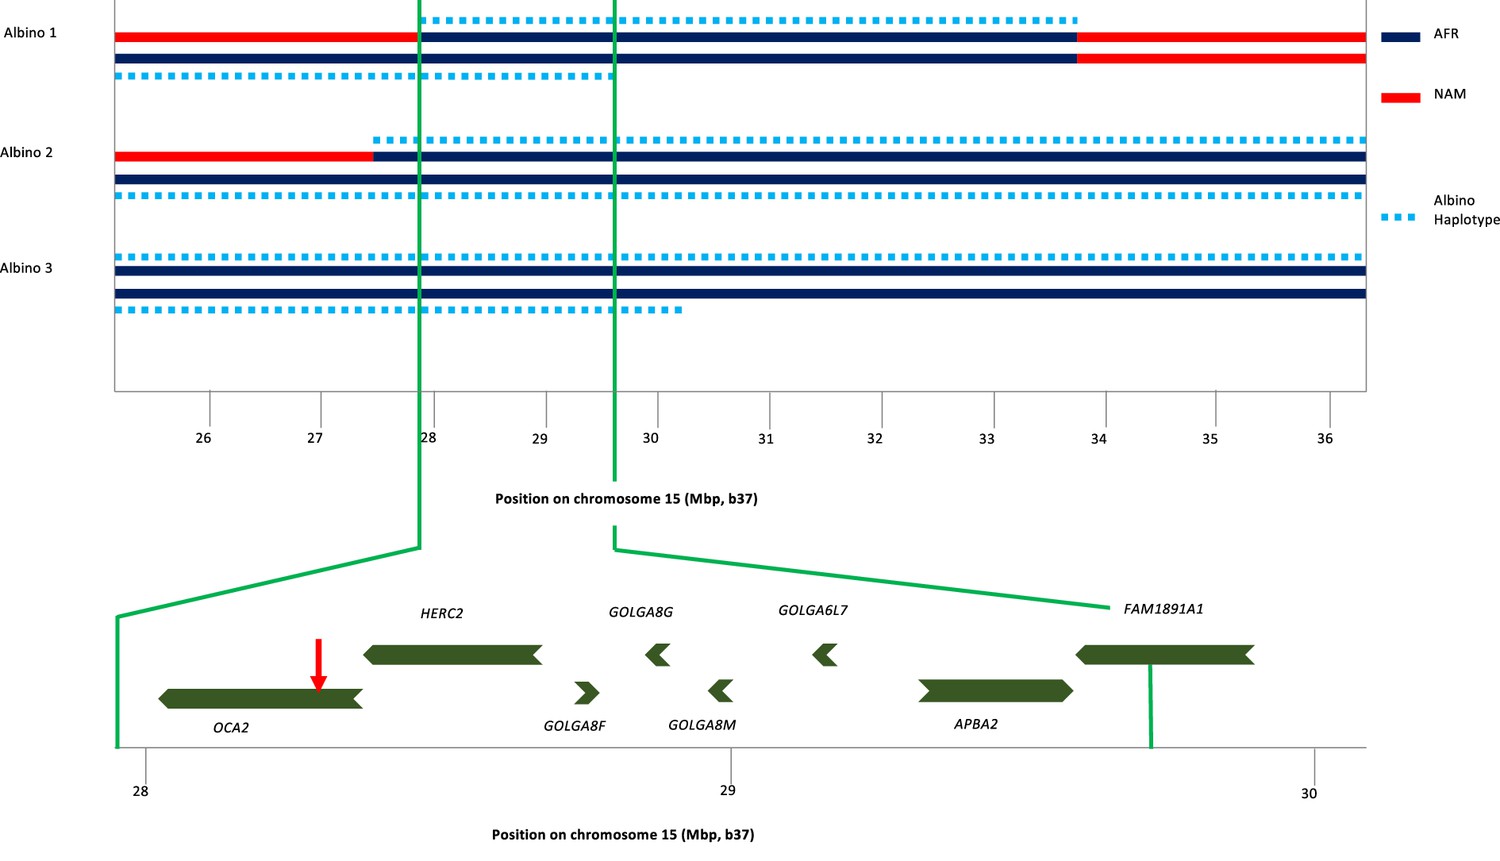
Haplotype analysis for three albino individuals.
The inner two lines indicate NAM (red) or AFR (dark blue) genetic ancestry; no EUR genetic ancestry was found in this genomic region. For this local genetic ancestry analysis, the region shown here consisted of 110 non-overlapping segments with 7–346 SNPs each (mean 65). The deduced extent of shared albino haplotype (dotted light blue lines) is indicated on each chromosome. The common region of overlap indicated by the minimum homozygous region (determined by albino individual 1) shared by all three albino individuals is shown at expanded scale below. Genes in this region are labeled, and the position of the NW273KV polymorphism in OCA2 is indicated by the red arrowhead.
Figure 4 with 2 supplements
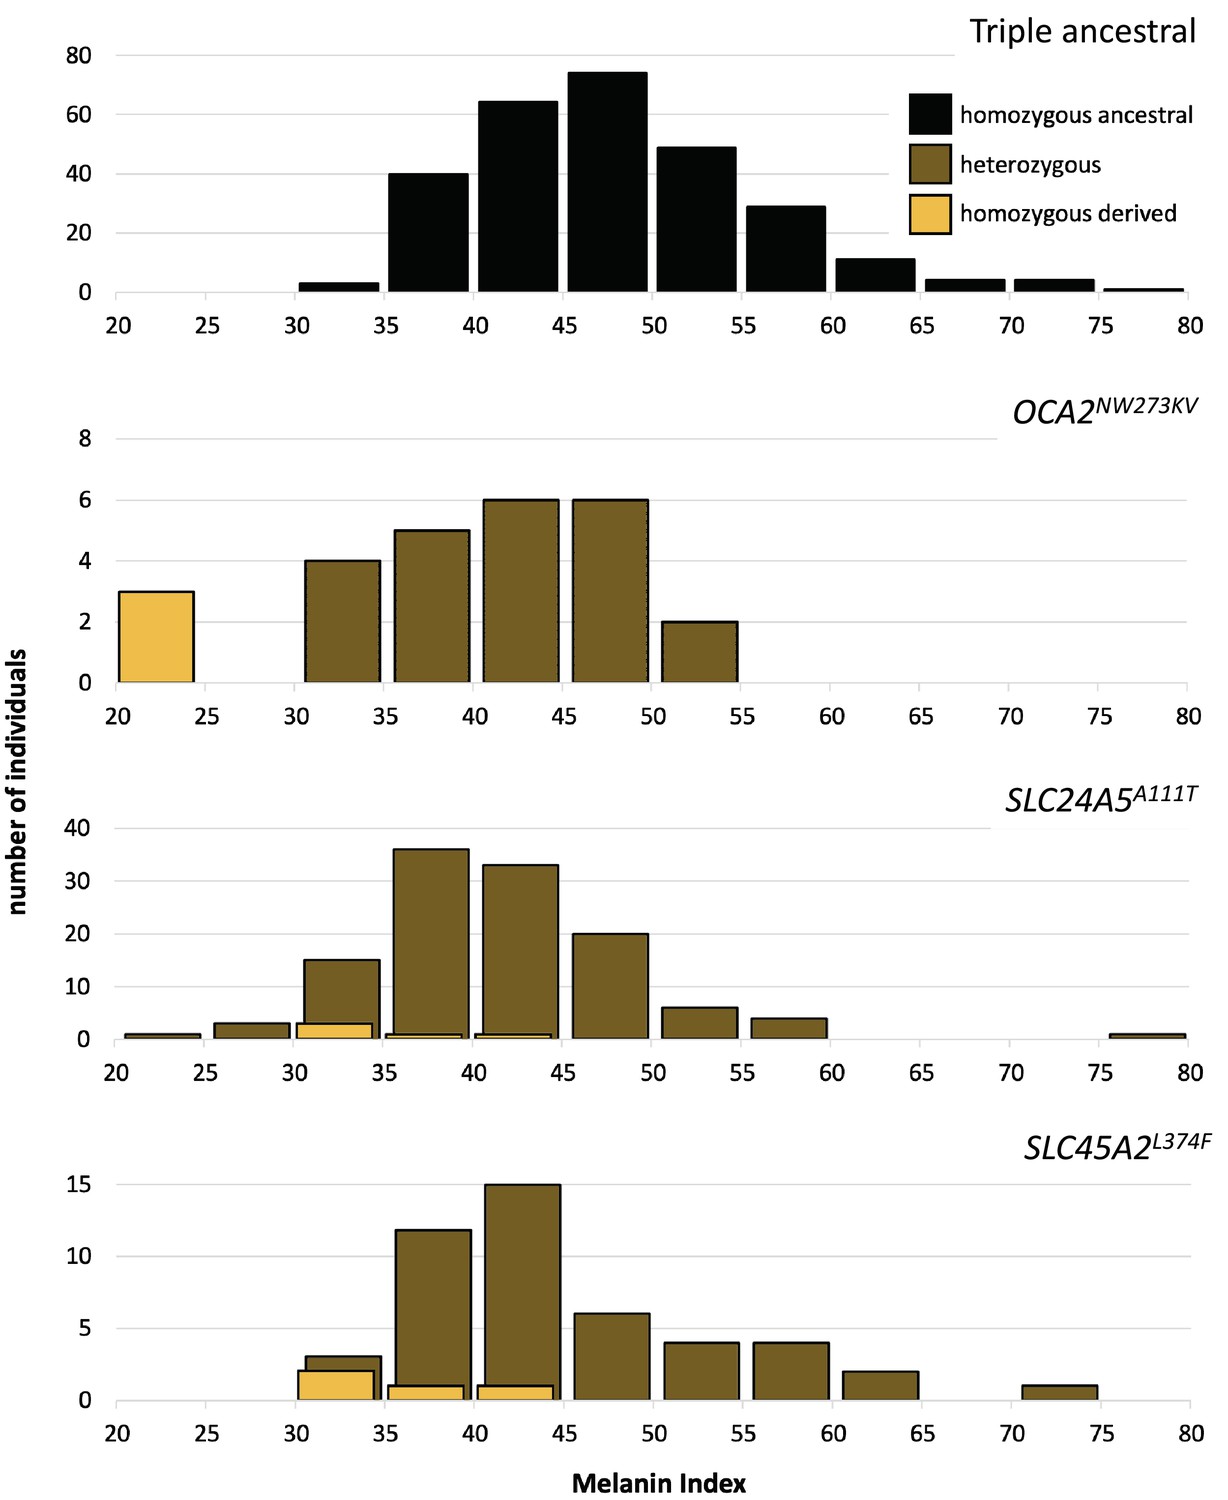
Skin color distribution of Kalinago samples according to genotype.
The ‘triple ancestral’ plot is individuals ancestral for three pigmentation loci (SLC24A5111A, SLC45A2374L, and OCA2273NW). In the other plots, heterozygosity or homozygosity is indicated for the variants: OCA2NW273KV; SLC24A5A111T; and SLC45A2L374F. Individuals depicted in the second through fourth panels are repeated if they carry variants at more than one locus. M-index of the Kalinago ranged from 20.7 to 79.7 (Figure 4—figure supplement 1) and the histogram of skin color based on community-defined ancestry are shown in Figure 4—figure supplement 2.
-
Figure 4—source data 1
The source file contain melanin index distribution as function of community-described ancestry.
- https://cdn.elifesciences.org/articles/77514/elife-77514-fig4-data1-v3.xlsx
-
Figure 4—source data 2
The source data contains data of melanin indices according to genotype.
- https://cdn.elifesciences.org/articles/77514/elife-77514-fig4-data2-v3.xlsx
Figure 4—figure supplement 1
Skin color distribution of the Kalinago from Commonwealth of Dominica.
We collected 462 Kalinago who live in the Kalinago Reservation. Each participant was asked a set of questions about their genealogical ancestry, gave their saliva sample, and have their skin color measured under their arm.
Figure 4—figure supplement 2
Melanin index distribution as function of community-described ancestry.
Individuals described as (A) ‘Kalinago’ (n=72) were slightly lighter and had a narrower melanin index unit (MI) distribution (42.5±5.6, mean ± SD) than those described as (B) ‘Mixed’ (45.8±9.6).
Figure 5 with 2 supplements
Dependence of melanin unit on genetic ancestry for Kalinago.
Only individuals who are ancestral for SLC24A5111A, SLC45A2374L, and OCA2273NW alleles are shown (n=279). The dotted red line represents the best fit (linear regression). Slope is –24.3 (melanin index unit [MI] = –24.3*NAM+61.9); r2=0.2722.
Figure 5—figure supplement 1
Estimated power for GWAS using Kalinago sample.
Simulations were performed as described in Materials and methods, using genotyped SNPs with estimated frequency difference between African and Native American ancestral populations of at least 0.7 and adjusted p-value of at least 0.1.
Figure 5—figure supplement 2
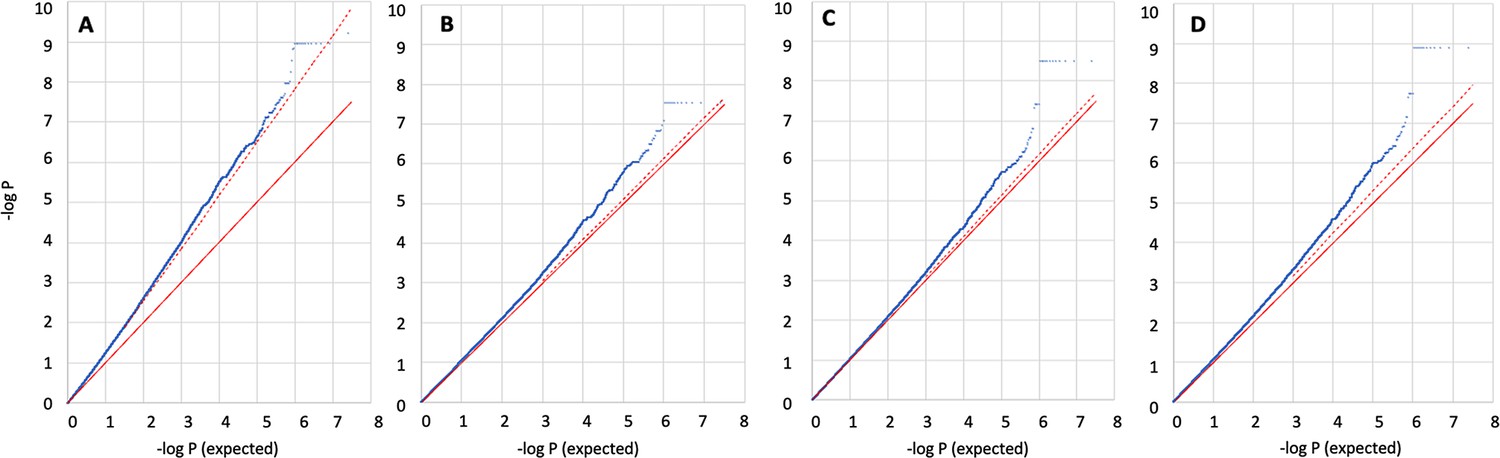
Q-Q plots for association analyses to identify novel SNPs that may contribute towards skin pigmentation in the Kalinago samples.
All estimates (blue dots) were calculated using SLC24A5A111T, SLC45A2L374F, OCA2NW273KV, and sex as covariates. Plotted values are not corrected for statistical inflation. Statistical inflation appears to exceed that predicted from the median when using LMM approaches, for our dataset. The red line shows expected values; dashed red line shows expected values based on statistical inflation (lambda) calculated from the median. (A) Linear regression with 10 principal components (PCs) included as covariates, lambda = 1.342; (B) linear mixed model (LMM) with no PCs, standard genetics relatedness matrix (GRM), lambda = 1.024; (C) LMM with 10 PCs, standard GRM, lambda = 1.031; (D) LMM with 10 PCs, REAP GRM. Lambda = 1.068. Results are consistent regardless of the test used. Blue, flat dots on the top right of the charts are SNPs found in the same gene and having the same p-value. While the LMM-based methods meet the conventional criterion of 5e-08 for genome wide significance (Appendix 3—table 1), our interpretation is that none of these variants warrant further investigation. Low observed minor allele frequencies (<2%) are inconsistent with those expected for variants responsible for pigmentation differences between the African and Native American populations.
Tables
Table 1
Albinism among NW273KV and R305W genotypes.
| Allele/genotype | NW273KV genotype | ||||
|---|---|---|---|---|---|
| Homozygous ancestral* | Heterozygous | Homozygous derived | Total | ||
| R305W genotype | Homozygous ancestral | 398 | 0 | 0 | 398 |
| Heterozygous | 33 | 22 | 0 | 55 | |
| Homozygous derived | 1 | 1 | 3† | 5 | |
| Total | 432 | 23 | 3† | 458 | |
-
*
Ancestral = reference allele and derived = alternate allele for both variants.
-
†
Albino phenotype. Notably, none of the other genotypic categories are albino individuals.
Table 2
Effect sizes for covariates in linear regression model with 10 principal components.
| Covariate | Effect size (MI) | p-Value |
|---|---|---|
| rs1426654 (SLC24A5A111T) | –5.8 | 1.5E-12 |
| rs16891982 (SLC45A2L374F) | –4.4 | 6.7E-05 |
| Albino allele (OCA2NW273KV) | –7.7 | 2.2E-05 |
| Sex (female vs male) | –2.4 | 5.0E-04 |
-
aPer allele effect size, in melanin units, for A111T and L374F; effect of first allele for albino variant.
Appendix 1—table 1
Sample Demographics.
| Category | Entire sample (N=461) |
|---|---|
| Sex | |
| male | 244 |
| female | 217 |
| Age | |
| range | 6–93 |
| mean (SD) | 39 (21.5) |
| median | 39 |
| Paternal ancestry | |
| reported* | 432 |
| named | 193 |
| sampled† | 49 |
| Maternal ancestry | |
| reported* | 437 |
| named | 244 |
| sampled† | 128 |
-
*
community-described ancestry collected.
-
†
values from reported genealogy; 75 fathers and 146 mothers as determined by genotyping.
Appendix 1—table 2
Summary of Kalinago ancestry from admixture analysis (n=458).
NAM = Native American, AFR = African, EUR = European, CSA = Central & South Asian, EAS = East Asian, OCE = Oceanian. At K=3, NAM, EAS, and OCE are not distinguishable.
| K-value | AFR | NAM | EAS | OCE | EUR | CSA |
|---|---|---|---|---|---|---|
| 3 | 0.304 | 0.552 | 0.144 | |||
| 4 | 0.318 | 0.549 | 0.011 | 0.122 | ||
| 5 | 0.318 | 0.548 | 0.011 | 0.002 | 0.121 | |
| 6 | 0.318 | 0.548 | 0.012 | 0.002 | 0.110 | 0.010 |
Appendix 1—table 3
Ancestry proportions estimated using different approaches.
| estimation approach | AMR | AFR | EUR | EAS |
|---|---|---|---|---|
| Admixture (subsets, K=4) | 0.549 | 0.318 | 0.122 | 0.011 |
| Admixture (two stage, K=4) | 0.541 | 0.316 | 0.126 | 0.016 |
| rfmix (4 clusters) | 0.553 | 0.313 | 0.125 | 0.009 |
| rfmix (3 clusters) | 0.557 | 0.326 | 0.117 | --- |
Appendix 1—table 4
Summary by locus of albinism candidates identified through exome sequencing.
Candidates are homozygous derived in one albino and heterozygous in one obligate carrier. No nonsense, frameshift, or splice variants was detected. Our initial attempt to identify the albinism variant in the Kalinago involved targeted genotyping of the albino individuals for 28 mutations previously observed (Honychurch, 2012; Honychurch, 1998; Li et al., 2008; Loomis, 1967) in African or Native American albinos; these included the 2.7 kb exon 7 deletion in OCA2 found at high frequency in some African populations. No mutation was detected using this approach.
| A. | ||||||
|---|---|---|---|---|---|---|
| OCA gene | Chromosome | Variants | Missense | |||
| OCA1 (TYR) | 11 | 0 | ||||
| OCA2 | 15 | 5 | 2 | |||
| OCA3 (TYRP1) | 9 | 0 | ||||
| OCA4 (SLC45A2) | 5 | 0 | ||||
| OCA5 | 4 | 6 | 0 | |||
| OCA6 (SLC24A5) | 15 | 0 | ||||
| OCA7 (LRMDA) | 10 | 1 | 0 | |||
| B. Characteristics of individual candidates identified through exome sequencing | ||||||
| Chr | rsID | Ref | Alt | f(AFR)* | Gene | Location/ Effect |
| 4 | rs3733437 | T | C | 0.126 | EMCN | intron |
| 4 | rs6826912 | T | G | 0.327 | PPP3CA | 3'UTR |
| 4 | rs463373 | T | C | 0.986 | SLC39A8 | 3'UTR |
| 4 | rs439757 | C | A | 0.986 | SLC39A8 | 3'UTR |
| 4 | rs223495 | A | G | 0.399 | MANBA | intron |
| 4 | rs3733632 | A | G | 0.819 | TACR3 | 5'UTR |
| 10 | rs7911113 | A | G | 0.476 | LRMDA | intron |
| 15 | rs1800419 | A | G | 0.629 | OCA2 | synonymous |
| 15 | rs1800401 | G | A | 0.126 | OCA2 | R305W |
| 15 | rs797044784† | CCAG | GACC | 0.002 | OCA2 | NW273KV |
| 15 | rs73375883 | G | A | 0.203 | OCA2 | intron |
| 15 | rs972334 | G | A | 0.217 | OCA2 | intron |
-
*
Overall frequency for non-reference allele in seven 1KGP African populations.
-
†
1KGP describes this variant as four consecutive SNPs rs549973474, rs569395077, rs538385900 and rs558126113.
Appendix 1—table 5
Effect sizes for covariates in linear regression model with 10 Principal Components.
Effect sizes are per allele for genomic variants (first allele only for albino variant). PC1 variance for included individuals (n=452) is 0.0045. P values adjusted using genomic control (applied to GWAS on the full variant set) are omitted if raw P value is above 0.05.
| variable | Gene | standard | BETA | P_raw | Q (-log P) | alt1 | BETA | P_raw | Q | Beta-ratio-std |
|---|---|---|---|---|---|---|---|---|---|---|
| rs7118677 | GRM5/Tyr | test | -2.419 | 0.0001392 | 3.86 | <omitted> | ||||
| rs1800404 | OCA2 | test | -1.497 | 0.001446 | 2.84 | <omitted> | ||||
| rs885479 | MC1R | test | -1.31 | 0.008565 | 2.07 | <omitted> | ||||
| rs6917661 | OPRM1 | test | -1.084 | 0.0117 | 1.93 | <omitted> | ||||
| rs2153271 | BNC2 | test | -2.27 | 0.0002337 | 3.63 | <omitted> | ||||
| NW273KV | OCA2 | covariate | -7.744 | 9.00E-07 | 6.05 | covariate | -7.613 | 1.28E-06 | 5.89 | 0.98 |
| A111T | SLC24A5 | covariate | -5.757 | 2.45E-16 | 15.61 | covariate | -5.695 | 4.17E-16 | 15.38 | 0.99 |
| L374F | SLC45A2 | covariate | -4.415 | 3.90E-06 | 5.41 | covariate | -4.392 | 4.06E-06 | 5.39 | 0.99 |
| PC1 | covariate | -62.14 | 5.73E-32 | 31.24 | covariate | -59.46 | 3.58E-28 | 27.45 | 0.96 | |
| PC2 | covariate | -0.0571 | 0.9904 | 0.00 | covariate | 0.7866 | 0.869 | |||
| PC3 | covariate | 7.231 | 0.1208 | 0.92 | covariate | 7.891 | 0.09021 | |||
| PC4 | covariate | -2.677 | 0.6025 | 0.22 | covariate | -2.242 | 0.6618 | |||
| PC5 | covariate | -6.993 | 0.1447 | 0.84 | covariate | -6.714 | 0.1602 | |||
| PC6 | covariate | 1.642 | 0.7392 | 0.13 | covariate | 1.309 | 0.79 | |||
| PC7 | covariate | 7.277 | 0.1385 | 0.86 | covariate | 6.716 | 0.1707 | |||
| PC8 | covariate | 3.267 | 0.5061 | 0.30 | covariate | 2.667 | 0.5867 | |||
| PC9 | covariate | -17.27 | 0.001093 | 2.96 | covariate | -16.19 | 0.002222 | |||
| PC10 | covariate | 8.599 | 0.116 | 0.94 | covariate | 8.423 | 0.1224 | |||
| SEX | covariate | 2.547 | 5.49E-05 | 4.26 | covariate | 2.515 | 6.45E-05 | 4.19 | 0.99 | |
| AGE | <omitted> | covariate | -0.02985 | 0.04596 |
-
This table compares three versions of analysis (linear regression only).
-
P values reported here (and Q = – log P) are not corrected for statistic inflation.
-
The last column for each non-standard case shows ratio of the effect size to that for the standard model, omitting PCs other than.
-
alt1 model adds age to standard analysis.
-
alt2 model adds five additional SNPs to standard analysis.
Appendix 1—table 6
Amplification conditions used for genotyping Kalinago samples for the selected alleles.
| Gene & Variant | Primer Sequence | PCR Annealing Temperature (°C) |
|---|---|---|
| SLC24A5A111T rs1426654 | Fwd- CTCACCTACAAGCCCTCTGC Rev- AATTGCAGATCCAAGGATGG | 55 |
| SLC45A2L374F rs16891982 | Fwd- CCTGCTGGGACTCATCCATC Rev- AGCAGAGTGCATGAGAAGGG | 55 |
| OCA2NW273KV rs797044784 | Fwd- AGAGTCCCAGATGGTGTCTCA Rev- AGGTCAGACTCCTTTAAACG | 53 |
| OCA2R305W rs1800401 | Fwd- AGAGGGAGGTCCCCTAACTG Rev- ATCTCAAGCCTCCCTGACTG | 53 |
| MFSD12Y182H rs2240751 | Fwd- CCCAGGTGGAATAGCAGTGAG Rev- AGTGGTTGGAATCACCTGTCA | 61 |
Appendix 2—table 1
Effect sizes of previously reported variants in Kalinago samples.
| CHR | pos (b37) | SNP | REF | ALT | gene | location | CADD_PHRED | Polyphen (main) | SIFT (main) | Freq | GT source | AR2 | BETA_a | P_a_raw | P_a_adj | BETA_b | P_b | BETA_c | P_c | BETA_d | P_d | reference(s) |
|---|---|---|---|---|---|---|---|---|---|---|---|---|---|---|---|---|---|---|---|---|---|---|
| 2 | 25329016 | rs12233134 | C | T | EFR3B near POMC | intronic | 0.348 | - | - | 0.473 | IMP | 1 | 0.61 | 0.197 | 0.2653 | –0.06 | 0.910365 | 0.15 | 0.771545 | 0.23 | 0.657335 | Quillen et al., 2012 |
| 6 | 457748 | rs4959270 | C | A | LOC105374875 near IRF4 | intronic | 1.041 | - | - | 0.329 | GT | 1 | 0.07 | 0.8796 | 0.8959 | –0.14 | 0.783747 | –0.08 | 0.880465 | –0.07 | 0.896826 | Sulem et al., 2007 |
| 6 | 466033 | rs1540771 | C | T | LOC105374875 near IRF4 | intronic | 0.95 | - | - | 0.305 | GT | 1 | –0.02 | 0.9703 | 0.9744 | –0.15 | 0.765123 | –0.08 | 0.875216 | –0.09 | 0.853243 | Sulem et al., 2007 |
| 6 | 154663568 | rs2333857 | A | G | IPCEF1 near OPRM1 | intronic or upstream | 3.27 | - | - | 0.813 | IMP | 1 | 1.33 | 0.02932 | 0.05976 | 0.78 | 0.225651 | 1.16 | 0.0719104 | 1.22 | 0.059139 | Quillen et al., 2012 |
| 6 | 154721557 | rs6917661 | C | T | CNKSR3 near OPRM1 | 3'UTR or downstream | 1.824 | - | - | 0.584 | GT | 1 | 1.08 | 0.0117 | 0.02938 | 0.61 | 0.20166 | 0.72 | 0.133223 | 0.76 | 0.111546 | Quillen et al., 2012 |
| 7 | 55109177 | rs12668421 | A | T | EGFR | intronic | 0.212 | - | - | 0.494 | IMP | 0.98 | –0.16 | 0.7473 | 0.7809 | –0.39 | 0.46139 | –0.14 | 0.787191 | –0.15 | 0.780554 | Quillen et al., 2012 |
| 7 | 55156071 | rs11238349 | G | A | EGFR | intronic | 0.431 | - | - | 0.393 | IMP | 1 | 0.34 | 0.48 | 0.542 | –0.65 | 0.22091 | –0.37 | 0.479127 | –0.34 | 0.523937 | Quillen et al., 2012 |
| 7 | 55454267 | rs4948023 | G | A | LANCL2 near EGFR | intronic | 4.667 | - | - | 0.684 | IMP | 1 | 0.16 | 0.7641 | 0.7956 | –0.22 | 0.696131 | 0.00 | 0.996604 | 0.00 | 0.994267 | Quillen et al., 2012 |
| 9 | 12682663 | rs10809826 | C | G | TYRP1 | upstream | 1.738 | - | - | 0.117 | IMP | 0.96 | –0.28 | 0.6803 | 0.7221 | –0.55 | 0.472775 | –0.65 | 0.392833 | –0.73 | 0.332409 | Adhikari et al., 2019 |
| 9 | 16864521 | rs2153271 | C | T | BNC2 | intronic | 20.5 | - | - | 0.152 | GT | 1 | –2.27 | 0.0002337 | 0.001459 | –2.29 | 0.00110657 | –2.25 | 0.00120438 | –2.37 | 0.00065015 | Ju and Mathieson, 2021 |
| 10 | 119564143 | rs11198112 | C | T | near EMX2 | intergenic | 17.79 | 0.187 | GT | 1 | 0.33 | 0.5664 | 0.6206 | 1.10 | 0.067385 | 0.99 | 0.100263 | 0.96 | 0.11598 | Adhikari et al., 2019 | ||
| 11 | 88511524 | rs7118677 | G | T | GRM5 near TYR | intronic | 2.034 | - | - | 0.144 | IMP | 1 | –2.42 | 0.0001392 | 0.000982 | –1.62 | 0.0152453 | –1.99 | 0.00286815 | –2.10 | 0.00151048 | Adhikari et al., 2019 |
| 11 | 88911696 | rs1042602 | C | A | TYR | S192Y | 23.8 | probably_damaging(0.974) | deleterious(0.01) | 0.072 | IMP | 0.74 | –2.90 | 0.0003701 | 0.002074 | –2.16 | 0.0119931 | –2.43 | 0.00469847 | –2.56 | 0.00273999 | Stokowski et al., 2007 |
| 11 | 89011046 | rs1393350 | G | A | TYR | intronic | 1.555 | - | - | 0.019 | GT | 1 | –3.51 | 0.01947 | 0.04354 | –2.90 | 0.0869741 | –3.38 | 0.042737 | –3.57 | 0.0261186 | Liu et al., 2015 |
| 11 | 89017961 | rs1126809 | G | A | TYR | R402Q | 27.2 | probably_damaging(0.994) | deleterious(0.03) | 0.019 | IMP | 0.97 | –3.51 | 0.01947 | 0.04354 | –2.90 | 0.0869741 | –3.38 | 0.042737 | –3.57 | 0.0261186 | Adhikari et al., 2019; Ju and Mathieson, 2021 |
| 12 | 89299746 | rs642742 | C | T | KITLG | upstream | 14.92 | - | - | 0.569 | GT | 1 | –0.34 | 0.4757 | 0.538 | –0.20 | 0.708049 | –0.30 | 0.568757 | –0.28 | 0.602548 | Sturm, 2009 |
| 12 | 89328335 | rs12821256 | T | C | KITLG | upstream | 15.74 | - | - | 0.015 | GT | 1 | 1.20 | 0.5327 | 0.5902 | –1.36 | 0.524421 | –1.08 | 0.608744 | –0.95 | 0.648883 | Ju and Mathieson, 2021 |
| 14 | 92773663 | rs12896399 | G | T | LOC105370627 near SLC24A4 | intronic | 0.043 | - | - | 0.054 | GT | 1 | –0.16 | 0.8692 | 0.887 | –0.96 | 0.352238 | –0.89 | 0.380027 | –0.98 | 0.337781 | Sulem et al., 2007 |
| 15 | 28197037 | rs1800414 | T | C | OCA2 | H615R | 23.3 | benign(0.133) | deleterious(0) | 0.070 | IMP | 0.26 | 0.48 | 0.6116 | 0.6612 | –0.01 | 0.989592 | 0.07 | 0.939843 | 0.08 | 0.938174 | Edwards et al., 2010 |
| 15 | 28213850 | rs4778219 | C | T | OCA2 | intronic | 1.527 | - | - | 0.316 | GT | 1 | –0.53 | 0.3074 | 0.3782 | –0.89 | 0.0952479 | –0.93 | 0.083945 | –0.90 | 0.0977717 | Adhikari et al., 2019 |
| 15 | 28235773 | rs1800404 | C | T | OCA2 | synonymous coding | 0.321 | - | - | 0.488 | GT | 1 | –1.50 | 0.001446 | 0.005889 | –1.47 | 0.00324612 | –1.30 | 0.00924527 | –1.37 | 0.00639755 | Crawford et al., 2017; Adhikari et al., 2019 |
| 15 | 28260053 | rs1800401 | G | A | OCA2 | R305W | 22.7 | benign(0.245) | deleterious(0.03) | 0.068 | GT | 0.03 | 0.9788 | 0.9814 | --- | |||||||
| 15 | 28344238 | rs7495174 | A | G | OCA2 | intronic | 7.622 | - | - | 0.087 | GT | 1 | 1.64 | 0.0326 | 0.0649 | 1.57 | 0.0663265 | 1.60 | 0.0580815 | 1.60 | 0.0567887 | Han et al., 2008 |
| 15 | 28365618 | rs12913832 | A | G | HERC2 near OCA2 | intronic | 15.8 | - | - | 0.074 | GT | 1 | –1.86 | 0.03926 | 0.07497 | –1.48 | 0.112546 | –1.53 | 0.100514 | –1.57 | 0.0919142 | Liu et al., 2015; Adhikari et al., 2019 |
| 15 | 28380518 | rs4778249 | T | A | HERC2 near OCA2 | intronic | 0.649 | - | - | 0.790 | IMP | 1 | –2.23 | 0.0002214 | 0.0014 | –2.43 | 0.00041828 | –2.14 | 0.00162008 | –2.12 | 0.0016832 | Adhikari et al., 2019 |
| 15 | 28530182 | rs1667394 | C | T | HERC2 near OCA2 | intronic | 1.111 | - | - | 0.452 | GT | 1 | –1.42 | 0.002039 | 0.007666 | –1.56 | 0.00151414 | –1.41 | 0.0038335 | –1.43 | 0.00369895 | Sulem et al., 2007 |
| 16 | 89986117 | rs1805007 | C | T | MC1R | R151C | 25.2 | probably_damaging(0.996) | deleterious(0.02) | 0.016 | GT | 1 | 1.32 | 0.4775 | 0.5397 | 0.67 | 0.712981 | 0.93 | 0.613105 | 0.86 | 0.64501 | Ju and Mathieson, 2021 |
| 16 | 89986154 | rs885479 | G | A | MC1R | R163Q | 10.89 | benign(0.013) | tolerated(0.3) | 0.461 | IMP | 0.92 | –1.31 | 0.008565 | 0.0231 | –1.60 | 0.00241496 | –1.46 | 0.00572561 | –1.48 | 0.00546969 | Liu et al., 2015 |
| 19 | 3548231 | rs2240751 | A | G | MFSD12 | Y182H | 27.4 | probably_damaging(0.999) | deleterious(0) | 0.031 | GT | –3.03 | 0.03735 | 0.0723 | –1.60 | 0.281792 | –1.46 | 0.33655 | –1.57 | 0.3027 | Adhikari et al., 2019 | |
| 20 | 3625436 | rs562926 | C | T | ATRN | intronic or downstream | 4.601 | - | - | 0.402 | GT | 1 | 0.85 | 0.08705 | 0.1395 | –0.12 | 0.821567 | 0.18 | 0.730685 | 0.28 | 0.595369 | Quillen et al., 2012 |
| 20 | 32856998 | rs6058017 | A | G | ASIP/AHCY | 3'UTR/intron | 7.639 | - | - | 0.342 | IMP | 0.95 | –0.90 | 0.07274 | 0.1212 | –0.85 | 0.126901 | –1.04 | 0.0606301 | –1.04 | 0.0609305 | Stokowski et al., 2007 |
Appendix 3—table 1
Top novel variants that may contribute towards skin pigmentation from our GWAS analysis.While the lowest p-values from the LMM-based methods meet the conventional criterion of 5e-08 for genome wide significance, the low observed minor allele frequencies (<2%) are inconsistent with what would be expected for variants responsible for pigmentation differences between the African and Native American populations.
| CHR | pos (b37) | SNP | REF | ALT | gene | location | CADD_PHRED | Freq | GT source | AR2 | BETA_a | P_a_raw | P_a_adj | BETA_b | P_b | BETA_c | P_c | BETA_d | P_d |
|---|---|---|---|---|---|---|---|---|---|---|---|---|---|---|---|---|---|---|---|
| 1 | 114560208 | rs113236485 | A | G | near SYT6 | intergenic | 1.323 | 0.014 | IMP | 0.91 | 11.96 | 1.01E-08 | 6.71E-07 | 12.24 | 1.57E-07 | 12.91 | 4.67E-08 | 12.96 | 2.17E-08 |
| 1 | 114576742 | rs145925324 | G | A | near SYT6 | intergenic | 0.648 | 0.013 | IMP | 1 | 12.50 | 1.09E-08 | 7.12E-07 | 12.56 | 1.55E-07 | 13.39 | 3.85E-08 | 13.49 | 1.81E-08 |
| 1 | 114581335 | rs141998140 | G | T | near SYT6 | intergenic | 2.099 | 0.013 | IMP | 1 | 12.50 | 1.09E-08 | 7.12E-07 | 12.56 | 1.55E-07 | 13.39 | 3.85E-08 | 13.49 | 1.81E-08 |
| 1 | 114582335 | rs187318390 | C | T | near SYT6 | intergenic | 1.165 | 0.013 | IMP | 1 | 12.50 | 1.09E-08 | 7.12E-07 | 12.56 | 1.55E-07 | 13.39 | 3.85E-08 | 13.49 | 1.81E-08 |
| 1 | 114586703 | rs149623066 | A | G | near SYT6 | intergenic | 0.052 | 0.013 | IMP | 1 | 12.50 | 1.09E-08 | 7.12E-07 | 12.56 | 1.55E-07 | 13.39 | 3.85E-08 | 13.49 | 1.81E-08 |
| 1 | 114595150 | rs78273840 | C | T | near SYT6 | intergenic | 1.805 | 0.017 | IMP | 0.78 | 8.87 | 3.13E-06 | 5.39E-05 | 10.59 | 5.74E-07 | 11.11 | 1.98E-07 | 11.25 | 9.38E-08 |
| 1 | 114611620 | rs116218201 | T | G | near SYT6 | intergenic | 2.199 | 0.012 | IMP | 0.83 | 14.09 | 1.12E-09 | 1.24E-07 | 14.18 | 3.11E-08 | 15.52 | 3.16E-09 | 15.69 | 1.23E-09 |
| 1 | 114612965 | rs116746819 | G | A | near SYT6 | intergenic | 0.351 | 0.012 | IMP | 0.84 | 14.09 | 1.12E-09 | 1.24E-07 | 14.18 | 3.11E-08 | 15.52 | 3.16E-09 | 15.69 | 1.23E-09 |
| 1 | 114614230 | rs549514340 | T | C | near SYT6 | intergenic | 3.308 | 0.012 | IMP | 0.84 | 14.09 | 1.12E-09 | 1.24E-07 | 14.18 | 3.11E-08 | 15.52 | 3.16E-09 | 15.69 | 1.23E-09 |
| 1 | 114619521 | rs115102845 | C | G | SYT6 | downstream | 0.253 | 0.012 | IMP | 0.86 | 14.09 | 1.12E-09 | 1.24E-07 | 14.18 | 3.11E-08 | 15.52 | 3.16E-09 | 15.69 | 1.23E-09 |
| 1 | 114620469 | rs182159269 | G | A | SYT6 | downstream | 0.225 | 0.012 | IMP | 0.85 | 14.09 | 1.12E-09 | 1.24E-07 | 14.18 | 3.11E-08 | 15.52 | 3.16E-09 | 15.69 | 1.23E-09 |
| 1 | 114620940 | rs183827287 | C | T | SYT6 | downstream | 0.12 | 0.012 | IMP | 0.92 | 14.09 | 1.12E-09 | 1.24E-07 | 14.18 | 3.11E-08 | 15.52 | 3.16E-09 | 15.69 | 1.23E-09 |
| 1 | 114622601 | rs141251595 | G | A | SYT6 | downstream | 2.003 | 0.012 | IMP | 0.93 | 14.09 | 1.12E-09 | 1.24E-07 | 14.18 | 3.11E-08 | 15.52 | 3.16E-09 | 15.69 | 1.23E-09 |
| 1 | 114624033 | rs186173861 | T | C | SYT6 | downstream | 2.87 | 0.012 | IMP | 0.99 | 14.09 | 1.12E-09 | 1.24E-07 | 14.18 | 3.11E-08 | 15.52 | 3.16E-09 | 15.69 | 1.23E-09 |
| 1 | 114624337 | rs181299762 | C | T | SYT6 | downstream | 1.726 | 0.012 | IMP | 0.99 | 14.09 | 1.12E-09 | 1.24E-07 | 14.18 | 3.11E-08 | 15.52 | 3.16E-09 | 15.69 | 1.23E-09 |
| 1 | 114625992 | rs111898196 | T | C | SYT6 | downstream | 14.83 | 0.012 | IMP | 0.98 | 14.09 | 1.12E-09 | 1.24E-07 | 14.18 | 3.11E-08 | 15.52 | 3.16E-09 | 15.69 | 1.23E-09 |
| 1 | 114626277 | rs546818700 | T | A | SYT6 | downstream | 0.549 | 0.012 | IMP | 0.98 | 14.09 | 1.12E-09 | 1.24E-07 | 14.18 | 3.11E-08 | 15.52 | 3.16E-09 | 15.69 | 1.23E-09 |
| 1 | 114626295 | rs112626676 | C | T | SYT6 | downstream | 6.822 | 0.012 | IMP | 0.98 | 14.09 | 1.12E-09 | 1.24E-07 | 14.18 | 3.11E-08 | 15.52 | 3.16E-09 | 15.69 | 1.23E-09 |
| 1 | 114656630 | rs185469828 | C | T | SYT6 | intronic | 3.735 | 0.011 | IMP | 1 | 13.32 | 7.49E-08 | 3.12E-06 | 13.55 | 1.61E-06 | 15.25 | 1.58E-07 | 15.44 | 6.93E-08 |
| 1 | 114656848 | rs79537167 | G | T | SYT6 | intronic | 0.359 | 0.011 | IMP | 1 | 13.32 | 7.49E-08 | 3.12E-06 | 13.55 | 1.61E-06 | 15.25 | 1.58E-07 | 15.44 | 6.93E-08 |
| 3 | 124343256 | rs676091 | T | G | KALRN | intronic | 3.169 | 0.017 | IMP | 0.99 | 9.59 | 3.60E-08 | 1.78E-06 | 9.73 | 8.49E-08 | 9.02 | 6.00E-07 | 9.21 | 2.08E-07 |
| 4 | 65768709 | rs6816819 | T | G | LOC107986284 | intronic | 5.827 | 0.013 | GT | 1 | 11.99 | 6.11E-10 | 7.84E-08 | 10.96 | 1.14E-07 | 10.30 | 5.30E-07 | 10.50 | 1.66E-07 |
-
key, a = linear regression, 10 PCs; b = LMM with 0 PCs, std GRM; c = LMM with 10 PCs, std GRM; d = LMM with 10 PCs, reap GRM; ad j = based on lambda, inflation factor; beta = effect size.
Additional files
-
MDAR checklist
- https://cdn.elifesciences.org/articles/77514/elife-77514-mdarchecklist1-v3.pdf
-
Supplementary file 1
Kalinago Sample Demographics.
- https://cdn.elifesciences.org/articles/77514/elife-77514-supp1-v3.docx
-
Supplementary file 2
Effect sizes of previously reported variants in Kalinago samples.
- https://cdn.elifesciences.org/articles/77514/elife-77514-supp2-v3.docx
-
Supplementary file 3
Top novel variants that may contribute towards skin pigmentation from our GWAS analysis.
- https://cdn.elifesciences.org/articles/77514/elife-77514-supp3-v3.docx
-
Supplementary file 4
Table S9: PCA data with sex and genotypes as covariates.
- https://cdn.elifesciences.org/articles/77514/elife-77514-supp4-v3.xlsx
Download links
A two-part list of links to download the article, or parts of the article, in various formats.
Downloads (link to download the article as PDF)
Open citations (links to open the citations from this article in various online reference manager services)
Cite this article (links to download the citations from this article in formats compatible with various reference manager tools)
Native American genetic ancestry and pigmentation allele contributions to skin color in a Caribbean population
eLife 12:e77514.
https://doi.org/10.7554/eLife.77514


