Residual force enhancement is affected more by quadriceps muscle length than stretch amplitude
- Human Movement Science, Faculty of Sport Science, Ruhr University Bochum, Germany
- School of Human Movement and Nutrition Sciences, University of Queensland, Australia
Figures
Figure 1
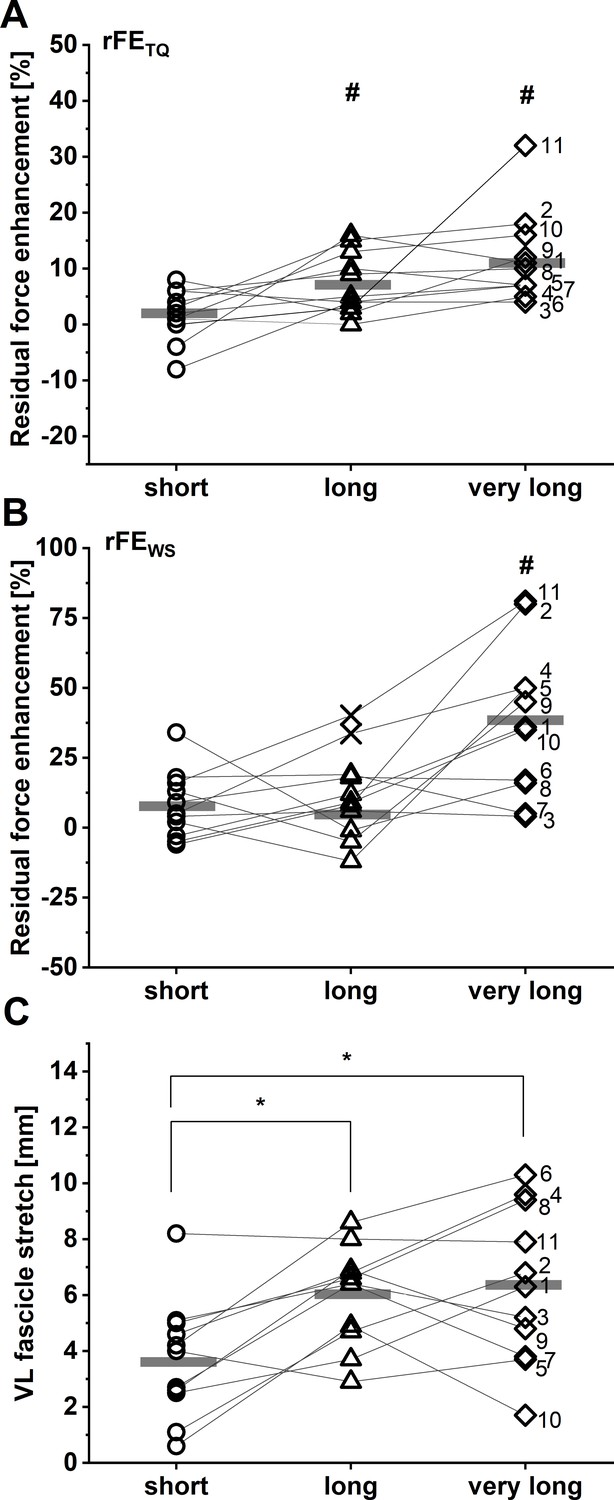
Individual and mean residual force enhancement (rFE) magnitudes (n=11) based on corrected torque (A) and squared patellar tendon (PT) shear-wave-speed recordings (B) at the short (dots), long (triangles), and very long (squares) muscle lengths.
Individual and mean vastus lateralis (VL) muscle fascicle stretch amplitudes are shown in C (n=11). Unfilled symbols represent the individual values and horizontal bars indicate the group mean for each condition. Outliers that were excluded from analysis are indicated with a X in B (n=2). Grey lines and black numbers distinguish between participants. *Indicates a significant difference between muscle length conditions (p<0.05). #Indicates significant rFE based on corrected knee extension torque (A) and shear-wave-speed (B) measurements (p<0.05).
Figure 2

Repeated-measures linear relationships between rFETQ and vastus lateralis (VL) fascicle stretch amplitude (A: r=0.33, 95% CI: –0.12 to 0.67, p=0.126), rFETQ and VL fascicle length (B: r=0.63, 95% CI: 0.27–0.83, p=0.001), rFEWS and fascicle stretch amplitude (C: r=0.29, 95% CI: –0.19 to 0.66, p=0.201), and rFEWS and VL fascicle length (D: r=0.52, 95% CI: 0.08–0.79, p=0.017).
Pearson correlations neglect the substantial within-subject variability and therefore were not performed (Bakdash and Marusich, 2017).
Figure 3 with 2 supplements
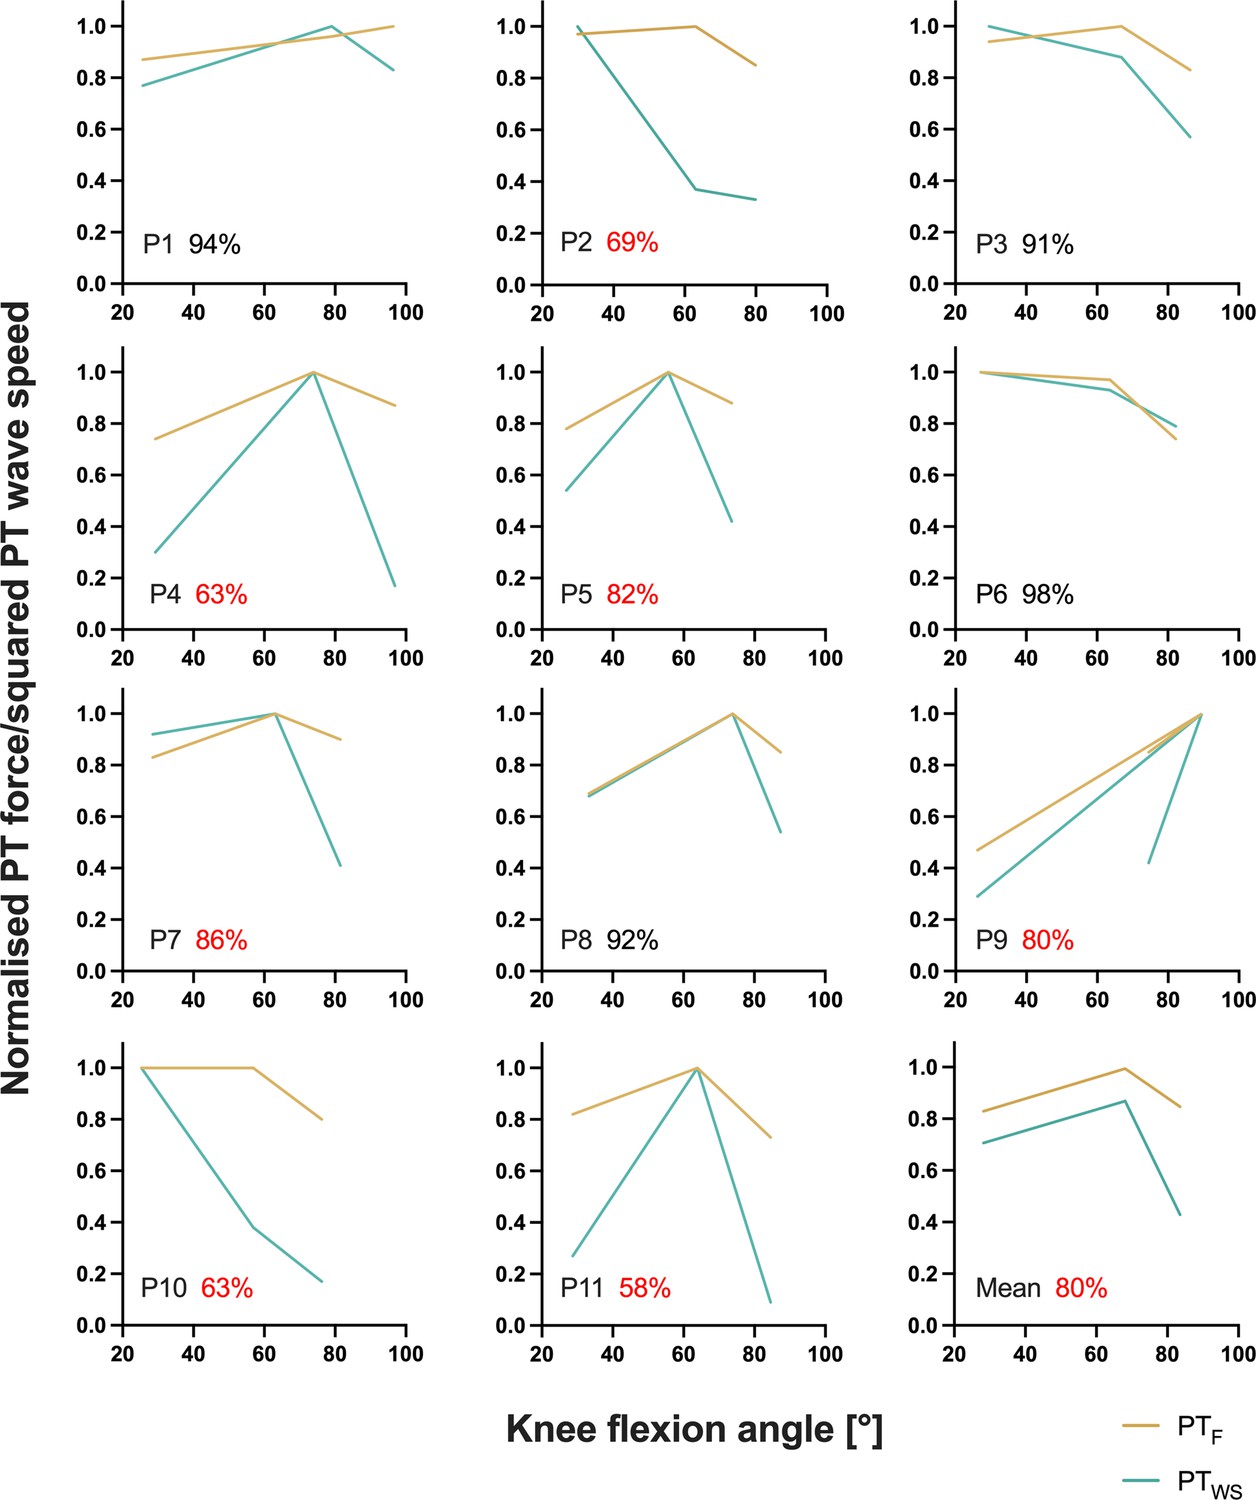
Individual normalised relationships between estimated patellar tendon (PT) force (PTF) and knee flexion angle and between squared PT shear-wave speed (PTWS) and knee flexion angle determined from the fixed-end reference contractions at the short, long, and very long muscle lengths from part 2 of the experiment.
The average agreement across muscle lengths (100 – (PTWS – PTF)/(PTWS +PTF)×100) between normalised PT forces and squared PT shear-wave speeds is indicated as a percentage for every participant, where red font has been used to highlight instances of less than 90% agreement. The bottom right panel shows the mean normalised relationship between estimated PT force and knee flexion angle and between squared PT shear-wave speed and knee flexion angle across all participants. The angle-specific agreement across participants was 86%, 91%, and 62% at the short, long, and very long muscle lengths, respectively.
Figure 3—figure supplement 1
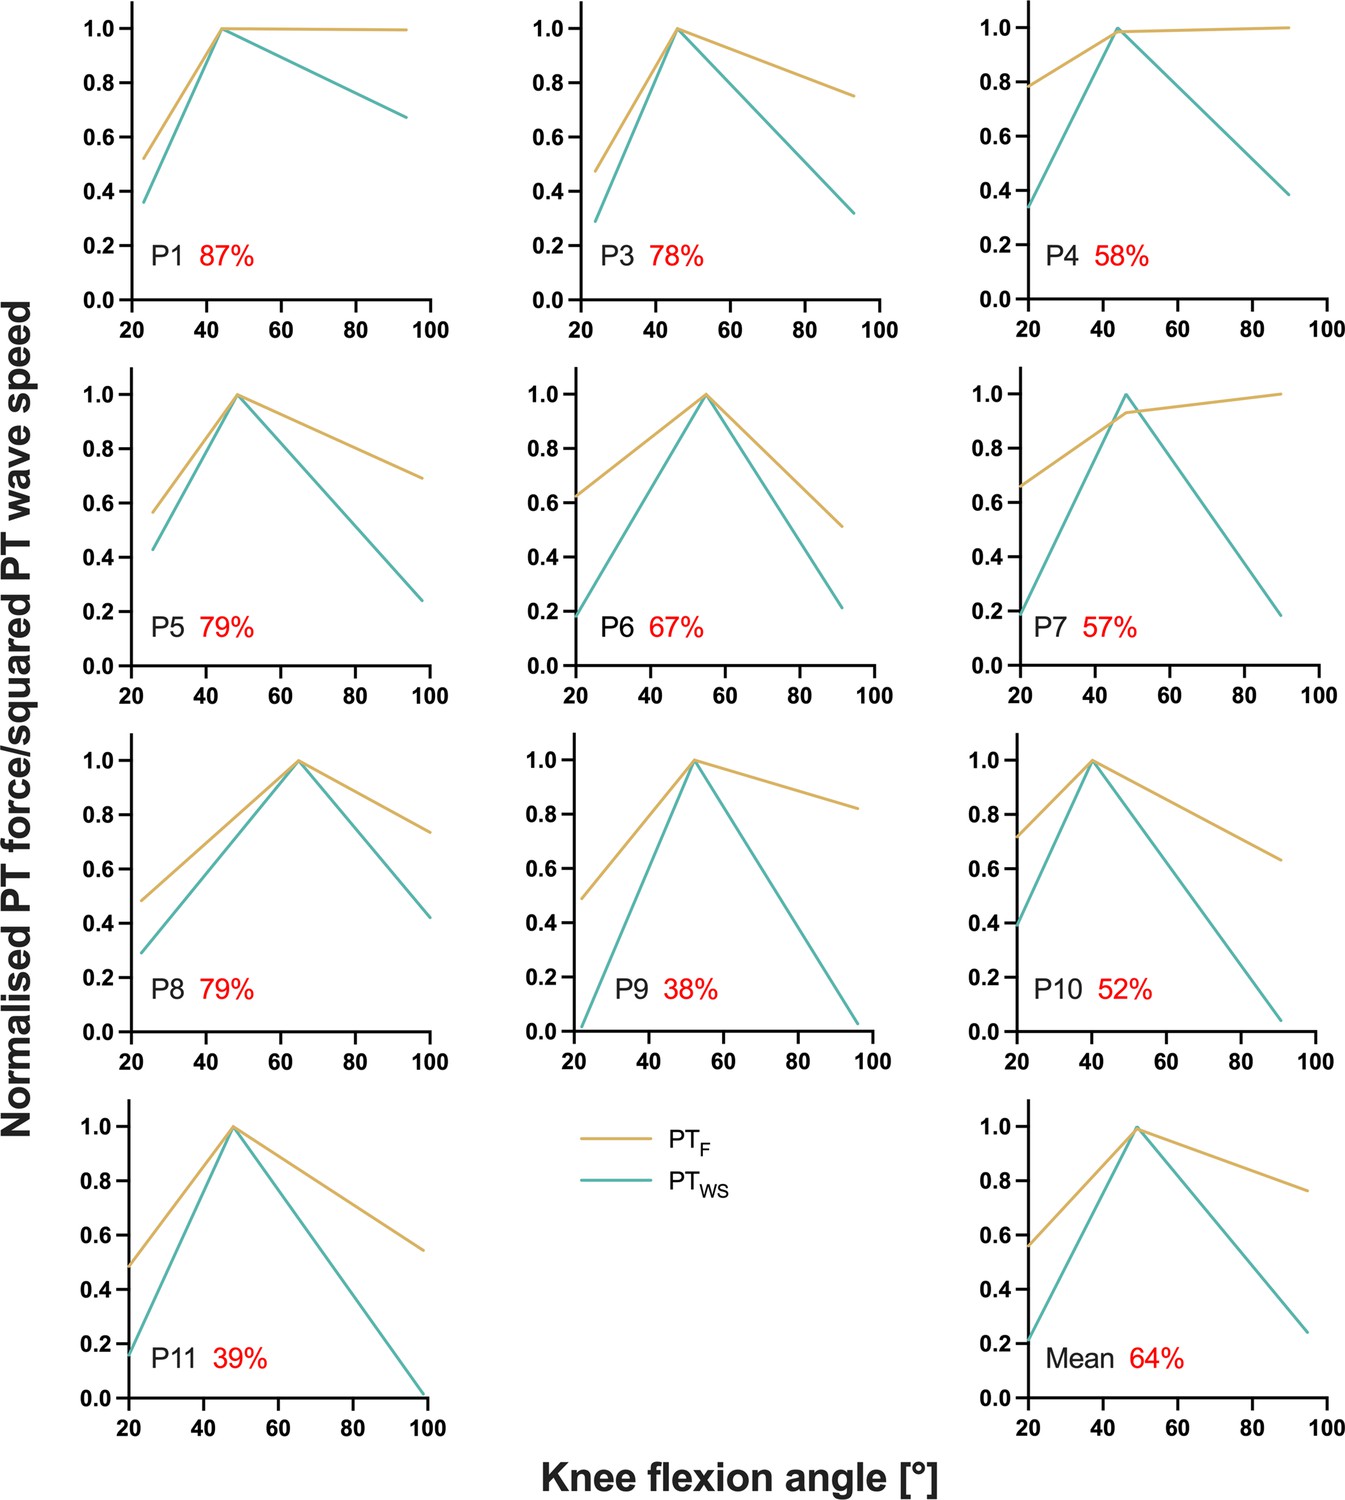
Individual normalised relationships between estimated patellar tendon (PT) force (PTF) and knee flexion angle and between squared PT shear-wave speed (PTWS) and knee flexion angle determined from the fixed-end reference ramp contractions at the short, long, and very long muscle lengths from part 1 of the experiment.
The average agreement across muscle lengths (100 – (PTWS – PTF)/(PTWS + PTF)×100) between normalised PT forces and squared PT shear-wave speeds is indicated as a percentage for every participant, where red font has been used to highlight instances of less than 90% agreement. P2 had to be excluded from this analysis due to missing marker data. The bottom right panel shows the mean normalised relationship between estimated PT force and knee flexion angle and between squared PT shear-wave speed and knee flexion angle across all participants. The angle-specific agreement across participants was 49%, 100%, and 42% at the short, long, and very long muscle lengths, respectively.
Figure 3—figure supplement 2
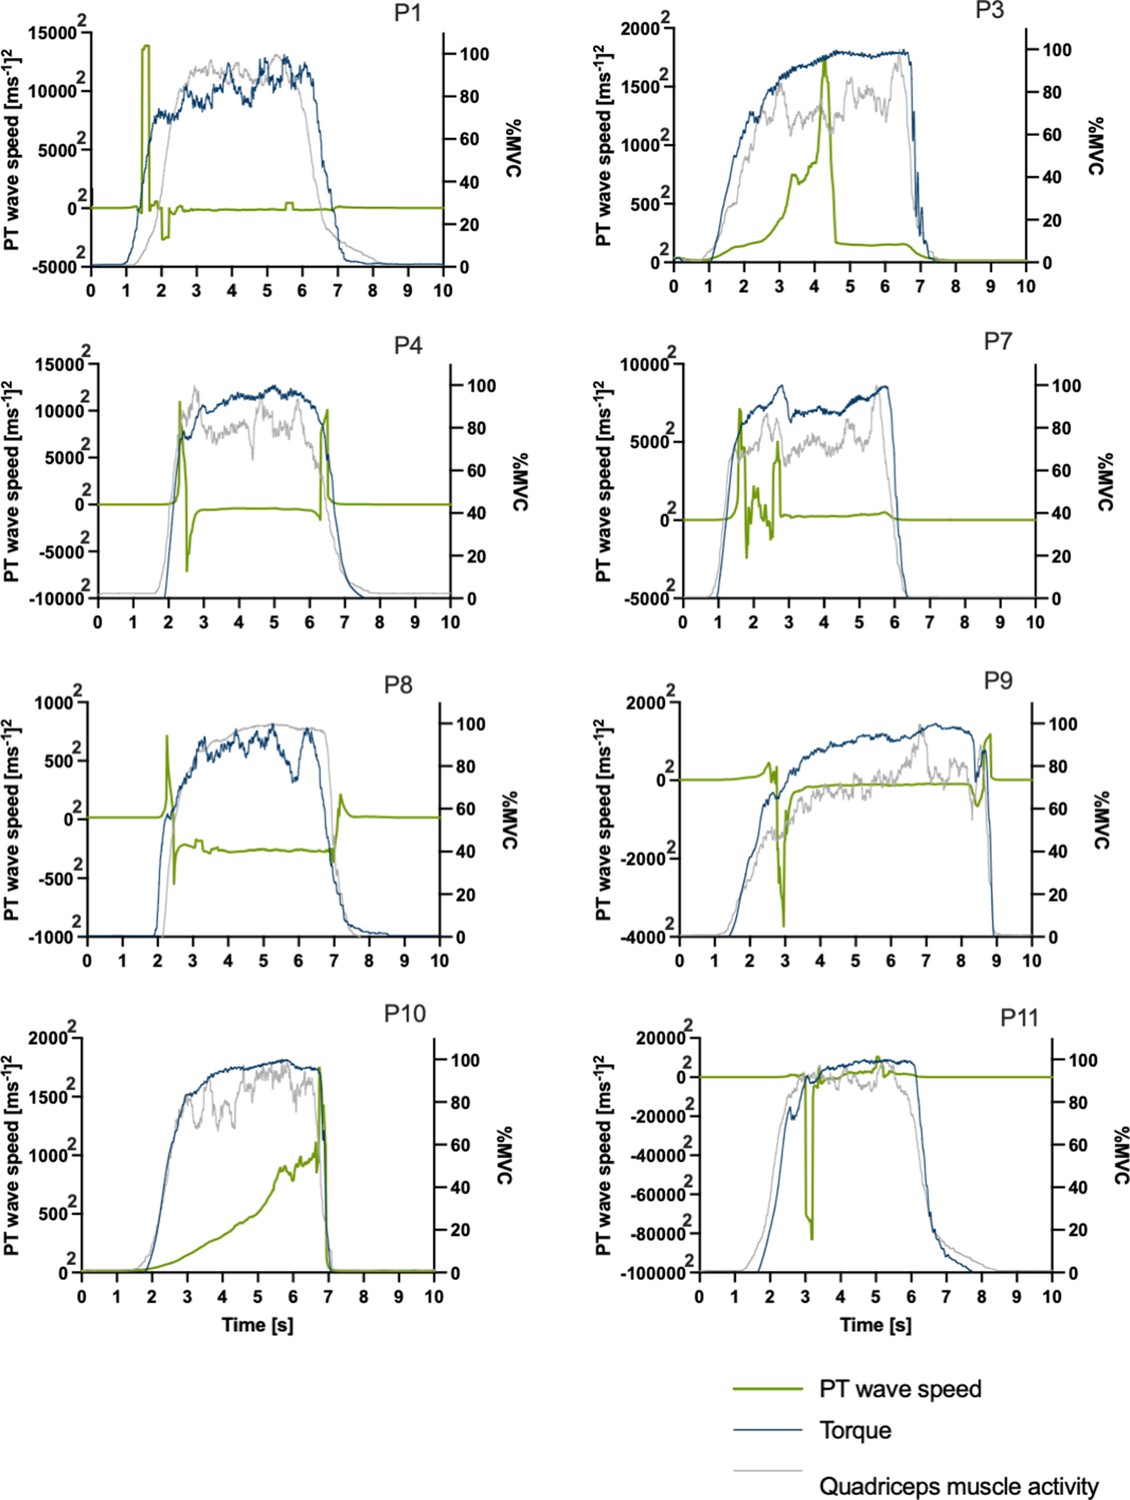
Individual squared patellar tendon (PT) shear-wave-speed-time (green), knee extension torque-time (blue), and summed quadriceps’ muscle activity level-time traces (grey) during maximum voluntary fixed-end reference contractions at a 70° crank-arm angle from part 1 of the experiment.
Knee extension torques and the summed quadriceps muscle activities (shown on the right y-axis) were normalised to the maximum knee extension torque and maximum summed quadriceps’ muscle activity level, respectively. P2 was excluded due to missing marker data.
Figure 4

Exemplar (n=1) squared patellar tendon (PT) shear-wave-speed-time (A, B, C), corrected knee extension torque-time (D, E, F), and normalised quadriceps muscle activity level-time traces (G, H, I) for the stretch-hold (blue) and fixed-end reference (green) contractions at the short (A, D, G), long (B, E, H), and very long (C, F, I) muscle lengths.
The vertical grey shaded areas show the time intervals where mean squared PT shear-wave speeds and corrected torques were analysed to evaluate rFEWS and rFETQ.
Figure 5
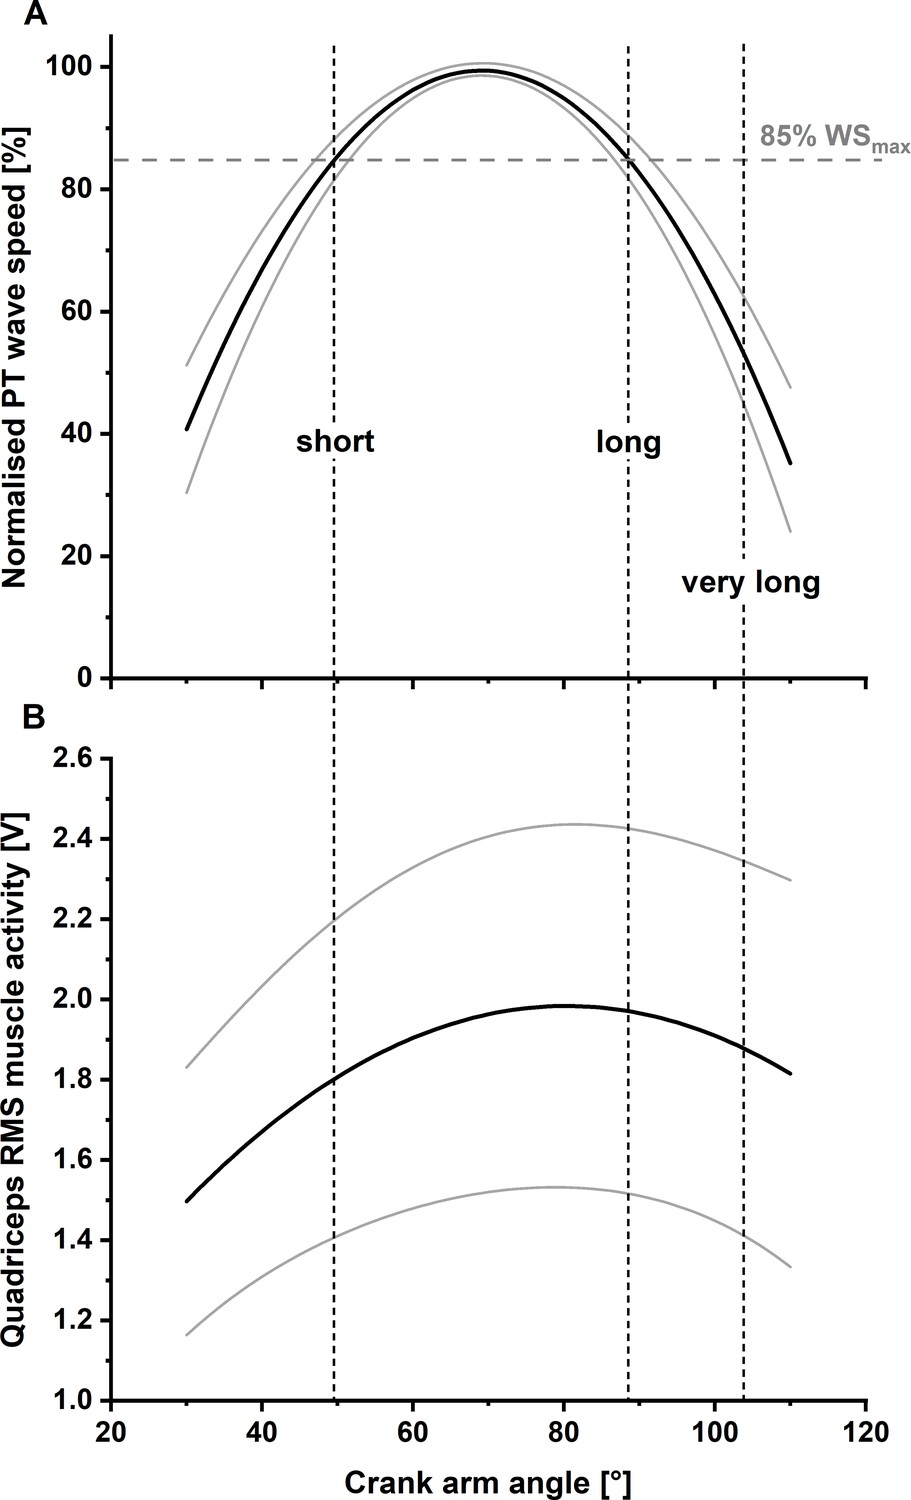
Solid lines indicate the mean normalised fitted relationship between patellar tendon (PT) shear-wave speed and knee flexion angle (Panel A) and mean fitted relationship between quadriceps’ muscle activity level and knee flexion angle (Panel B) across all participants (N=11) with lower and upper 95% confidence intervals (dashed lines).
Two different knee joint angles (i.e. the short and long muscle lengths), with a matched PT shear-wave-speed capacity (85% of maximum PT shear-wave speed), were selected as the target knee joint angles for the stretch–hold and fixed-end reference contractions. A third target knee joint angle, referred to as the ‘very long muscle length’, was defined as a crank-arm angle 15° more flexed than the crank-arm angle at the long muscle length.
Figure 6
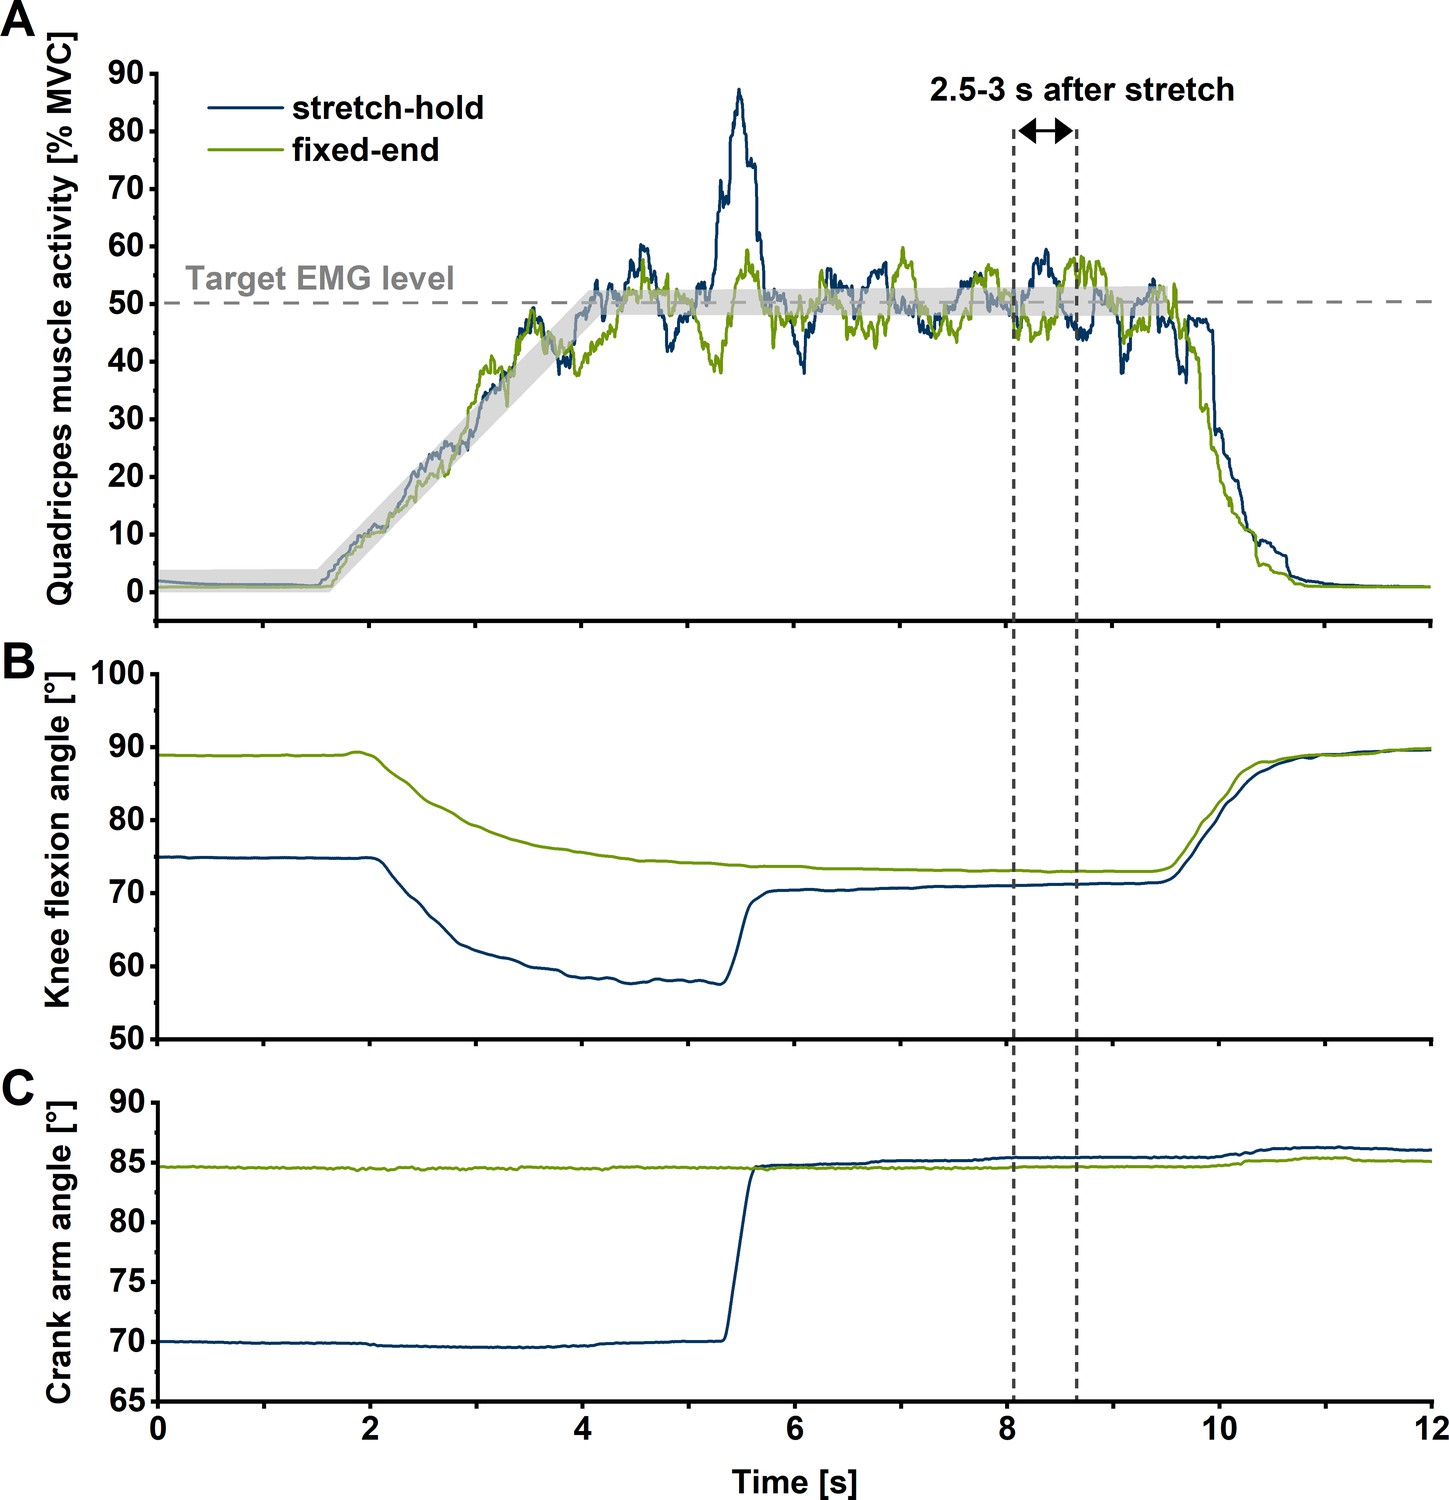
Exemplar (n=1) summed superficial quadriceps’ muscle activity level-time (A), knee flexion angle-time (B), and crank-arm angle-time traces during stretch-hold (blue line) and fixed-end reference (green line) contractions at the long muscle length.
For each muscle length condition, participants were instructed to match their quadriceps’ muscle activity level (calculated as a 250 ms centred root-mean-square amplitude) between two predefined traces 5% apart that ramped up to 50% of their angle-specific maximum over 3 s during both stretch-hold and fixed-end reference contractions. Outcome measures were analysed in the time interval from 2.5 to 3 s after stretch (vertical dotted lines), which corresponded to ~6 s after contraction onset in the stretch-hold and fixed-end reference contractions.
Figure 7
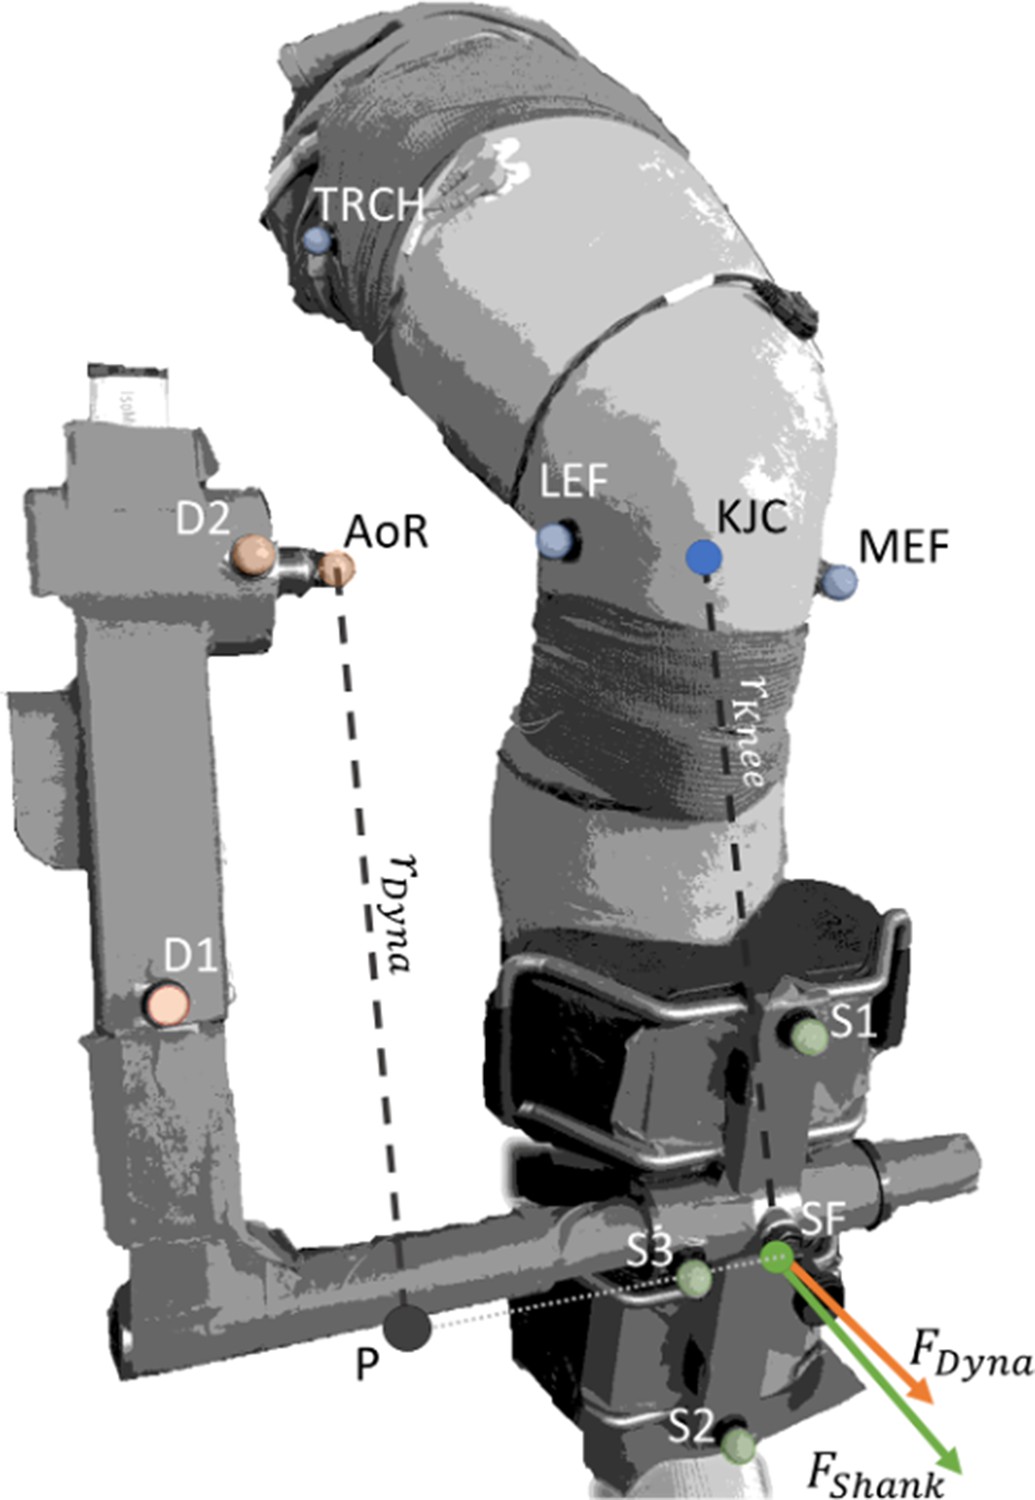
Corrected torque was calculated by multiplying the force acting at the shank () by the external moment arm to the knee ().
acted at the midpoint of the pad attached to the shank and was the perpendicular distance from the line of action of to the knee joint centre (KJC). was calculated by dividing the calculated dynamometer force () by the cosine of the angle between the two force vectors, and , whose respective directions were defined by the normal vectors of the planes formed by Shank Marker 1 (S1), S2, and S3, and Dynamometer Marker 1 (D1), D2, and the dynamometer’s axis of rotation (AoR). was calculated by dividing the measured torque at the dynamometer AoR by the external moment arm of the dynamometer (). was calculated as the distance between P and AoR. P was defined as the shortest distance between the projection of AoR onto the vector formed by S3 and the midpoint of the pad attached to the shank (SF). Transparent colored markers indicate captured markers, whereas solid marker KJC was calculated as the midpoint between the lateral and medial epicondyles of the femur (LEF and MEF, respectively), and solid marker SF was calculated as the midpoint between S1 and S2.
Tables
Table 1
Mean values and standard deviations for corrected knee extension torque, squared patellar tendon (PT) shear-wave speed, estimated PT force, normalised EMG amplitudes of the vastus lateralis (VL), vastus medialis (VM), rectus femoris (RF), and their sum, as well as VL fascicle length and fascicle stretch magnitudes during the stretch-hold contractions compared with the time-matched fixed-end reference contractions at the short, long, and very long muscle lengths.
| Muscle length | Short | Long | Very long | |||
|---|---|---|---|---|---|---|
| Contraction condition | Stretch-hold | Fixed-end | Stretch-hold | Fixed-end | Stretch-hold | Fixed-end |
| Knee extension torque (Nm) | 210.1±48.6 | 207.8±53.1 | 253.7±32.2* | 236.0±26.3 | 210.8±29.0* | 188.9±24.1 |
| PT shear-wave speed (ms–1)2 | 3900±2770 | 3677±2703 | 2872±1179 | 2775±1215 | 2601±1554* | 1800±846 |
| Estimated PT force (N) | 4321±1012 | 4272±1108 | 5365±687 | 5078±564 | 4804±774 | 4321±619 |
| VL EMG amplitude (% MVC) | 44.65±5.78 | 45.35±6.50 | 43.12±4.19 | 43.62±5.05 | 43.68±5.70 | 43.38±4.15 |
| VM EMG amplitude (% MVC) | 41.68±5.25 | 44.04±5.95 | 43.80±4.84 | 43.50±4.26 | 42.70±4.28 | 43.59±4.21 |
| RF EMG amplitude (% MVC) | 51.60±10.86 | 52.53±10.60 | 48.86±8.66 | 52.12±7.75 | 45.26±6.98 | 48.44±8.19 |
| Summed EMG amplitude (% MVC) | 46.91±2.35 | 48.08±3.14 | 46.84±2.06 | 47.86±1.87 | 47.17±3.30 | 48.22±2.77 |
| VL fascicle length (mm) | 99±34 | 99±34 | 122±24 | 124±24 | 142±36 | 143±35 |
| VL fascicle stretch (mm) | 3.7±2.1 | 6.0±1.8 | 6.3±2.8 | |||
-
*
Significantly different to fixed-end reference condition at p<0.05. MVC, maximal voluntary contraction.
Additional files
Download links
A two-part list of links to download the article, or parts of the article, in various formats.
Downloads (link to download the article as PDF)
Open citations (links to open the citations from this article in various online reference manager services)
Cite this article (links to download the citations from this article in formats compatible with various reference manager tools)
Residual force enhancement is affected more by quadriceps muscle length than stretch amplitude
eLife 11:e77553.
https://doi.org/10.7554/eLife.77553


