Rate-limiting transport of positively charged arginine residues through the Sec-machinery is integral to the mechanism of protein secretion
- School of Biochemistry, University of Bristol, University Walk, United Kingdom
- School of Chemistry, University of Bristol, University Walk, United Kingdom
- Department of Microbiology and Immunology, University of Otago, New Zealand
Figures
Figure 1 with 1 supplement
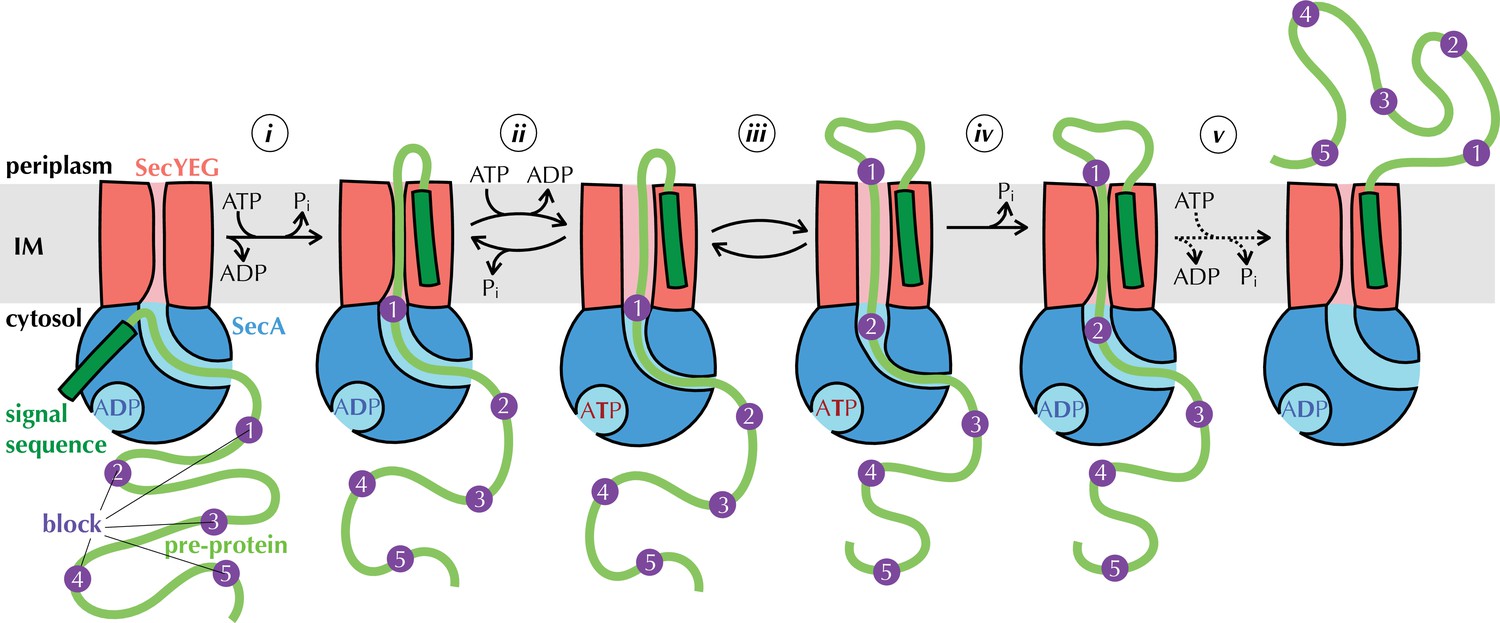
The Brownian ratchet model.
Mechanism of pre-protein transport, based on Allen et al., 2016. Cycles of ATP binding and hydrolysis by SecA (blue) allow blocks (purple) in the pre-protein substrate (green) to diffuse outwards through SecYEG (red) one at a time, but backsliding is prevented, leading to directional transport. See text for more detail.
Figure 1—figure supplement 1
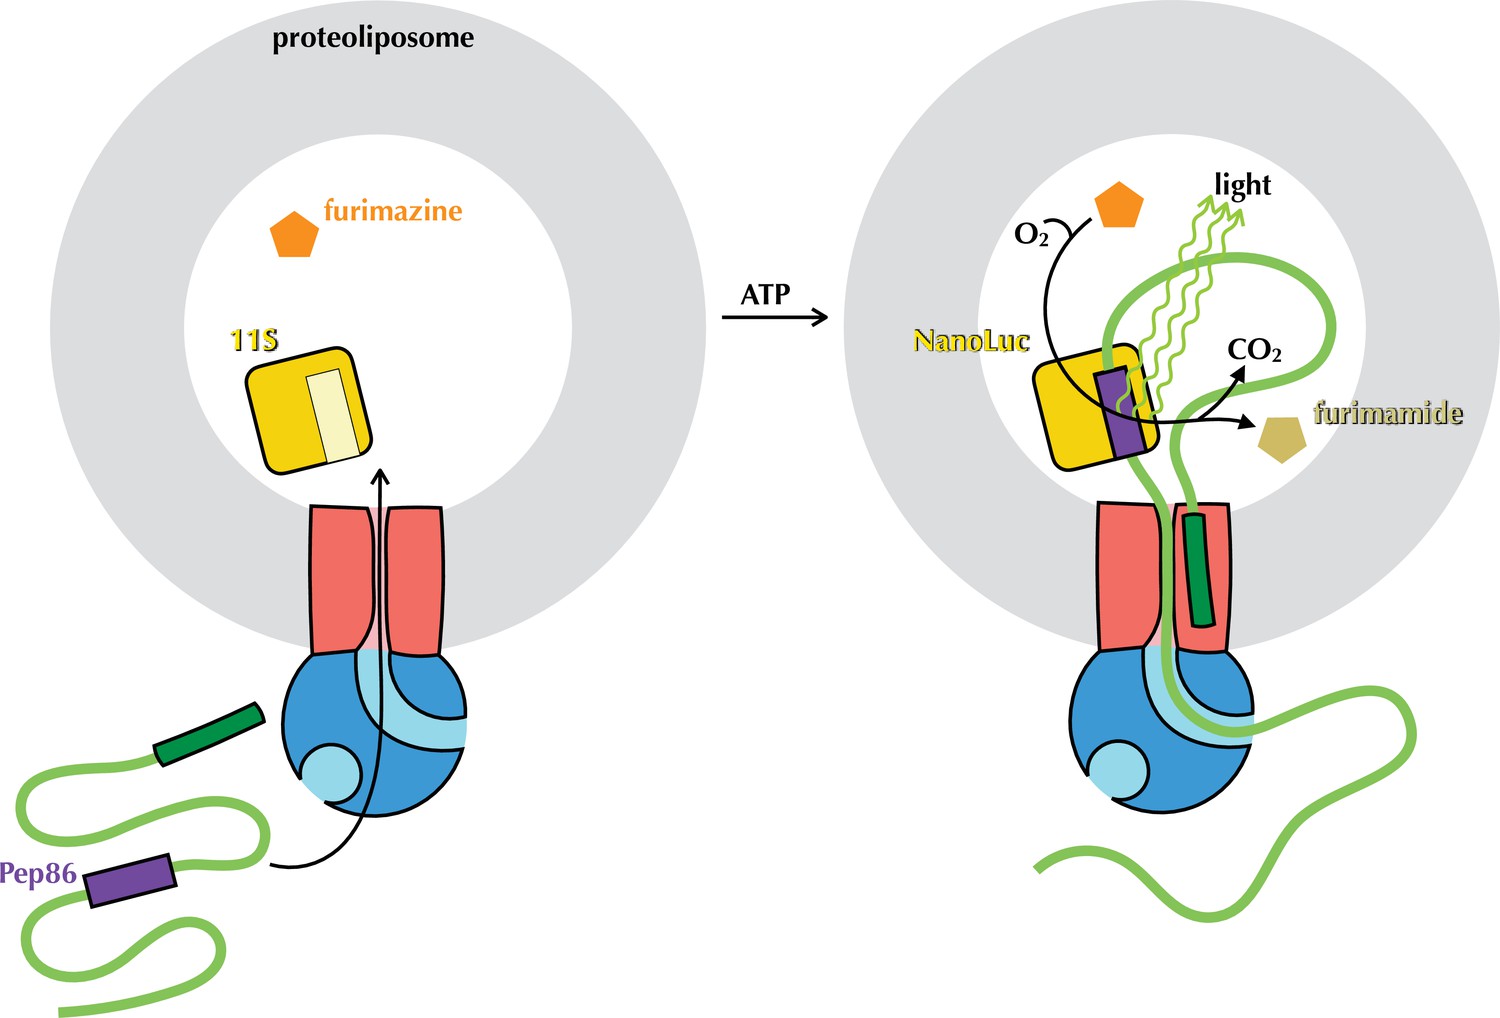
The NanoLuc pre-protein transport assay.
Proteoliposomes (grey) with encapsulated 11S (yellow) and SecYEG in the membrane (red) are supplied with SecA (blue), pre-protein (green) containing pep86 (purple) and furimazine (orange). Upon addition of ATP, pre-protein is imported into the PLs, allowing pep86 to complement 11S, poducing NanoLuc. This gives a luminescence signal proportional to the amount of NanoLuc formed, for as long as furimazine and O2 remain in large excess over furimamide and CO2.
Figure 2 with 2 supplements
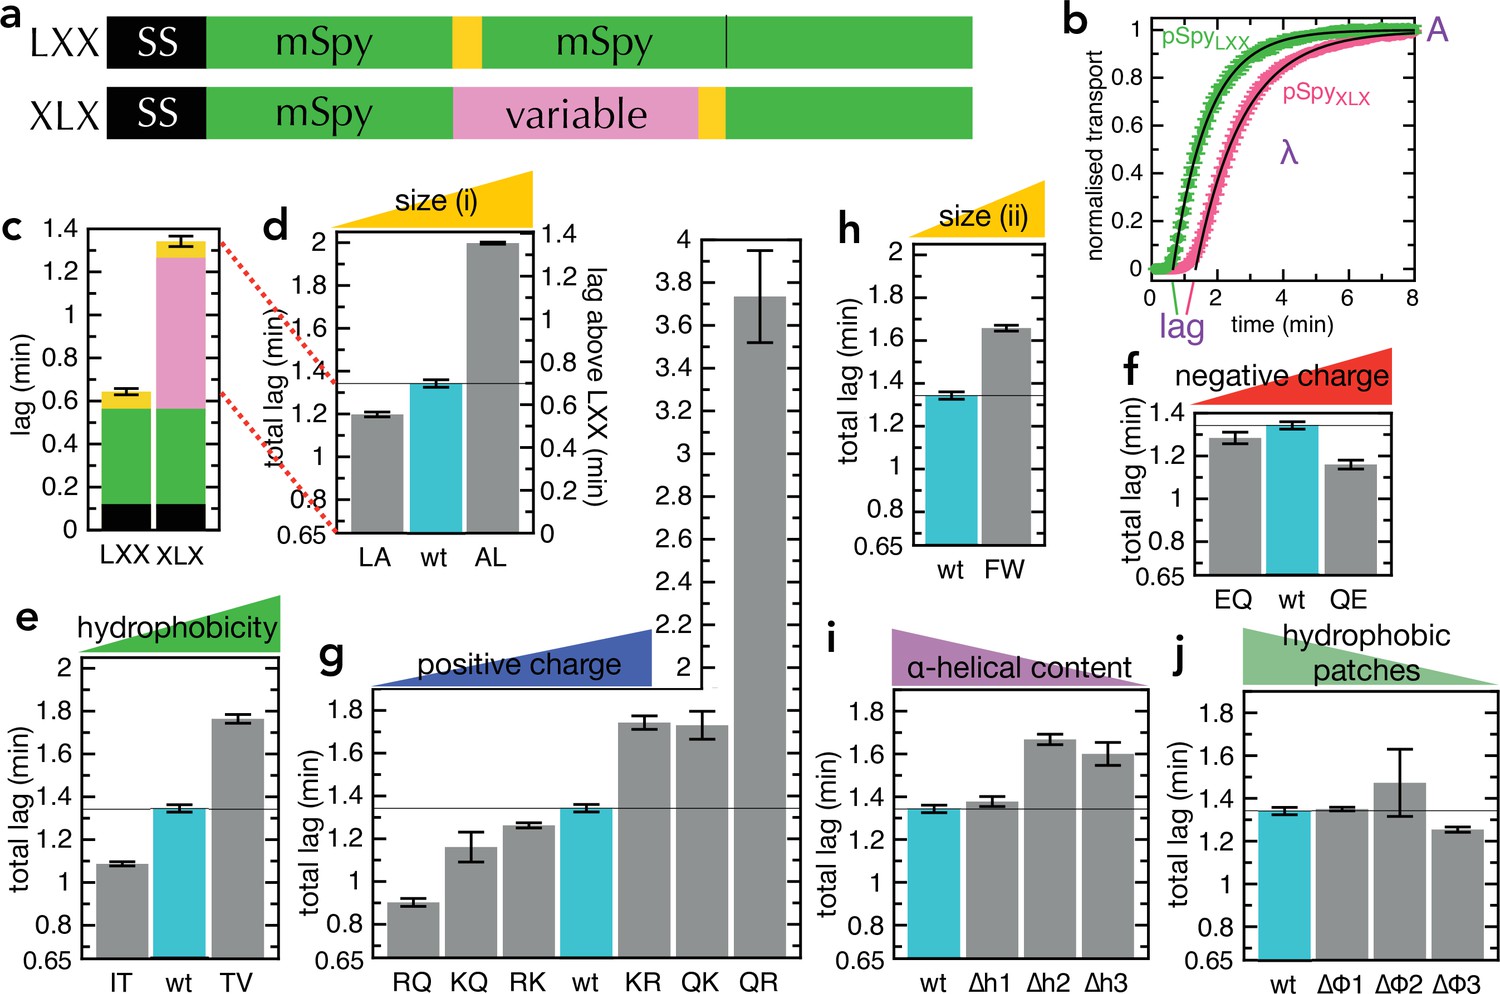
Transport of pSpyXLX variants.
(a) Schematic of pSpyLXX (LXX) and pSpyXLX (XLX). Transport occurs from the N- to C-terminus (left to right), and a luminescence signal appears as soon as pep86 (yellow) enters the lumen of the PL. In these constructs 'X' refers to mSpy with no pep86, and 'L' refers to mSpy followed by a functional (Light) pep86. (b) Transport traces of pSpyLXX (green) and pSpyXLX (pink), normalised to give an amplitude (A; signal when the transport reaction reaches completion) of 1, and fitted to the simple lag +single exponential model (Allen et al., 2020). In this model, lag is the minimum time required for pre-protein transport, and corresponds to the sum of time constants for all transport steps (equal to 1/k, where k is the rate constant for that step). λ is a complicated variable, incorporating the transport rates but also the probability of transport pausing or failure and resetting (see Allen et al., 2020 for more details). Data are the average and SEM from three (pSpyLXX) or 11 (pSpyXLX) experimental replicates. (c) Lag (taken from panel b) for pSpyLXX and pSpyXLX. (d-j) Lags for a range of pSpyXLX variants, where the central mSpy has its chemical and physical properties varied (see text for details; wt (wild type) is native Spy). In each case, the y-axis starts at the transport time for pSpyLXX, so the visible part of the bar corresponds to the transport time only of the variable region. Data show the average and SEM from three experimental replicates. Almost all the variants are statistically significant from wt; a table of p-values is included in Supplementary file 3a.
-
Figure 2—source data 1
- https://cdn.elifesciences.org/articles/77586/elife-77586-fig2-data1-v3.xlsx
Figure 2—figure supplement 1
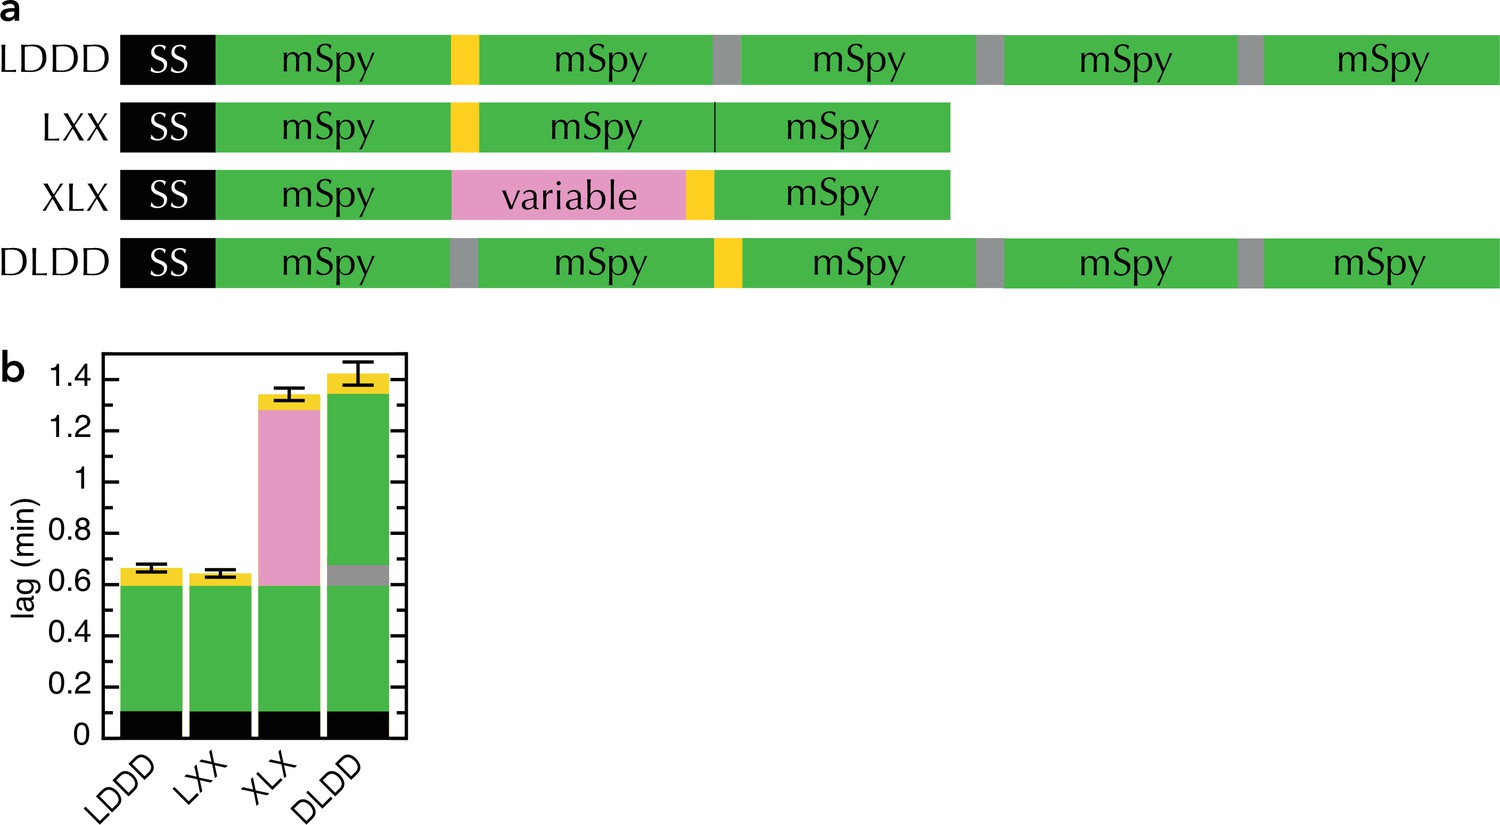
Comparison of new and old transport substrates.
(a) Schematic of pSpyLXX, pSpyXLX, pSpyLDDD and pSpyDLDD, as in Figure 1a, where 'D' refers to mSpy followed by an inactive (Dark) pep86 (Allen et al., 2020). (b) Transport lags for the pSpy variants in panel (a). Those for pSpyLXX and pSpyXLX are the same as in Figure 2c (i.e. average and SEM of 3 and 11 replicates, respectively), while those for pSpyLDDD and pSpyDLDD are taken from Allen et al., 2020 (i.e average and SEM of 8 repeats).
Figure 2—figure supplement 2
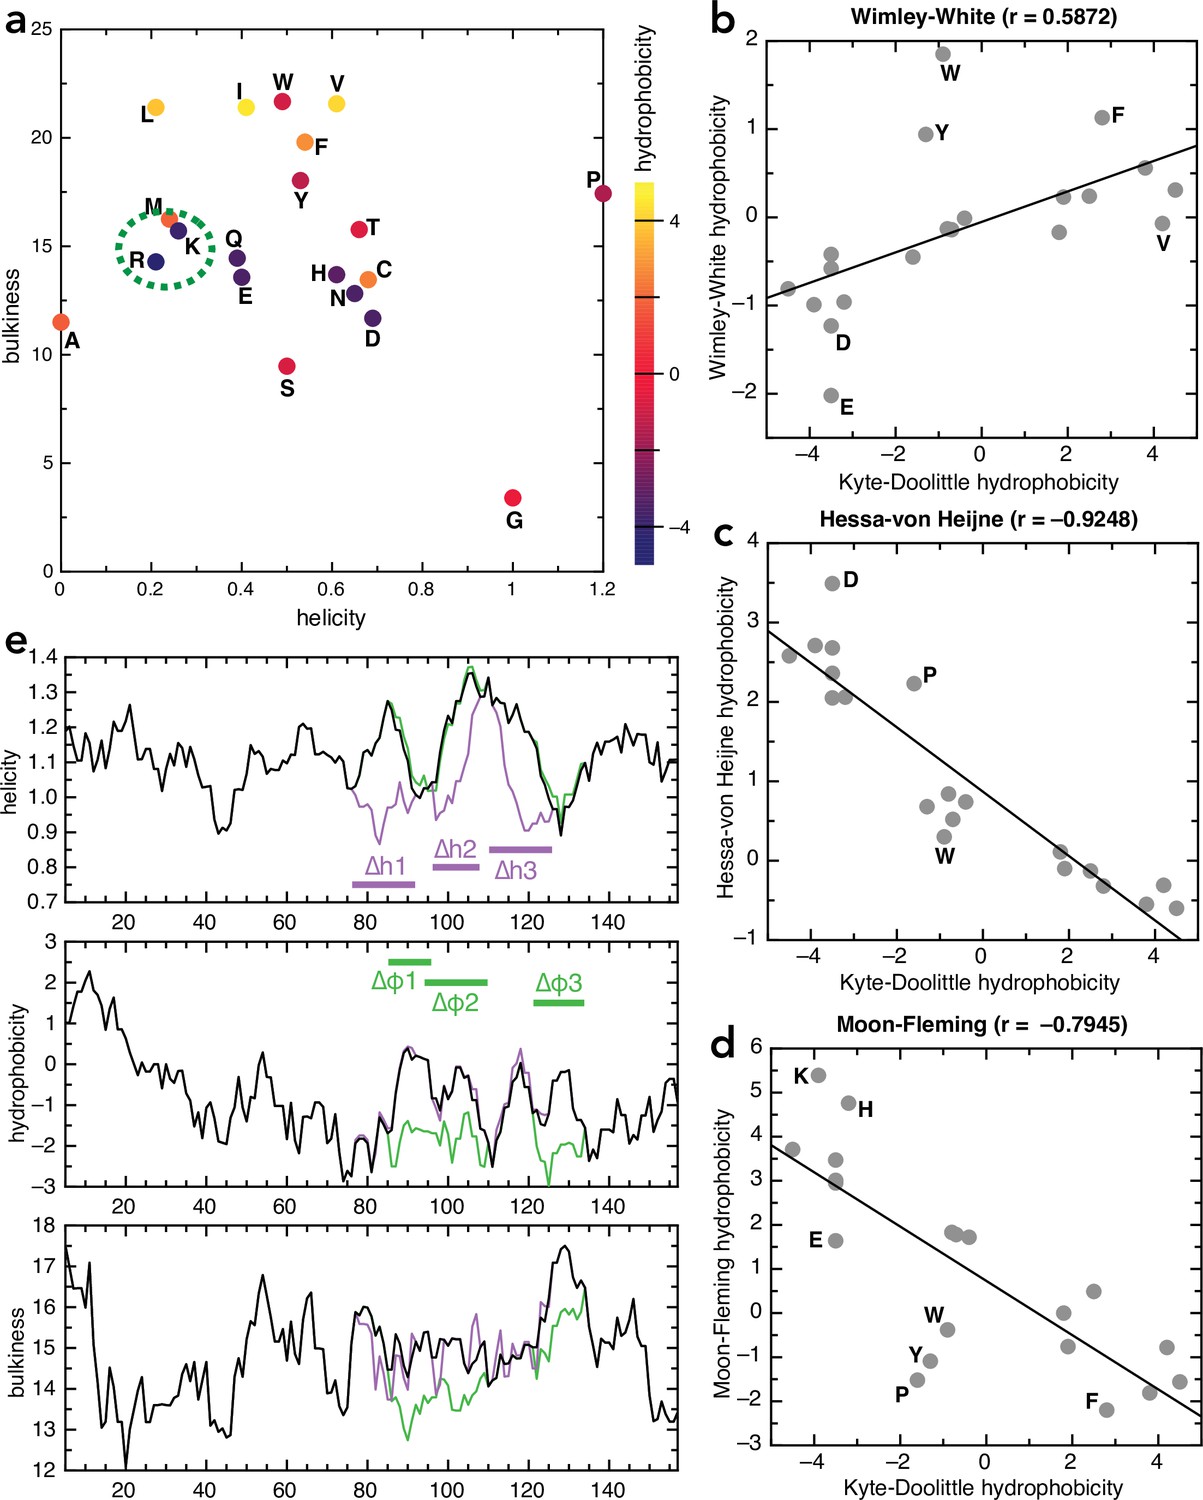
Amino acid and sequence properties.
(a) Plot of all 20 naturally encoded amino acid by hydrophobicity (scale from Kyte and Doolittle, 1982), helical propensity (scale from Deléage and Roux, 1987) and bulkiness (scale from Zimmerman et al., 1968). (b–d) Comparison of different hydrophobicity scales, determined empirically for membrane proteins, with the Kyte-Doolittle scale: (b) Wimley-White (Wimley and White, 1996), (c) Hessa-von Heijne (Hessa et al., 2005), and (d) Moon-Fleming (Moon and Fleming, 2011). Outliers are marked on the plots; in general the scales correlate well, with differences mainly in the aromatic residues. (e) Plots of helicity (top), hydrophobicity (middle), and bulkiness (bottom) of native pSpy (black) and the helicity (purple) and hydrophobicity (green) variants, as a function of sequence position, averaged over a window of nine amino acids. Calculations performed using ProtScale on the Expasy portal, using the same scales as in panel (a).
Figure 3 with 3 supplements
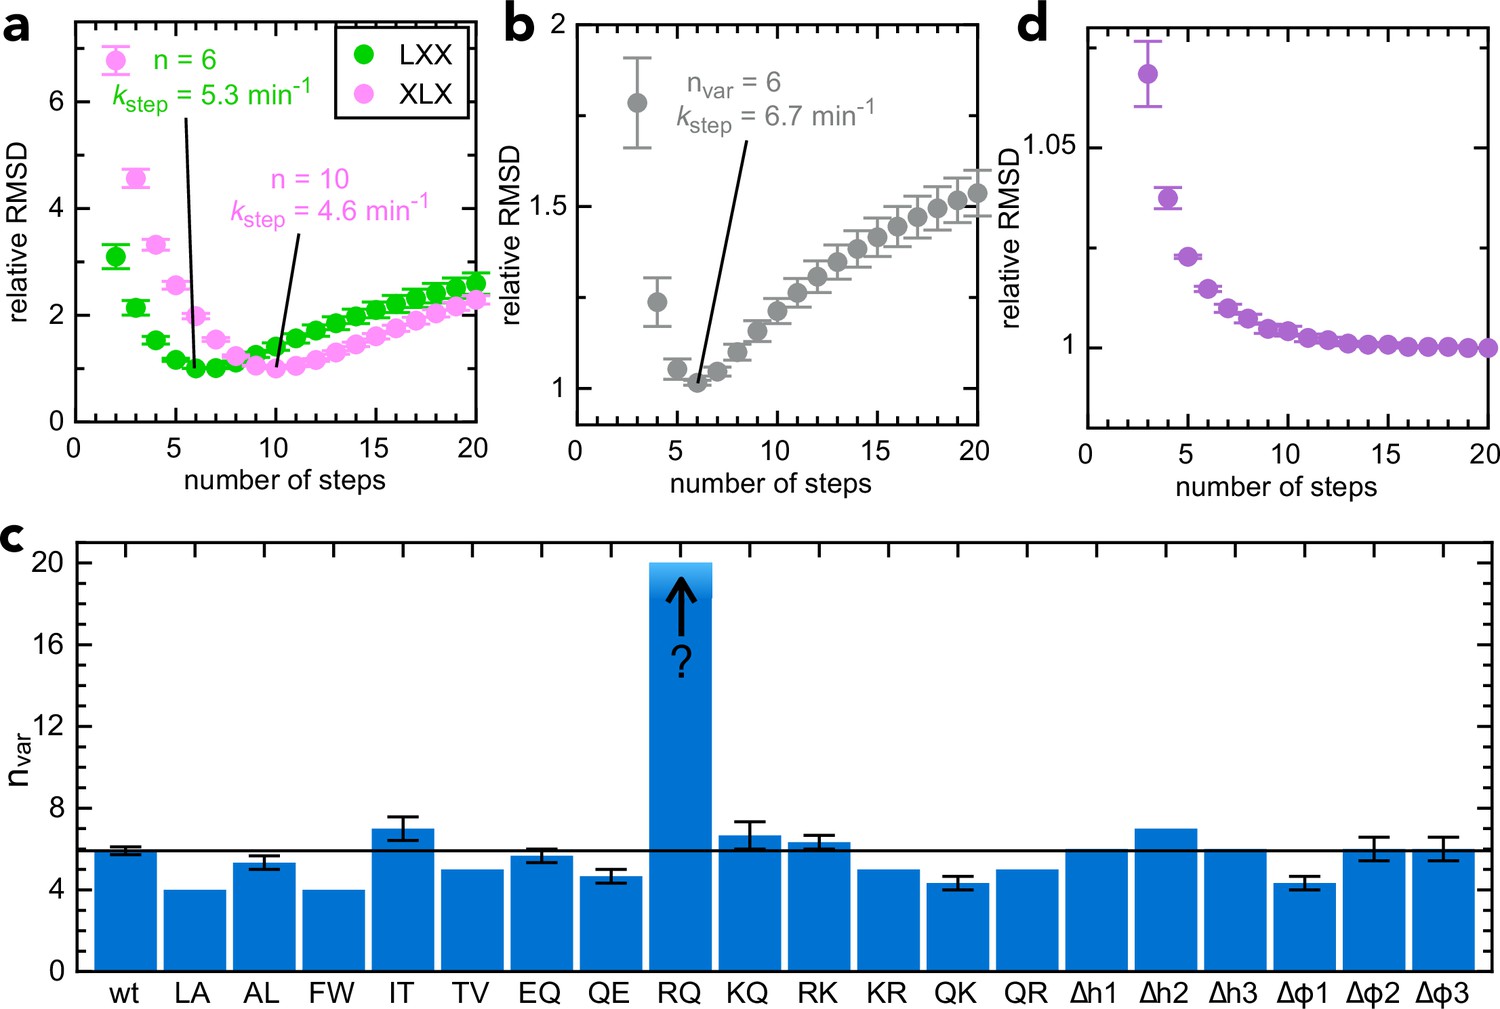
Determining step size for the variable mSpy regions.
(a) RMSD (normalised to its lowest value) for fits to the experimental transport data to the original transport model (see Figure 3—figure supplement 1a and Allen et al., 2020), over a range of values for n (number of steps), using Berkeley Madonna. Error bars are the SEM from 4 (pSpyLXX) or 12 (pSpyXLX) replicates. Values for other fixed parameters are kblock = 0.31 min–1 (determined previously; Allen et al., 2020, kon = 0.96 µM–1.min–1 see Figure 3—figure supplement 2a) and koff = 0.085 min–1 (see Figure 3—figure supplement 2b). Best fits are to 6 steps for pSpyLXX (green; kstep = 5.31 ± 0.05 min–1) and 10 steps for pSpyXLX (pink; kstep = 4.57 ± 0.15 min–1). (b) RMSD (normalised to its lowest value) for fits of experimental transport data for pSpyXLX to the model in Figure 3—figure supplement 1b, over a range of values for nvar. All parameters other than kstep,var, kfail,var and brightness are fixed to the same values as in panel (a). The best fit is to nvar = 6, kstep,var = 6.74 ± 0.24 min–1. (c) Best fit nvar for each of the pSpyXLX variants in Figure 2d–j, calculated as in panel (b), but with brightness adjusted for the values in Figure 3—figure supplement 3 (see text for details), and kblock,var allowed to float. Errors are the SEM from 12 (wt) or 3 (all others) replicates. (d) Normalised RMSD as a function of nvar for pSpyXLXR→Q (all parameters as in panel c).
Figure 3—figure supplement 1
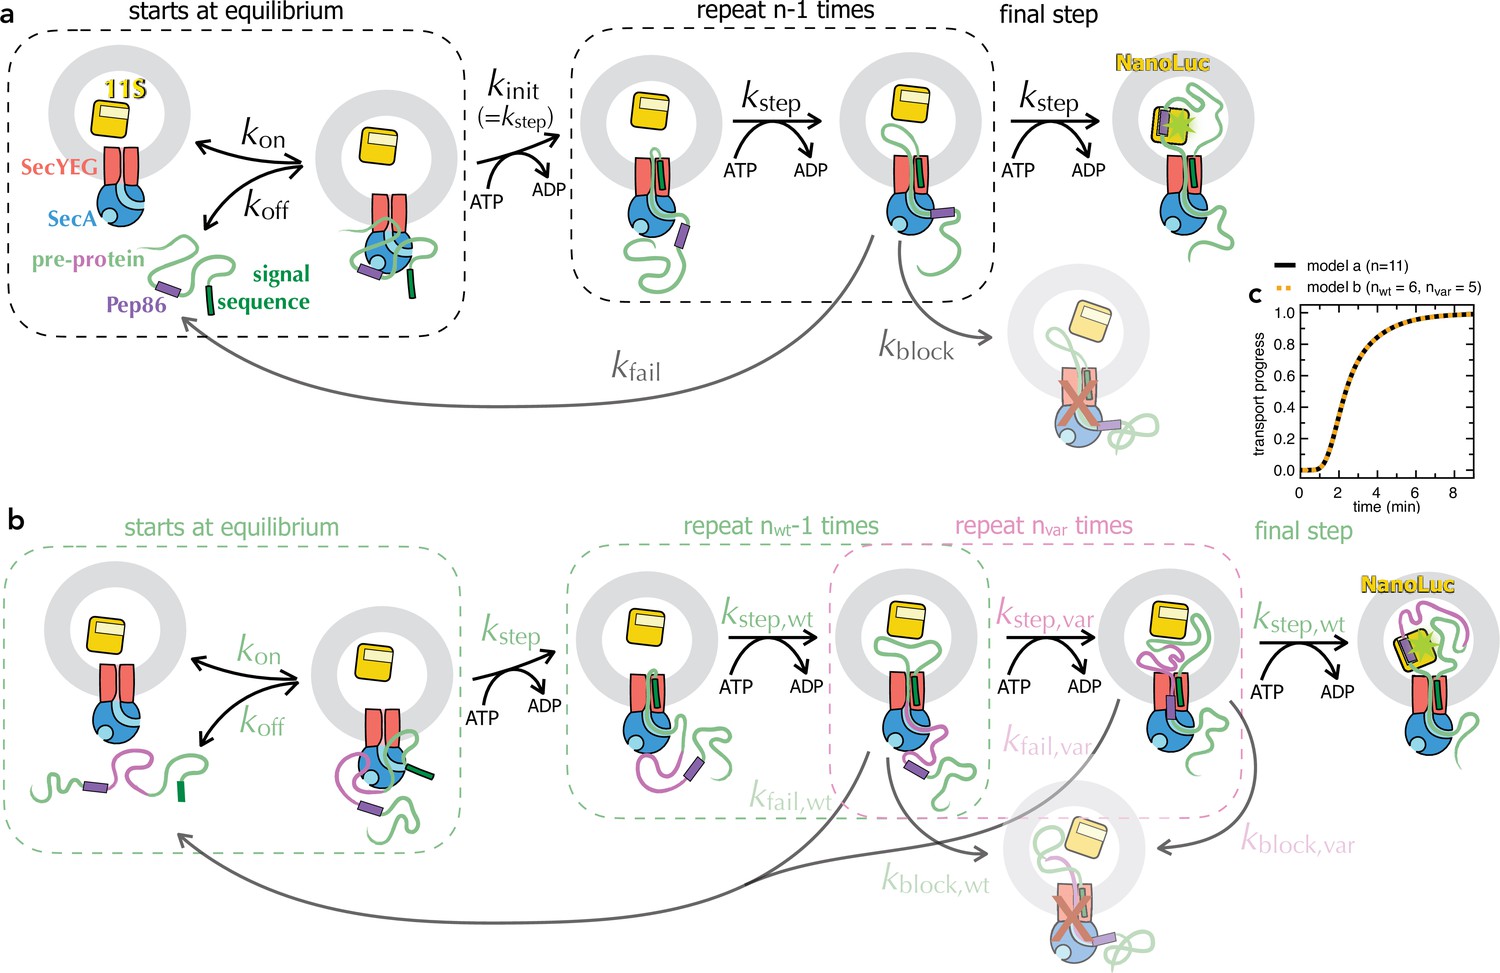
Schematic representations of numerical models.
(a) Minimal model for transport of pre-protein through the Sec system (Allen et al., 2020). Before the addition of ATP, pre-protein associates with SecYEG and SecA, with an affinity dependent on both the SS and mature domain of the preprotein (Kd ~0.6 µM for native proSpy, Allen et al., 2020). Starting the reaction with ATP allows transport to initiate (kinit, equal to kstep), followed by a number (n) of steps, each with the rate kstep. As soon as Pep86 enters the PL it binds to 11S, producing the luminescent signal. Because there are multiple sequential steps before NanoLuc formation, the transport signal begins to appear after a characteristic lag, equal to kinit + n × kstep (Allen et al., 2020). Not every transport event that initiates goes on to produce a functional NanoLuc. At any point, transport can fail: either dissociating and requiring reinitiation (kfail); or permanently, blocking the channel and preventing further transport (kblock). In the case of proSpy, each SecYEG appears only to transport a single pre-protein – so the total signal amplitude depends on the number of SecYEG import sites, and the relative rates of transport and kblock (Allen et al., 2020). Thus, simple analysis of the NanoLuc traces can provide estimates for the rate of transport and its success rate. (b) Extended transport model, separating out transport of the second mSpy of pSpyXLX (pink) from all the other steps (binding, initiation and transport of a single mSpy and Pep86; green). For fitting, all parameters in green are fixed at the values determined from pSpyLXX. Brightness is fixed to relative to the wild type pSpyXLX according to the values determined in solution (Figure 3—figure supplement 3a-f, turquoise bars). The three remaining rate constants (kblock,var, kstep,var and kfail,var) are allowed to float, and nvar is varied systematically. This model is defined for Berkeley Madonna in Supplementary file 2. As long as the wt and var rate constants are all kept the same, model (a) is identical to model (b) if n in a is equal to nwt +nvar in b (see panel c). (c) Simulated transport curves using the original model (panel a) with n = 11 (black solid line), or the split model (panel b) with nwt = 6 and nvar = 5 (orange dotted line), and all other parameters kept the same. The fact that these overlay perfectly confirms that the no errors were introduced in extending the model.
Figure 3—figure supplement 2
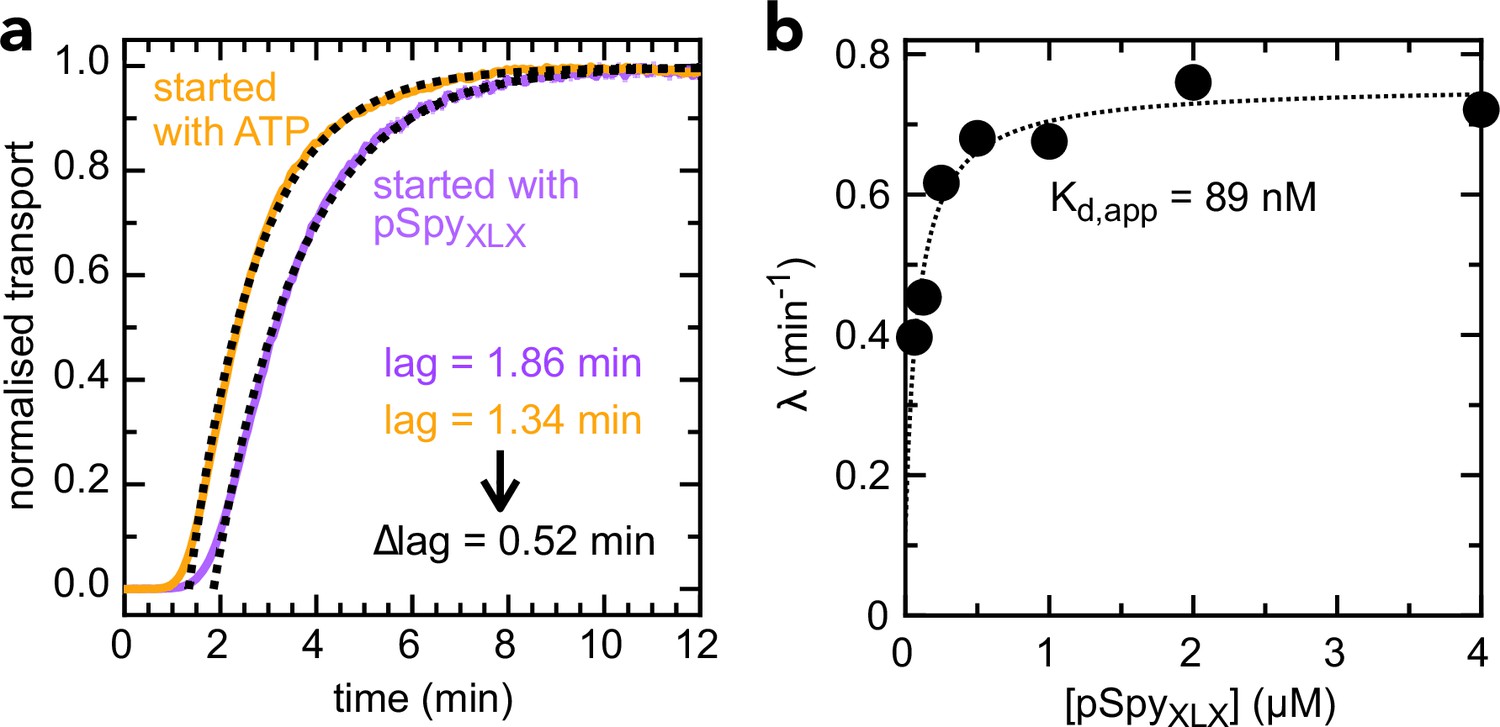
Determination of kon and koff values for pSpyXLX.
(a) Transport of 2 µM pSpyXLX initiated either by the addition of ATP (orange line) or pSpyXLX (purple line), along with fits (black dotted lines). The difference in lag (0.52 min) corresponds to the time it takes for pSpyXLX to associate with SecYEG-SecA, i.e. kon–1 (see Allen et al., 2020 for details). This gives kon = 0.96 µM–1.min–1, very similar to the value previously determined for native pSpy (kon = 1.25 µM–1.min–1 [Allen et al., 2020]): not surprising, given that this interaction is driven primarily by signal sequence and early mature domain which are identical in both proteins. (b) λ (the exponential component of the fit, see Allen et al., 2020) as a function of pSpyXLX concentration. Fitting to a simple weak binding equation (λ = λ0 + [pSpyXLX] ÷ ([pSpyXLX] + Kd)) gives a good approximation of Kd for the pSpyXLX–Sec interaction, as it reflects the starting equilibrium of the binding step (see Figure 3—figure supplement 1a and Allen et al., 2020). From the best fit value (Kd = 0.089 µM) and kon (0.96 µM–1.min–1, panel a), we estimate koff = 0.085 min–1 (from the definition Kd = koff ÷ kon).
-
Figure 3—figure supplement 2—source data 1
Raw data for Figure 3—figure supplement 2a.
- https://cdn.elifesciences.org/articles/77586/elife-77586-fig3-figsupp2-data1-v3.xlsx
-
Figure 3—figure supplement 2—source data 2
Raw data for Figure 3—figure supplement 2b.
- https://cdn.elifesciences.org/articles/77586/elife-77586-fig3-figsupp2-data2-v3.xlsx
Figure 3—figure supplement 3
Comparison of signal amplitudes for NanoLuc transport vs solution binding.
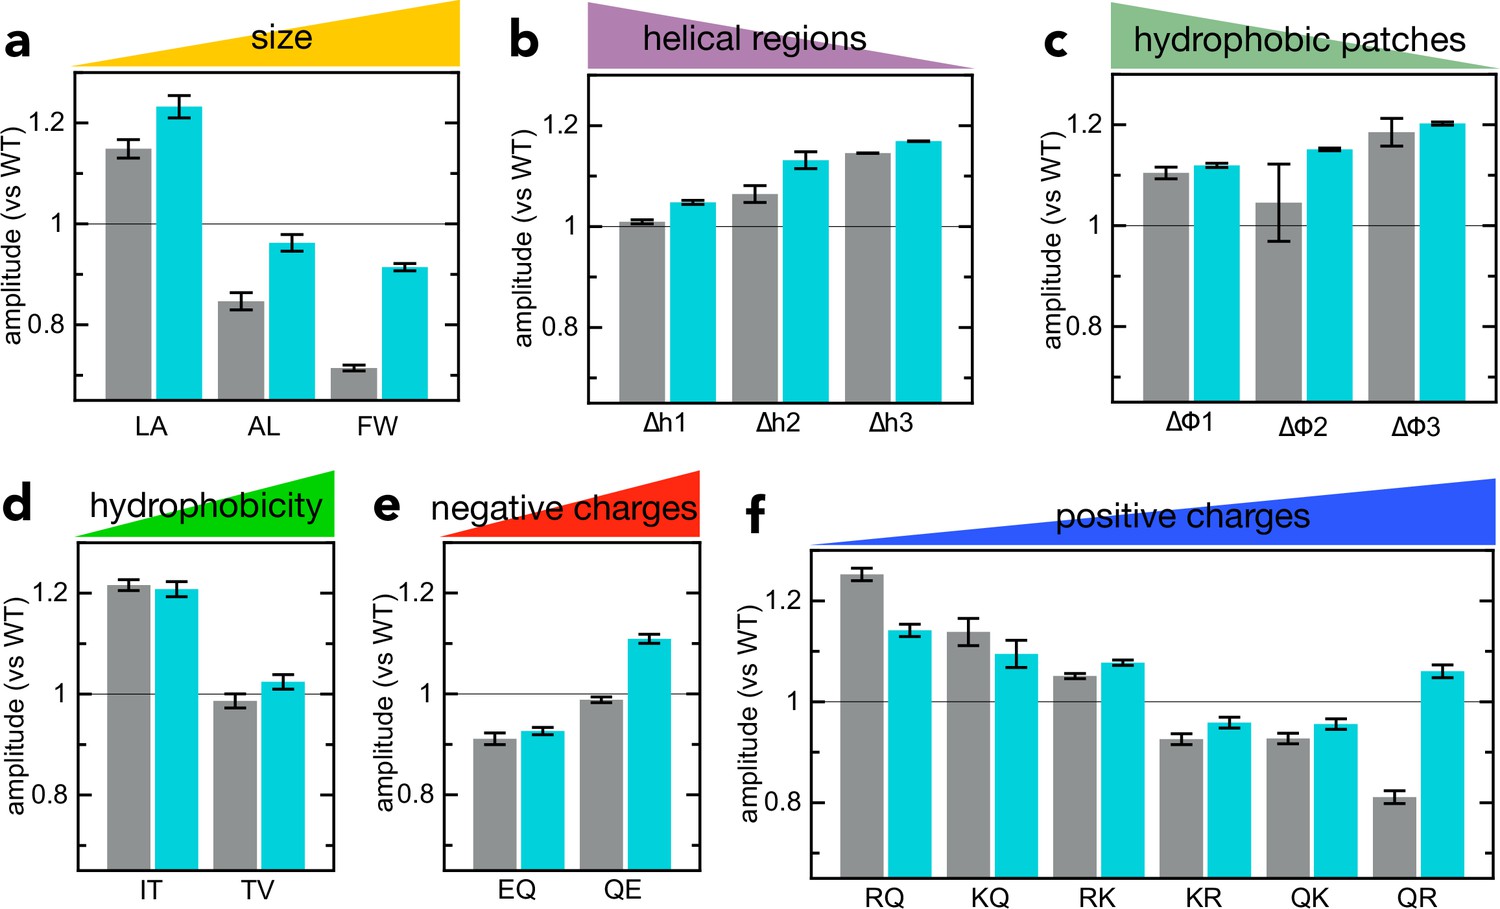
(a–f) Grey bars: amplitudes for the import of the various pSpyXLX variants (same primary data as in Figure 2), normalised to the amplitude of native pSpyXLX (measured on the same plate in the same experiment). Turquoise bars: amplitude for binding of 2 µM of each pSpyXLX variant to 20 pM 11S free in solution. In each case, the signal from 20 pM 11S with only buffer is subtracted, and the amplitude normalised to the value of native pSpyXLX (both measured on the same plate in the same experiment). Error bars are the SEM from four experimental replicates (eight for native pSpyXLX and pSpyLXX). With a few exceptions, transport and binding amplitude correspond well, indicating that differences in amplitude are due to differences in the luminescence of NanoLuc (brightness in the model in Figure 3—figure supplement 1).
-
Figure 3—figure supplement 3—source data 1
Raw data for Figure 3—figure supplement 3.
- https://cdn.elifesciences.org/articles/77586/elife-77586-fig3-figsupp3-data1-v3.xlsx
Figure 4
Computational analysis of pre-protein engaged in SecYEG.
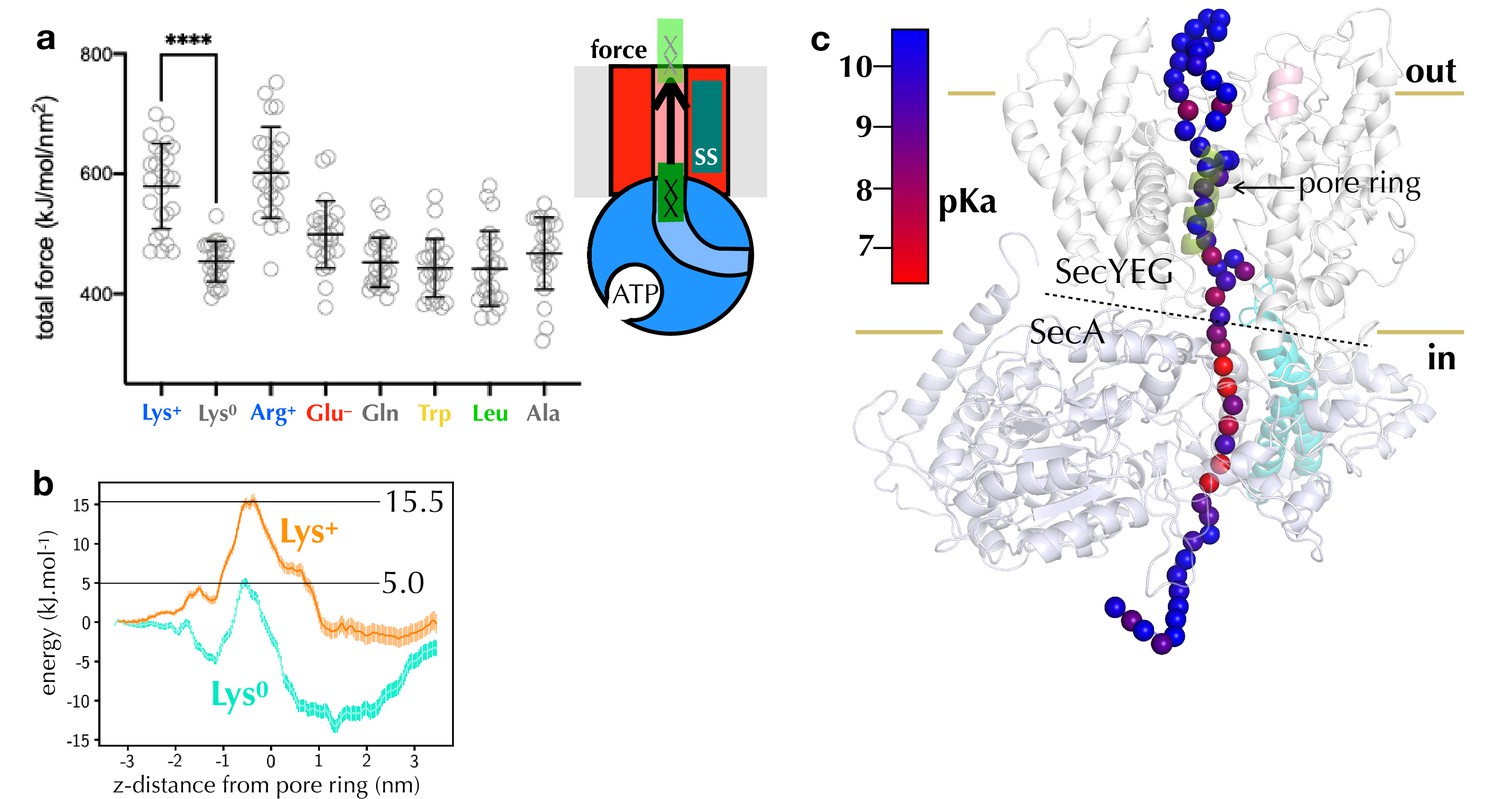
(a) Pulling forces for regions of polypeptide containing different residues of interest to pass the SecY pore, as determined using steered MD. Plotted are the integrated forces along the pull coordinated, with 24 repeats for each residue. The mean and standard deviations are shown. (b) Potential of mean force pathways for a short region of peptide with either protonated (Lys+) or deprotonated (Lys0) present passing through the SecY pore. These systems were built using the Martini force field. (c) pKa scanning data for lysine residues at different positions along the substrate. Alpha-carbon positions of the substrate are shown as spheres, and coloured according to their calculated pKa.
-
Figure 4—source data 1
Raw data for panel a.
- https://cdn.elifesciences.org/articles/77586/elife-77586-fig4-data1-v3.xlsx
-
Figure 4—source data 2
Raw data for panel b.
- https://cdn.elifesciences.org/articles/77586/elife-77586-fig4-data2-v3.xlsx
Figure 5
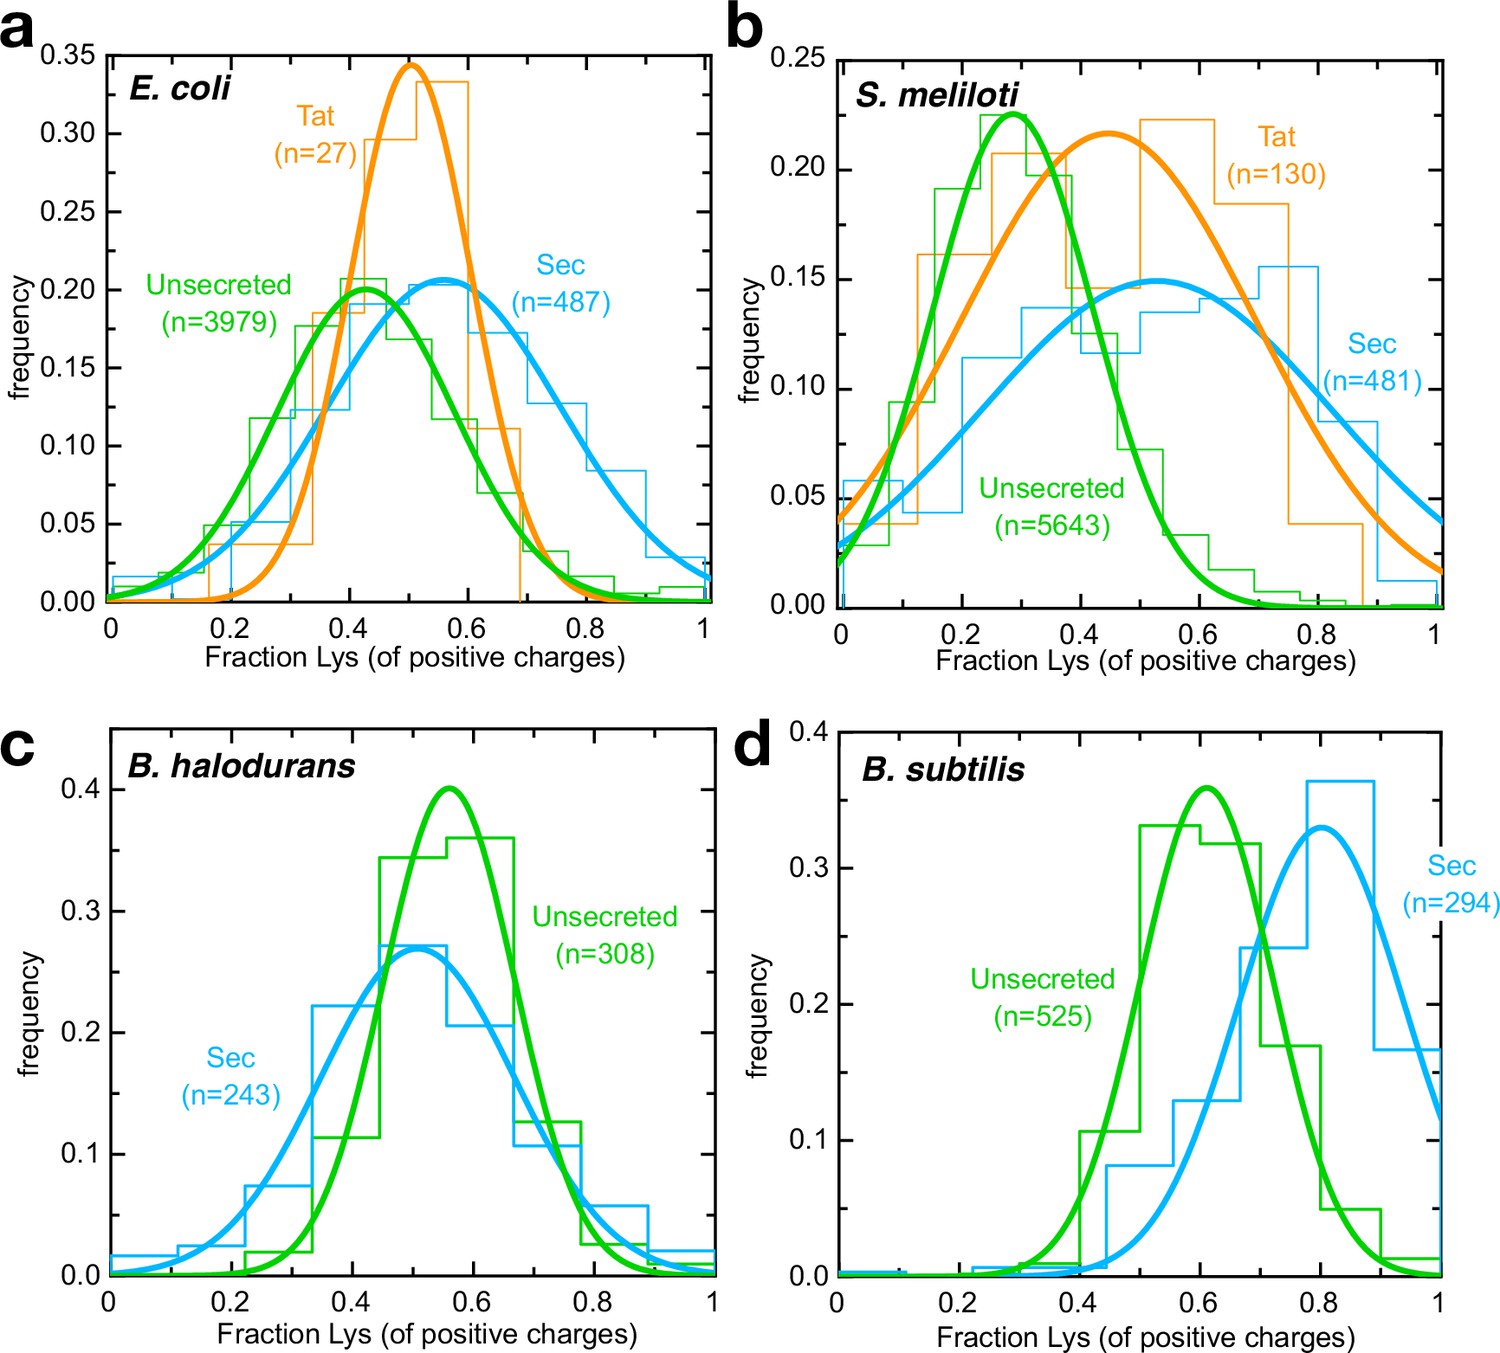
Arginines are selected against for secretion by neutrophiles.
(a–d) Histograms (fine lines) showing fraction of positive residues that are lysine in cytosolic proteins (green), Sec substrates (blue) and Tat substrates (orange; panels a,b only), for (a) E. coli, (b) S. meliloti, (c) B. halodurans and (d) B. subtilis. Best fit single Gaussians are also shown (thick lines) for clarity. All differences are statistically significant except for E. coli Tat substrates; p-values are shown in Supplementary file 3c.
-
Figure 5—source data 1
Binned Lys/Arg ratios for Figure 5.
- https://cdn.elifesciences.org/articles/77586/elife-77586-fig5-data1-v3.xlsx
Figure 6 with 2 supplements

PMF stimulates transport primarily via ∆ψ.
(a) Transport of pSpy-pep86 into PLs (pink), HB1 IMVs (lacking ATP synthase; green) and BL21 IMVs in the presence of valinomycin and nigericin (grey). Data points and their heights represent the average and SEM from three (PLs), six (HB1) and six (BL21) experimental replicates. Best fit lags (zoomed in for clarity) are shown as an inset; none of the differences in lag are statistically significant as determined by a two-tailed t-test (p = 0.69, 0.31 and 0.20, for PLs-HB1, PLs-BL21, and HB1-BL21, respectively). (b) Transport of pSpy-pep86 into BL21 IMVs in the presence of DMSO (orange), valinomycin (blue), nigericin (green), or both ionophores (grey). Data points and their heights represent the average and SEM from six replicates, and lines show the best fit to the single exponential + lag model. Best fit lags are shown inset, and all ionophores have a statistically significant effect on lag as determined by a two-tailed t-test (p = 0.0015, 0.00041 and 3.6 × 10⁻⁷ for nigericin, valinomycin and both, respectively). (c) Comparison of the proton-motive force (PMF, grey) and its two components (∆ψ, red and ∆pH, blue), generated by whole cells and inverted membrane vesicles (IMVs), in BL21(DE3) cells both normal and overexpressing SecYEG. Error bars indicate the standard deviation from three biological replicates (for cells) or three technical replicates (for IMVs). Underlying data and statistics shown in Supplementary file 3d; note that only total PMF in pBAD cells vs IMVs is statistically different (p = 0.0084). (d) Lags for import of the pSpy4x series as a function of active pep86 position, into BL21 IMVs at pH 6 (red), 7 (green), and 8 (blue). Data and error bars are the average and SEM from three replicates. (e) As in panel (d), but with HB1 IMVs.
-
Figure 6—source data 1
Raw data for Figure 6a–b, and Figure 6—figure supplement 1.
- https://cdn.elifesciences.org/articles/77586/elife-77586-fig6-data1-v3.xlsx
-
Figure 6—source data 2
Raw data for Figure 6c.
- https://cdn.elifesciences.org/articles/77586/elife-77586-fig6-data2-v3.xlsx
-
Figure 6—source data 3
Raw data for Figure 6d.
- https://cdn.elifesciences.org/articles/77586/elife-77586-fig6-data3-v3.xlsx
-
Figure 6—source data 4
Raw data for Figure 6e.
- https://cdn.elifesciences.org/articles/77586/elife-77586-fig6-data4-v3.xlsx
Figure 6—figure supplement 1

Exactly as in Figure 6b, but with HB1 IMVs instead of BL21 IMVs.
In this case, inhibitors have little or no effect on the kinetics of import.
Figure 6—figure supplement 2

Additional transport data for the pSpy4x series.
(a–c) Transport lag for the LDDD series in the presence of DMSO (orange), nigericin (green), valinomycin (blue) or nigericin and valinomycin together (grey), at pH 6 (panel a), pH 7 (panel b) or pH 8 (panel c). Data points and error bars are the average and SEM from three experimental replicates (six for DMSO). (d-g) Amplitudes from the same primary experiments for which lag was determined in Figure 6c–d. (d, –e) are unnormalised, and show that pH strongly reduces total signal both in BL21 (d) and HB1 (e) IMVs. (f,g) are normalised to the value for pSpyLDDD, and show that the probabilities of pre-protein becoming trapped in the channel (reflecting kblock) are indistinguishable at all three pH values.
-
Figure 6—figure supplement 2—source data 1
Raw data for Figure 6—figure supplement 2a-c.
- https://cdn.elifesciences.org/articles/77586/elife-77586-fig6-figsupp2-data1-v3.xlsx
Figure 7 with 1 supplement
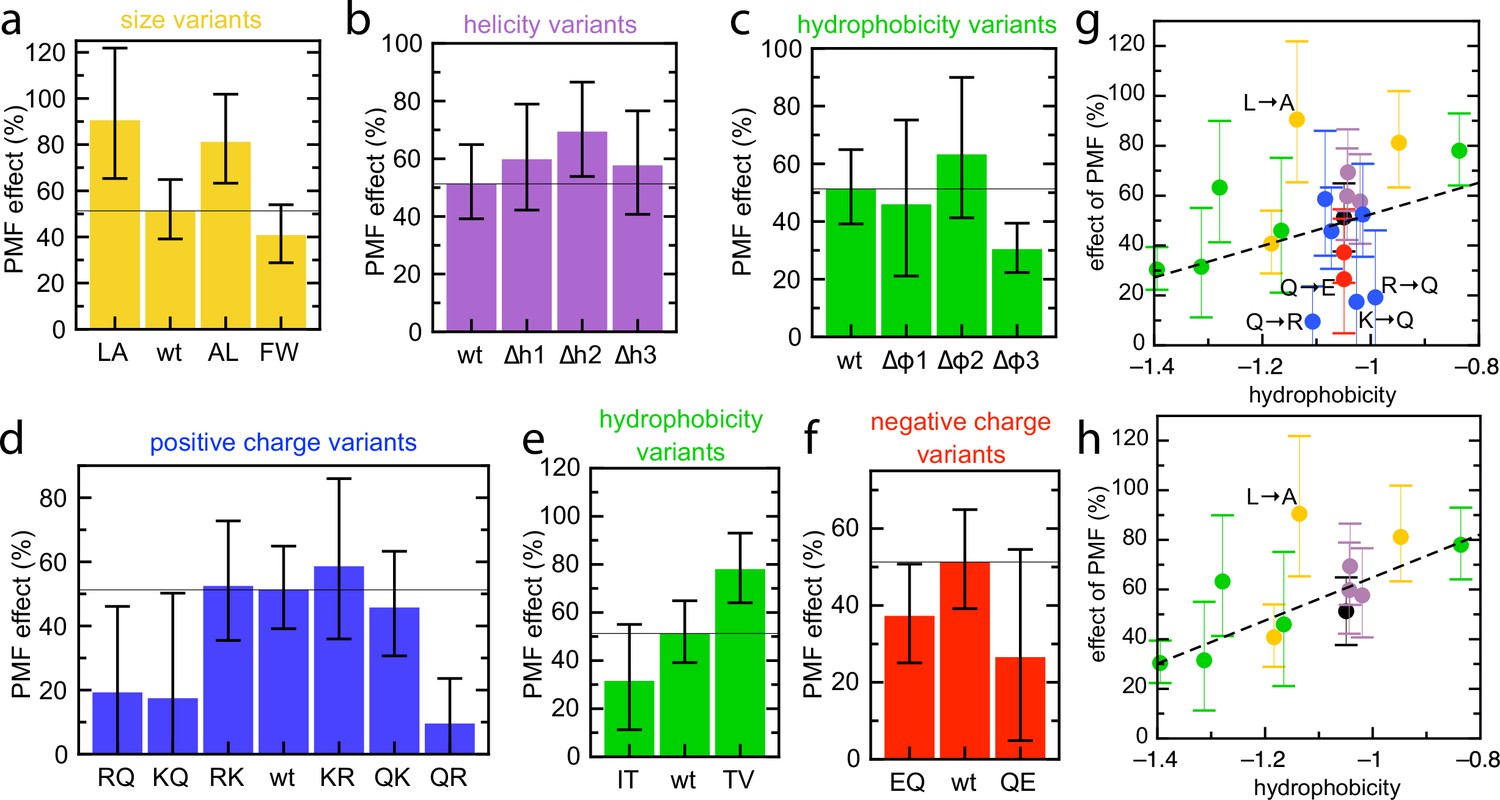
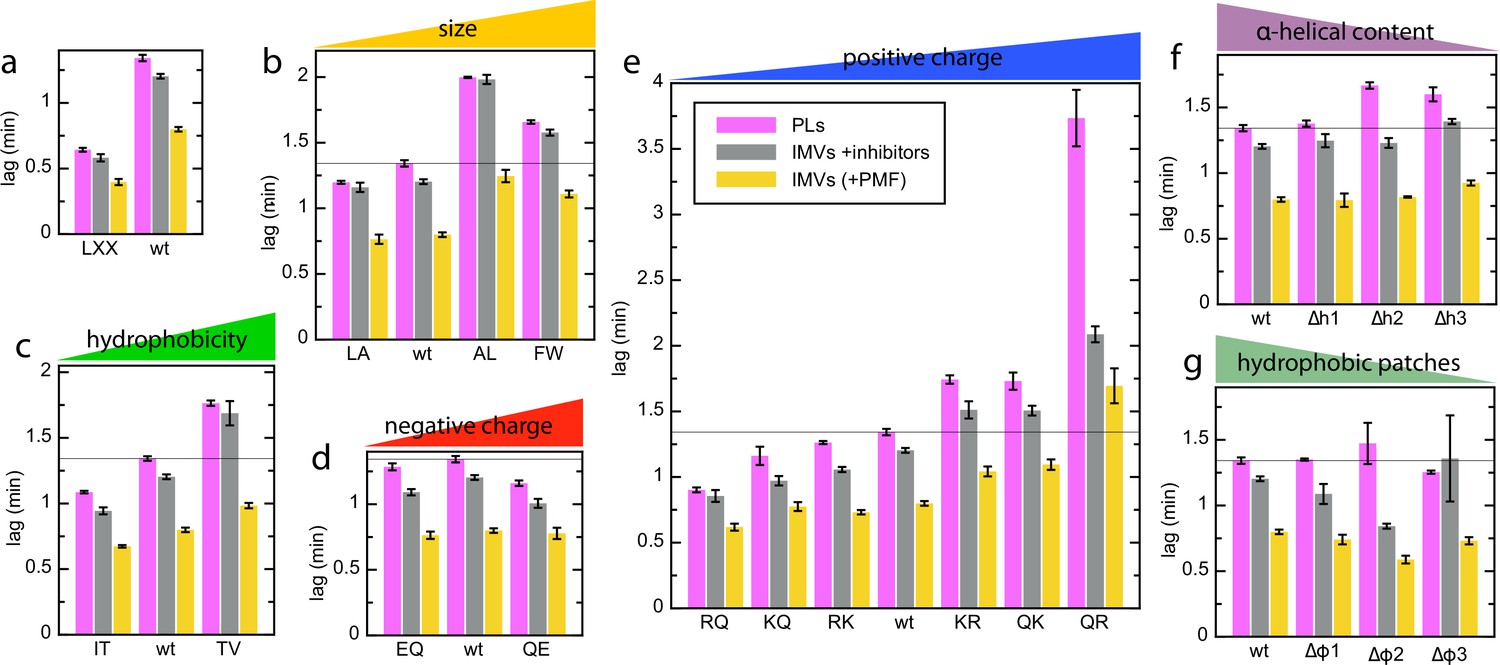
Effect of PMF on transport of the pSpyXLX variants.
(a–f) Stimulatory effect of PMF on transport of the variable region of all the pSpyXLX variants. These were calculated from the difference in lag for import into BL21 IMVs in the presence and absence of valinomycin and nigericin (see Materials and methods for details and Figure 7—figure supplement 1 for transport times), where 0% is no difference and 100% is a halving of lag. Error bars are calculated by calculating minimum and maximum values from the SEMs from five replicates of each. (g,h) PMF effects (coloured as in panels a–f) as a function of average hydrophobicity score for the amino acids in each variable mSpy, calculated using the values in Kyte and Doolittle, 1982. (g) Entire data set, with best fit line (r = 0.271). (h) Data excluding the charge variants (i.e. the blue and red values; r = 0.681). Outliers are marked directly on the plots.
-
Figure 7—source data 1
Raw data for Figure 7 without ionophores.
- https://cdn.elifesciences.org/articles/77586/elife-77586-fig7-data1-v3.xlsx
-
Figure 7—source data 2
Raw data for Figure 7 with ionophores.
- https://cdn.elifesciences.org/articles/77586/elife-77586-fig7-data2-v3.xlsx
Figure 7—figure supplement 1
Complete lag data for the pSpy variants in different vesicle types.
(a–g) Lags for transport of all pSpyXLX variants into PLs (pink; same data as in Figure 2) and BL21 IMVs in the absence (yellow) or presence (grey) of valinomycin and nigericin (raw data for the PMF stimulation data in Figure 7). Data are the average and SEM from three (PLs; 11 for wt) or five (IMVs; 17 and 18 for wt without and with ionophores, respectively) experimental replicates.
Figure 8
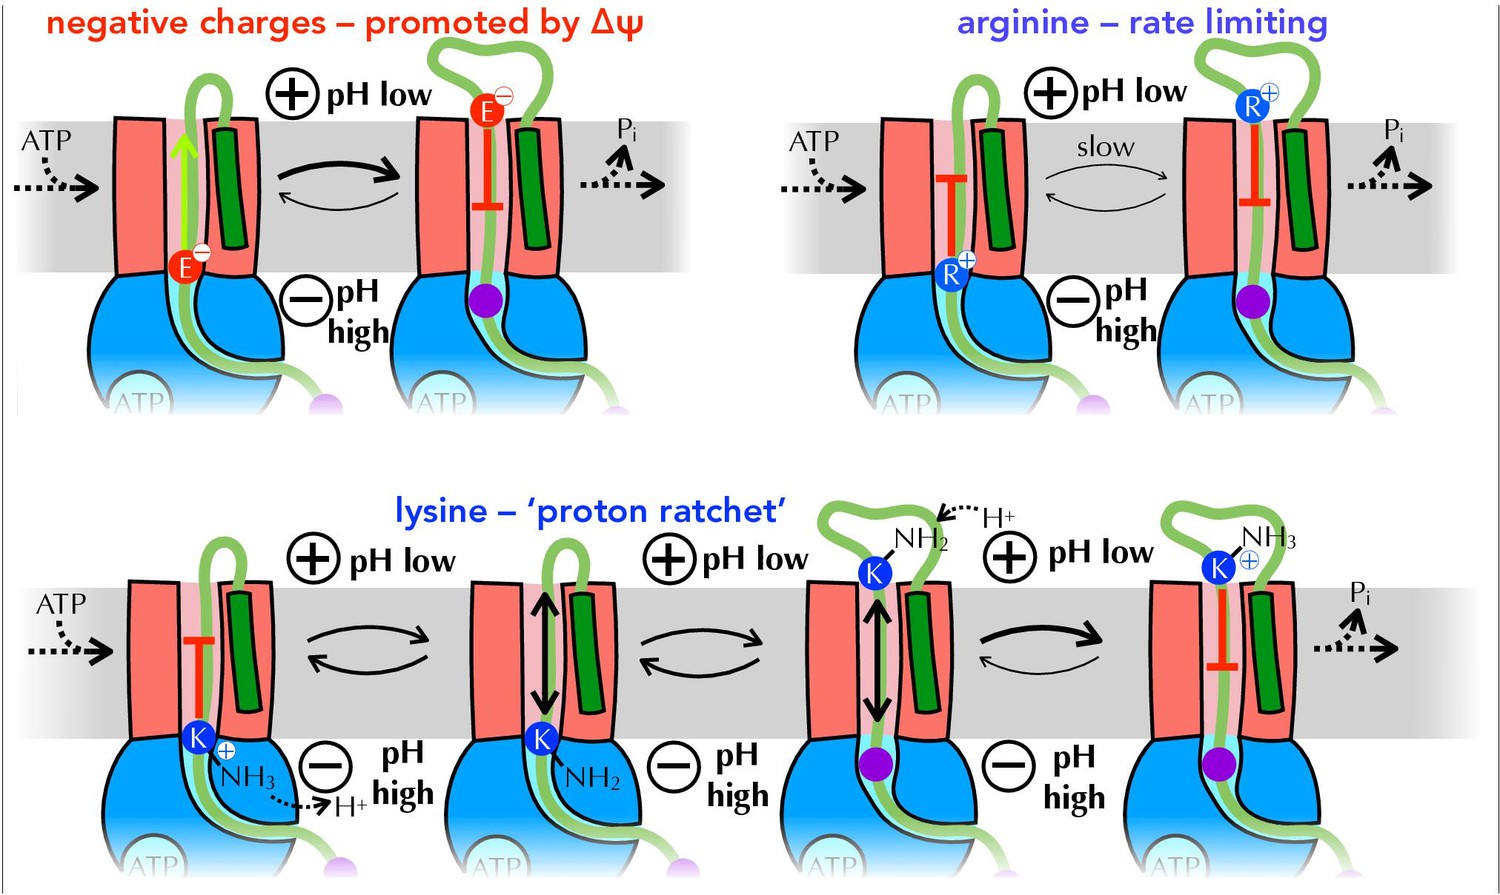
Summary of proposed PMF and ratcheting effects of pre-protein transport.
Closeup of step iii from Figure 1, where a negative amino acid (red, top left), arginine (blue, top right) or lysine (blue, bottom) is present at the entrance to SecY. ∆ψ is expected to promote the forward diffusion of negative charges, and inhibit their reverse movement. Movement of arginine is unfavourable in either direction, with export especially unfavourable when ∆ψ is present; hence transport of arginine is rate-limiting for the entire process. Lysine is deprotonated at the cytosolic face of SecY (by ∆pH and/or ATP hydrolysis by SecA), allowing its free diffusion across the membrane, and preventing backsliding once it is reprotonated on the other side.
Additional files
-
Supplementary file 1
List of pre-protein sequences used.
Differences from the native pSpy sequence are highlighted in bold. pSpyLXX is identical to pSpyXLX, but with Pep86 and its linker (yellow and pink) moved in front of the variable pSpy (black)
- https://cdn.elifesciences.org/articles/77586/elife-77586-supp1-v3.docx
-
Supplementary file 2
Berkeley Madonna models.
- https://cdn.elifesciences.org/articles/77586/elife-77586-supp2-v3.docx
-
Supplementary file 3
Tables of best fits and p-values.
a: p-values for the difference in lag between each variant and wt.
Calculated using a two-tailed t-test (in Microsoft Excel).
b: List of best fit parameters for all pSpyXLX variants
Values and confidence intervals were estimated by fitting each experimental replicate individually (n = 12 for wt, n = 3 for all the others), and using the mean and SEM of the best fits values.
c: p-values for bioinformatic analysis of arginine/lysine ratios.
Analyses performed using a two-tailed t-test in Microsoft Excel.
d: Comparison of the proton-motive force (PMF) generated by whole cells and inverted membrane vesicles (IMVs).
Error bars indicate the standard deviation from three biological replicates (for cells) or three technical replicates (for IMVs).
Raw data underlying the figures. For NanoLuc traces, separate runs are demarcated by alternating bold formatting.
- https://cdn.elifesciences.org/articles/77586/elife-77586-supp3-v3.docx
-
Transparent reporting form
- https://cdn.elifesciences.org/articles/77586/elife-77586-transrepform1-v3.docx
Download links
A two-part list of links to download the article, or parts of the article, in various formats.
Downloads (link to download the article as PDF)
Open citations (links to open the citations from this article in various online reference manager services)
Cite this article (links to download the citations from this article in formats compatible with various reference manager tools)
Rate-limiting transport of positively charged arginine residues through the Sec-machinery is integral to the mechanism of protein secretion
eLife 11:e77586.
https://doi.org/10.7554/eLife.77586


