Genome editing in the unicellular holozoan Capsaspora owczarzaki suggests a premetazoan role for the Hippo pathway in multicellular morphogenesis
- Department of Physiology, Howard Hughes Medical Institute, University of Texas Southwestern Medical Center, United States
- Eugene McDermott Center for Human Growth & Development, Departments of Bioinformatics and Clinical Sciences, University of Texas Southwestern Medical Center, United States
Figures
Figure 1 with 3 supplements
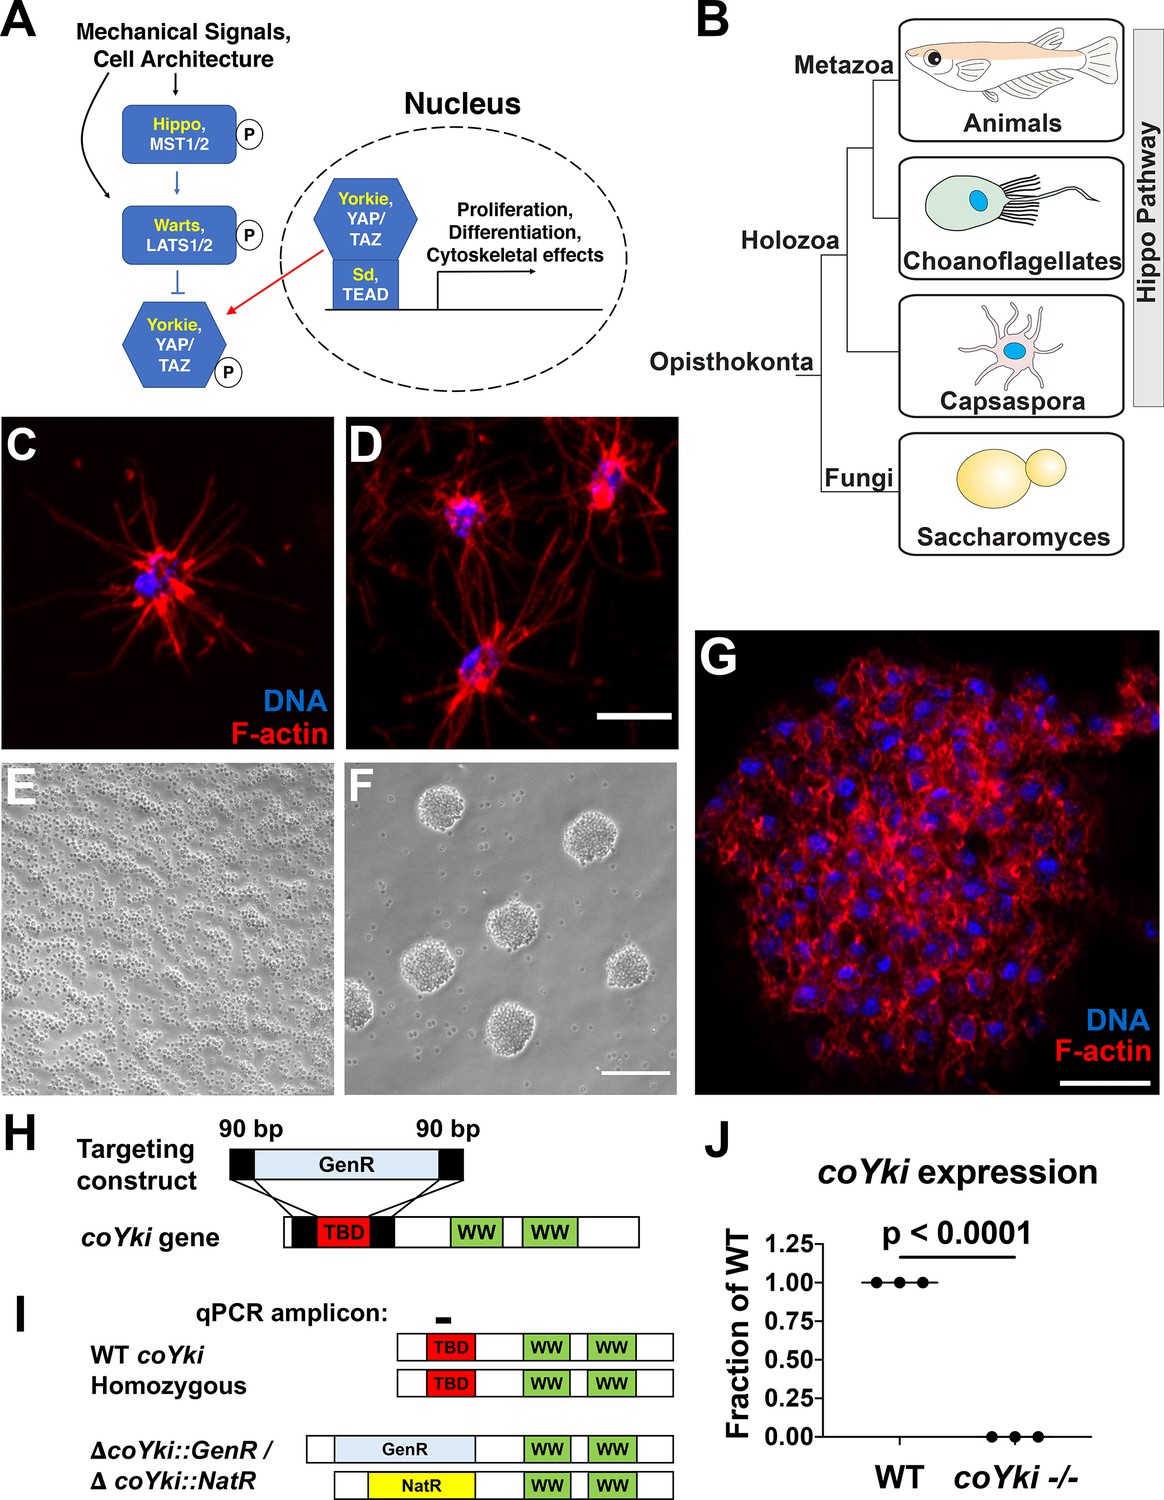
Disruption of a YAP/TAZ/Yorkie ortholog in Capsaspora.
(A) The Hippo pathway in Drosophila and mammals. Drosophila orthologs are in yellow, and mammalian orthologs are in white. YAP/TAZ/Yorkie and TEAD/Sd form a transcriptional complex that drives gene expression. A kinase cascade leads to phosphorylation of YAP/TAZ/Yorkie, causing inactivation through cytoplasmic sequestration. (B) Phylogenetic tree showing conservation of the Hippo pathway in close unicellular relatives of animals. (C) A solitary Capsaspora cell showing thin F-actin-enriched projections. Phalloidin and DAPI are used to stain F-actin and DNA, respectively. (D) Cells at higher densities can contact other cells through projections. Scale bar is 5 µm. (E, F) Capsaspora cells were inoculated into either a tissue-culture-treated plate (E) or a low-adherence plate (F). At 3 days, cells in standard plates grow as a monolayer, whereas cells in low-adherence plates form round aggregates. (G) An aggregate stained for F-actin shows actin-rich connections between cells within an aggregate. Scale bar is 10 µm. (H) Strategy for disrupting the coYki gene by homologous recombination. GenR, Geneticin resistance cassette; TBD, TEAD-binding domain; WW, WW domain. (I) Strategy for demonstrating disruption of coYki by qPCR. Amplicon corresponds to a region of the coYki gene that should be absent in a homozygous mutant. NatR, nourseothricin N-acetyltransferase resistance cassette. (J) qPCR of Amplicon from panel (I) in WT and putative coYki -/- cells. The difference between WT and coYki -/- is significant (t-test).
Figure 1—figure supplement 1
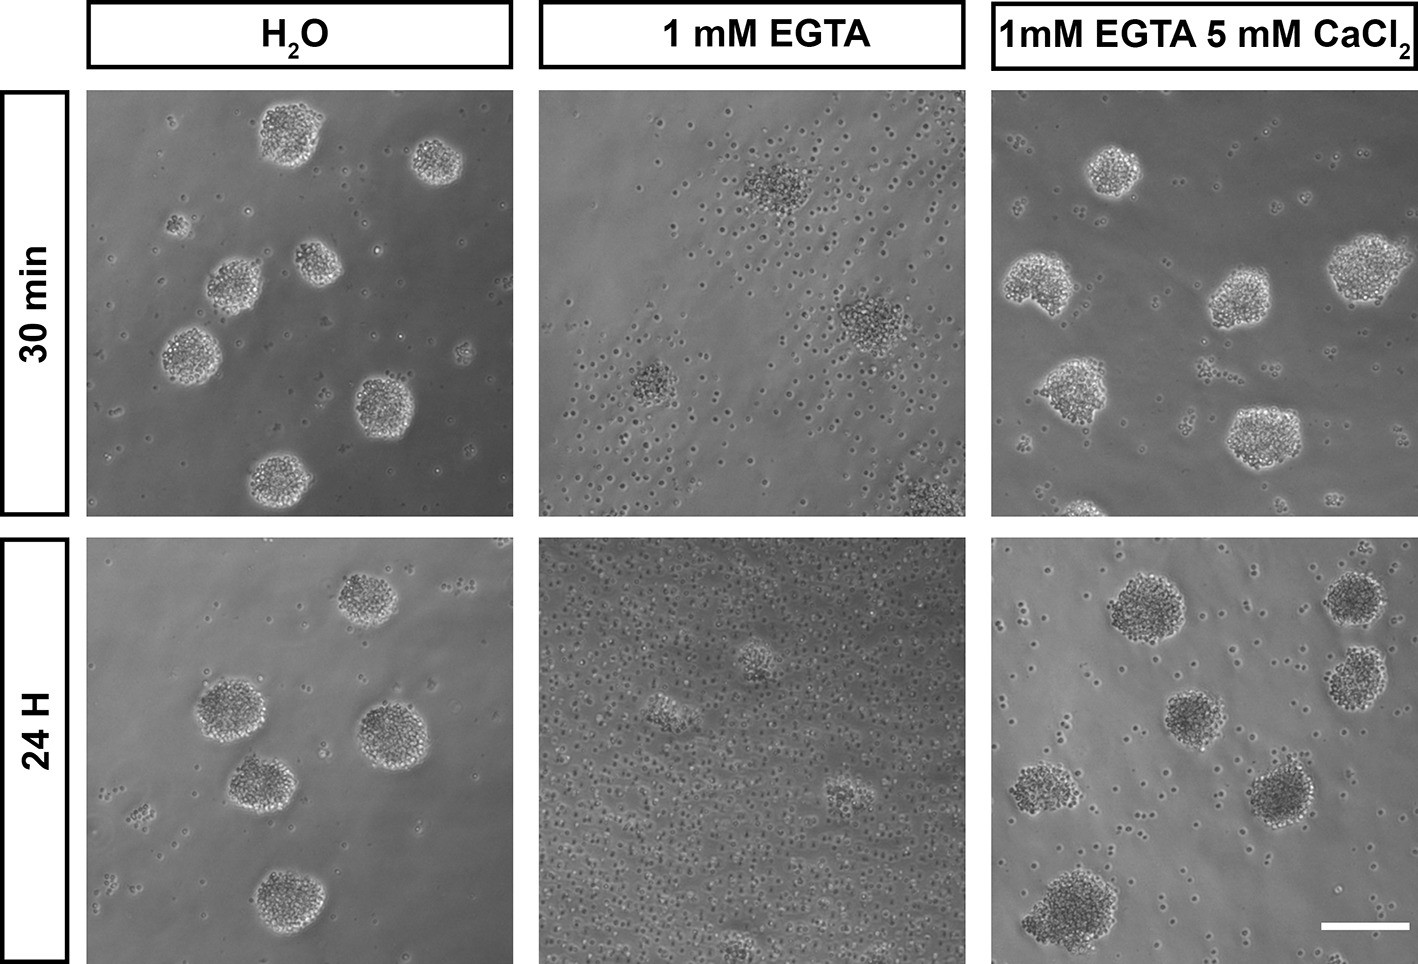
Calcium is required for adhesion in Capsaspora cell aggregates.
Capsaspora aggregates were treated with water (vehicle control), the calcium chelator EGTA, or EGTA with an excess of calcium. At 30 min, aggregates treated with EGTA had begun to disassociate, with further disassociation evident at 24 hr. Simultaneous addition of an excess of calcium blocked this disassociation.
Figure 1—figure supplement 2
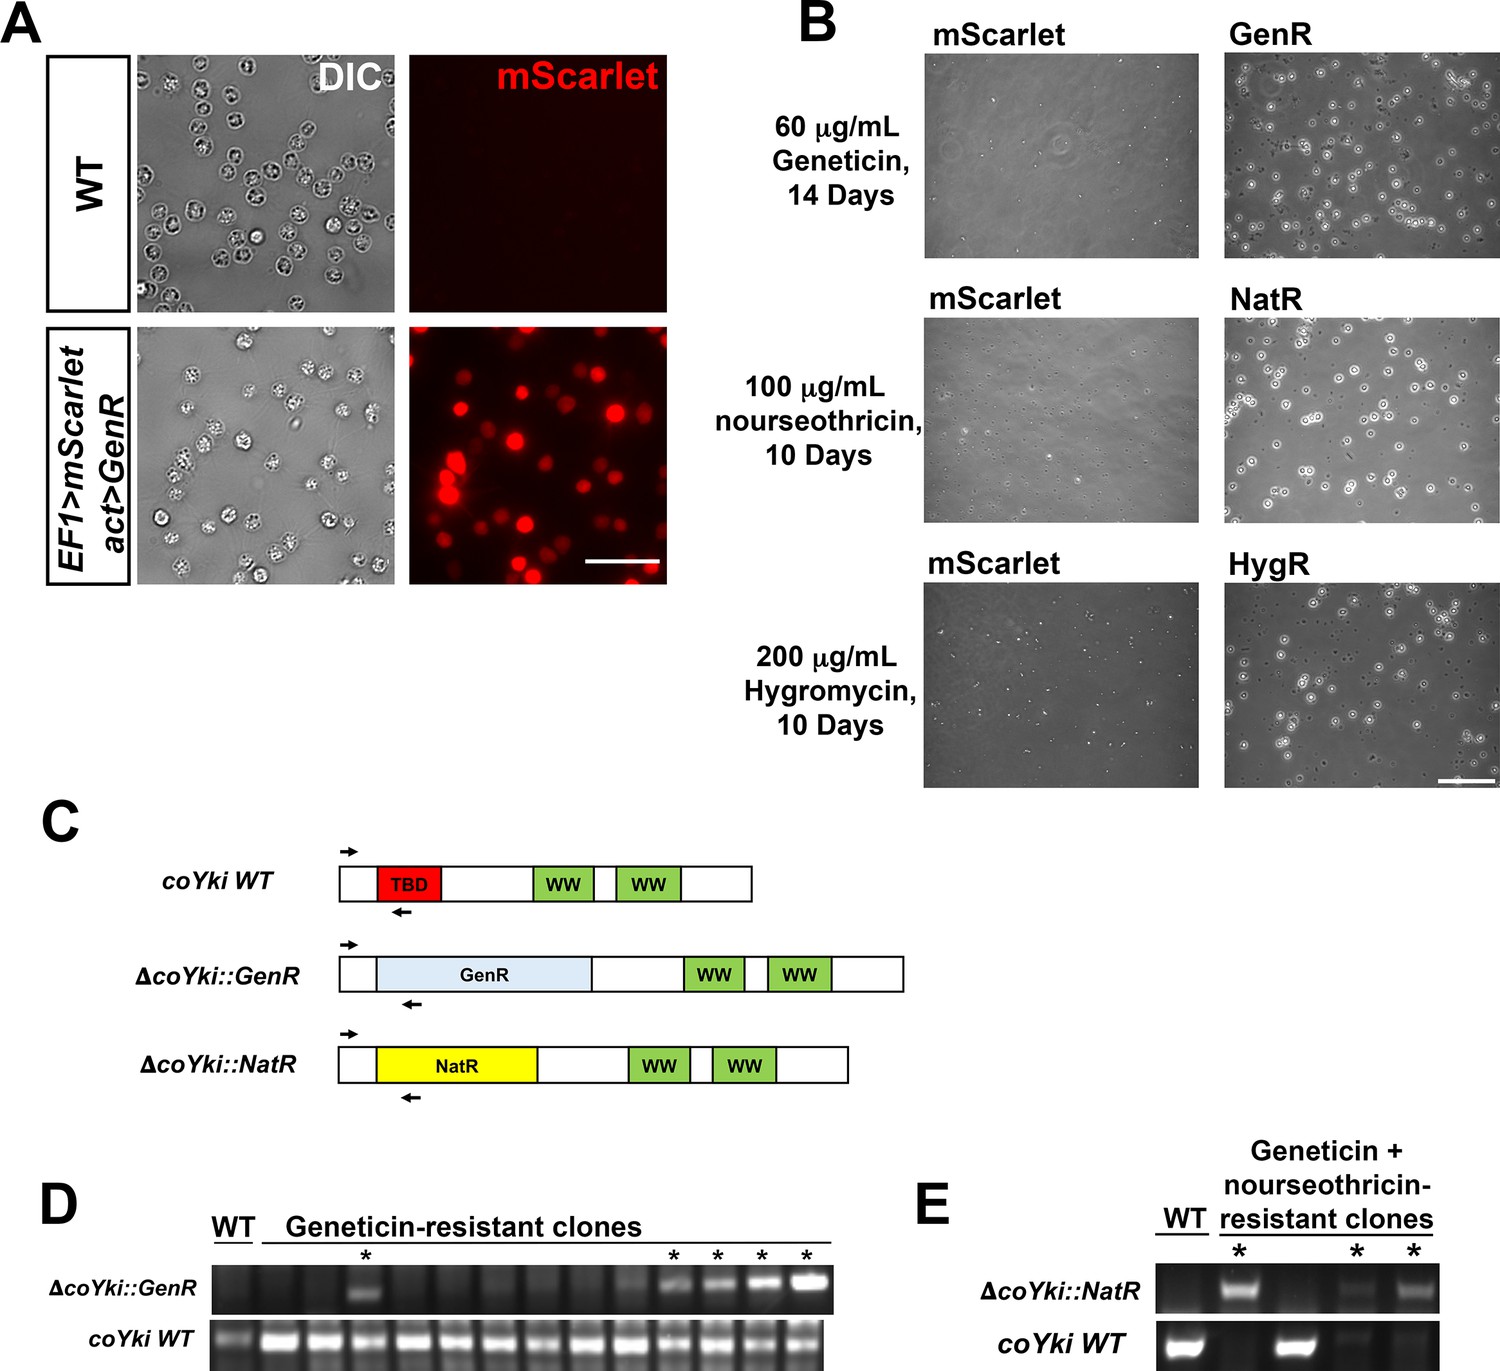
Stable transgene expression and confirmation of gene knockout in Capsaspora.
(A) WT Capsaspora cells and a clonal population of cells stably expressing mScarlet were imaged to show fluorescence. Scale bar is 20 µm. (B) Transfection of Capsaspora with genes encoding antibiotic resistance markers results in viable cell populations after drug treatment. Cells were transfected with plasmids encoding mScarlet with no antibiotic marker (pJP71), GenR (pJP72), NatR (pJP102), or HygR (pJP103) genes and were treated with the indicated antibiotics 2 days after transfection for the indicated time period. Representative images of the population are shown. Round, phase-bright cells are visible in populations transfected with resistance markers but not cells transfected with mScarlet. Scale bar is 75 µm. (C–E) Diagnostic PCR of putative coYki deletion clonal cell lines. (C) Diagram of primer pairs used to evaluate the presence of the WT coYki allele (coYki WT), a deletion of a region of coYki using the GenR marker (ΔcoYki::GenR), or a deletion of a region of coYki using the NatR marker (ΔcoYki::NatR). TBD, TEAD-binding domain; WW, WW domain; GenR, Geneticin resistance; NatR, nourseothricin resistance. (D) WT cells were transfected with a gene-targeting construct encoding GenR designed to delete the TBD in the coYki gene by homologous recombination (see Figure 1H). Following transfection and drug selection, clonal populations of transfectants were generated and analyzed by diagnostic PCR using the indicated primer pairs. * indicates a clone showing a PCR product indicative of heterozygous coYki disruption. (E) A clonal cell line with a diagnostic PCR result indicating the disruption of a coYki allele with GenR was transfected with a gene-targeting construct encoding NatR designed to delete the TBD in the coYki gene. After selection with both Geneticin and nourseothricin, clonal populations of transfectants were generated and analyzed by diagnostic PCR using the indicated primer pairs. * indicates a clone showing a PCR product indicative of homozygous coYki disruption.
-
Figure 1—figure supplement 2—source data 1
Unedited gel image used to generate Figure 1—figure supplement 2D.
- https://cdn.elifesciences.org/articles/77598/elife-77598-fig1-figsupp2-data1-v1.zip
-
Figure 1—figure supplement 2—source data 2
Uncropped annotated gel image used to generate Figure 1—figure supplement 2D.
- https://cdn.elifesciences.org/articles/77598/elife-77598-fig1-figsupp2-data2-v1.zip
-
Figure 1—figure supplement 2—source data 3
Unedited gel image used to generate Figure 1—figure supplement 2E.
- https://cdn.elifesciences.org/articles/77598/elife-77598-fig1-figsupp2-data3-v1.zip
-
Figure 1—figure supplement 2—source data 4
Uncropped annotated gel image used to generate Figure 1—figure supplement 2E.
- https://cdn.elifesciences.org/articles/77598/elife-77598-fig1-figsupp2-data4-v1.zip
Figure 1—figure supplement 3
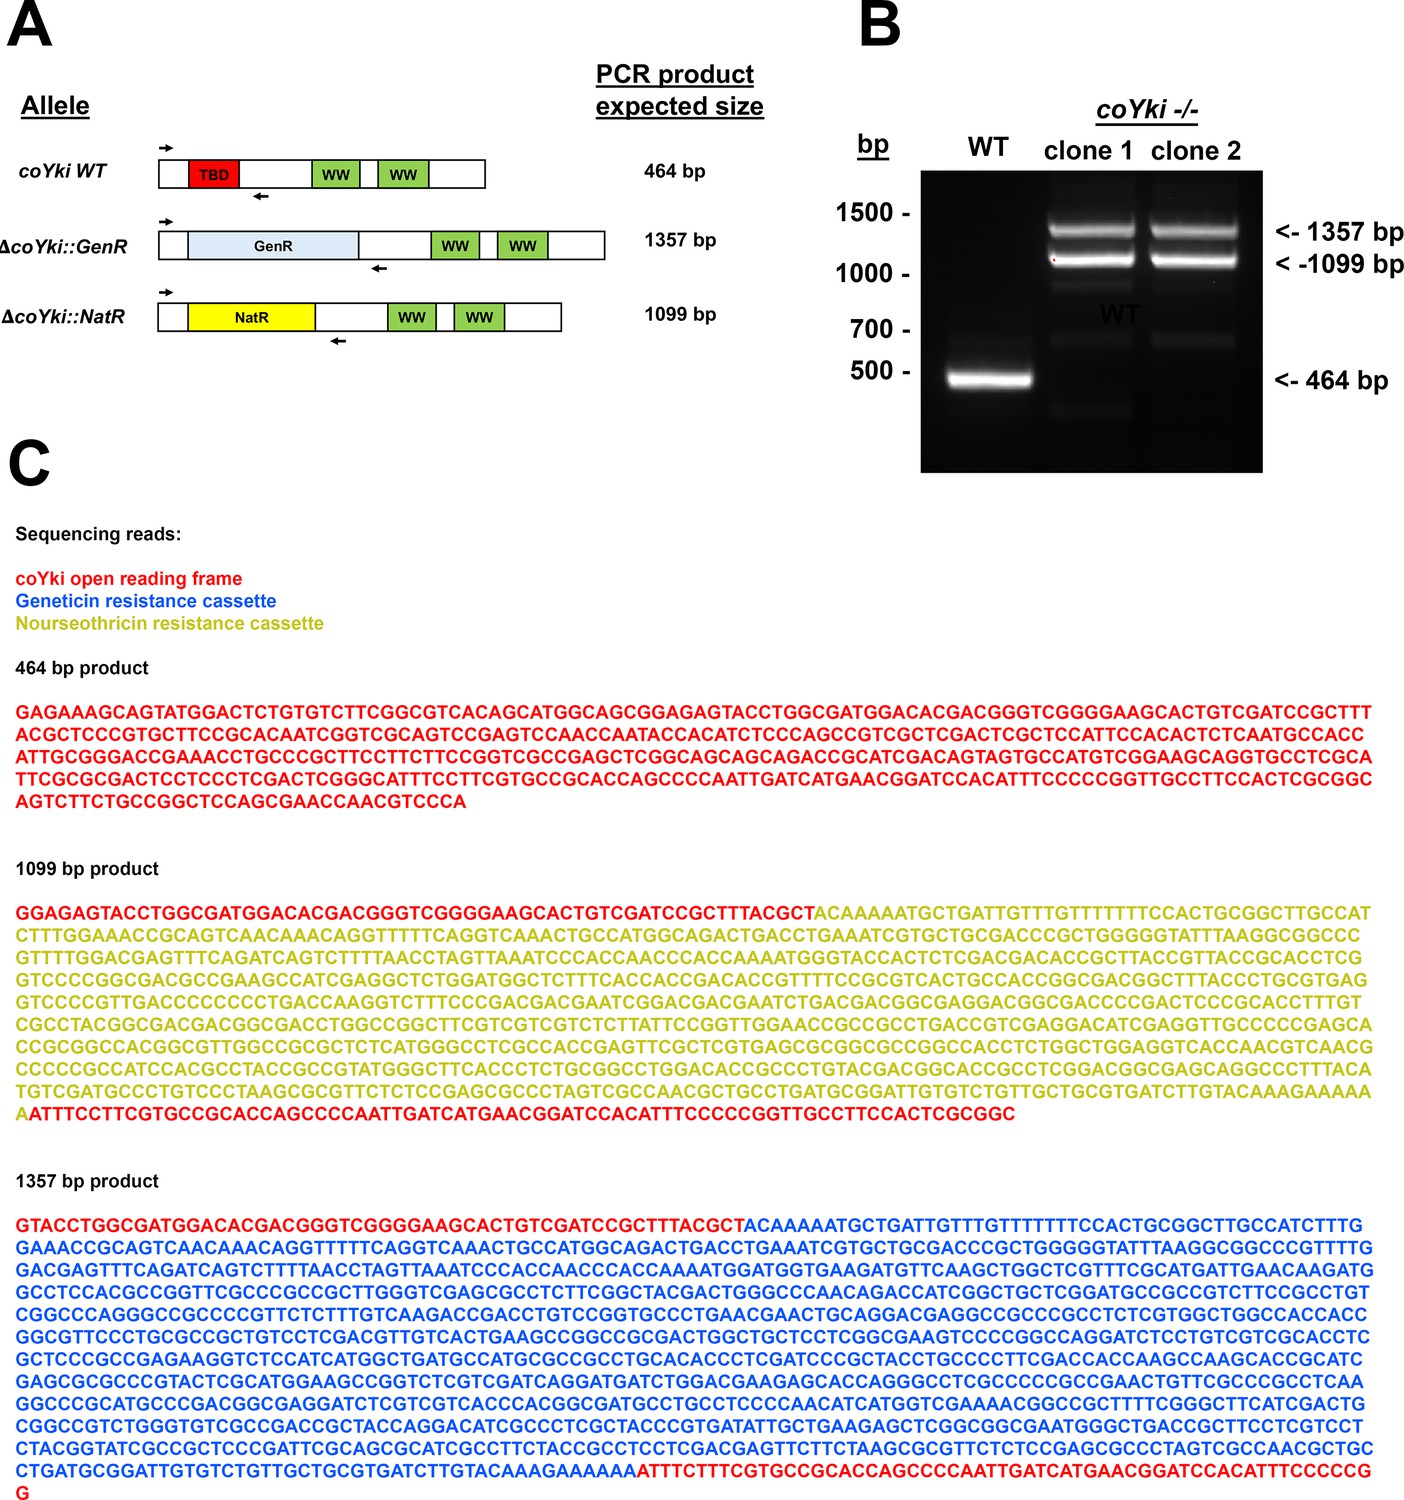
Sequencing of the genomic deletion in coYki -/- cells demonstrates absence of the WT allele and biallelic disruption of coYki with antibiotic resistance markers.
(A) A primer pair was designed to amplify across the genomic deletion in coYki -/- mutant cells. Diagram shows this primer pair aligned with the WT coYki allele, an allele with a deletion using a Geneticin resistance marker (GenR), or an allele with a deletion using a nourseothricin N-acetyltransferase marker (NatR). The sizes of the expected corresponding PCR products are indicated. (B) Genomic DNA from WT Capsaspora cells or two independent coYki -/- clones was used as a PCR template with the primers shown in (A). (C) DNA bands for WT (464 bp band) and coYki -/- clone 1 (1099 bp and 1357 bp band) from (B) were purified and sequenced by Sanger sequencing. The shown sequencing results were compiled from forward and reverse sequencing reads of the PCR products. Colors of sequences correspond to sequence homology with the coYki open reading frame (red), the NatR cassette (yellow), or the GenR cassette (blue).
-
Figure 1—figure supplement 3—source data 1
Unedited gel image used to generate Figure 1—figure supplement 3B.
- https://cdn.elifesciences.org/articles/77598/elife-77598-fig1-figsupp3-data1-v1.zip
-
Figure 1—figure supplement 3—source data 2
Uncropped annotated gel image used to generate Figure 1—figure supplement 3B.
- https://cdn.elifesciences.org/articles/77598/elife-77598-fig1-figsupp3-data2-v1.zip
Figure 2 with 2 supplements
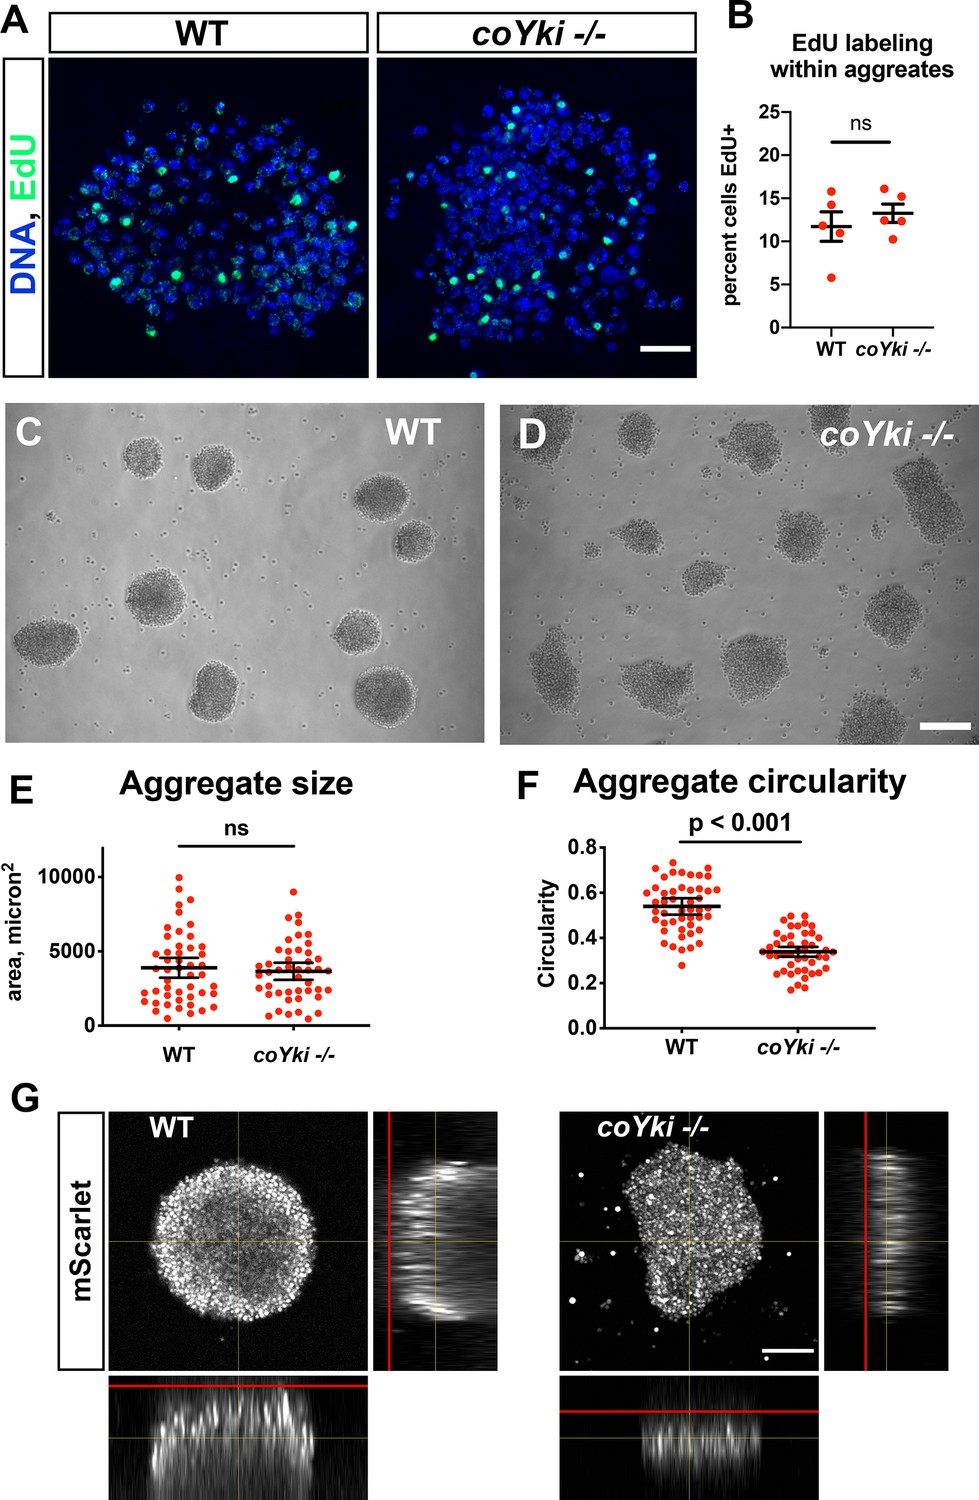
Loss of coYki results in no apparent effect on cell proliferation but alters the morphology of multicellular aggregates.
(A) To examine proliferation within aggregates, EdU was used to label proliferating cells within aggregates grown in low-adherence plates. (B) The percent of cells positive for EdU within aggregates was quantified. Each red circle indicates measurement results for a single aggregate, and mean ± SEM is shown in black. The difference between WT ant coYki -/- cells is not significant (t-test). (C, D) WT or coYki -/- cells were inoculated into low-adherence plates, and cell aggregates were imaged at 5 days. Scale bar is 75 µm. (E, F) Aggregate size and circularity were measured from aggregate images using ImageJ. The difference in aggregate circularity between WT and coYki -/- is significant (t-test). Bars indicate the mean ± SEM (n = 3 with 15 aggregates measured for each independent experiment), and dots indicate values for individual aggregates. (G) Orthogonal views of WT and coYki -/- aggregates are shown. Cell aggregates stably expressing mScarlet were imaged live by confocal microscopy. Red lines show the location of the culture surface. Scale bar is 50 µm.
Figure 2—figure supplement 1
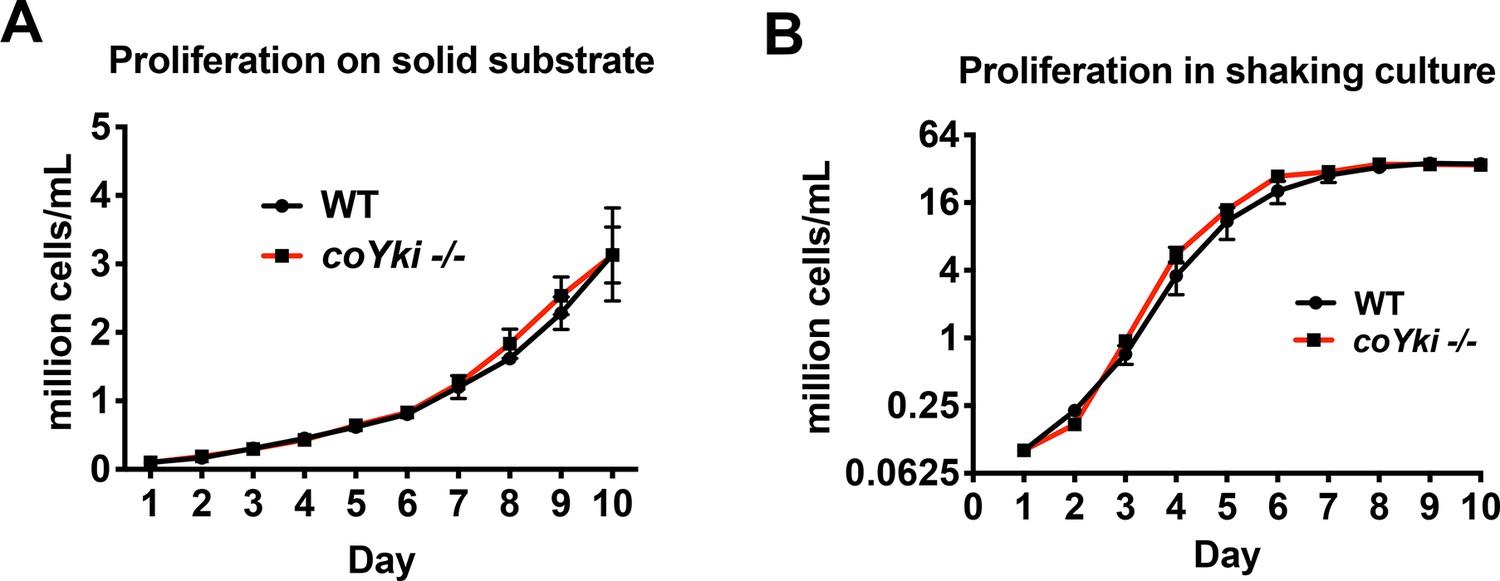
WT and coYki -/- cells proliferate at a similar rate.
(A) To examine proliferation on a solid substrate, cells were grown in wells in a 24-well plate, and each day cells within one well were resuspended and counted. (B) To examine proliferation in shaking culture, cells were grown in flasks on an orbital shaker, and an aliquot of cells was collected and counted daily. Values are mean ± SEM (n ≥ 3). Absence of error bars indicates that error is smaller than the plot symbol.
Figure 2—figure supplement 2
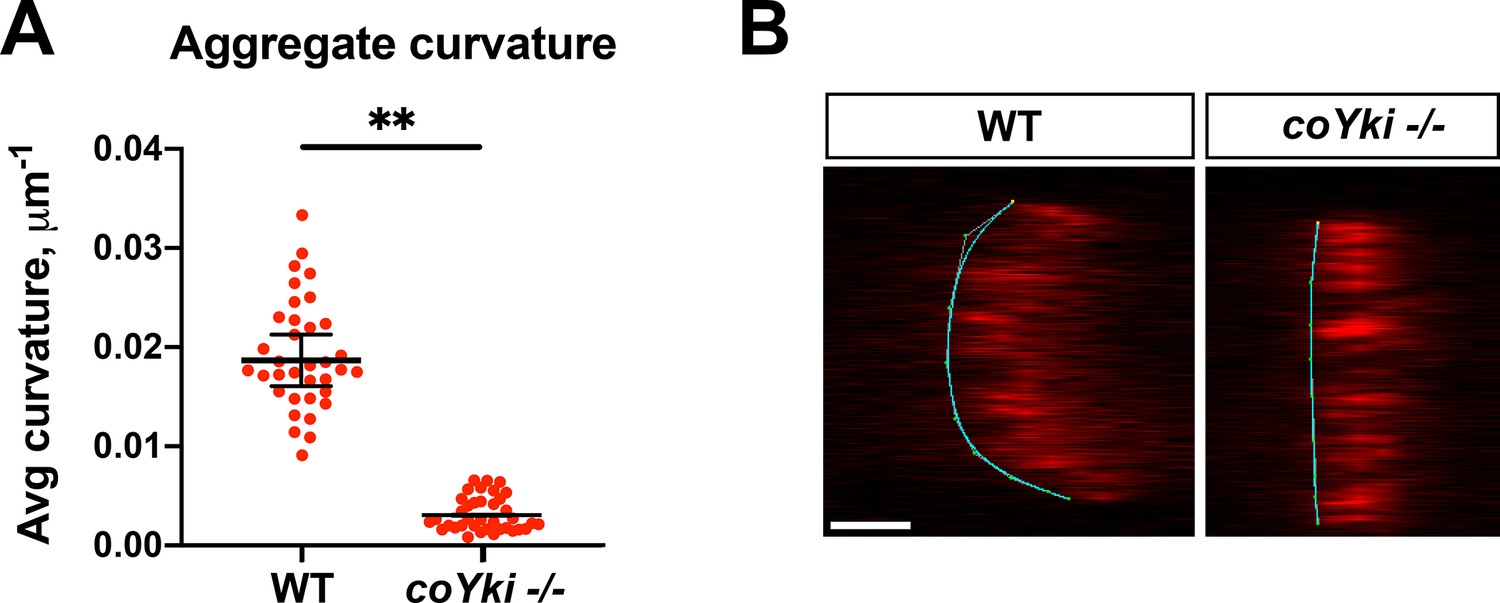
coYki affects the 3D morphology of aggregates.
(A) WT or coYki -/- aggregates expressing mScarlet were imaged by optical sectioning, orthogonal views of aggregates were generated as in Figure 2G, and average curvature along the aggregate surface was calculated with Kappa (Mary and Brouhard, 2019). Average curvature is given in values of 1/R, where R is the radius of curvature for a given point on the curve. Values from three independent experiments with at least 10 aggregates for each experiment are shown. Red dots indicate measurements from individual aggregates, and black bars indicate mean ± SEM from three independent sample-level means. Absence of error bars indicates that error is smaller than plot symbol. The difference between WT an coYki -/- is significant (p<0.01, t-test). (B) Examples of curves generated by Kappa from orthogonal views of WT or coYki -/- aggregates are shown. For each image, the substrate is on the left side of the aggregate. Scale bar is 25 µm.
Figure 3 with 1 supplement

Loss of coYki affects cell–substrate adhesion but not cell–cell adhesion.
(A–D) Cells expressing mScarlet in the WT background (A, B) or in the coYki -/- mutant background (C, D) were allowed to aggregate as a homogeneous population (A, C) or were mixed with 90% WT cells and allowed to aggregate (B, D). Individual mScarlet-labeled coYki -/- cells associate with WT cells within aggregates (D’) in an organization like that of cells from the WT background labeled with mScarlet (B’). Scale bar is 75 µm. (E) To examine cell–cell adhesion, cells in suspension were gently rotated for an hour to stimulate cluster formation through cell–cell adhesion. Cultures were then examined by hemocytometer, and the number of cells per cluster was counted. Each red circle indicates the number of cells in a single cluster, and error bars indicate the mean ± SEM of the mean number of cells per cluster from three independent experiments. Absence of error bars indicates that error is smaller than the plot symbol. The difference in mean number of cells per cluster between WT and coYki -/- is not significant (t-test). (F) To examine cell–substrate adhesion, adherent cells in monolayer culture were either agitated on a rotary shaker for 10 min or left untreated, and then the number of adhered and unadhered cells in each culture was counted and the percent of cells adhered to the culture substrate was calculated. Error bars show mean ± SEM. Absence of error bars indicates that error is smaller than plot symbol. The difference between WT and coYki -/- for percent of cells attached to substrate after agitation is significant (t-test).
Figure 3—figure supplement 1
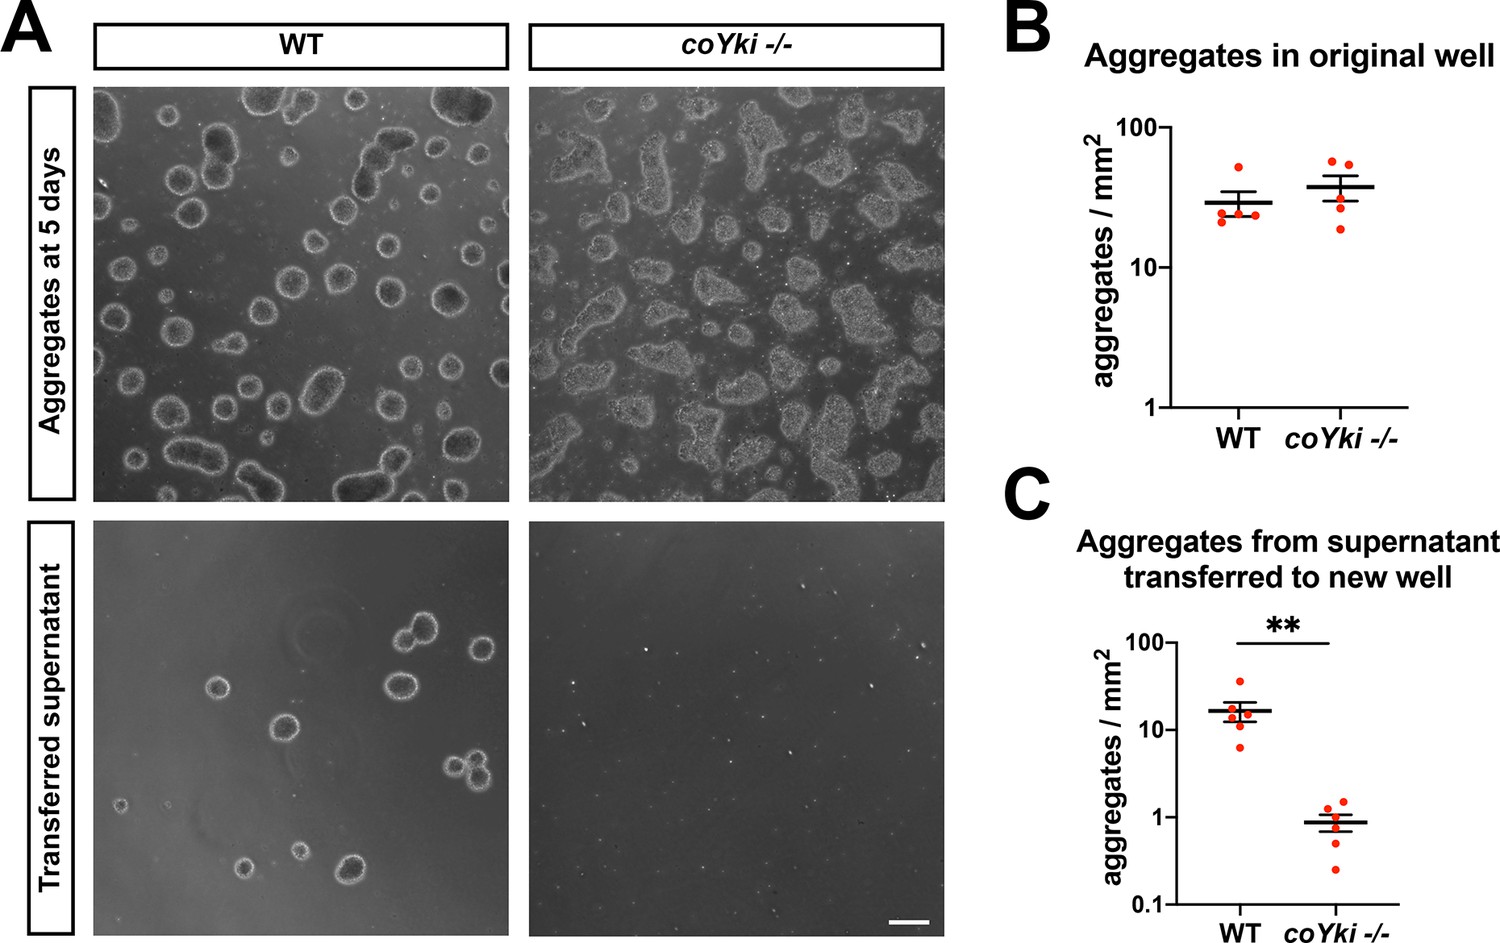
coYki negatively regulates aggregate–substrate adhesion.
(A) Capsaspora cells were allowed to aggregate for 5 days in low-adherence 24-well plates. Aggregates were imaged, and then all media within the well were gently pipetted into a new well (‘transferred supernatant’). After allowing any transferred aggregates to settle for 10 min, aggregates at the center of the well containing transferred supernatant were then imaged. Scale bar is 100 µm. Aggregates in the original well (B) or the well containing transferred supernatant (C) were quantified. Error bars are mean ± SEM from five independent experiments. Red dots are measured values from each independent experiment. For the number of aggregates in the transferred supernatant, the difference between WT and coYki -/- is significant (p<0.01, t-test).
Figure 4
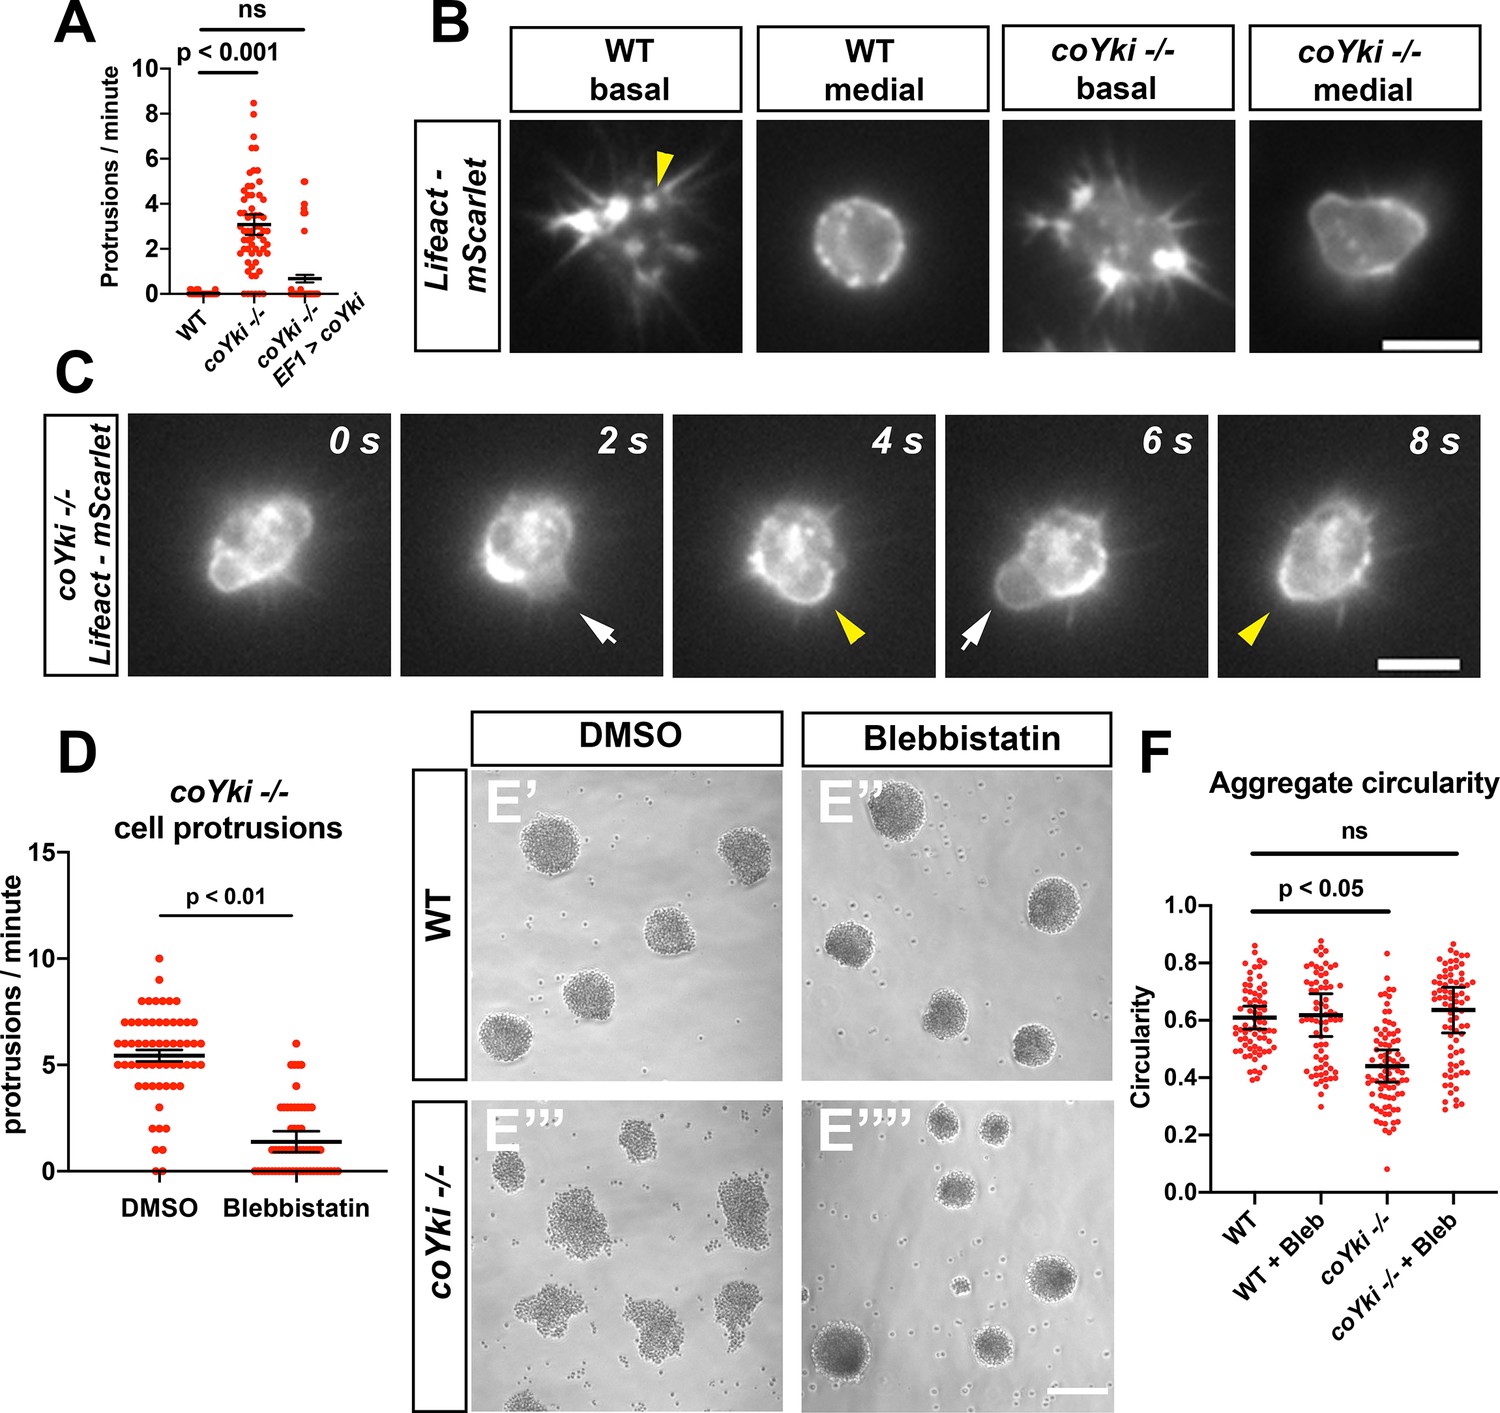
Loss of coYki causes bleb-like protrusions at the cell cortex.
(A) Capsaspora cells on a glass surface were imaged by time-lapse microscopy and individual cells were scored for number of protrusions per minute. A protrusion is defined as a localized extension of the cell boundary that disrupts a previously inert region of the cortex and/or changes the direction of movement of the cell. Differences between WT and coYki -/- are significant (one-way ANOVA, Tukey’s test). Values from three independent experiments with 20 cells measured for each condition per experiment are shown. Red dots indicate the measurement from an individual cell, and black bars indicate the mean ± SEM of the means from each independent experiment. (B) Cells on a glass surface stably expressing LifeAct-mScarlet were imaged focusing on the base of the cell at the substrate (‘basal’) or at the mid-height of the cell (‘medial’). Arrowhead shows an example of LifeAct signal at the base of the cell that remains stationary as the cell moves (see Video 4). Scale bar is 5 µm. (C) Time series of a coYki -/- cell stably expressing LifeAct-mScarlet on a glass surface. White arrows indicate LifeAct-depleted bleb-like protrusions, and yellow arrowheads indicate areas of cell cortex constriction, which correlate with increased LifeAct signal. Scale bar is 5 µm. (D) Cells on a glass surface were treated with DMSO or 1 μM blebbistatin for 1 hr, and then cells were imaged by time-lapse microscopy and the number of protrusions per cell was quantified. Values from three independent experiments with 20 cells measured for each condition per experiment are shown. Red dots indicate the measurement from an individual cell, and black bars indicate the mean ± SEM of the means from each independent experiment. The difference between DMSO and blebbistatin conditions is significant (t-test). (E) Cells were inoculated into low-adherence plates with DMSO (E’,E’’’) or 1 μM blebbistatin (E’’,E’’’’), and aggregates were imaged after 5 days. Scale bar is 75 µm. (F) Circularity of aggregates was measured with ImageJ using images of aggregates from the indicated conditions. Black bars indicate the mean ± SEM (n = 4 with 15 aggregates measured for each independent experiment), and red dots indicate the measurements for individual aggregates. Differences in circularity between WT and coYki -/- aggregates treated with DMSO are significant (one-way ANOVA, Dunnett’s test), whereas differences between WT aggregates treated with DMSO and coYki -/- aggregates treated with blebbistatin are not. ‘Bleb’ indicates blebbistatin.
Figure 5
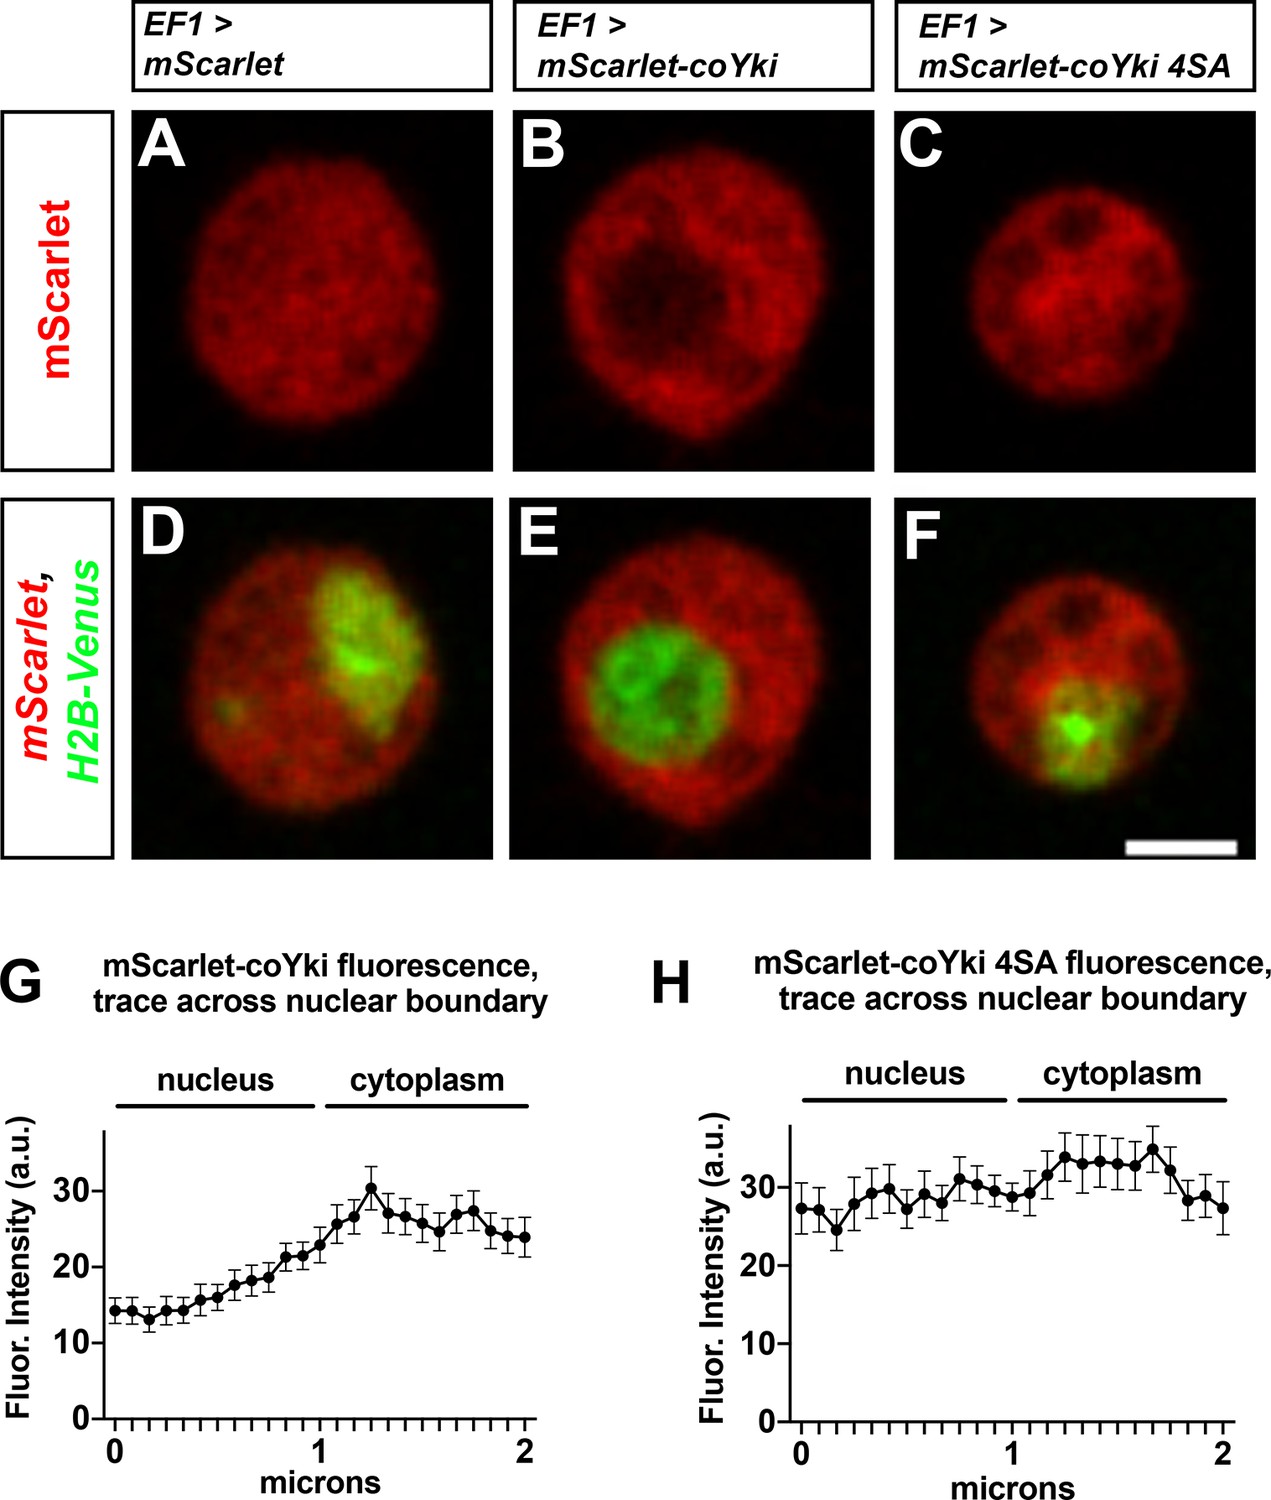
Putative Wts/LATS phosphorylation motifs affect the subcellular localization of coYki.
(A–F) Capsaspora cells were transiently transfected with plasmids encoding histone H2B-Venus and either mScarlet (A, D), mScarlet-coYki (B, E), or mScarlet-coYki with serine to alanine mutations at four predicted HXRXXS Wts/LATS phosphorylation motifs (coYki 4SA) (C, F). Scale bar is 2 µm. (G, H) For cells expressing either mScarlet-coYki (G) or mScarlet-coYki 4SA (H), fluorescence intensity along a 2 µm segment centered on the nuclear–cytoplasmic boundary was measured. Values are mean ± SEM from three independent experiments. The mean fluorescence intensity for all measurements within the nucleus is significantly different than the mean fluorescence intensity for all measurements in the cytoplasm for mScarlet-coYki but not for mScarlet-coYki 4SA (p<0.05, t-test).
Figure 6
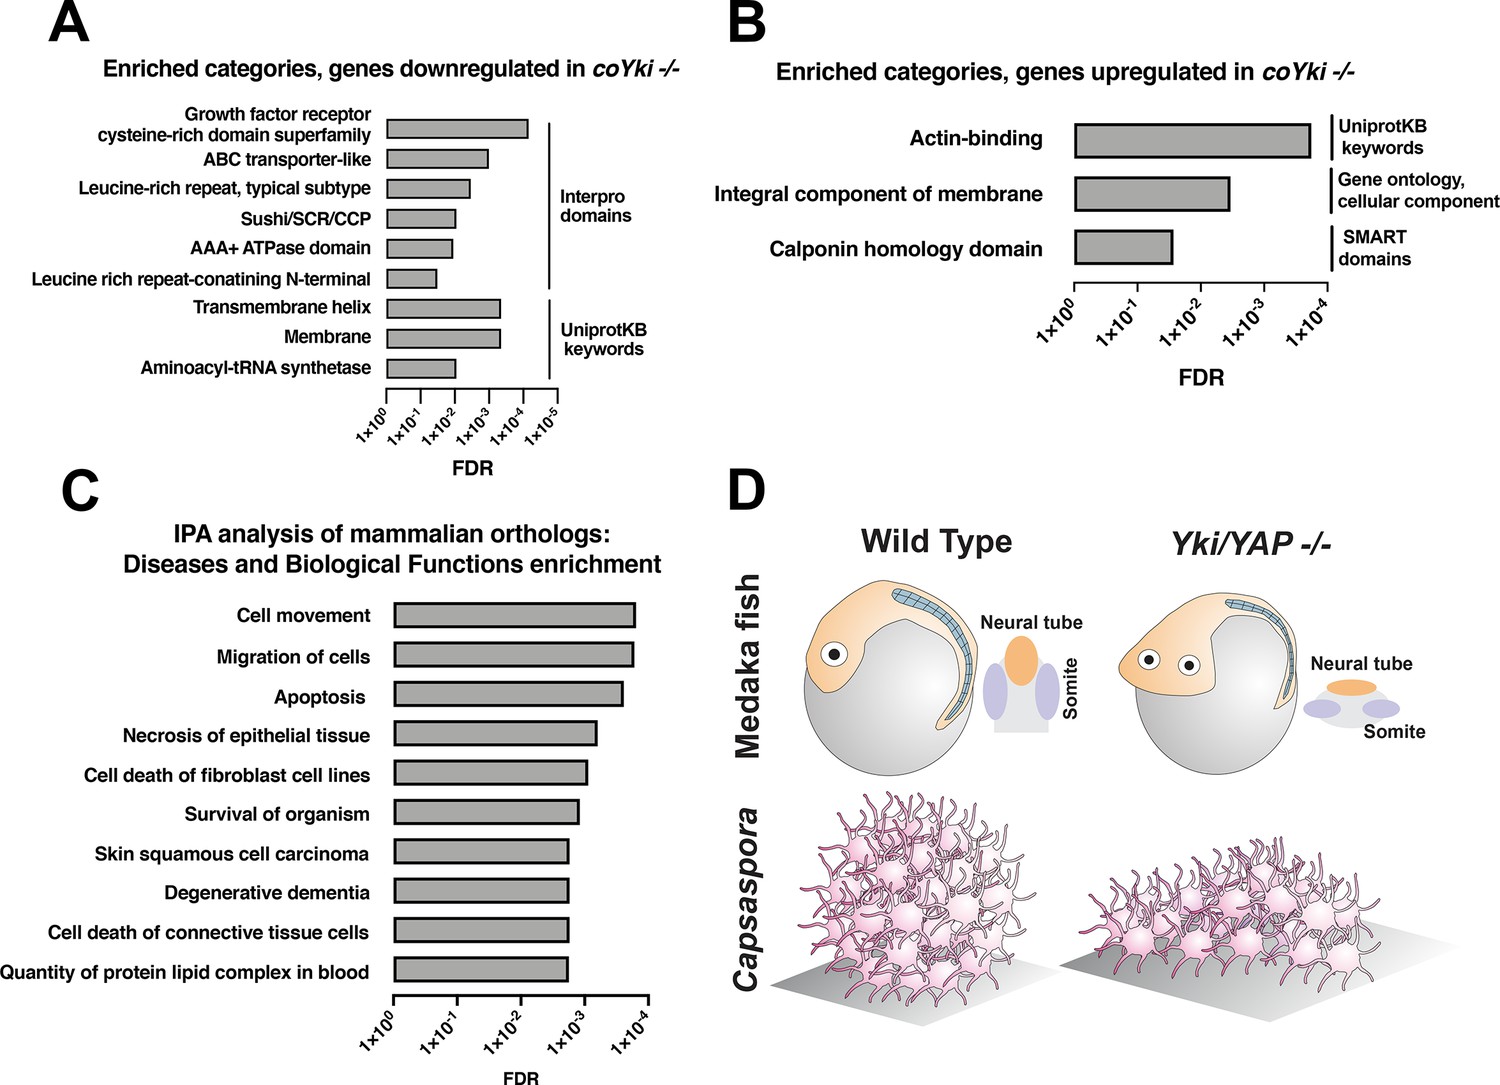
Functional enrichment of genes differentially expressed in coYki -/- cells.
Top enriched categories from the sets of genes significantly downregulated (A) or upregulated (B) in coYki -/- cells compared to WT are shown. See Supplementary file 1 and Supplementary file 2 for a list of downregulated an upregulated genes, respectively. (C) Ingenuity Pathway Analysis was performed on a set of predicted human/mouse orthologs of Capsaspora genes with significant changes in expression in coYki -/- cells (see Supplementary file 4 for gene list). Enriched diseases and biological functions with false discovery rate (FDR) ≤ 0.05 are shown. (D) A schematic showing the flattened body phenotype of YAP -/- medaka fish embryos (top) and the flattened 3D shape of coYki -/- Capsaspora aggregates (bottom).
Videos
Video 1
Aggregation of WT or coYki -/- cells over 6 days on a low-adherence surface.
Time units are given in days.
Video 2
WT and coYki -/- cells on a glass surface.
Video 3
coYki -/- cells expressing a coYki rescue transgene.
Video 4
Basal region of Capsaspora cells expressing LifeAct-mScarlet.
Video 5
Medial region of WT or coYki -/- cells expressing LifeAct-mScarlet.
Video 6
Actin dynamics in a single coYki -/- cell expressing LifeAct-mScarlet.
Video 7
WT or coYki -/- cells expressing LifeAct-mScarlet within an aggregate.
Video 8
Treatment of coYki -/- cells expressing LifeAct-mScarlet with blebbistatin reduces blebbing.
Tables
Key resources table
| Reagent type (species) or resource | Designation | Source or reference | Identifiers | Additional information |
|---|---|---|---|---|
| Gene (Capsaspora owczarzaki) | coYki | GenBank | CAOG_07866 | |
| Cell line (C. owczarzaki) | WT | ATCC | 30864 | |
| Recombinant DNA reagent | pJP71 | This paper | Capsaspora EF1 promoter driving codon-optimized mScarlet | |
| Recombinant DNA reagent | pJP72 | This paper, Addgene | Plasmid #176479 | Capsaspora EF1 promoter driving codon-optimized mScarlet; Capsaspora actin promoter driving codon-optimized Geneticin resistance gene |
| Recombinant DNA reagent | pJP80 | This paper | Capsaspora EF1 promoter driving codon-optimized mScarlet N-terminally fused to recoded coYki; Capsaspora actin promoter driving codon-optimized Geneticin resistance gene | |
| Recombinant DNA reagent | pJP90 | This paper | Capsaspora EF1 promoter driving codon-optimized mScarlet fused to recoded coYki with S90A S152A S184A S305A mutations; Capsaspora actin promoter driving codon-optimized Geneticin resistance gene | |
| Recombinant DNA reagent | pJP102 | This paper, Addgene | Plasmid #176480 | Capsaspora EF1 promoter driving codon-optimized mScarlet; Capsaspora actin promoter driving codon-optimized nourseothricin N-acetyltransferase gene |
| Recombinant DNA reagent | pJP103 | This paper, Addgene | Plasmid #176481 | Capsaspora EF1 promoter driving codon-optimized mScarlet; Capsaspora actin promoter driving codon-optimized hygromycin resistance gene |
| Recombinant DNA reagent | pJP114 | This paper | Capsaspora EF1 promoter driving codon-optimized Venus; Capsaspora actin promoter driving codon-optimized Geneticin resistance gene | |
| Recombinant DNA reagent | pJP118 | This paper, Addgene | Plasmid #176494 | Capsaspora EF1 promoter driving codon-optimized LifeAct-mScarlet fusion; Capsaspora actin promoter driving codon-optimized hygromycin resistance gene |
| Recombinant DNA reagent | pJP119 | This paper | Capsaspora EF1 promoter driving recoded coYki with C-terminal OLLAS tag; Capsaspora actin promoter driving codon-optimized hygromycin resistance gene | |
| Recombinant DNA reagent | pONSY-coH2B:Venus | Addgene | Plasmid #111877 | Venus fluorescent protein fused to endogenous Histone H2B (H2B) gene of Capsaspora (CAOG_01818) |
| Sequence-based reagent | oJP101: FWD coYki ollas tag | This paper | PCR primers | accttcacaactagtggtacATGCAGCAGCAACAGCAAC |
| Sequence-based reagent | oJP102: REV coYki ollas tag | This paper | PCR primers | aaacacaaaatgcggccgccttacttgcccatgaggcggggtcc gagttcgttggcaaagcccgacgagccacccgagccgccGGC GATGTCAAAGACGGAG |
| Sequence-based reagent | oJP103: FWD Venus | This paper | PCR primers | accttcacaactagtggtaccATGGTGAGCAAGGGCGAG |
| Sequence-based reagent | oJP104: REV Venus | This paper | PCR primers | aaacacaaaatgcggccgccttaagaCTTGTACAGCTCGTCCATGC |
| Sequence-based reagent | oJP105: FWD coYki deletion arms +act promoter | This paper | PCR primers | tctgtgtcttcggcgtcacagcatggcagcggagagta cctggcgatggacacgacgggtcggggaagcactgtcgatccgctttacgct ACAAAAATGCTGATTGTTTG |
| Sequence-based reagent | oJP106: REV coYki deletion arms + act terminator | This paper | PCR primers | gccggcagaagactgccgcgagtggaaggca accgggggaaatgtggatccgttcatgatcaattggg gctggtgcggcacgaaggaaatTTTTTTCTTTGTACAAGATCAC |
| Sequence-based reagent | oJP107: FWD DIAG coYKi WT | This paper | PCR primers | AATCACAGCTGCAGCATCAC |
| Sequence-based reagent | oJP108: REV DIAG coYKi WT | This paper | PCR primers | CACCTGCTTCCGACATGG |
| Sequence-based reagent | oJP109: REV DIAG GenR internal | This paper | PCR primers | TCTGAAACTCGTCCAAAACG |
| Sequence-based reagent | oJP110: REV DIAG NatR internal | This paper | PCR primers | GTGAAAGAGCCATCCAGAGC |
| Sequence-based reagent | oJP111: FWD qPCR Capsaspora GAPDH | This paper | PCR primers | GGACGATCAACTTCCACCAG |
| Sequence-based reagent | oJP112: REV qPCR Capsaspora GAPDH | This paper | PCR primers | TGGTGGTGAAGACACCAGTC |
| Sequence-based reagent | oJP113: FWD qPCR coYki deleted region | This paper | PCR primers | GTCCGAGTCCAACCAATACC |
| Sequence-based reagent | oJP114: REV qPCR coYki deleted region | This paper | PCR primers | CAATGGTGGCATTGAGAGTG |
| Sequence-based reagent | oJP115: FWD amplification across coYki deletion | This paper | PCR primers | ATGCACGTCCGAGAAAGC |
| Sequence-based reagent | oJP116: REV amplification across coYki deletion | This paper | PCR primers | TTATGACTTTGGGACGTTGG |
| Commercial assay or kit | TransIT-X2 Dynamic Delivery Sysyem | Mirus Bio | MIR 6003 |
Additional files
-
Supplementary file 1
Genes downregulated in coYki -/- cells.
- https://cdn.elifesciences.org/articles/77598/elife-77598-supp1-v1.xlsx
-
Supplementary file 2
Genes upregulated in coYki -/- cells.
- https://cdn.elifesciences.org/articles/77598/elife-77598-supp2-v1.xlsx
-
Supplementary file 3
Predicted actin-binding genes (Gene Ontology term GO:0003779) from the set of genes upregulated in coYki -/- cells.
- https://cdn.elifesciences.org/articles/77598/elife-77598-supp3-v1.xlsx
-
Supplementary file 4
Mammalian orthologs of Capsaspora genes differentially regulated in coYki -/- cells.
- https://cdn.elifesciences.org/articles/77598/elife-77598-supp4-v1.xlsx
-
Supplementary file 5
Sequences of synthesized gene fragments used in this study.
- https://cdn.elifesciences.org/articles/77598/elife-77598-supp5-v1.xlsx
-
Transparent reporting form
- https://cdn.elifesciences.org/articles/77598/elife-77598-transrepform1-v1.pdf
Download links
A two-part list of links to download the article, or parts of the article, in various formats.
Downloads (link to download the article as PDF)
Open citations (links to open the citations from this article in various online reference manager services)
Cite this article (links to download the citations from this article in formats compatible with various reference manager tools)
Genome editing in the unicellular holozoan Capsaspora owczarzaki suggests a premetazoan role for the Hippo pathway in multicellular morphogenesis
eLife 11:e77598.
https://doi.org/10.7554/eLife.77598


