Feedback inhibition underlies new computational functions of cerebellar interneurons
- Center for Learning and Memory, The University of Texas, United States
- Program in Neuroscience & Mental Health, Lee Kong Chian School of Medicine, Nanyang Technological University, Singapore
- Institute of Molecular and Cell Biology, Singapore
- Department of Neuroscience, The University of Texas, United States
Figures
Figure 1
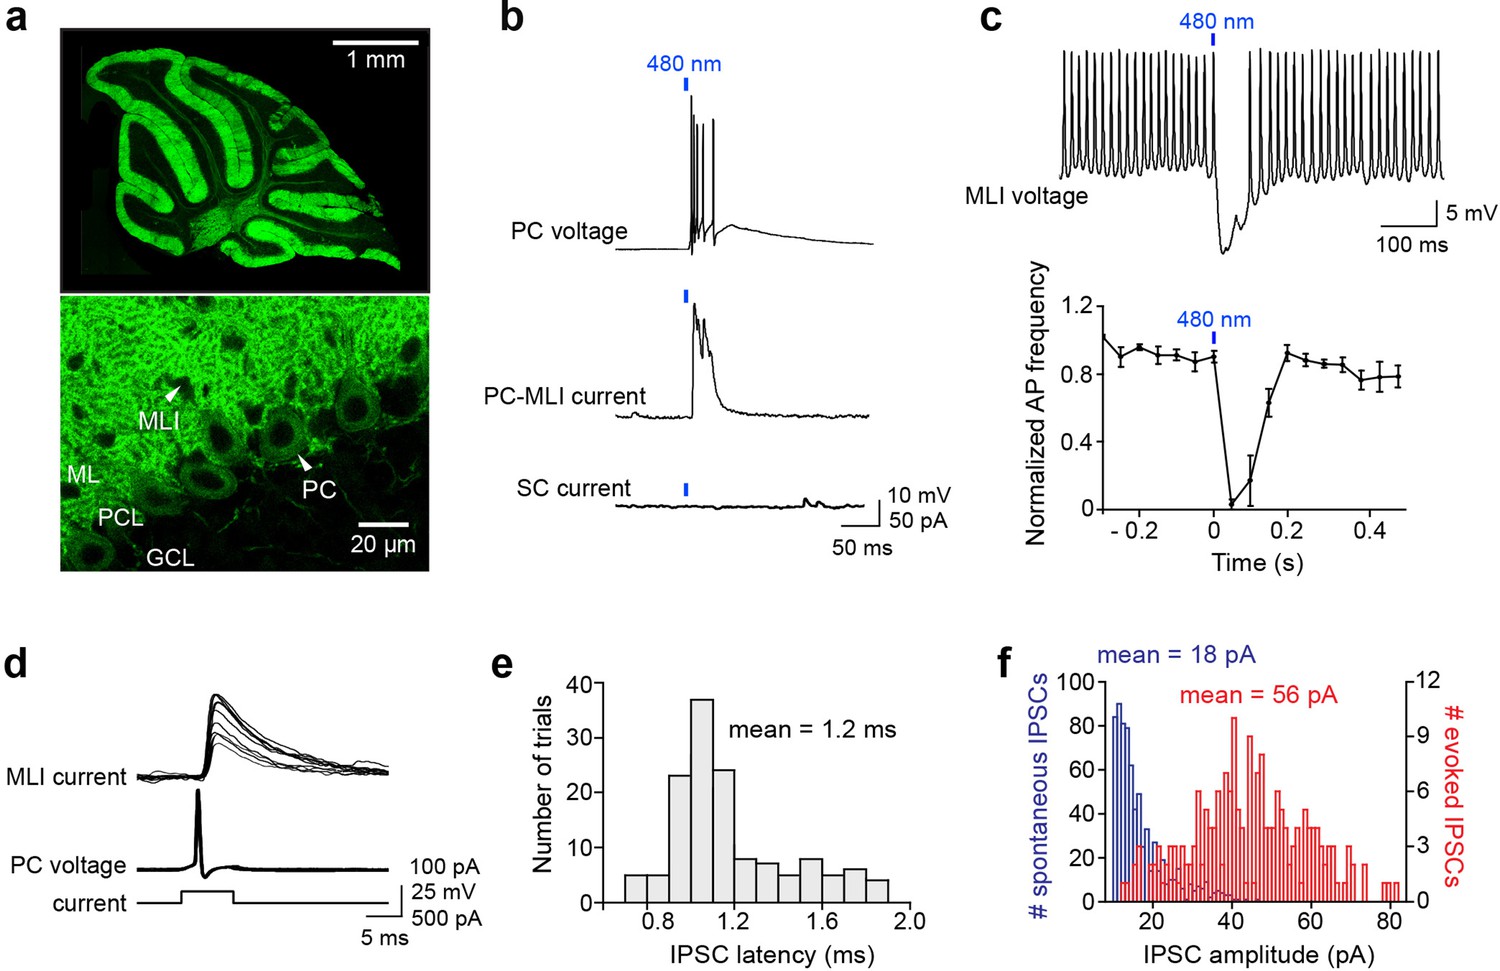
Optogenetic interrogation of Purkinje cell (PC) to molecular layer interneuron (MLI) circuit.
(a) Selective expression of ChR2 in cerebellar PCs. Top: Image of ChR2-YFP fluorescence (green) in a sagittal cerebellum section from PCP2-Cre; Ai32 double transgenic mice. Strong ChR2 expression was observed throughout the entire cerebellar cortex, especially in the molecular layer where PC dendrites are located. Bottom: Higher-magnification image shows expression of ChR2-YFP in PC soma (arrowhead) and dendrites. Small black holes (arrowhead) in the molecular layer represent somata of MLI that do not express ChR2-YFP. ML, molecular layer; PCL, Purkinje cell layer; GCL, granule cell layer. (b) Brief illumination (480 nm, 5 ms, 9.9 mW/mm2) evoked action potentials in ChR2-expressing PCs (top). Photostimulated PCs induced inhibitory postsynaptic currents (IPSCs) in PC-MLI cells (center) but not in stellate cells (SC; bottom). (c) Top: Photostimulation of PCs inhibited firing in a postsynaptic MLI. PC-MLI was depolarized by a depolarizing current (20 pA) to sustain action potential firing. Bottom: Activation of PCs input (at blue bar) was sufficient to briefly but completely inhibit action potential firing in postsynaptic PC-MLI cells. Points indicate means and error bars represent SEMs (n=4). (d) Superimposed traces of recordings from a connected PC and PC-MLI pair. Action potentials in a presynaptic PC (middle traces), caused by depolarizing current pulses (bottom traces), induced IPSCs in the postsynaptic PC-MLI (top traces). PC-MLI holding potential was –50 mV. (e) Distribution of IPSC latencies measured in seven PC-MLI pairs (140 trials). Mean IPSC latency was 1.2 ms with relatively low synaptic jitter (0.03 ms). (f) Distribution of amplitudes of spontaneous (blue) and evoked (red) IPSCs in PC-MLIs.
-
Figure 1—source data 1
Source files for properties of inhibitory input from PCs to PC-MLIs.
MLIs, molecular layer interneurons; PCs, Purkinje cells.
- https://cdn.elifesciences.org/articles/77603/elife-77603-fig1-data1-v2.xlsx
Figure 2 with 1 supplement
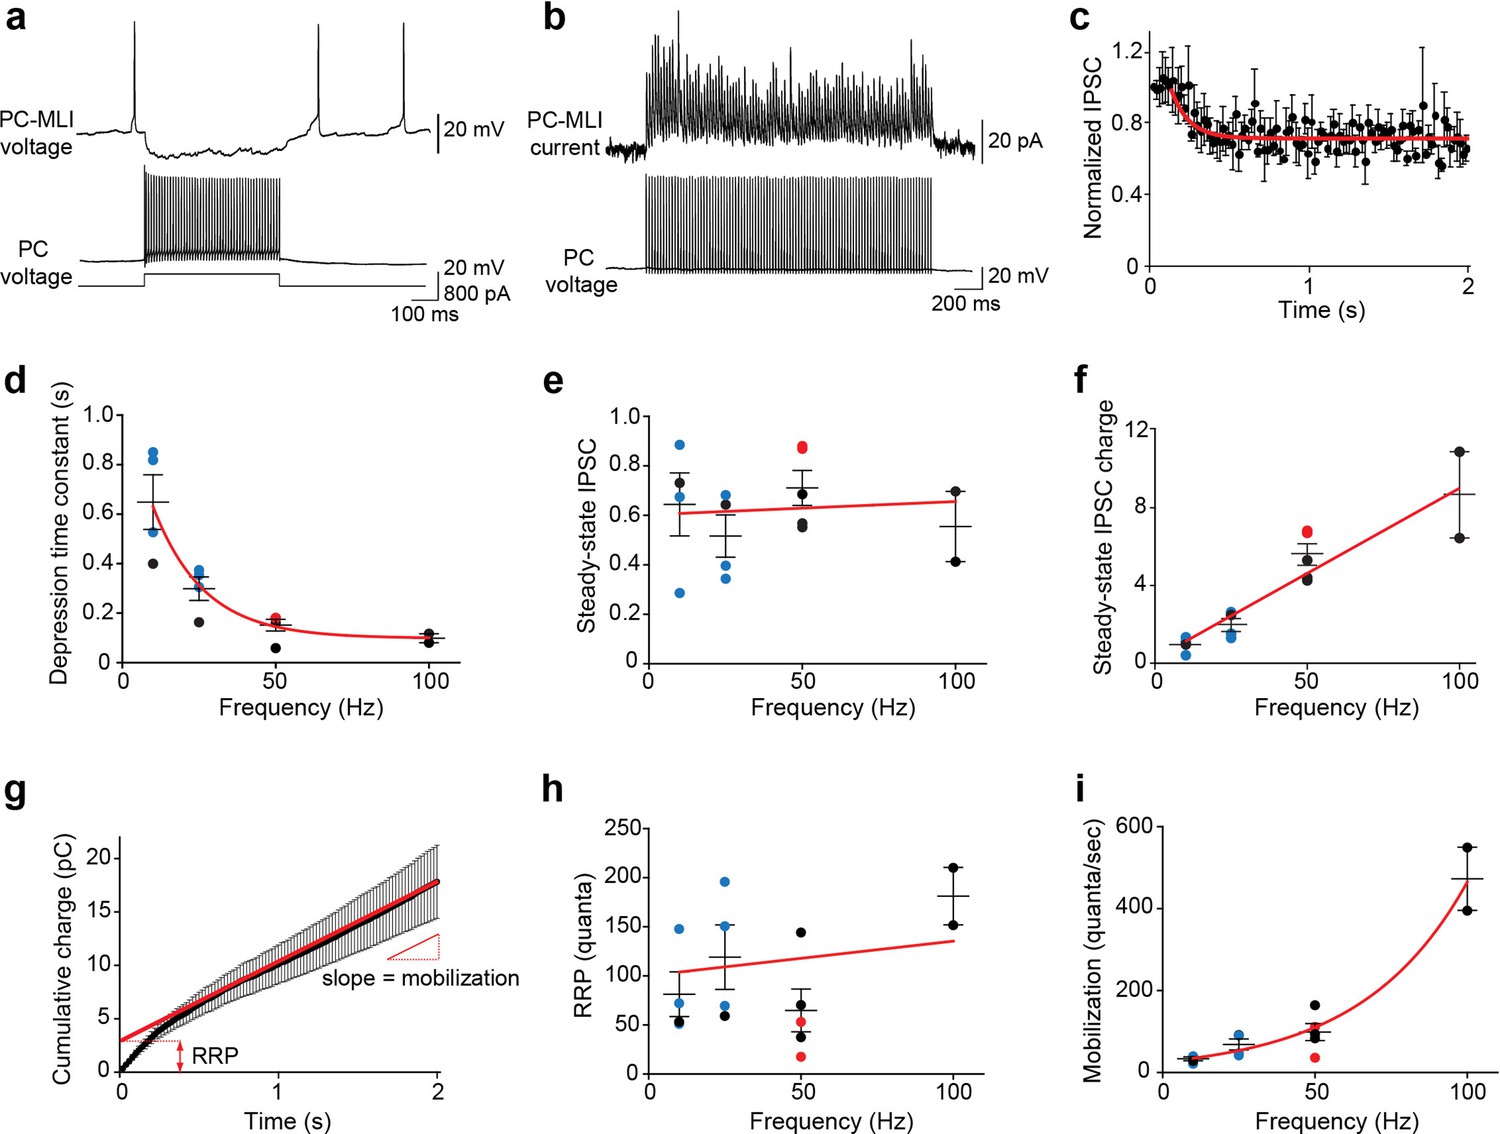
Frequency-independent depression at PC-to-PC-MLI synapses.
(a) Synaptic transmission at a connected PC and PC-MLI pair. 100 Hz firing in the presynaptic PC (bottom) produced a sustained inhibition of the postsynaptic PC-MLI (top). Stimulus duration was 500 ms. (b) Average inhibitory postsynaptic currents (IPSCs) (10 trials) evoked by 100 stimuli (50 Hz, 2 s) from a connected PC and PC-MLI pair. During such trains of synaptic activity IPSCs often initially showed facilitation, indicated by an increase in IPSC amplitude, which was followed by relatively mild synaptic depression, indicated by a reduction in IPSC amplitude to levels below that of the first IPSC in the train. (c) Kinetics of synaptic depression during sustained synaptic activity. IPSC amplitudes were normalized to the first IPSC for each response in the 50 Hz stimulus train. Points indicate mean values and bars are ± SEMs (n=5), while red line is an exponential fit to the time course of depression of IPSCs. (d) Depression time constants were measured from exponential fits, as in (c), at different stimulation frequencies. Symbols represent data collected via different methods of stimulation of presynaptic PCs: blue = photostimulation; red = intracellular current injection in dual recordings; black = extracellular stimulation. Red line is an exponential fit to the data. (e) Steady-state amplitudes of IPSCs measured during stimulus trains of different frequencies; values are normalized to the first response in a train, as in (c). Red line indicates a linear fit to the data; slope of the line was not significantly different from 0 (p=0.85, F-test), indicating no significant influence of stimulus frequency on steady-state IPSC amplitude. (f) Steady-state charge transfer (IPSC amplitude × frequency) measured at different frequencies of synaptic activity. Colored symbols represent mean values determined for individual experiments, using the color code described in (d), and bars indicate ± SEM. Red line represents a linear fit to the data and indicates a dramatic, frequency-dependent enhancement of synaptic transmission. (g) Kinetics of synaptic charge transfer during a stimulus train. Points indicate IPSC charge integrated over time during 50 Hz stimulation, while bars indicate means ± SEM (n=5). The last 20 data points were fit by linear regression (red line) to estimate the size of the readily releasable pool (RRP; y-intercept) and mobilization rate (slope). (h) The analysis shown in (g) was used to measure RRP size at different stimulus frequencies. Red line indicates a linear fit to the data; slope of approximately zero indicates no consistent effect of stimulus frequency on RRP size. (i) Rate of synaptic vesicle mobilization from the reserve pool to the RRP was estimated using the analysis shown in (g). Points represent mean values determined for individual experiments, while bars are means ± SEM. Red line is an exponential fit to the data and indicates a large influence of stimulus frequency on the rate of vesicle mobilization. MLI, molecular layer interneuron; PC, Purkinje cell.
-
Figure 2—source data 1
Source files for properties of synaptic depression at PC-to-PC-MLI synapses.
MLI, molecular layer interneuron; PC, Purkinje cell.
- https://cdn.elifesciences.org/articles/77603/elife-77603-fig2-data1-v2.xlsx
Figure 2—figure supplement 1
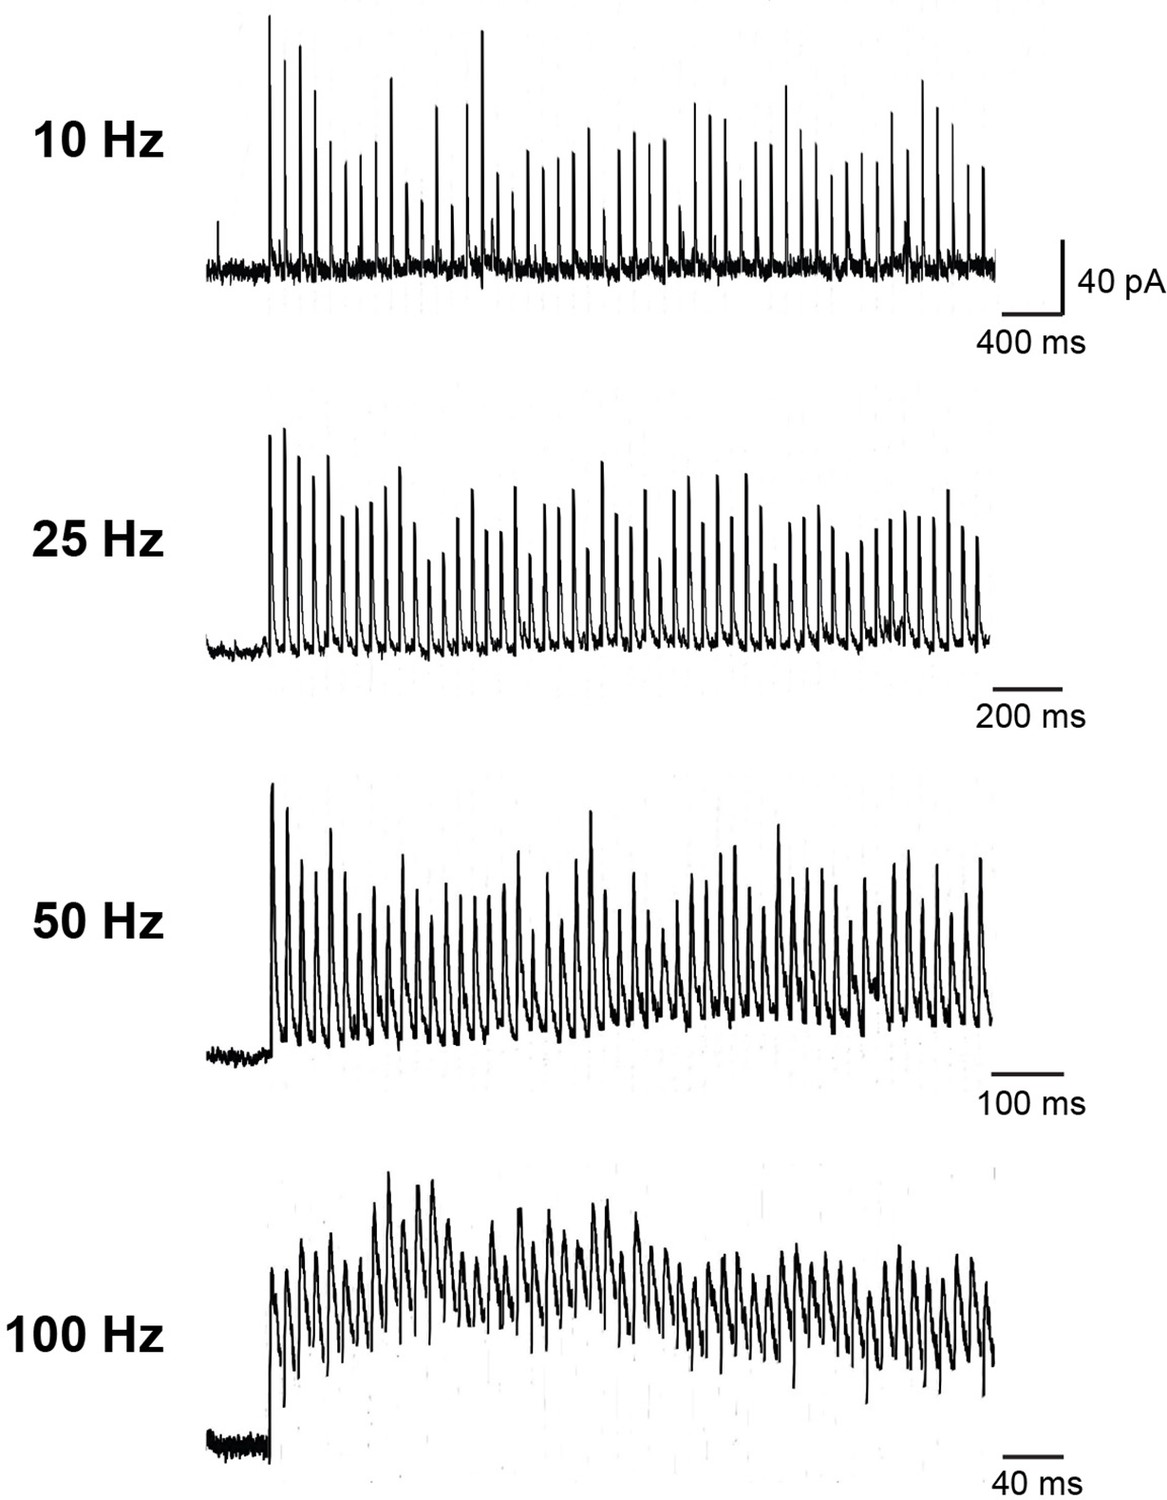
Synaptic transmission between a Purkinje cell (PC) and a PC-MLI at different frequencies of activation.
Examples of 50 inhibitory postsynaptic currents (IPSCs) evoked by extracellular stimulation at the indicated frequencies. Stimulus artifacts were removed for clarity. Similar responses were observed when presynaptic PCs were stimulated by intracellular current injection or photostimulation. MLI, molecular layer interneuron.
Figure 3
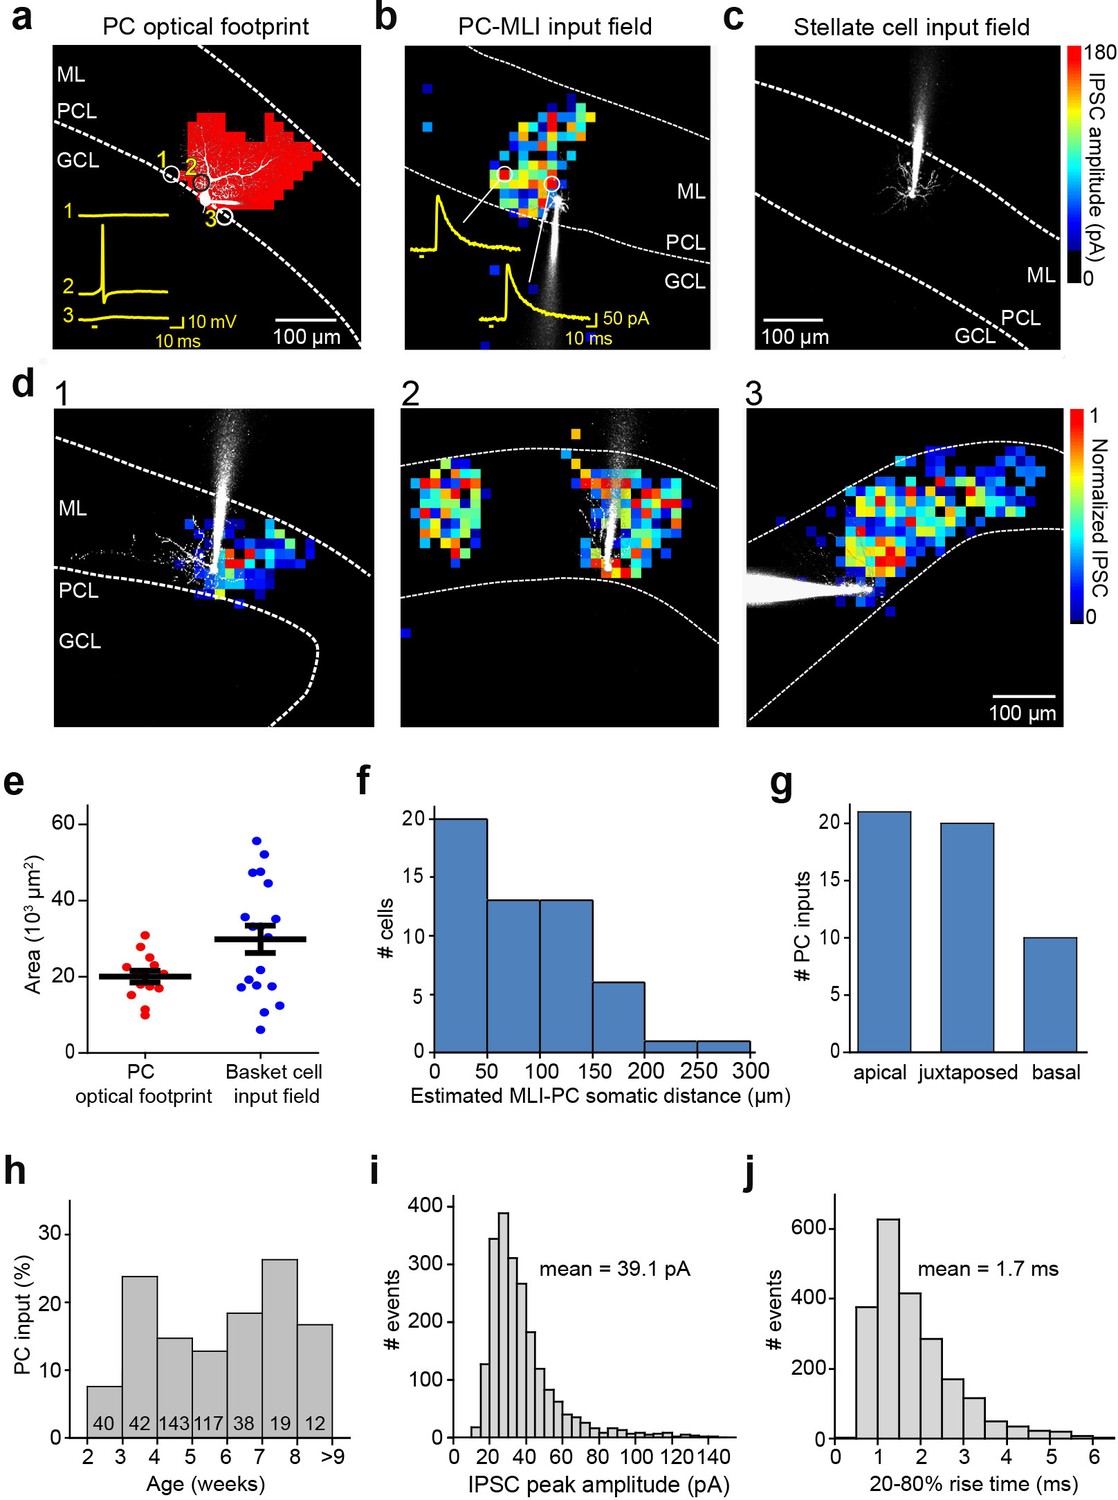
Spatial organization of PC-to-MLI circuit.
(a) Scanning a brief laser light spot (405 nm, 3 µW, 4 ms duration) across a cerebellar slice revealed locations (red pixels) where photostimulation evoked action potentials in a ChR2-expressing, dye-filled PC (white). Numbered traces (yellow) in the inset show membrane potential changes produced when laser spot was located at the indicated pixels. Bar below traces indicates time of light flashes. Action potentials were evoked when the light spot was located over the cell body and entire dendritic region of the PC. ML, molecular layer; PCL, Purkinje cell layer; GCL, granule cell layer. (b) Map of inhibitory input from a presynaptic PC to a postsynaptic PC-MLI was created by correlating light spot location with amplitude of inhibitory postsynaptic currents (IPSCs) evoked by focal photostimulation of PCs. IPSC amplitudes are encoded in the pseudocolor scale shown at right. Traces show IPSCs evoked at the indicated locations and bars indicate time of light flashes. (c) No inhibitory input from PCs was detected in stellate cells. (d) Varied spatial organization of PC inputs to PC-MLIs. Maps illustrate IPSC amplitudes (pseudocolor scale at right) evoked in three different dye-filled PC-MLIs (white) shown in panels 1–3. (e) Comparison of input field area of PC-MLIs (blue, n=18) with PC optical footprints (red, n=14). (f) Distance between postsynaptic PC-MLIs and presynaptic PCs. PC soma location was estimated from the center of the input field, projected down to the PCL. (g) Orientation of postsynaptic PC-MLIs, relative to presynaptic PCs. (h) Connectivity between PCs and PC-MLIs measured at different ages. Numbers inside bars indicate sample sizes. (i) Distribution of amplitudes of IPSCs evoked by focal photostimulation of PCs. Holding potential was –40 mV. (j) Distribution of rise times of light-evoked IPSCs. MLI, molecular layer interneuron; PC, Purkinje cell.
-
Figure 3—source data 1
Source files for spatiotemporal organization of PC-to-PC-MLI circuit revealed by optogenetic mapping experiment.
MLI, molecular layer interneuron; PC, Purkinje cell.
- https://cdn.elifesciences.org/articles/77603/elife-77603-fig3-data1-v2.xlsx
Figure 4
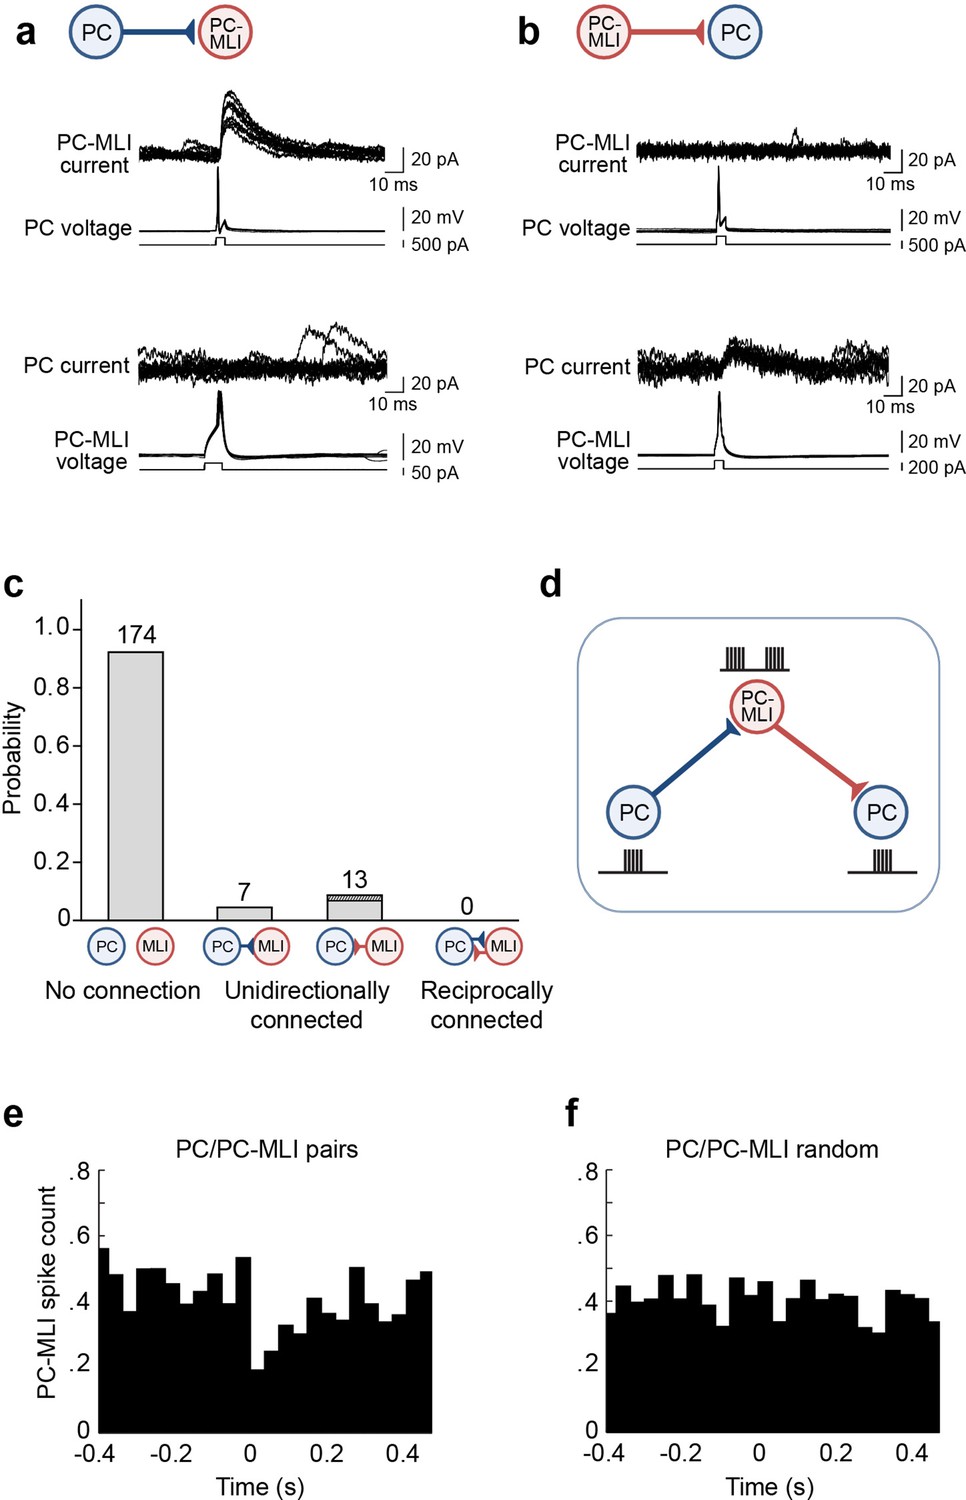
Evidence for non-reciprocal arrangement of inhibitory circuits between molecular layer interneurons (MLIs) and Purkinje cells (PCs).
(a) Action potentials evoked in a presynaptic PC induced inhibitory postsynaptic currents (IPSCs) in a postsynaptic PC-MLI (top). However, action potentials in the PC-MLI did not evoke IPSCs in the PC (bottom). (b) Inhibitory inputs from PC-MLIs to PCs could also be observed (bottom). Again, these were non-reciprocal because stimulating the PC did not evoke IPSCs in the PC-MLI (top). (c) Probability of connections between PCs and MLIs observed in dual recordings. Only unidirectional connections were detected (n=194). Among the 13 MLI-to-PC connections observed, 3 (dark shading) involved confirmed PC-MLIs (as indicated by their inhibitory responses to PC photostimulation). (d) Proposed organization of circuits between PCs and PC-MLIs. PC-mediated inhibition of PC-MLI activity may disinhibit neighboring PCs, as indicated by schematics of activity next to each cell. (e, f) Temporal relationship between action potential firing, including both evoked and spontaneous PC action potentials, in connected PC/PC-MLI pairs in brain slices. Cross-correlations (at time lag = 0) between presynaptic PC and postsynaptic PC-MLI pairs (e) and activity in the same pair of cells after randomly shuffling the timing of PC spikes (f). The inhibitory connection between PCs and PC-MLIs yielded a strong, but transient, inverse activity correlation.
-
Figure 4—source data 1
Source file for temporal relationship in connected PC/PC-MLI pairs.
MLI, molecular layer interneuron; PC, Purkinje cell.
- https://cdn.elifesciences.org/articles/77603/elife-77603-fig4-data1-v2.xlsx
Figure 5

Relationship between molecular layer interneuron (MLI) activity and eyelid conditioning behavior.
(a) Circuit diagram showing main connections and sites of plasticity for the computer simulation of the cerebellum. Green indicates potential plasticity at granule cell-to-MLI synapses and blue indicates plasticity at granule cell-to-PC synapses. Red indicates the inhibitory feedback connection from PCs to MLIs that is the main focus of our paper. (b) Cross-correlations between MLI activity and eyelid conditioned responses (CRs). The top two panels show data from a computer simulation of the cerebellum. In well-trained simulations, correlations were calculated between MLI activity and the predicted CRs. (1) The simulation without feedback from PCs to MLIs yielded a distribution of correlations centered around zero for all MLIs (white bars indicate stellate cells and gray bars indicate basket cells). (2) Simulations with PC-to-MLI feedback exhibited two distributions, one from a subset of MLIs that is shifted in the positive direction (gray bars) and the other centered around zero (white bars). (3) Distribution of correlations between CRs and MLI activity recorded in vivo for all interstimulus intervals (ISIs) can be fit with two distributions, one shifted in the positive direction (red curve) and one centered around zero (blue curve) similar to the simulation with the PC to MLI feedback. The cutoff for categorizing an MLI as a PC-MLI (gray bars) was a correlation coefficient ≥0.43, which represents the point where there was a 0.95 probability that the two fitted distributions were different. PC, Purkinje cell.
Figure 6 with 1 supplement
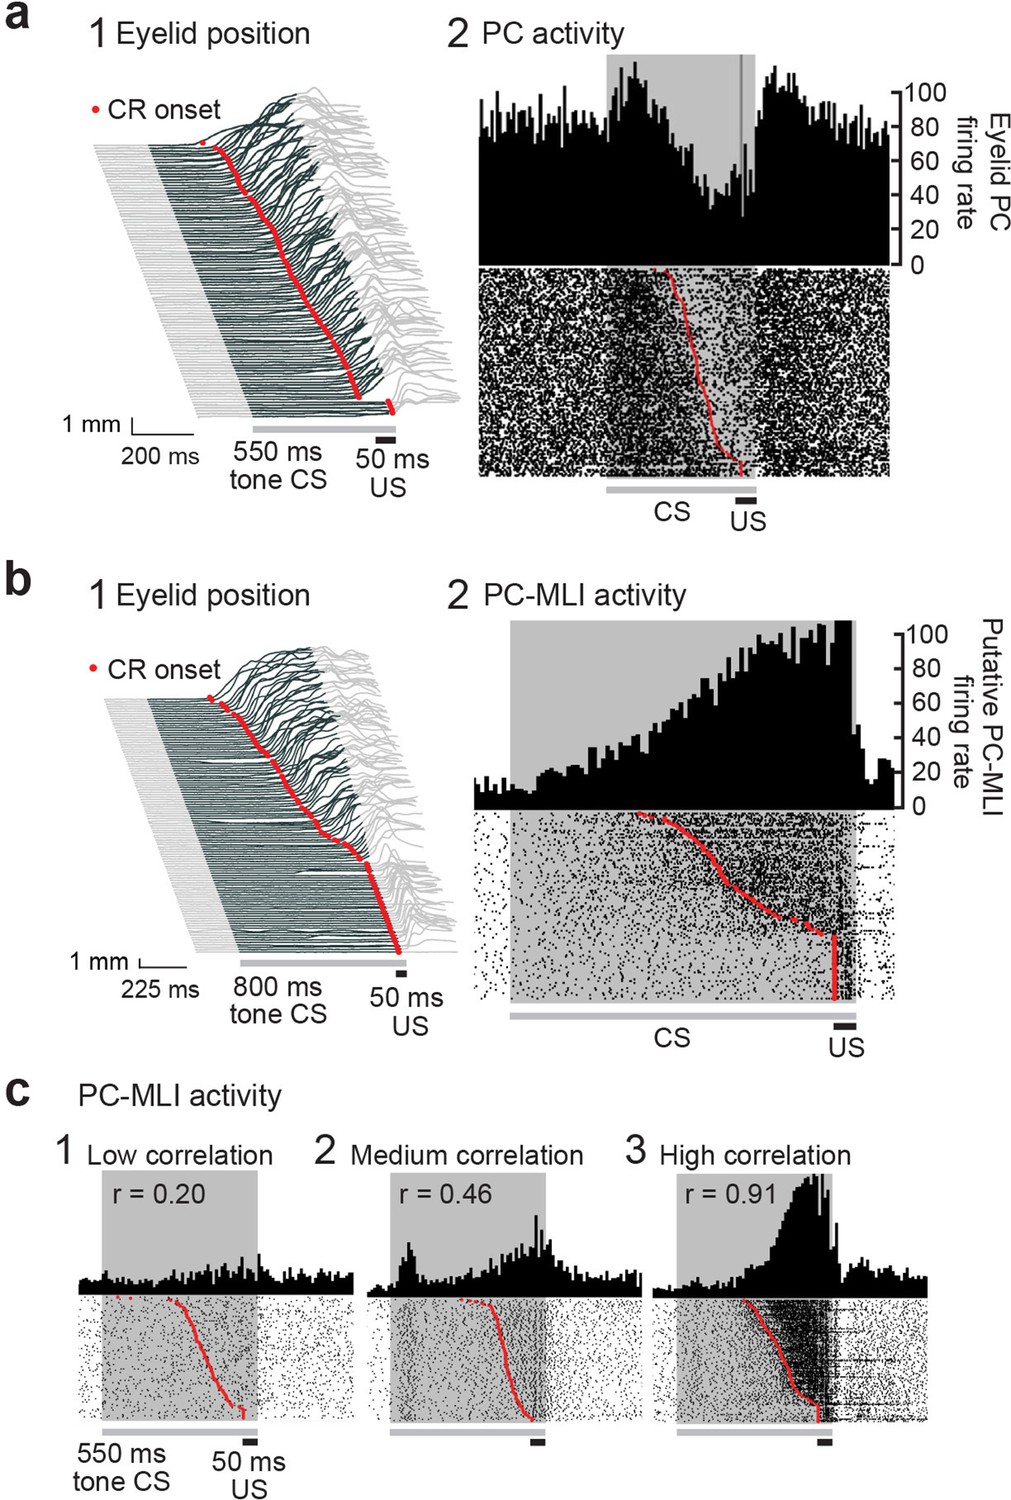
Changes in Purkinje cell (PC) and PC-MLI activity correlated with eyelid position during eyelid conditioning.
(a) (1) Eyelid movements (vertical) in response to conditioned stimuli (CS; tone) and unconditioned stimuli (US; eyelid stimulation), sorted by the latency of the conditioned response (CR; red points). Upward deflection indicates eyelid closure, with closure indicated by dark gray lines reflecting CRs. (2) Peri-stimulus time histogram (top; 10 ms bins) and raster plot (bottom) of an eyelid PC recording from all trials of the eyelid conditioning session shown at left. For this and all subsequent raster plots, the gray bar under the plot indicates duration of the CS and the black bar indicates the duration of the US. (b) Peri-stimulus time histogram (top; 10 ms bins) and raster plot (bottom) of a recording from a putative PC-MLI (2), along with the behavior from all trials of the eyelid conditioning session during the recording (1), sorted by the latency of the CRs (red points). (c) Examples of the wide range of MLI responses observed in vivo during CRs. Peri-stimulus time histograms (10 ms bins) and raster plots sorted by response latency (red points) for three MLIs. Example 1 is from the low-correlation (r=0.20) part of the distribution shown in Figure 5b3. Examples 2 (r=0.46) and 3 (r=0.91) were operationally defined as eyelid PC-MLIs due to their high correlation with CR behavior. MLI, molecular layer interneuron.
Figure 6—figure supplement 1
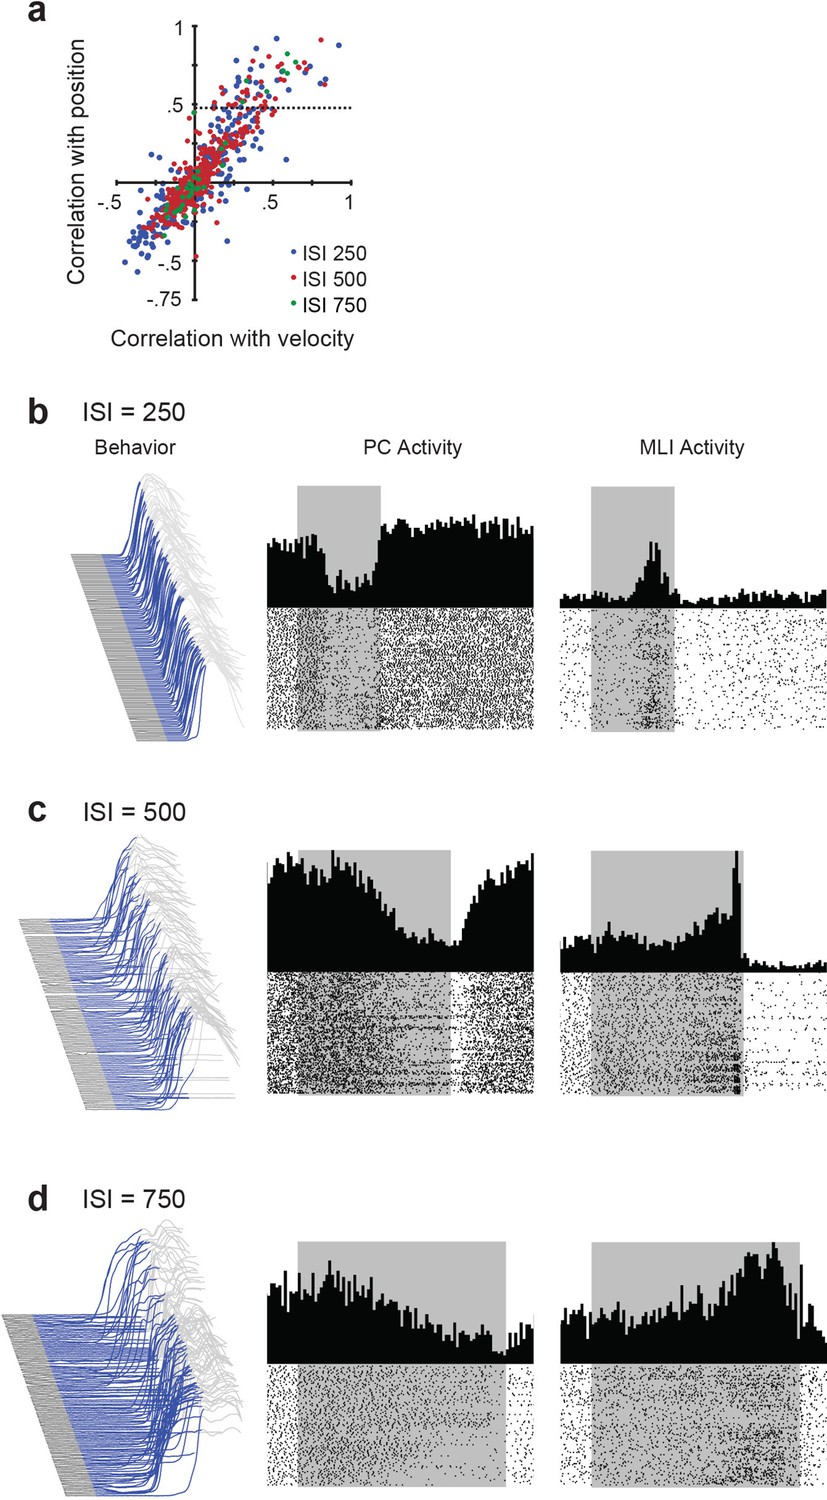
Relationship between simultaneously recorded activity of eyelid molecular layer interneurons (MLIs) and eyelid Purkinje cells (PCs) and conditioned eyelid responses.
(a) Scatter plot obtained from for all MLI recordings showing the cross-correlation between MLI activity and either eyelid position or velocity at three different interstimulus intervals (ISIs). Very few MLIs correlated more highly with velocity than position. All correlations above the dotted horizontal line (correlation of 0.43) were classified as putative eyelid PC-MLIs. (b–d) Eyelid movements and the activity of a PC and a putative PC-MLI simultaneously measured at different ISIs. Left – Eyelid movement during a conditioning session. Blue area indicates the duration of the tone stimulus (conditioned stimulus) and upward deflection is the conditioned response of the eyelid. Center – Peri-stimulus time histograms and raster plots of eyelid PC activity measured during the session shown at left. Right – Peri-stimulus time histograms and raster plots of putative eyelid PC-MLI activity measured during the same session. These are the same data shown in Figure 9a and b and are shown here to illustrate how trial-to-trial variability in conditioned response timing can obscure the appearance of the tight relationship between eyelid MLIs and PCs; this relationship becomes clear once the data are sorted by time of onset of the conditioned response, as in Figure 9a and b.
Figure 7 with 1 supplement
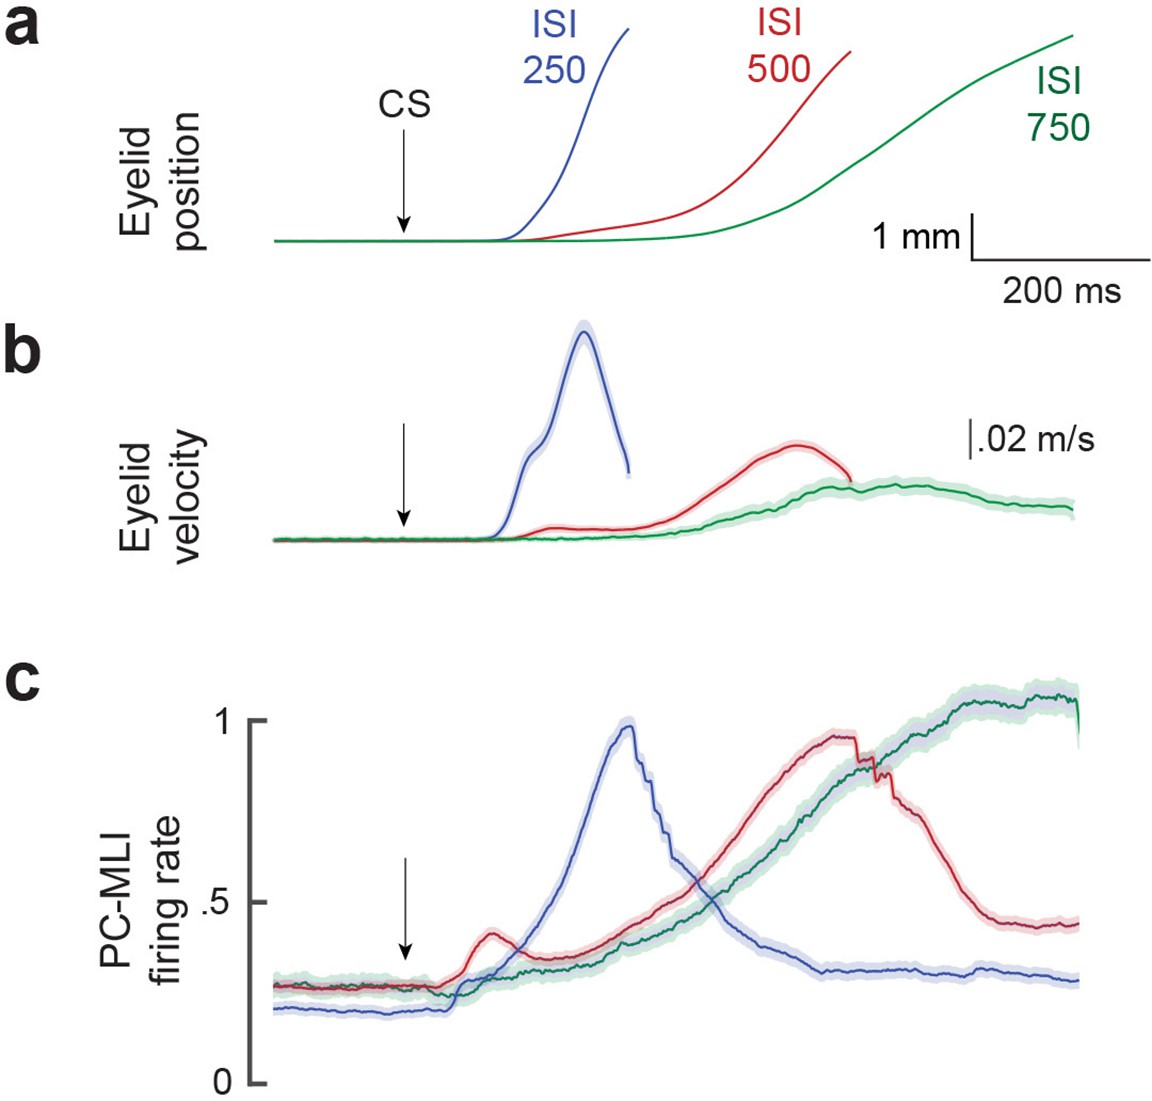
Comparison of mean firing rate of PC-MLI to the kinematics (position and velocity) of eyelid conditioned response (CR).
Average eyelid position (a), velocity (b) and normalized average eyelid PC-MLI activity (c) shown for three different interstimulus intervals (ISIs) (ISI 250, 25 PC/PC-MLI pairs; ISI 500, 36 pairs; ISI 750, 10 pairs). The shaded region represents the 95% confidence intervals and arrows represent time of conditioned stimulus (CS) onset. MLI, molecular layer interneuron; PC, Purkinje cell.
Figure 7—figure supplement 1
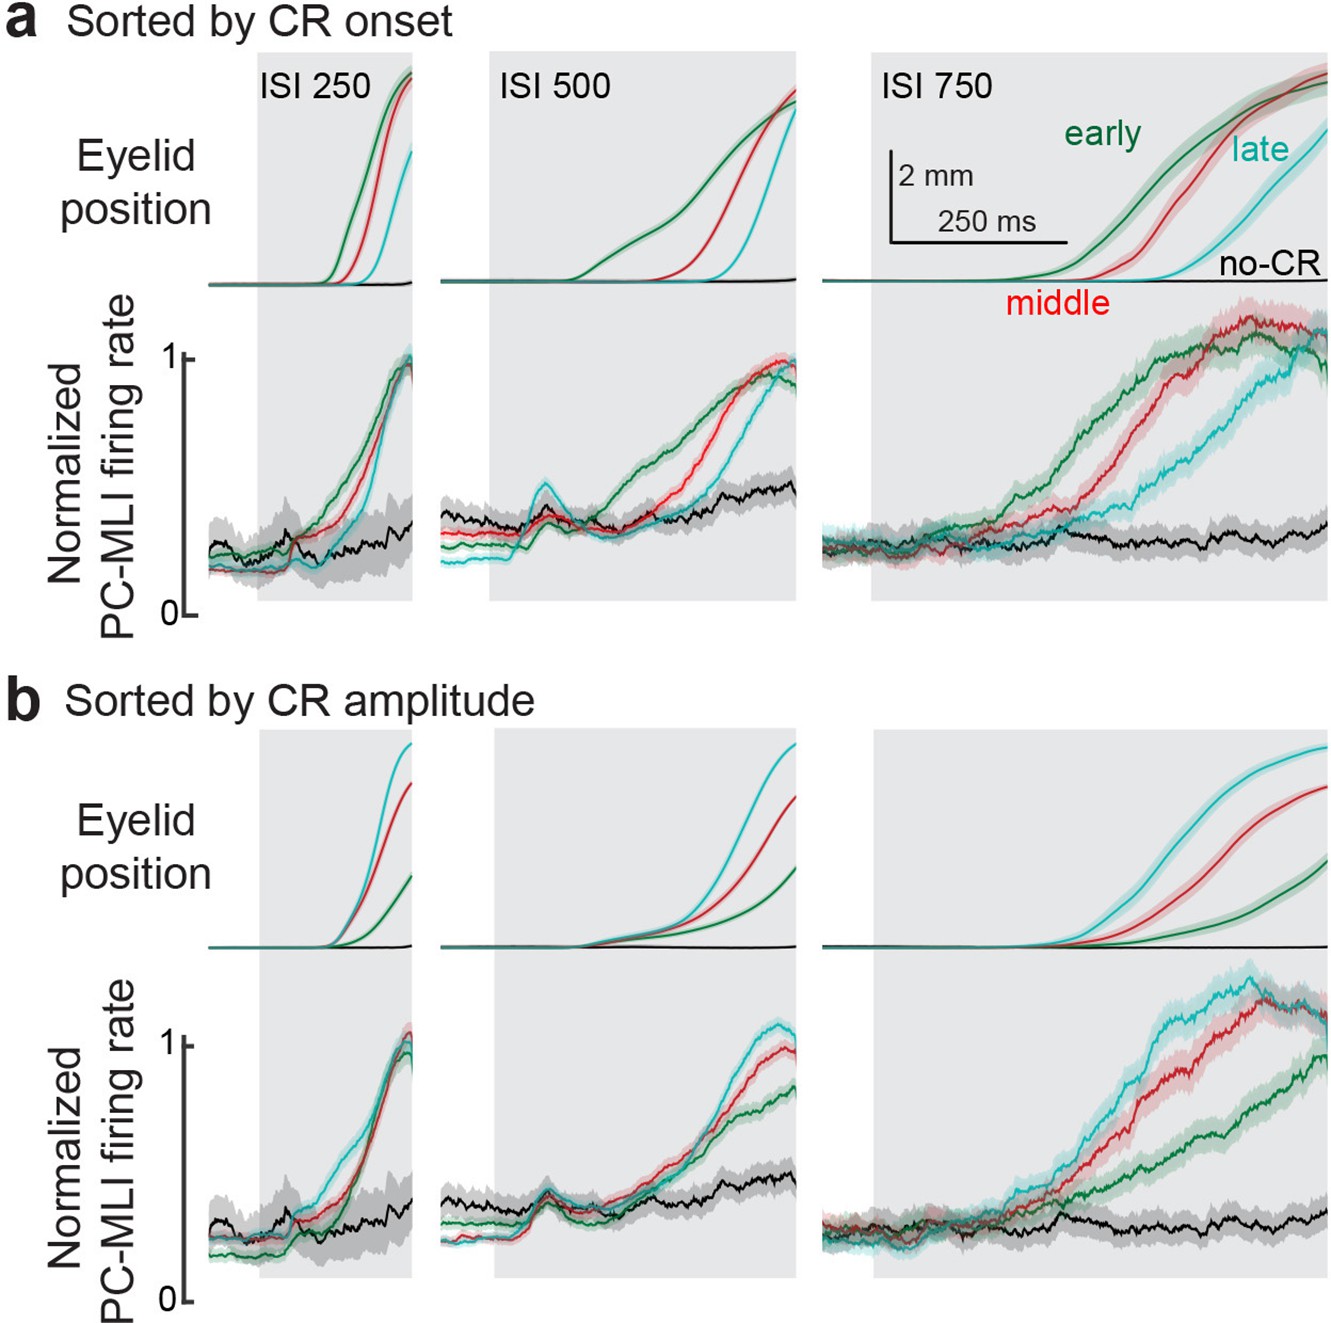
Normalized eyelid PC-MLI activity sorted by response onset or amplitude.
(a) Average eyelid conditioned responses (CRs) and average responses of eyelid PC-MLIs grouped by latency to onset of the eyelid CRs. Eyelid PC-MLI activity from the corresponding groups was normalized to the maximum firing rate and averaged to determine the relationship between eyelid PC-MLI activity and differently timed eyelid CRs within each interstimulus interval (ISI). Green represents the earliest onset group, red the middle onset, cyan the latest onset, and black the non-responses for each ISI. (b) Same as in a, but responses were sorted according to the amplitude of the eyelid CRs at the end of the ISI. Cyan represents the largest amplitude responses, red the middle amplitude, green the smallest, and black the non-responses. Shaded regions represent 95% confidence intervals. MLI, molecular layer interneuron; PC, Purkinje cell.
-
Figure 7—figure supplement 1—source data 1
Source files for eyelid position and normalized eyelid PC-MLI firing rate sorted by conditioned response (CR) onset and amplitude (Figure 7—figure supplement 1).
MLI, molecular layer interneuron; PC, Purkinje cell.
- https://cdn.elifesciences.org/articles/77603/elife-77603-fig7-figsupp1-data1-v2.xlsx
Figure 8 with 1 supplement
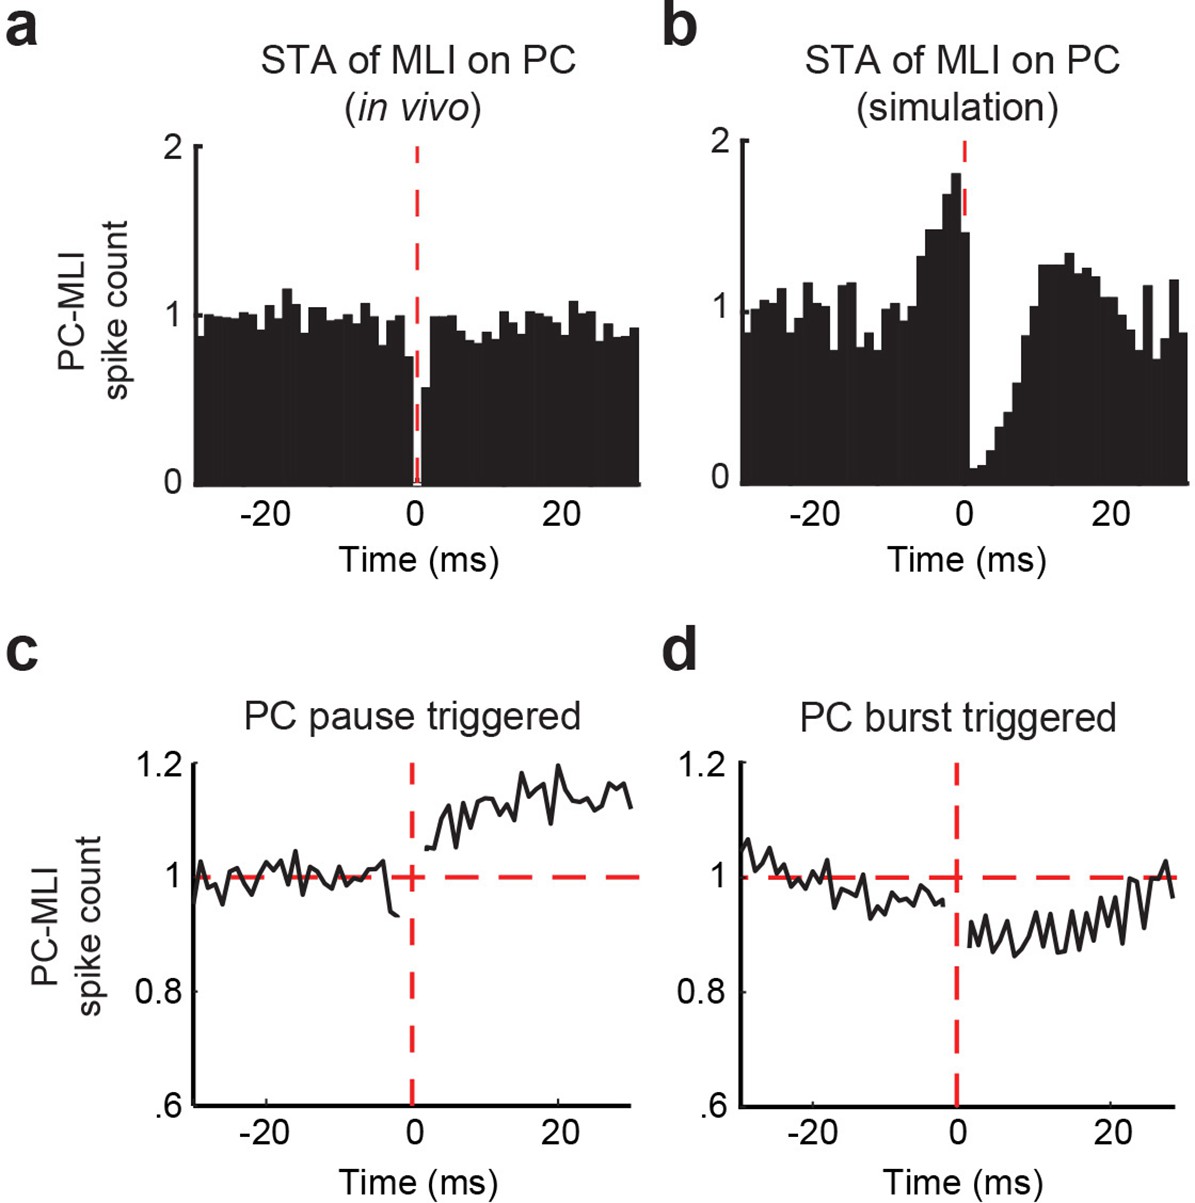
Temporal relationship between connected Purkinje cells (PCs) and putative PC-MLIs.
(a and b) Average cross-correlograms calculated from significantly modulated pairs of MLIs and eyelid PCs. Background activity of putative PC-MLI is triggered off PC simple spikes (vertical red line), for PC-MLI and PC pairs recorded on the same tetrode (a) and from the computer simulation (b). Decrease in MLI activity after a PC simple spike indicates an inverse relationship between the activity of the two cell types. (c and d) Average PC pause-triggered (c) and burst-triggered (d) cross-correlograms of putative PC-MLI background activity. Plots show average PC-MLI activity across significant pairs recorded on the same tetrode. Pauses in PC simple spikes resulted in an increase in mean PC-MLI activity, while bursts of PC simple spikes resulted in a decrease in mean PC-MLI activity. MLIs, molecular layer interneurons.
Figure 8—figure supplement 1
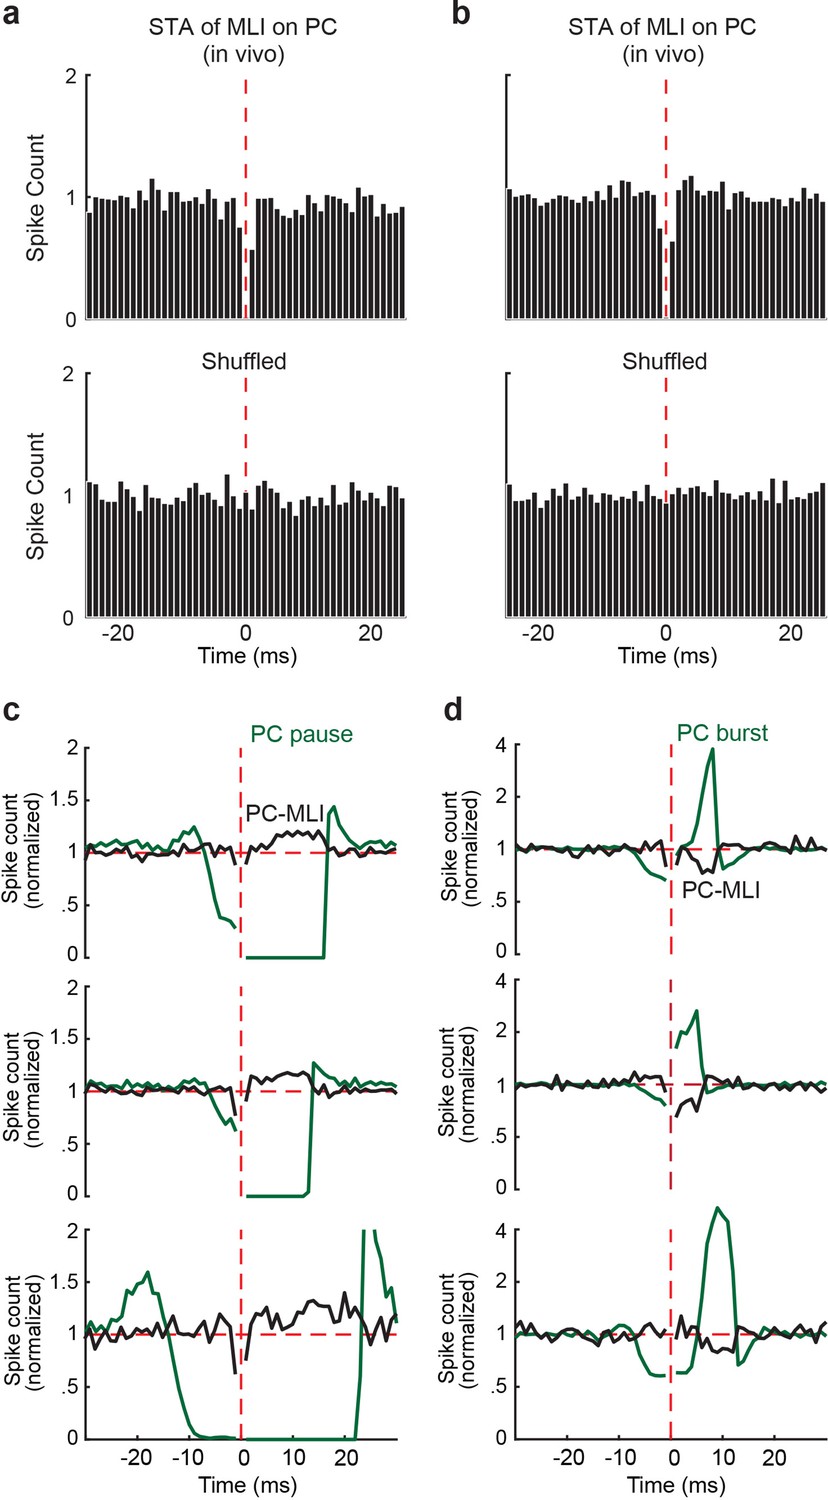
Relationship between baseline activity of PC-MLIs and PCs simultaneously recorded from the same tetrode.
(a and b) Two examples of spike-triggered averages of MLI background activity triggered off PC simple spikes (vertical red line), recorded on the same tetrode. A total of six in vivo MLI/PC pairs showed a significant decrease in MLI activity after a PC spike. The post-spike decrease in MLI activity was abolished by shuffling the data. (c and d) Representative pause-triggered (c) and burst-triggered (d) cross-correlograms between background activity of putative PC-MLI (black) and eyelid PC simple spikes (green) recorded on the same tetrode for three different cell pairs. In all cases, pauses in PC simple spikes were associated with an increase in PC-MLI activity, while bursts of PC simple spikes were associated with a decrease in PC-MLI activity. MLI, molecular layer interneurons; PC, Purkinje cell.
Figure 9 with 2 supplements
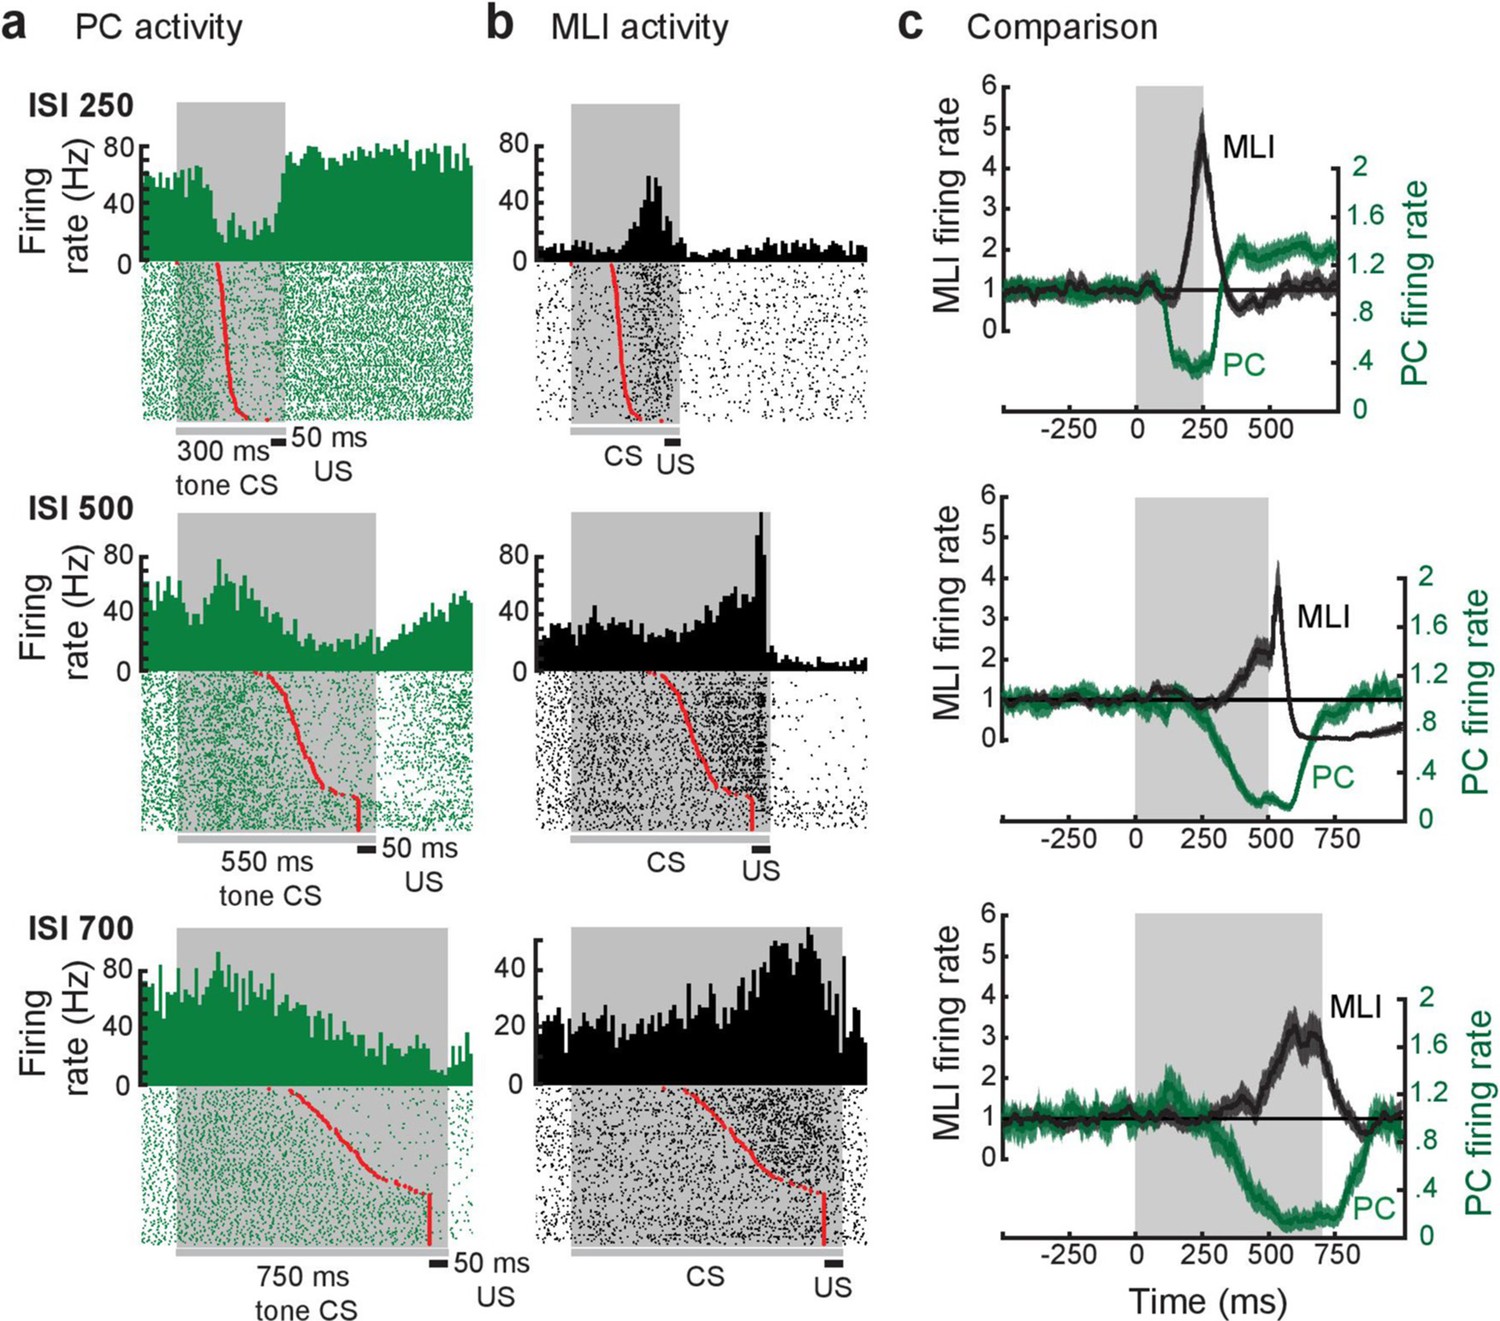
Relationship between individual simultaneously recorded eyelid molecular layer interneurons (MLIs) and eyelid Purkinje cells (PCs) during expression of conditioned eyelid responses.
(a and b) Peri-stimulus time histograms (10 ms bins) and raster plots sorted by eyelid conditioned response (CR) latency (red points) of the simultaneously recorded activity of eyelid PCs and MLIs. The dark gray bars and shaded areas indicate the duration of the tone stimulus (conditioned stimulus [CS]) and the black bars indicate the duration of the eyelid stimulation (unconditioned stimulus [US]). (c) Normalized instantaneous firing rate for the examples in a and b. For all three examples, the activity of the eyelid PC decreases before the simultaneously recorded activity of the eyelid PC-MLI increases, as well as prior to the time of onset of the conditioned response. The gray shaded region indicates the interstimulus interval (ISI) for each pair.
Figure 9—figure supplement 1
Relationship between activity of pairs of eyelid Purkinje cells (PCs) and putative PC-MLIs.
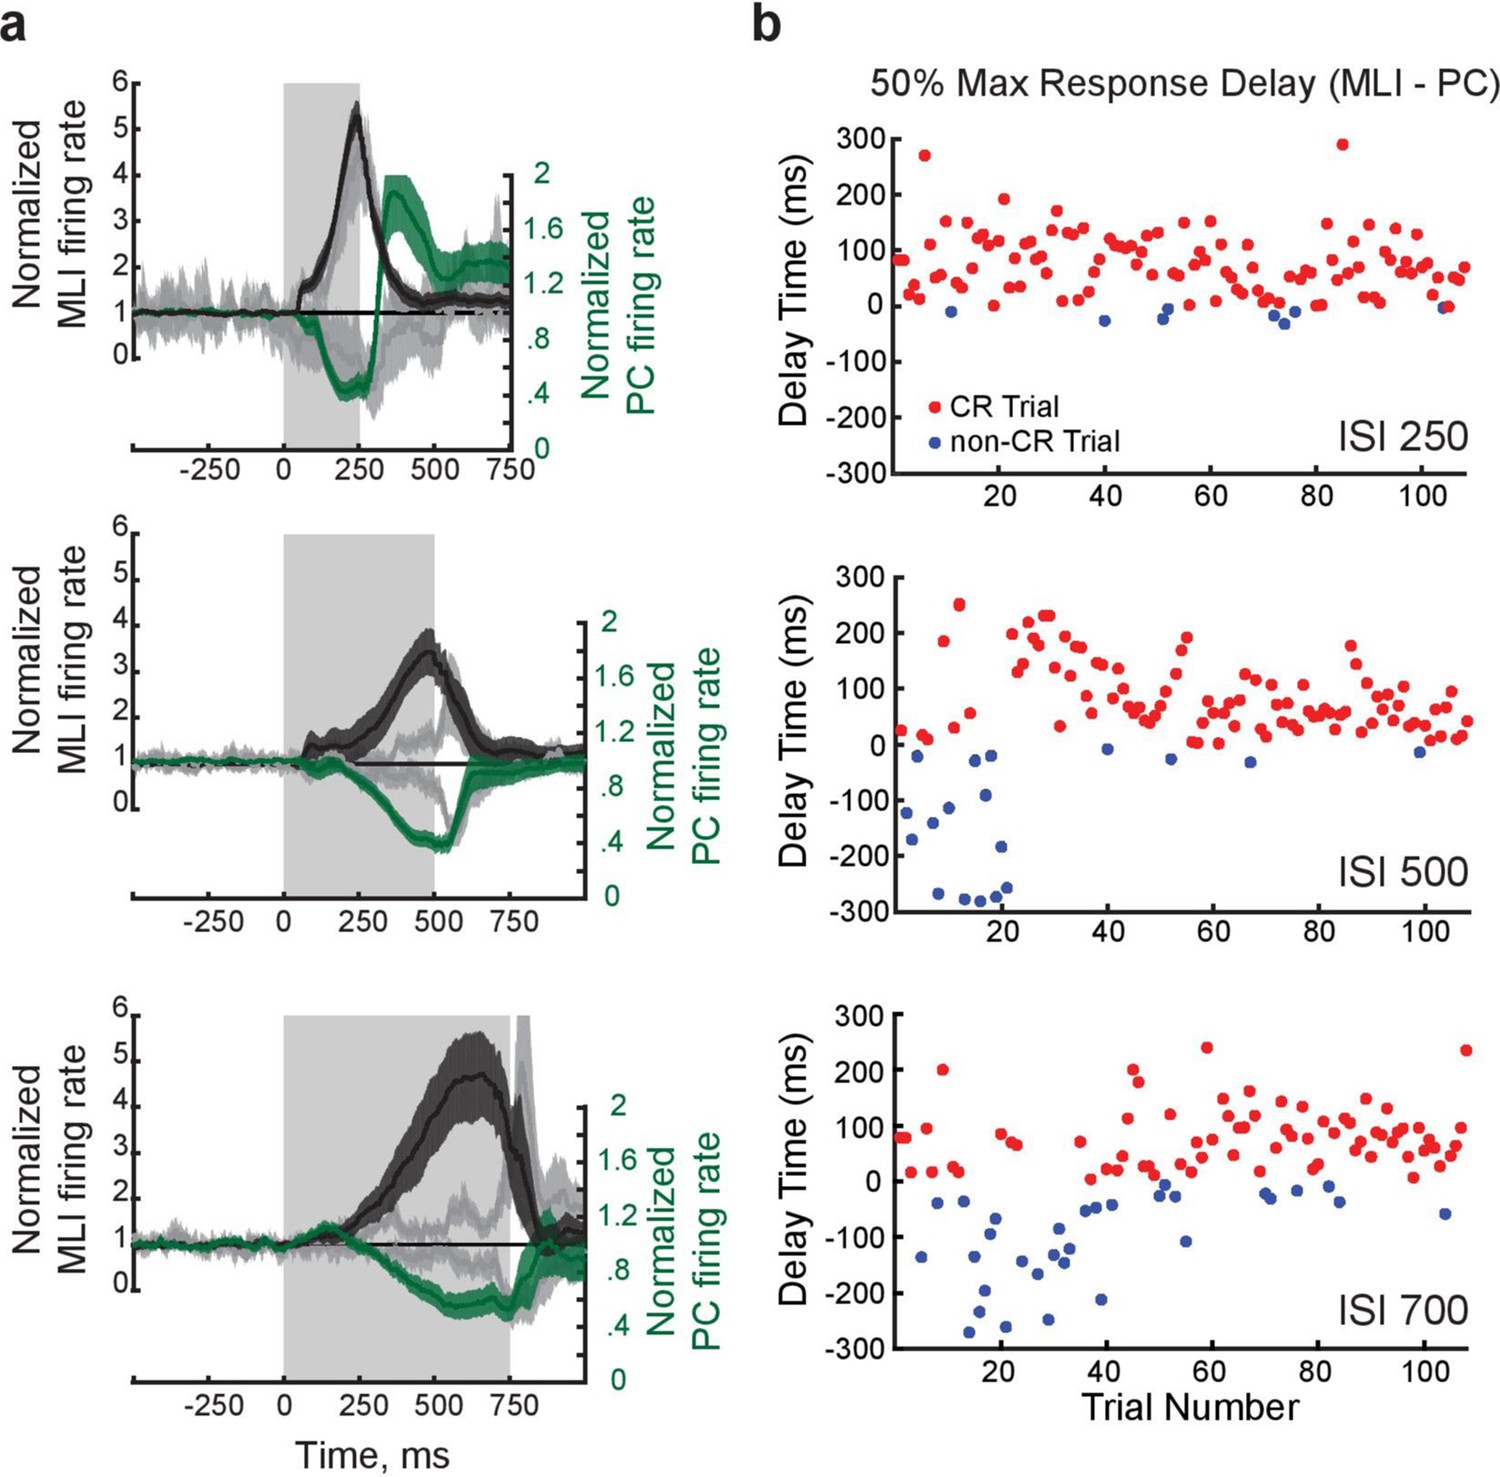
(a) Mean firing rate determined from all simultaneous recordings of PC and PC-MLI activity at three different interstimulus intervals (ISIs) (indicated by shaded rectangles). Mean PC-MLI activity (black lines) and PC activity (green lines) averaged across conditioned response (CR) trials illustrates how the inverse activity relationship of the pairs shifts to match the training interval; shading represents 95% confidence intervals. Gray lines represent activity measured during non-response trials. (b) Trial-by-trial variations in timing of activity of a PC and a putative PC-MLI simultaneously recorded during eyelid conditioning at different ISIs. The time of the decreases in PC activity and increases in putative PC-MLI activity were measured at 50% of their maximum responses and the difference between these values is plotted as the delay time. Positive numbers indicate trials where the eyelid PC reached its 50% response before the PC-MLI did, while negative numbers indicate that the PC-MLI reached its 50% response before the eyelid PC did. Red points indicate trials where a CR was observed, while blue points indicate trials where no CR was observed. The plots indicate that positive delays occurred whenever a CR was produced, while negative delays occurred whenever there was no CR. This indicates – on a trial-by-trial basis – that PC activity precedes putative PC-MLI activity during CRs. MLIs, molecular layer interneurons.
-
Figure 9—figure supplement 1—source data 1
Source files for the time difference (delay time; MLI – PC) reaching 50% maximum response between eyelid PC and eyelid PC-MLI (Figure 9—figure supplement 1b).
MLI, molecular layer interneuron; PC, Purkinje cell.
- https://cdn.elifesciences.org/articles/77603/elife-77603-fig9-figsupp1-data1-v2.xlsx
Figure 9—figure supplement 2
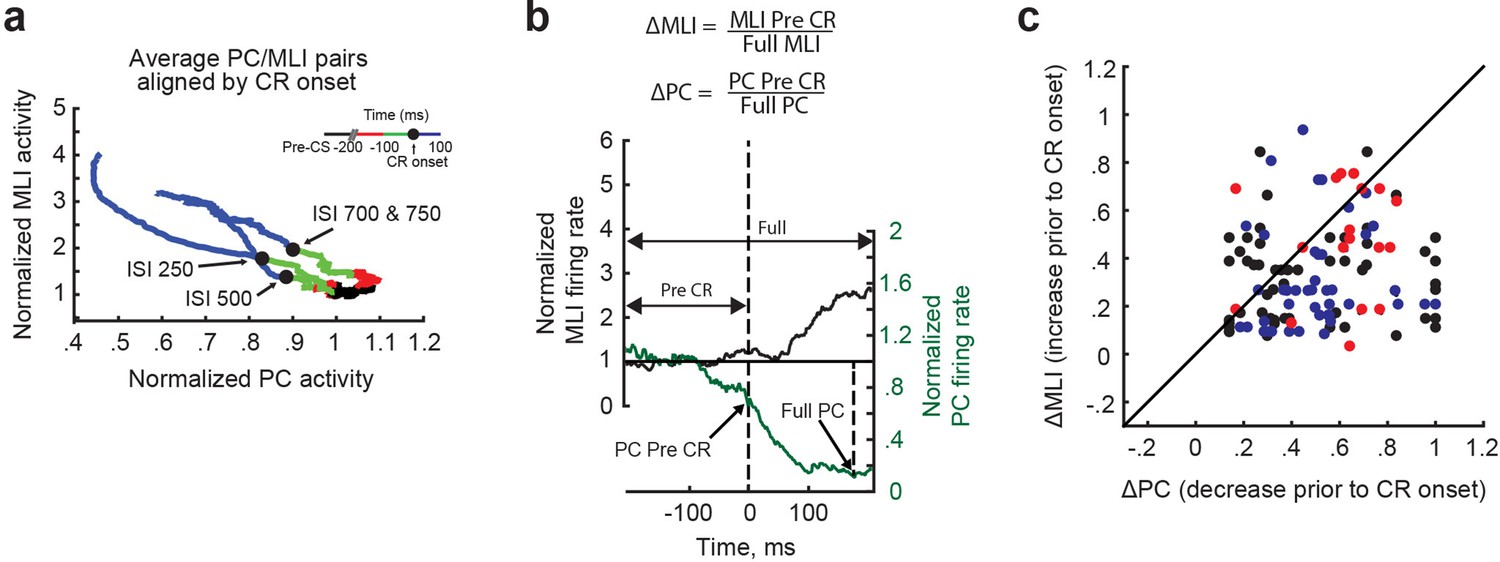
Quantification of temporal relationship for individual pairs of eyelid Purkinje cells (PCs) and PC-MLIs.
(a) Color-coded plots for each interstimulus interval (ISI) of the average normalized activity for all simultaneously recorded eyelid PC/PC-MLI pairs aligned to time of response onset (black dot). Green represents 100 ms before response onset and blue represents 100 ms after response onset in each case (inset). For each ISI, the trend was for PC activity to decrease before conditioned response onset and for the PC activity to continue to decrease while PC-MLI activity increased after response onset. (b) ΔPC and ΔMLI were calculated for each PC/PC-MLI pair whose activity was recorded simultaneously. For each pair, the change in PC activity (green) before response onset (PC preCR) was divided by the change over the entire duration (full PC); the same analysis was done for each PC-MLI response (black). (c) Comparison of preCR activity between eyelid PC/PC-MLI pairs. The ΔPC to ΔMLI ratio was plotted for each simultaneously recorded pair, while the diagonal line indicates equal changes before conditioned response onset. Points below the diagonal line indicate that the eyelid PC changed more than the simultaneously recorded activity of the putative PC-MLI, while deviations above the diagonal line indicate that the putative PC-MLI changed more than the eyelid PC before response onset. Each paired recording is color-coded according to the ISI (black = ISI 250, blue = ISI 500, red = ISI 700 and 750). MLIs, molecular layer interneurons.
Figure 10 with 1 supplement
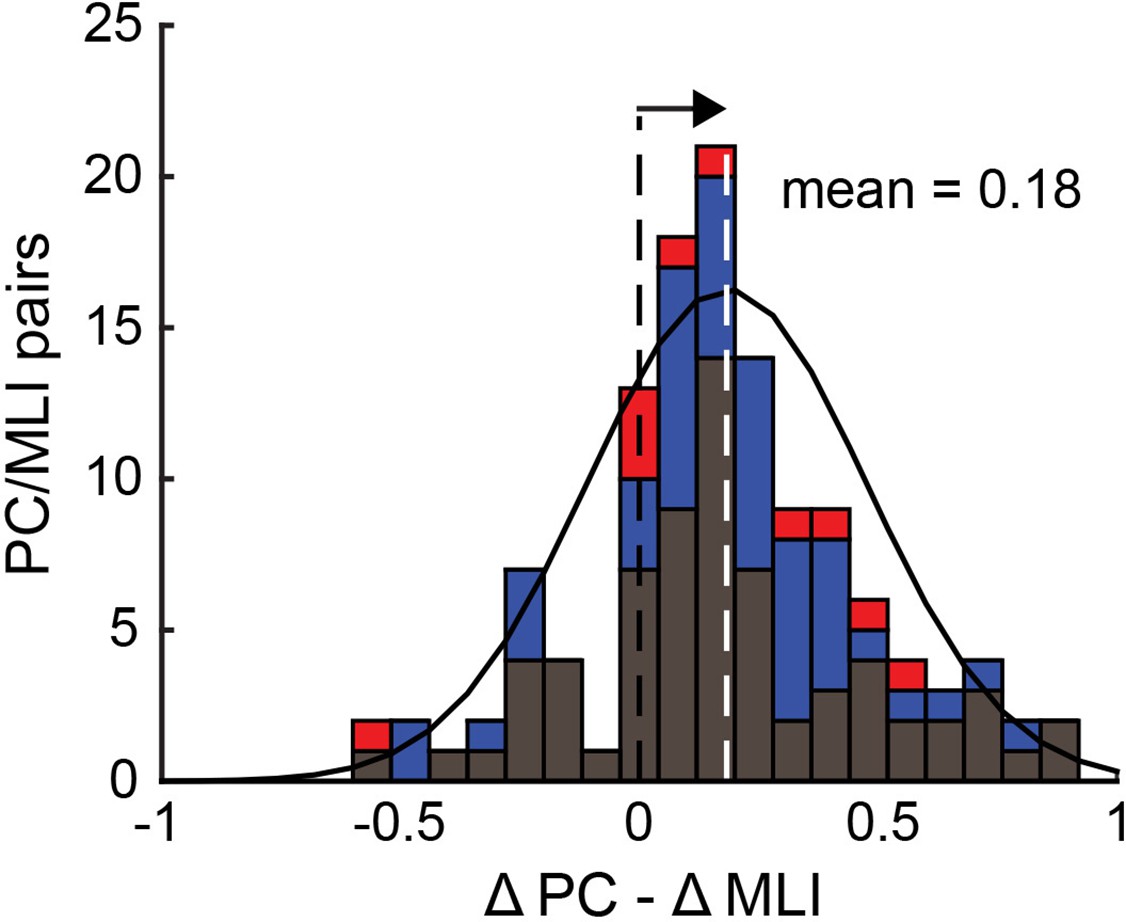
Relationship between the responses of simultaneously recorded eyelid PC-MLIs and eyelid PCs and conditioned eyelid responses.
Distribution showing relationship between timing of decreases in eyelid PCs activity and increases in PC-MLIs activity at each interstimulus interval (ISI) (black = ISI 250, 76 PC/PC-MLI pairs; blue = ISI 500, 50 pairs; red = ISI 700 and 750, 10 pairs). The mean of the distribution of ∆PC − ∆MLI differences is indicated with a white dashed line. This distribution is shifted (arrow) to the right of 0 (black dashed line), indicating that the PC activity decreases more rapidly than the PC-MLI activity increases, relative to CR onset, for most pairs of neurons. MLIs, molecular layer interneurons; PC, Purkinje cell.
-
Figure 10—source data 1
Source files for ∆PC-∆MLI distribution between the responses of simultaneously recorded eyelid PC and eyelid PC-MLI during eyelid conditioning at different interstimulus intervals (ISIs).
Full and preCR PC normalized firing rate decrease (∆PC = preCR/full PC activity decrease) and full and preCR MLI normalized firing increase (∆MLI = preCR/full MLI activity increase) were measured to access the timing of PC and PC-MLI activity changes in recorded pairs (∆PC-∆MLI; see Figure 9—figure supplement 2b). MLI, molecular layer interneuron; PC, Purkinje cell.
- https://cdn.elifesciences.org/articles/77603/elife-77603-fig10-data1-v2.xlsx
Figure 10—figure supplement 1
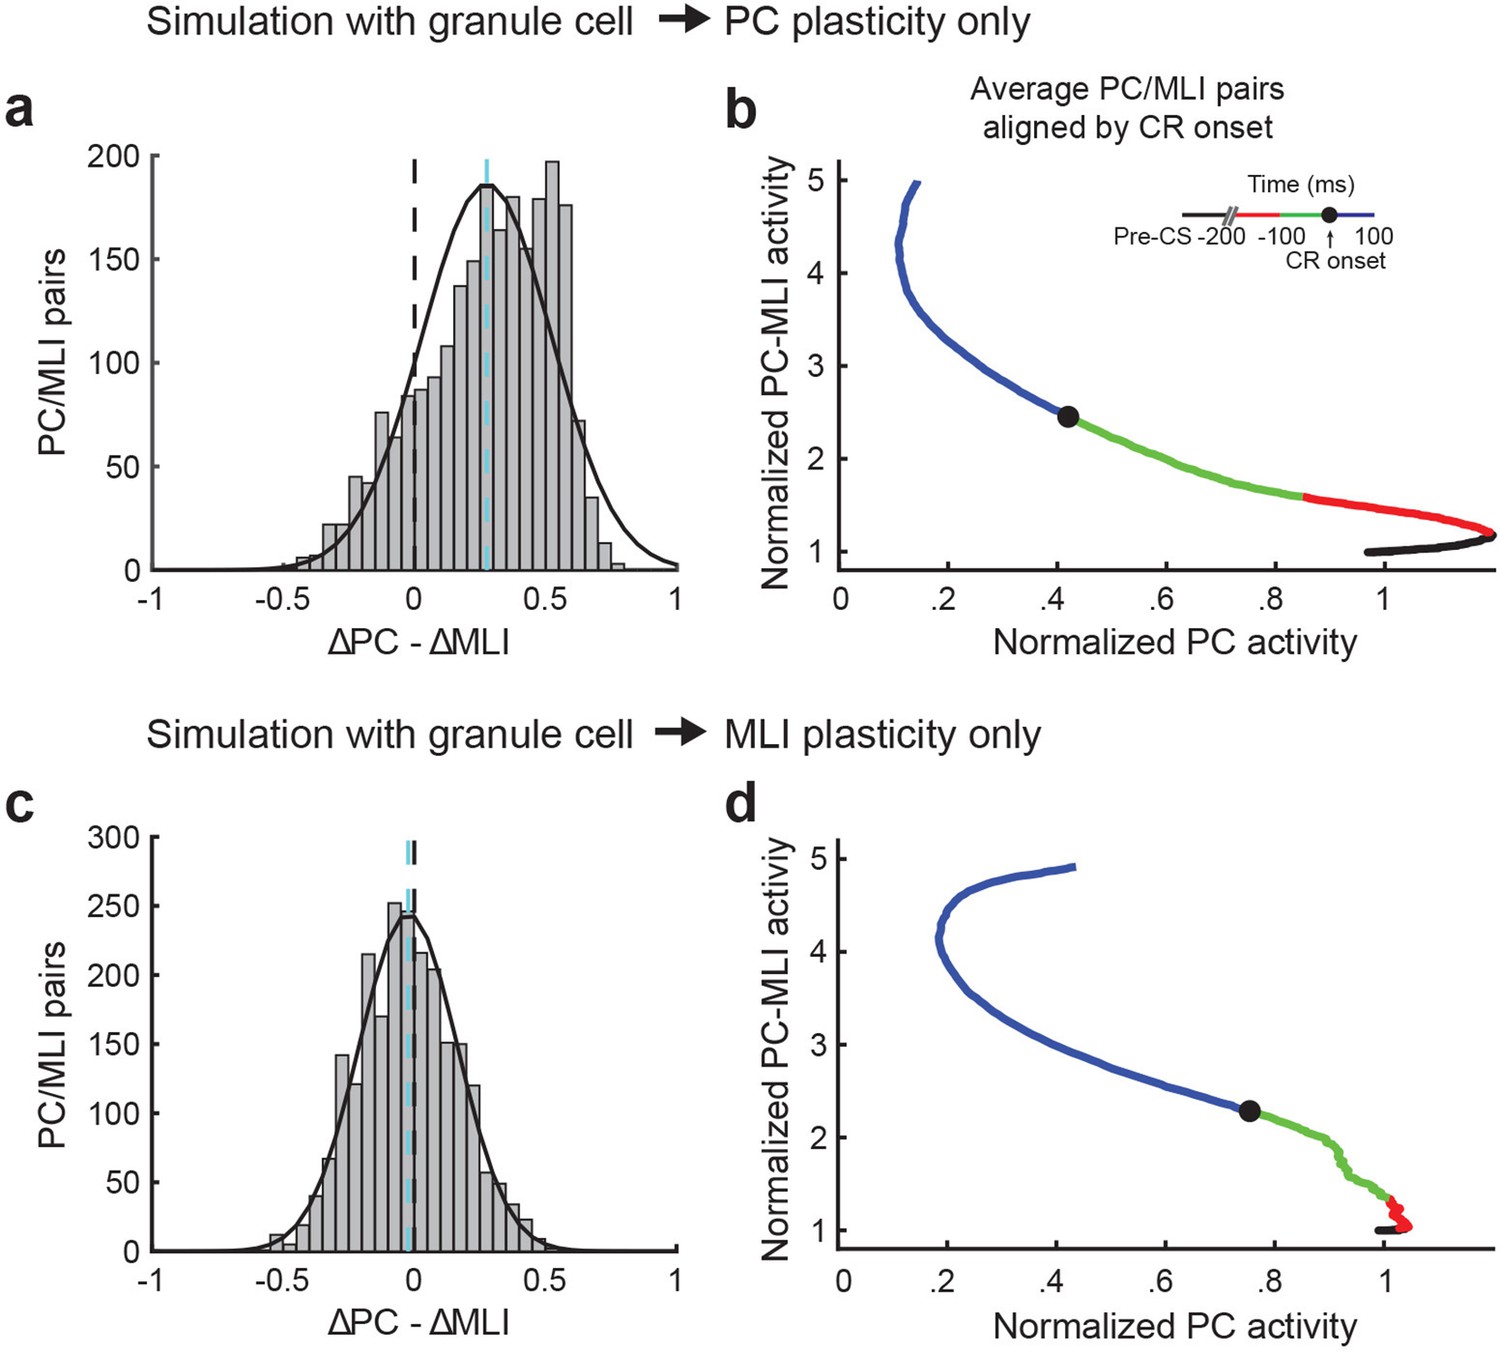
Relationship between activity of Purkinje cell (PC) and PC-MLI pairs from simulations featuring different sites of circuit plasticity.
(a) Distribution of the relative latency of eyelid PCs decreases in activity relative to increases in PC-MLIs (ΔPC – ΔMLI) in simulations with plasticity only at granule cell-to-PC synapses. The distribution of ΔPC – ΔMLI differences (mean indicated by cyan dashed line) is shifted to the right of zero (black dashed line), indicating that PC activity usually decreases more than the PC-MLI activity increases relative to conditioned response onset. (b) Plots of the time of average normalized activity for all eyelid PC/PC-MLI pairs from the simulation with plasticity only at granule cell-to-PC synapses, aligned to response onset (black dot). Green represents 100 ms before response onset and blue represents 100 ms after response onset in each case (inset). PC activity tended to decrease before the time of conditioned response (CR) onset and then continued to decrease after CR onset, while the PC-MLI activity increased later. This was similar to the trend observed in vivo, as shown in Figure 9—figure supplement 2a. (c) Same distribution as in (a), from a simulation with plasticity only at granule cell-to-MLI synapses. (d) Same analysis as in (b), for the results of simulation with plasticity only at granule cell-to-MLI synapses. The trend was for the PC-MLI to increase its activity before CR onset and the PC to then decrease its activity after CR onset. MLI, molecular layer interneuron.
Figure 11
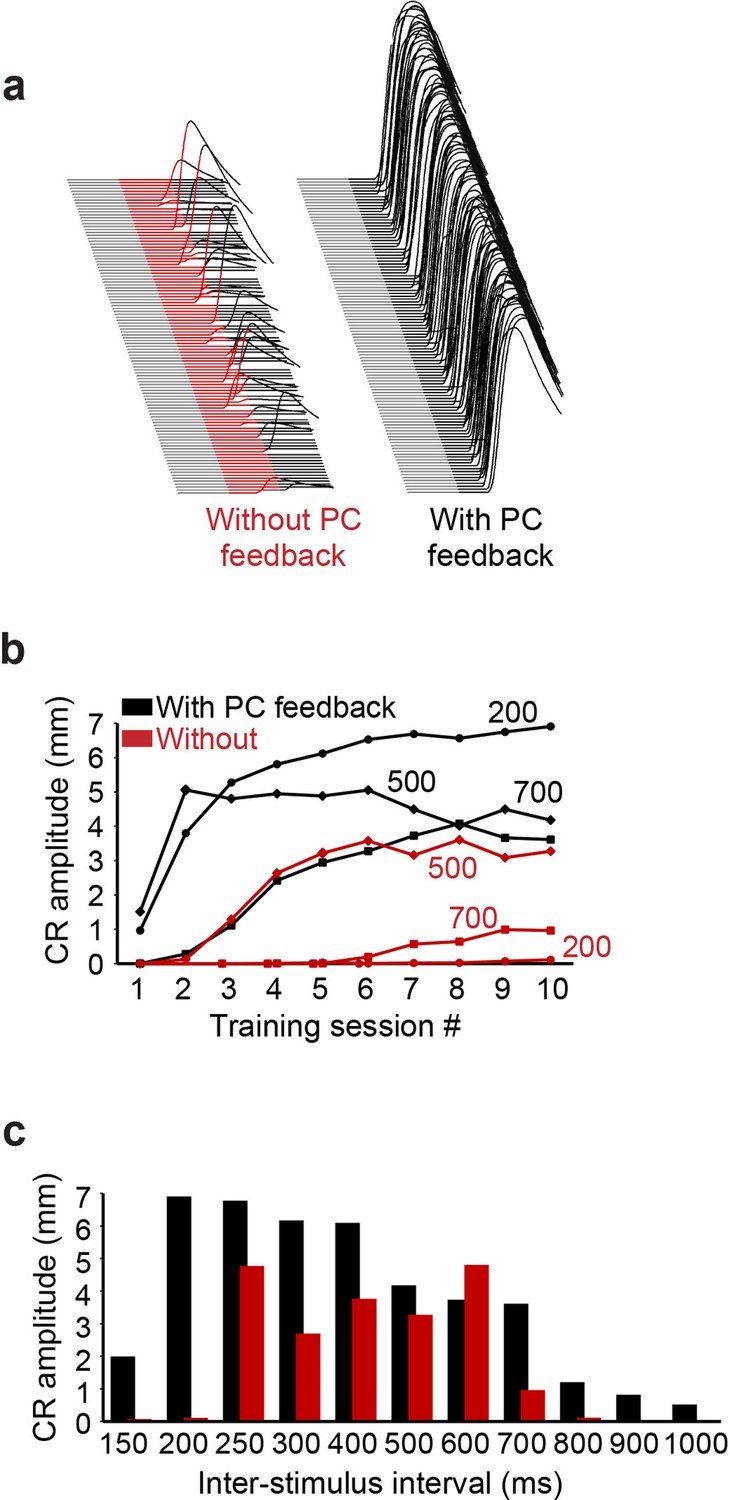
Simulation performance with and without Purkinje cell (PC) feedback to molecular layer interneurons (MLIs).
(a) Examples of virtual conditioned responses (CRs) from the last session of training at interstimulus interval (ISI) 200 for simulations without feedback from PCs to MLIs (conditioned stimulus [CS] is shown in red) and with feedback collaterals (CS is shown in black). (b) Acquisition curves for simulations constructed with (black) and without (red) feedback from PCs to PC-MLIs, plotting the amplitude of virtual CRs as a function of sessions of training for the three ISIs indicated (108 trials per session). (c) Average virtual CR amplitude on the final session of training is shown for training using 11 ISIs ranging from 150 to 1000 ms; black bars indicate results from simulations with PC to PC-MLI feedback and red bars depict data from simulations lacking feedback. Simulations with PC feedback performed considerably better at relatively long and short ISIs, while for intermediate ISIs there was less effect on performance.
Figure 12
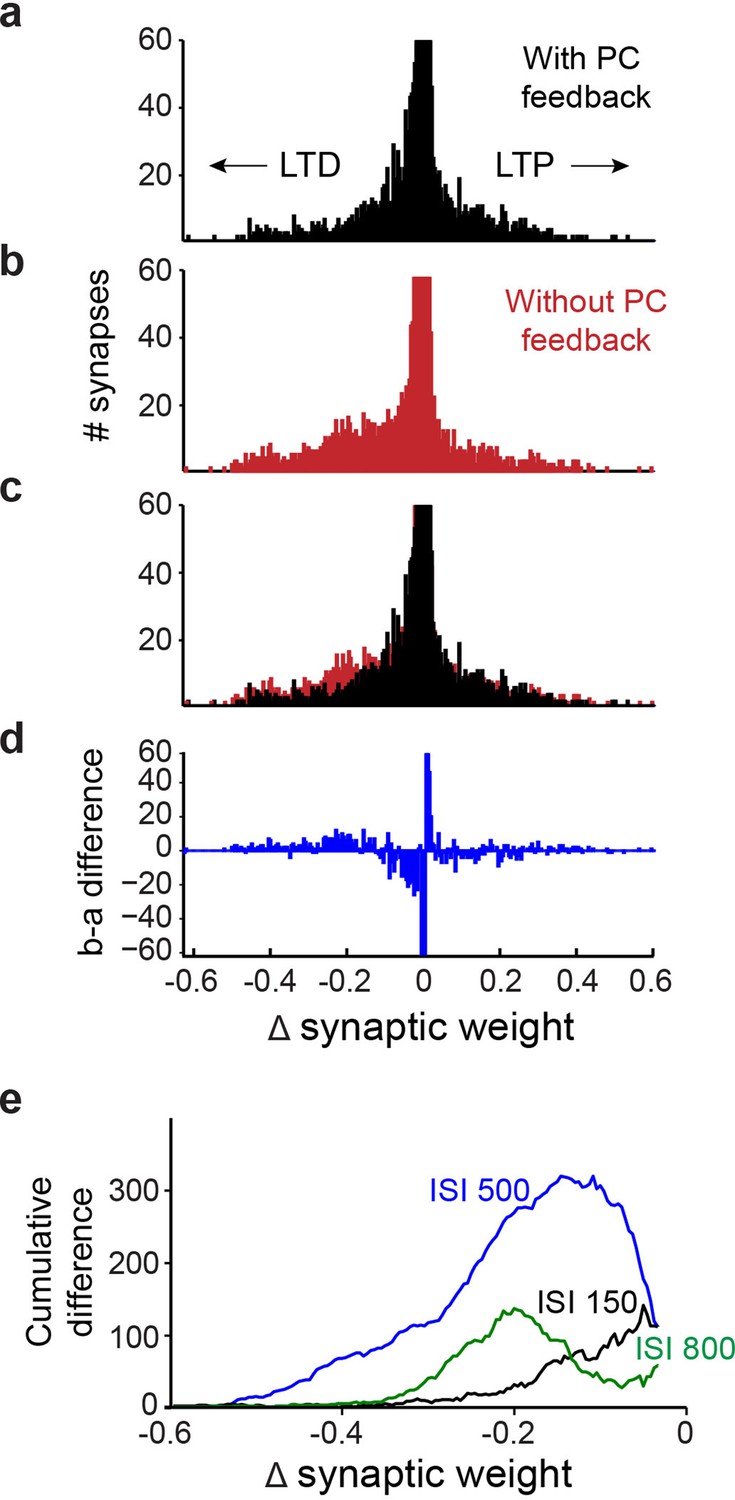
Simulation of learning-dependent plasticity with and without Purkinje cell (PC) feedback.
(a) Net changes in the strength of the 12,000 synapses between granule cells and PCs in a simulation with PC feedback to PC-MLIs and trained at an interstimulus interval (ISI) of 500ms. Negative changes indicate net LTD (left), while positive changes indicate net LTP (right). The vertical scale of the histogram is cropped at 60 synapses because the vast majority of synapses showed little or no change. The synapses that underwent net LTD are most likely to support expression of the conditioned responses in the simulations. (b) Same analysis as in a, for a simulation lacking PC feedback to PC-MLIs. (c) Superimposition of a and b indicates a larger number of synapses underwent robust LTD in the absence of PC feedback. (d) Difference between a (with feedback) and b (without feedback). The simulation lacking PC feedback to PC-MLIs had a larger number of synapses undergoing robust LTD and fewer synapses undergoing a small degree of net LTD. (e) To compare the differences between simulations with and without PC feedback across several ISIs, difference plots such as the one shown in d were converted to a cumulative histogram. Across the three ISIs shown, the simulations lacking PC feedback collaterals had more synapses undergoing robust LTD than those with feedback. This was true for ISIs where the simulations learned approximately equally well (ISI 500 in blue) and for ISIs where simulations with collaterals learned much better (ISIs 150 and 800). MLIs, molecular layer interneurons.
Figure 13
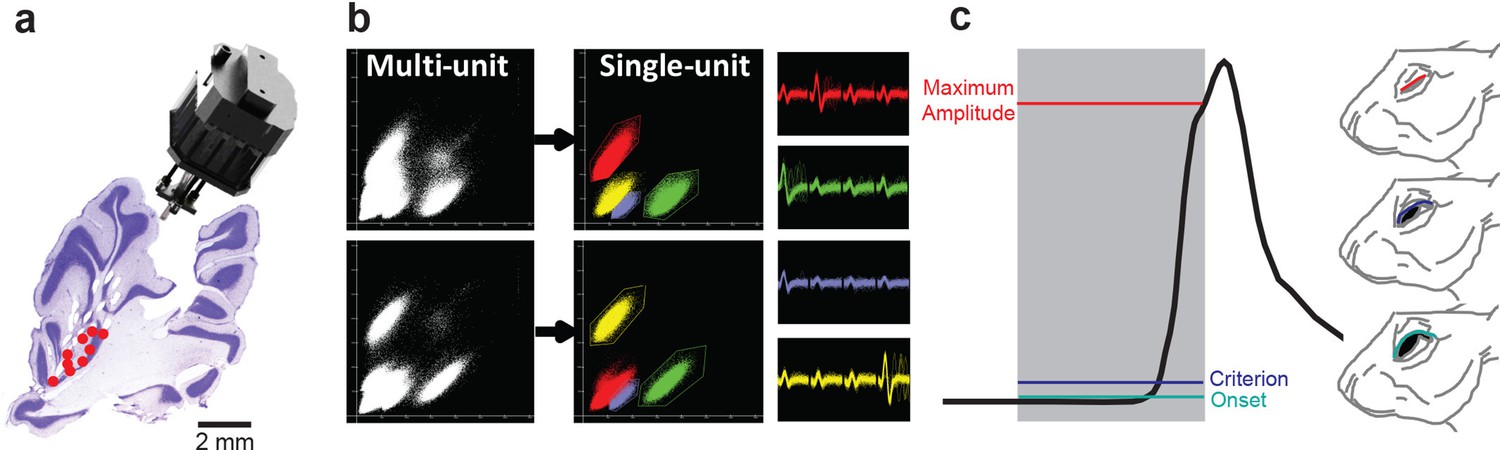
Single-unit recordings in cerebellum and eyelid conditioning in the rabbit.
(a) Sagittal section of the cerebellum showing tetrode tracks and the final location (red points) of tetrodes that recorded eyelid molecular layer interneurons (MLIs) and eyelid Purkinje cells (PCs). The custom-made hyperdrive array is shown above the cerebellar section. (b) Example of single units being isolated from a multi-unit recording with cluster cutting. The individual clusters and waveforms are color-coded to illustrate how unique features of the waveform across the four channels of the tetrode can be used to isolate single units from the multi-unit recording. (c) An example of a single conditioned eyelid response trial where the different response measures are color-coded according to the position of the eyelid in the rabbit. Gray shading indicates the duration of the conditioned stimulus and the black line represents the position of the eyelid throughout the trial. The conditioned response is delayed relative to stimulus onset and peaks at the end of the interstimulus interval (ISI). Different response measurements are color-coded according to eyelid position (right).
Figure 14
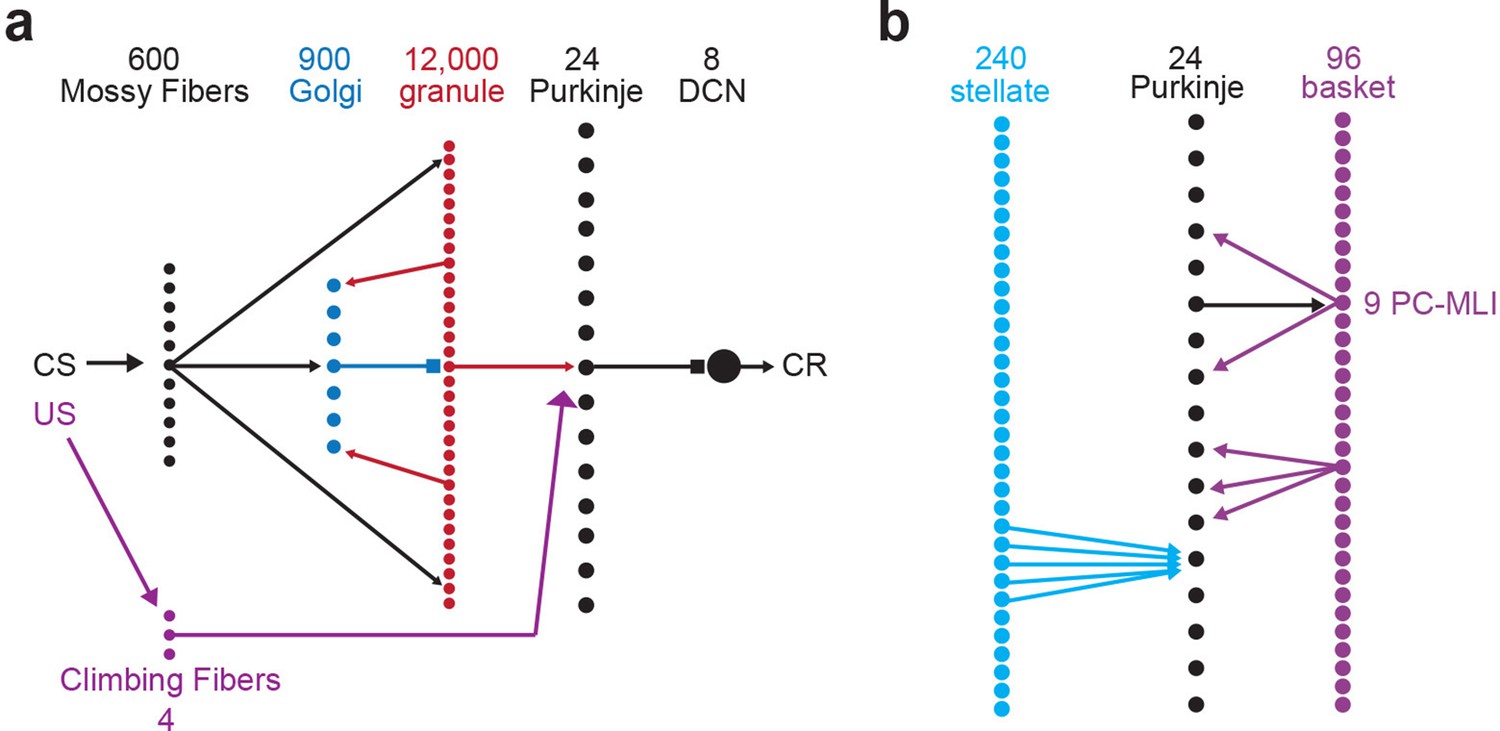
Schematic representation of connectivity in the cerebellar simulation.
(a) Indicates two inputs to the cerebellum -- mossy and climbing fibers -- and a schematic representation of the connectivity of four cerebellar neuron types. The number of each cell type represented in the simulation are indicted by numbers at top. Mossy fiber inputs diverge to excite Golgi and granule cells and converge to excite deep cerebellar neurons (DCN); the latter is not shown on the diagram. Granule cells excite Purkinje and Golgi cells, while Golgi cells inhibit nearby granule cells. (b) Schematic representation of the connectivity between molecular layer interneurons (MLIs) and Purkinje cells (PCs). Stellate cells converge to inhibit PCs. PCs inhibit a subset of basket cells near them (the PC-MLIs) and basket cells inhibit nearby PCs, excluding those that could form reciprocal connections.
Author response image 1

Tables
Key resources table
| Reagent type (species) or resource | Designation | Source or reference | Identifiers | Additional information |
|---|---|---|---|---|
| Genetic reagent (Mus musculus) | Pcp2-cre mice; B6.129-Tg(Pcp2-cre)2Mppin/J | Jackson Laboratories | Stock No: 004146; RRID:IMSR_JAX:004146 | |
| Genetic reagent (Mus musculus) | Pcp2-cre mice; B6.Cg-Tg(Pcp2-re)3555Jdhu/J | Jackson Laboratories | Stock No: 010536 RRID:IMSR_JAX:010536 | |
| Genetic reagent (Mus musculus) | Ai32 mice; B6;129S-Gt(ROSA)26Sortm32(CAG-COP4*H134R/EYFP)Hze/J | Jackson Laboratories | Stock No: 012569 RRID:IMSR_JAX:012569 | |
| Chemical compound, drug | Bicuculline | Sigma-Aldrich | Cat#14340 | |
| Chemical compound, drug | Gabazine | Sigma-Aldrich | Cat#S106 | |
| Chemical compound, drug | Kynurenic acid | Sigma-Aldrich | Cat#K3375 | |
| Chemical compound, drug | QX-314 (Lidocaine N-ethyl bromide) | Sigma-Aldrich | Cat#L5783 | |
| Chemical compound, drug | Alexa 594 | Thermo Fisher | Cat#A10438 | |
| Software, algorithm | pClamp 10 | Axon instruments | RRID:SCR_011323 | |
| Software, algorithm | Fiji | NIH | RRID:SCR_002285 | |
| Software, algorithm | Origin | Origin Lab | RRID:SCR_014212 | |
| Strain, strain background (Oryctolagus cuniculus, males) | New Zealand albino rabbits | Myrtle’s Rabbitry | ||
| Software, algorithm | Cheetah Data Acquisition | Neuralynx | Cheetah 5.0 | |
| Software, algorithm | Spike-Sorting Program | M.D.M. | WinClust | |
| Software, algorithm | Experimental Control | M.D.M. | BunTrain | |
| Other | .0005 NiCr wire | Kanthal | M#756027 | Tetrode wire |
| Other | 16 tetrode EIB | Neuralynx | EIB-36-16TT | Electrode interface board |
Additional files
Download links
A two-part list of links to download the article, or parts of the article, in various formats.
Downloads (link to download the article as PDF)
Open citations (links to open the citations from this article in various online reference manager services)
Cite this article (links to download the citations from this article in formats compatible with various reference manager tools)
Feedback inhibition underlies new computational functions of cerebellar interneurons
eLife 11:e77603.
https://doi.org/10.7554/eLife.77603


