Deep sequencing of yeast and mouse tRNAs and tRNA fragments using OTTR
- Department of Biochemistry and Molecular Biotechnology, University of Massachusetts Medical School, United States
- Department of Molecular and Cell Biology, University of California, Berkeley, United States
- Center for Computational Biology, University of California, Berkeley, United States
- Program in Bioinformatics and Integrative Biology, University of Massachusetts Medical School, United States
Figures
Figure 1 with 3 supplements
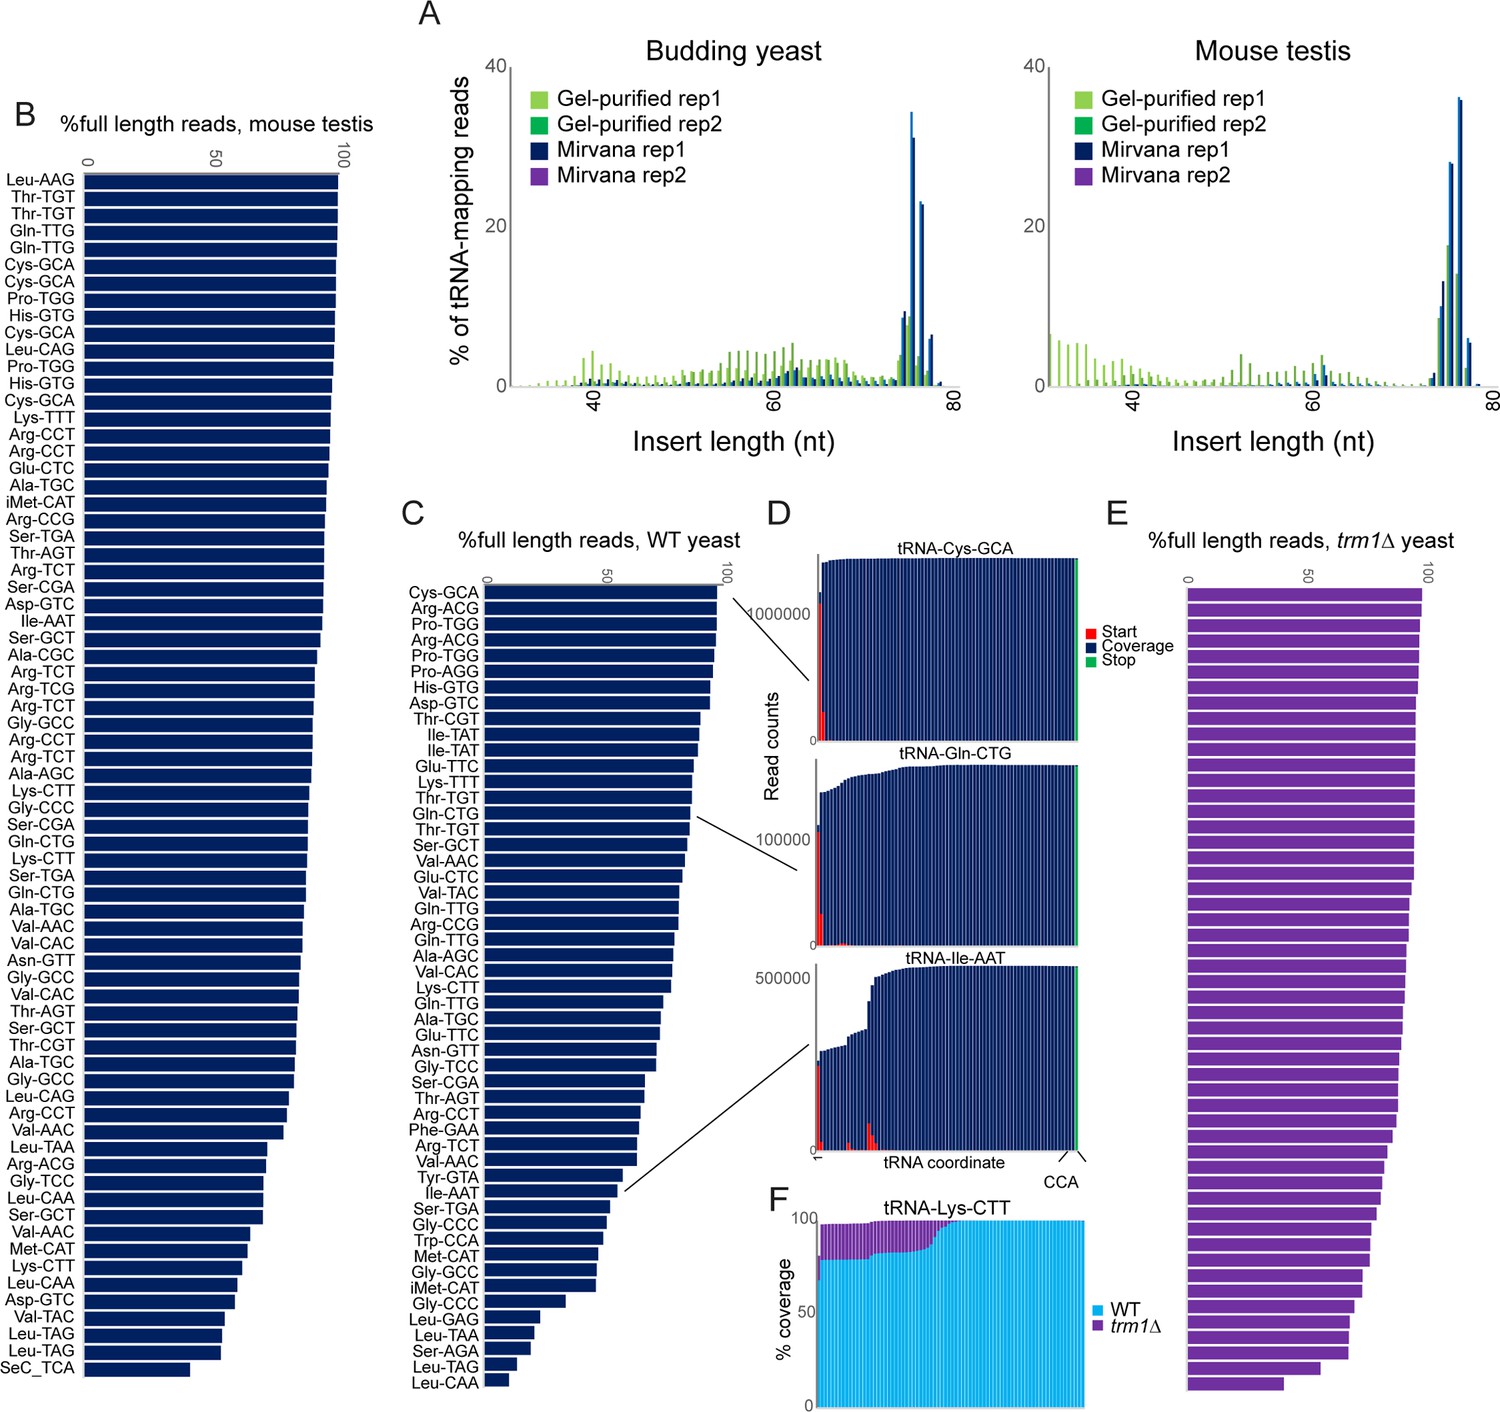
OTTR successfully captures full length tRNAs in yeast and mouse.
(A) Insert length distributions for full-length tRNA OTTR libraries for budding yeast, and mouse testis, as indicated. Libraries were prepared following one of two initial size selection steps: ‘Gel’ refers to libraries from total RNA subject to acrylamide gel-based purification of 60–100 nt RNAs, ‘Mirvana’ refers to libraries build using the small (<200 nt) fraction recovered from mirVana RNA spin columns (Figure 1—figure supplement 1), and ‘rep’1 and 2 refer to replicate datasets. (B, C) Efficient capture of full length tRNAs from mouse (B) and yeast (C) samples using OTTR. For each tRNA species with over 1000 reads, percentage of full length tRNA reads was calculated. See also (Figure 1—figure supplement 2). (D) Coverage plots for three exemplar tRNAs in the yeast OTTR dataset. Red and green bars show sequence start and stop nt, respectively, while blue bars show sequence coverage internal to a start or stop. WT indicates wild-type. (E) Improved full-length tRNA coverage in trm1Δ yeast lacking m22G, plotted as in panel (C). (F) Coverage plots for an exemplar tRNA comparing WT and trm1Δ yeast. Coverage plots (normalized to the coverage at the tRNA 3’ end for each library) are superimposed, with light blue WT over purple trm1Δreads; purple thus highlights the differential between libraries.
Figure 1—figure supplement 1

Enrichment of short and long RNA populations.
(A) Gel shows mirVana column-enriched short and long RNA fractions, isolated from yeast and various mouse tissues, as indicated. (B) Length distribution for mouse testis tRNA reads; while data for Figure 1A show lengths of tRNA-mapping reads with detectable 5’ and 3’ adaptor sequences, data here include longer reads that are too long to include the 3’ adaptor. Note the second peak at ~82–85 nt, corresponding to the subset of tRNAs with longer variable loops (Leu and Ser tRNAs). Unfortunately, we did not capture any longer reads as this dataset was inadvertently generated using the Illumina 75 cycle sequencing kit (which nonetheless yields up to 85 nt of sequence). As a result, our characterization of full-length tRNA capture (Figure 1, Figure 1—figure supplements 2–3) modestly underestimates full length capture of tRNAs with long variable loops.
-
Figure 1—figure supplement 1—source data 1
Source data shows the original gel without any obscuring annotations.
- https://cdn.elifesciences.org/articles/77616/elife-77616-fig1-figsupp1-data1-v2.pdf
Figure 1—figure supplement 2
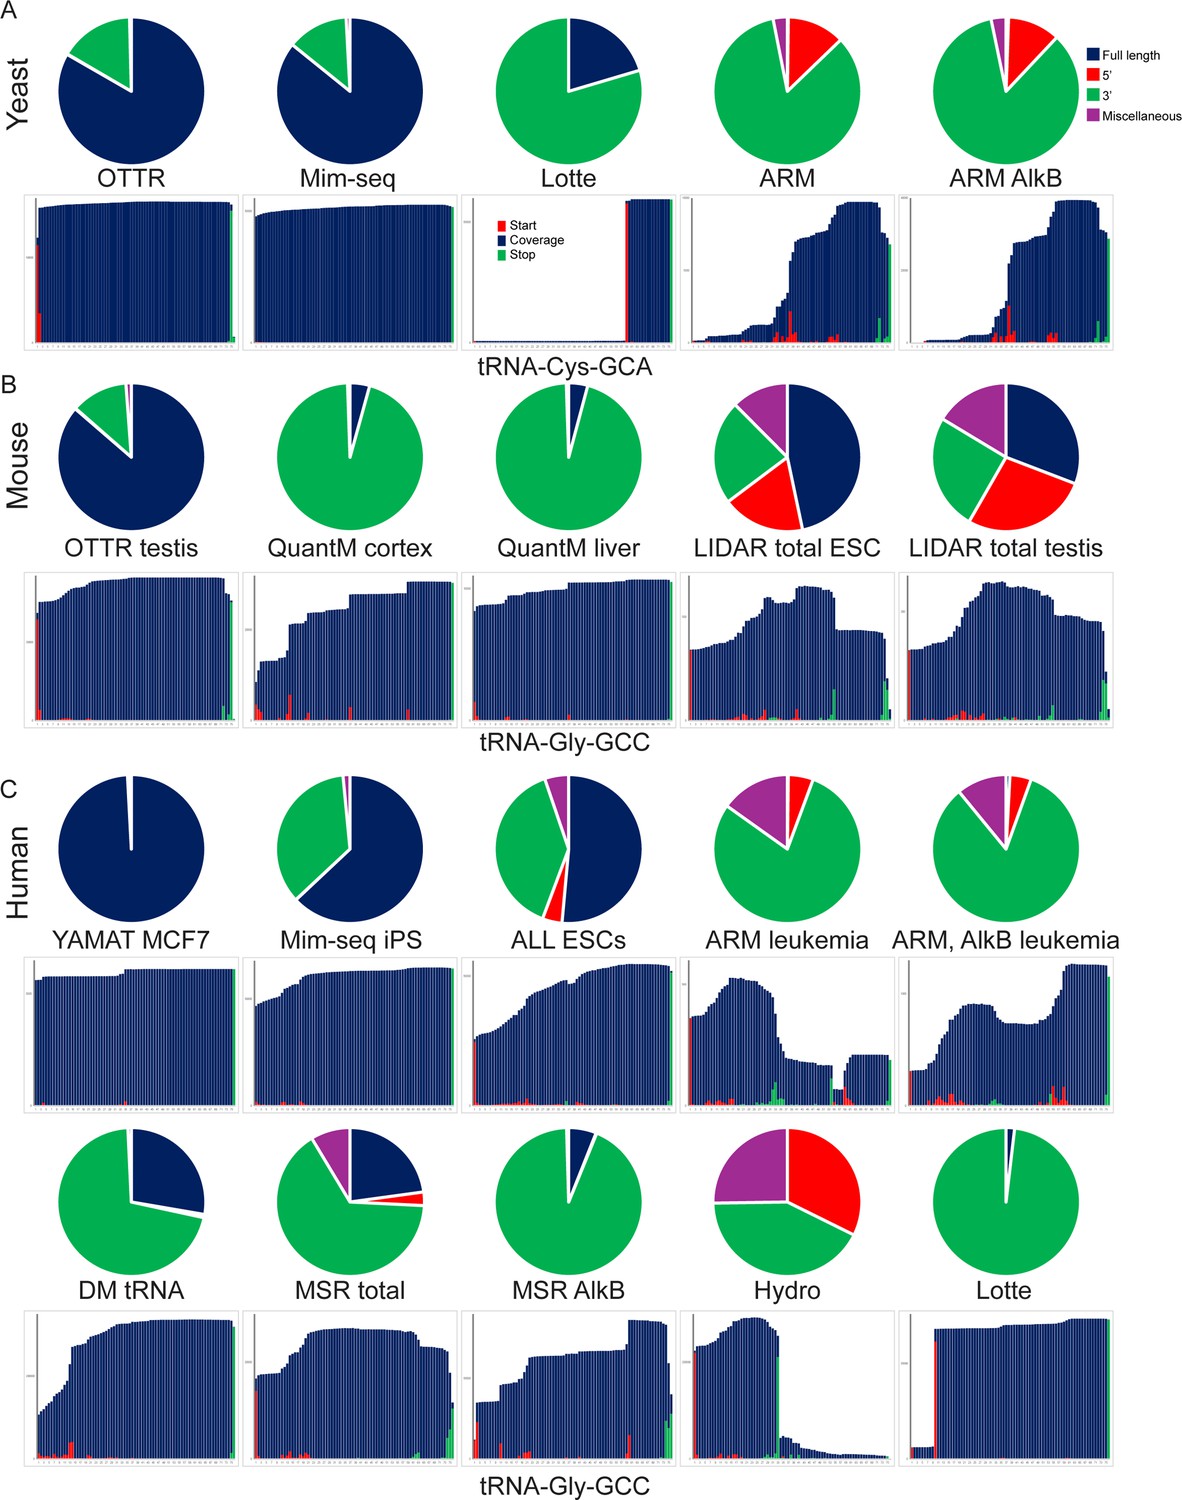
Full length tRNA capture across protocols.
Comparison of full length tRNA capture across various deep sequencing approaches to tRNA sequencing. Datasets from yeast (A), mouse (B), and human (C) samples are shown. For each dataset, pie charts show fractions of tRNA-mapping reads reflecting full-length tRNAs, 5’ or 3’ tRNA fragments, and miscellaneous tRNA-mapping reads (internal fragments, sequences mapping to precursor tRNA sequences including 5’ and 3’ leader and trailer sequences). Bar plots underneath show coverage for a typical tRNA for each dataset. For datasets with multiple cell types or tissues, the selected datasets are representative of tRNA capture across the remaining samples (not shown).
Figure 1—figure supplement 3
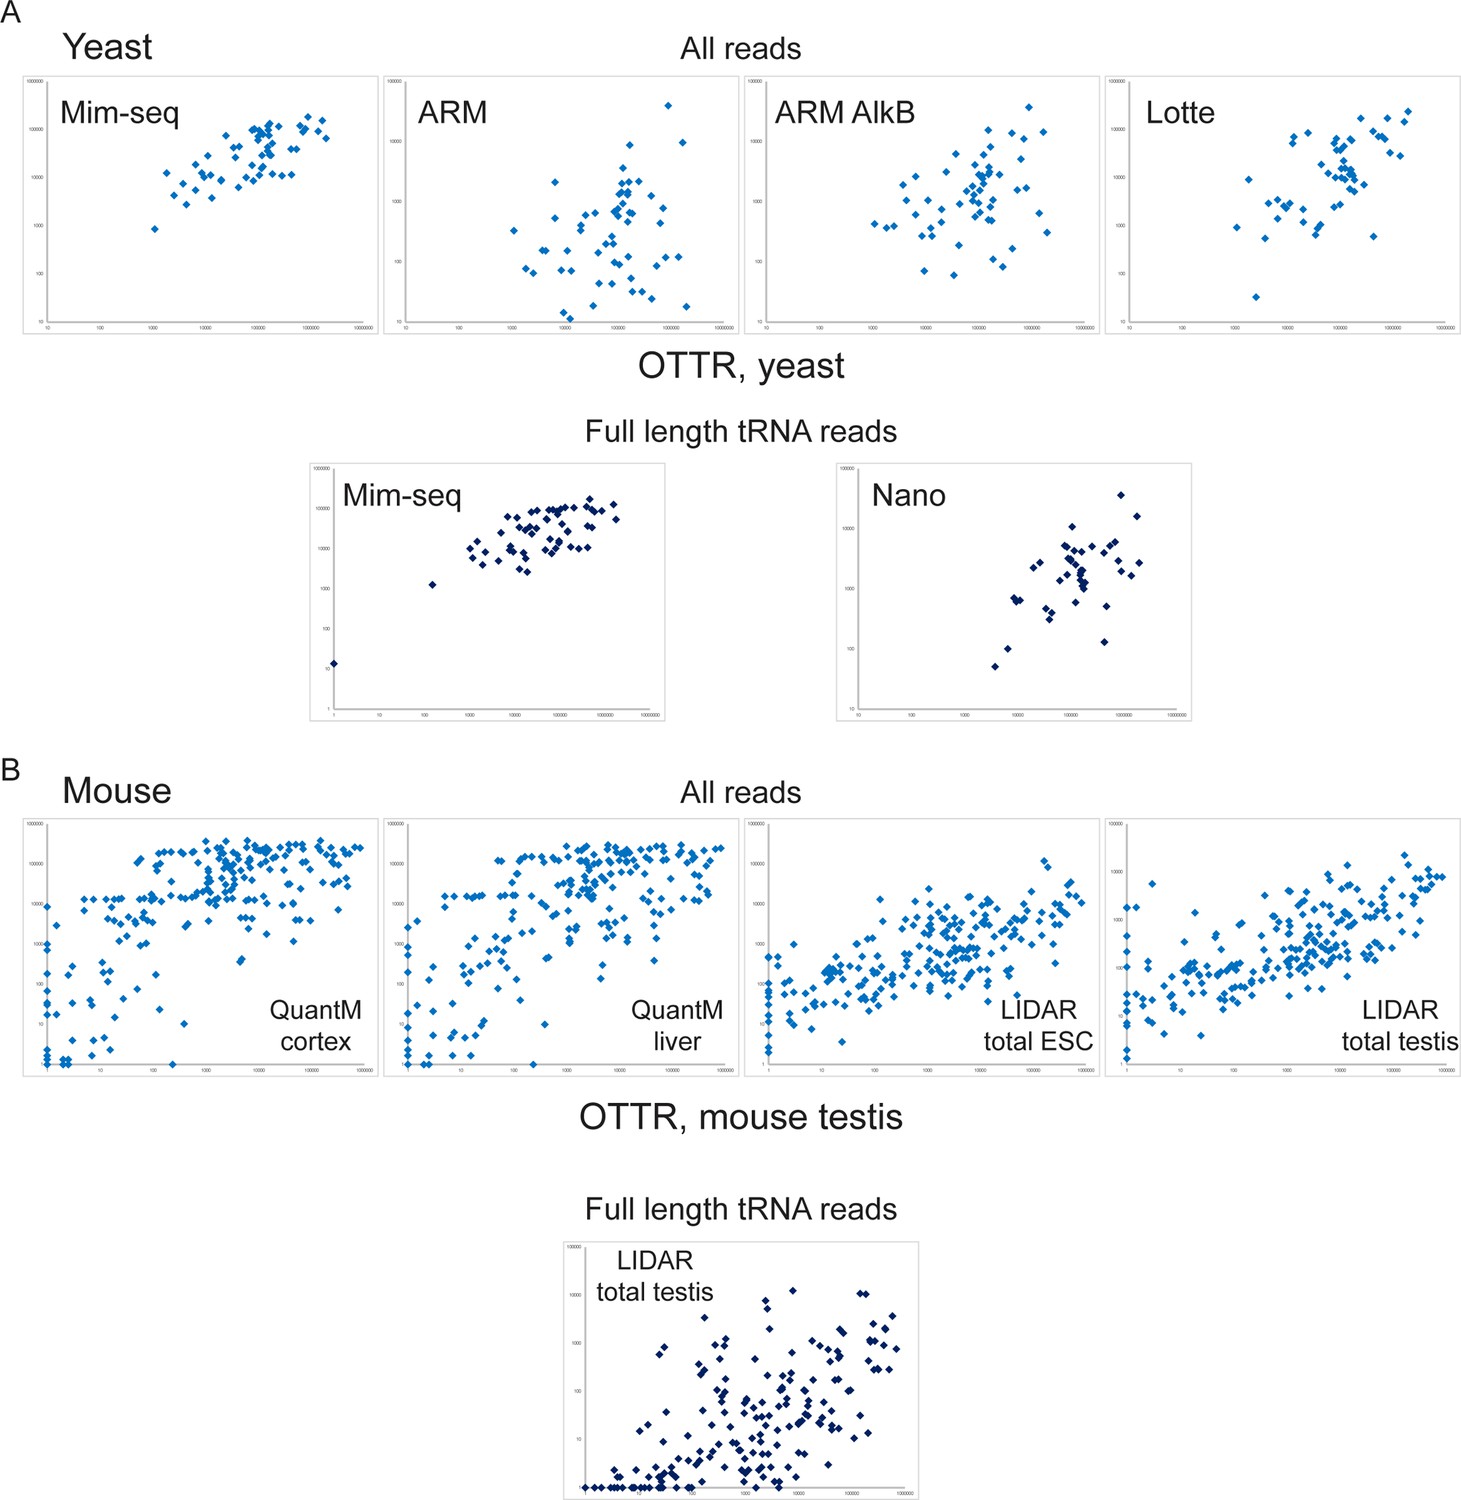
Quantitative comparison of tRNA levels across methods.
Scatterplots show levels of tRNAs measured by OTTR (x axis for all plots) compared to levels measured in the indicated methods, shown on the y axes. For each species – yeast (A) and mouse (B) – top panels show tRNA levels calculated using all tRNA-mapping reads, so that partial tRNA fragments captured by protocols with poor recovery of full-length tRNAs (ARM, for example, where premature RT termination results in intact tRNAs being captured as 3’ fragments) are counted towards overall tRNA levels. For mouse samples in (B), 1 ‘pseudoread’ was added to all tRNA abundance values as a subset of tRNAs were not captured in one or both protocols being compared and zeroes cannot be visualized on a log scale scatterplot. Bottom panels show comparisons for intact tRNA reads for the protocols with >25% intact tRNAs. This includes data from Table S11 from Lucas et al., 2024, a Nanopore-based tRNA sequencing method not included in Figure 1—figure supplement 2. For mouse samples (B), note that LIDAR was the only published method used for analysis of intact tRNAs in the mouse testis; the comparisons to the QuantM liver and cortex samples are not ‘apples to apples’, and differences between datasets could result either from tissue-specific tRNA pools, or from technical differences between protocols.
Figure 2
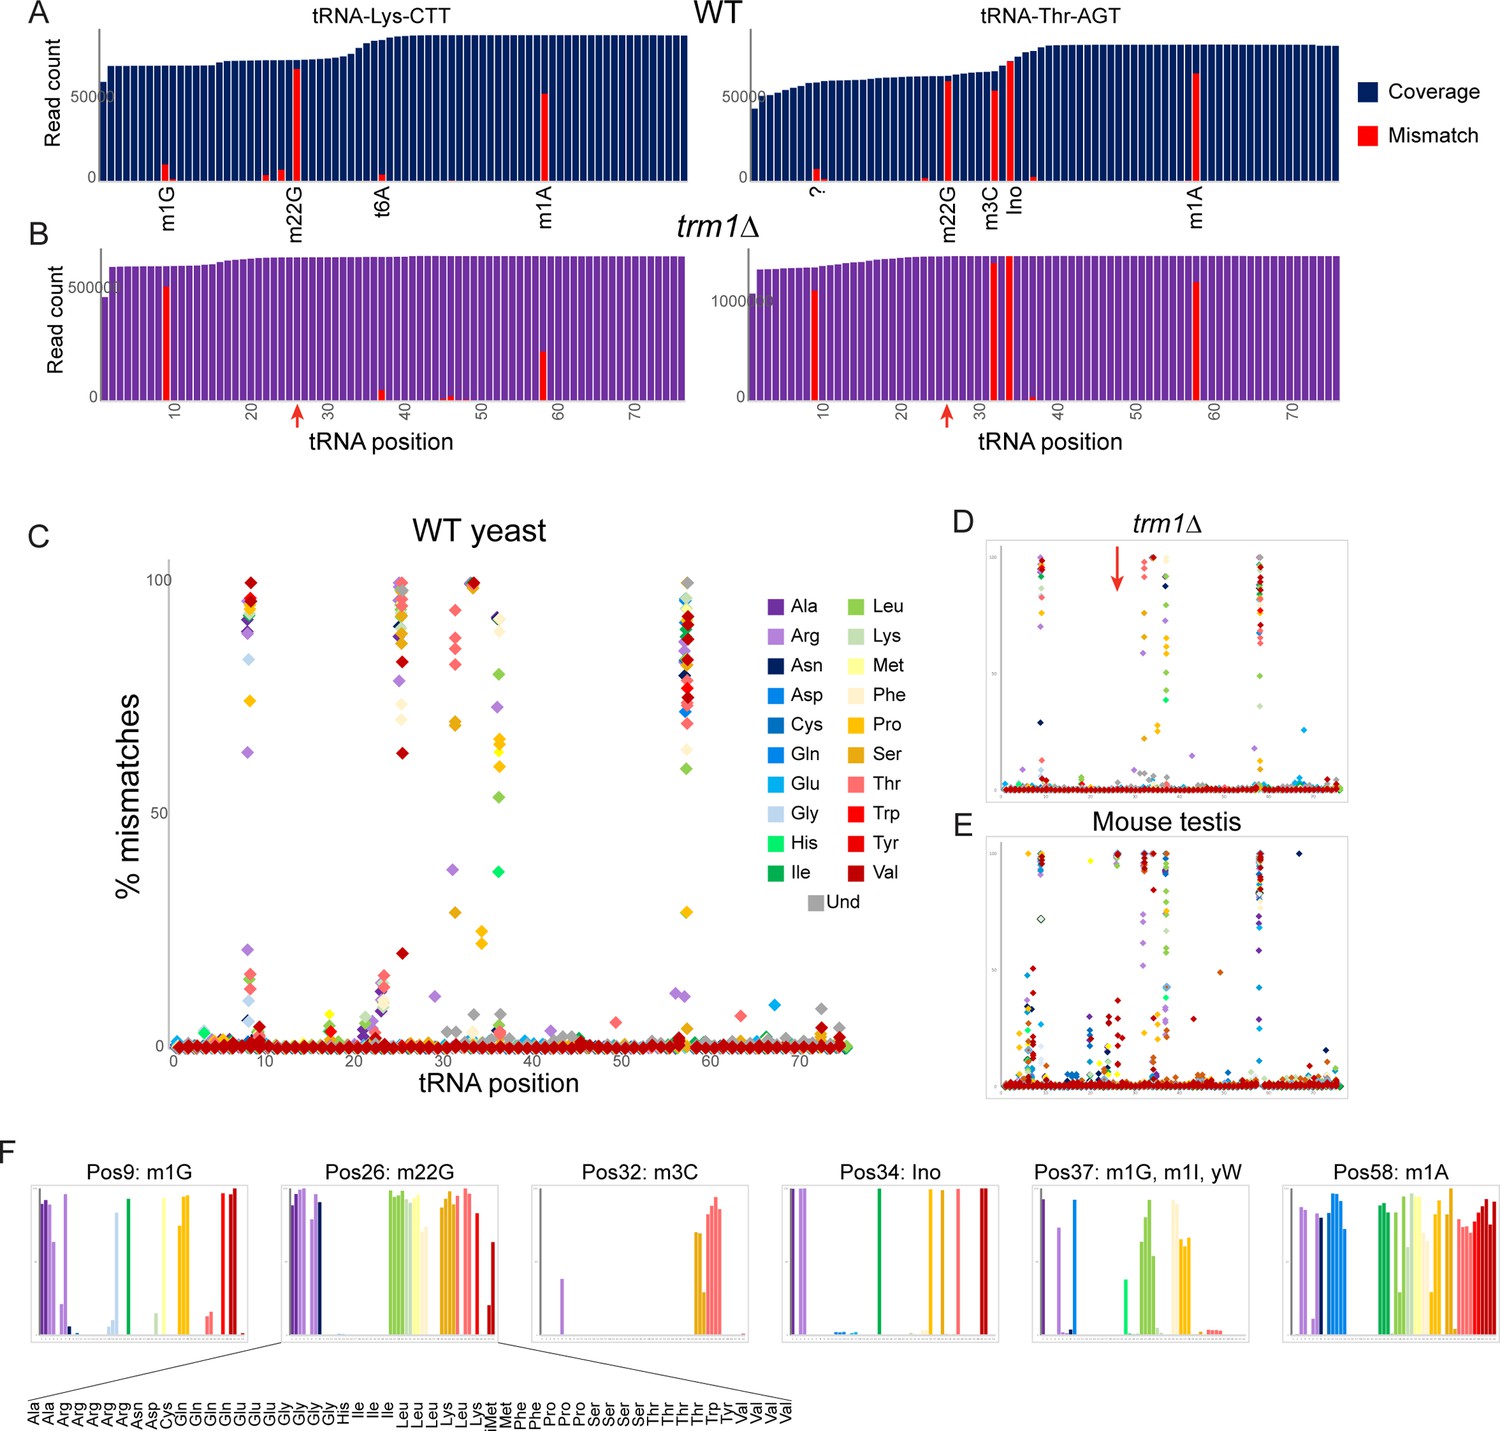
Nucleotide modifications revealed by genomic mismatches.
(A) Sequence coverage of the two indicated tRNAs, with reads matching the genomic tRNA sequence shown in blue, and apparent misincorporations in red. Known nucleotide modifications are shown below each mismatch location. Question mark at position 9 for Thr-AGT indicates no annotated modification at this site in the MODOMICS database (although this site is a common site for the m1G modification in other tRNAs); interestingly, the adjacent nucleotide (position 10) is a known site for N2-methylated guanine in this tRNA. (B) Misincorporation data from the trm1Δ dataset for the same two tRNAs as in panel (A). Red arrows indicate loss of mismatches at position 26 in both tRNAs. (C–E) Frequency of mismatches across all tRNAs for wild-type yeast (C) trm1Δ yeast (D) and mouse (E) OTTR tRNA datasets. In each plot, the % misincorporation is shown for each tRNA position (x axis) for each tRNA species (indicated by colors) with over 2000 reads. Red arrow in panel (D) shows the loss of the misincorporation signature at position 26 in trm1Δ yeast. (F) Detailed view of mismatch frequency at the six indicated nucleotide positions of budding yeast tRNAs. Bar graphs are from the same data as in panel (C) The known nucleotide modifications at these positions are annotated.
Figure 3 with 2 supplements
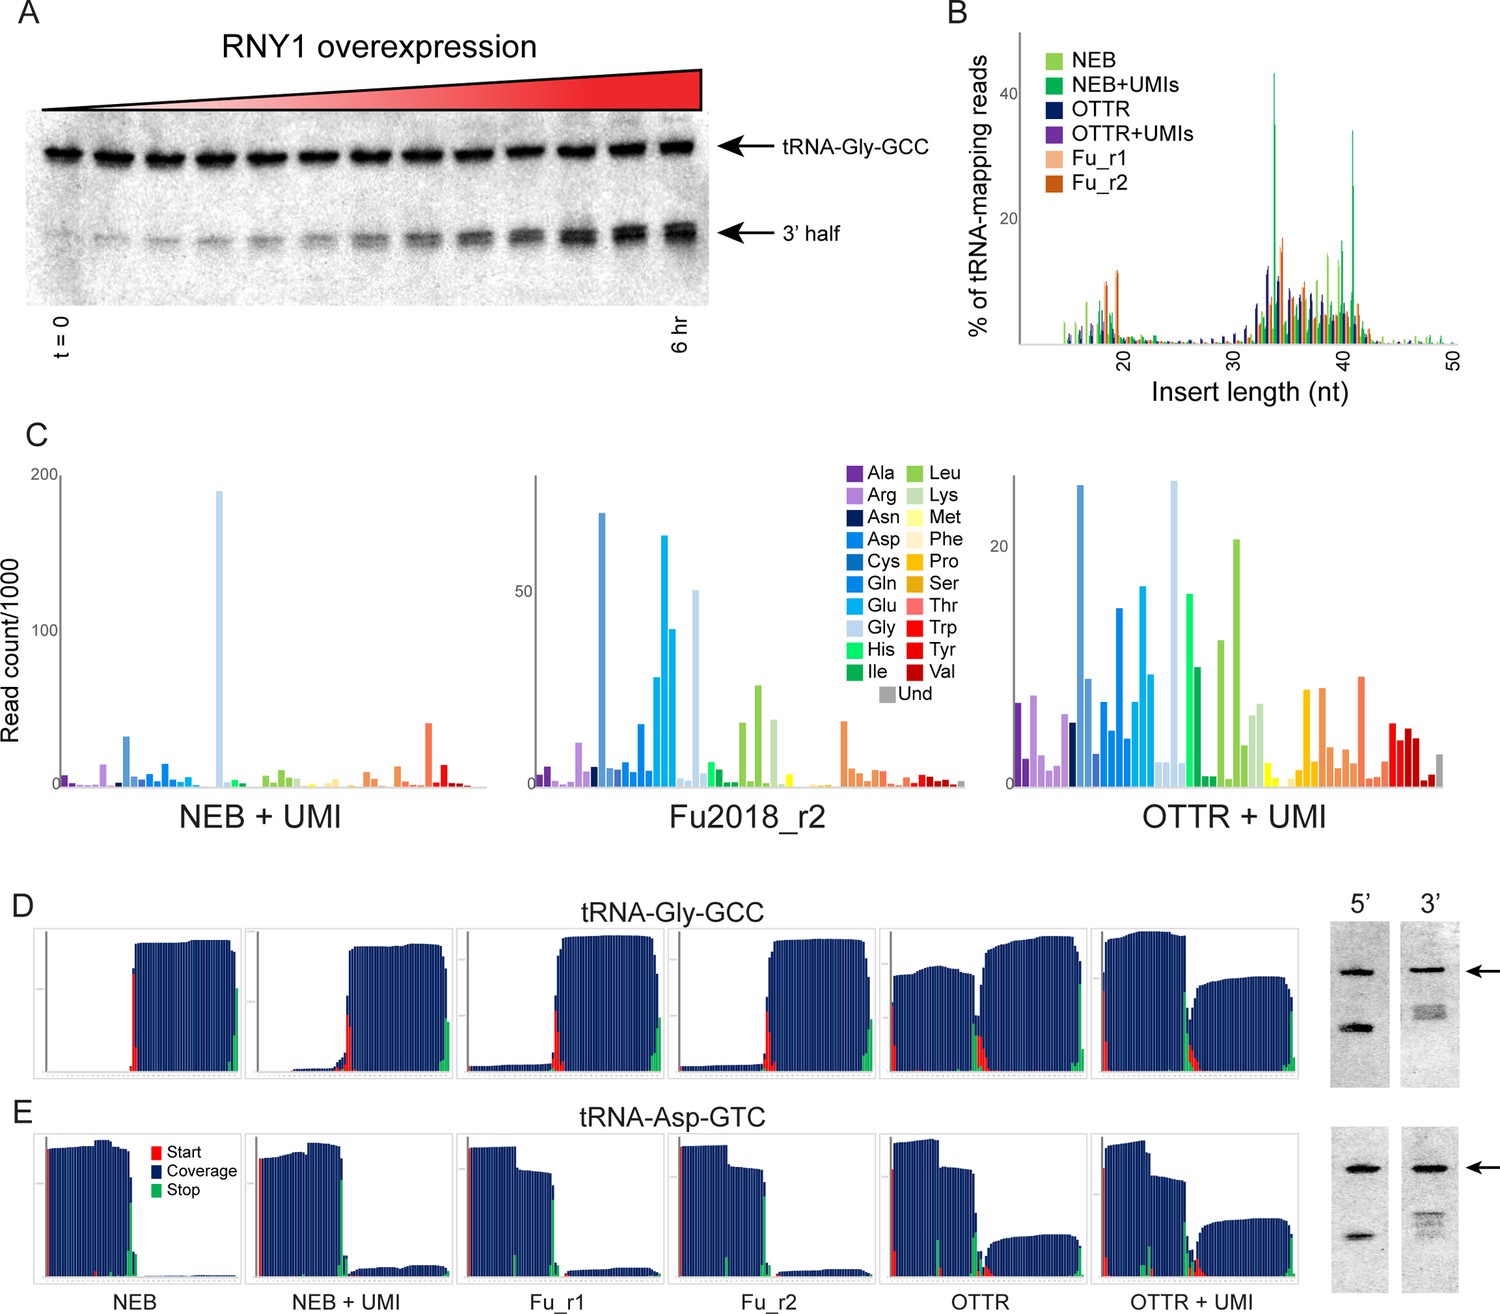
Benchmarking OTTR capture of tRNA fragments in budding yeast overexpressing RNY1p.
(A) Northern blots for tRNA-Gly-GCC 3′ end during a time course of RNY1p overexpression (from uninduced to 6 hr induction) in budding yeast. (B) Size distributions for tRNA-mapping reads in various small RNA libraries prepared from yeast following six hours of RNY1p overexpression. See also Figure 3—figure supplement 1. (C) Overall coverage of all tRNA isoacceptors – calculated by summing all reads mapping to a given tRNA species – shown for the indicated small RNA cloning protocols. (D, E) Left panels show coverage maps for tRNA-Gly-GCC (D) or tRNA-Asp-GTC (E) for the six indicated cloning protocols. Each plot shows the distribution of all 5′ (start) and 3′ (end) ends of the relevant sequencing reads, as well as the cumulative sequencing coverage across the tRNA. Right panels for each tRNA show Northern blots for the 5′ side, and the 3′ side, of the relevant tRNA (from yeast subject to 6 hr of RNY1p overexpression), as indicated. Black arrow highlights the full-length tRNA band. The deep sequencing datasets from NEBNext and Fu et al., 2018 protocols capture only the 3′ half of tRNA-Gly-GCC, and the 5′ half of Asp-GTC, while OTTR captures both 5′ and 3′ halves. In both cases, Northern blots confirm the validity of the OTTR dataset, with both 5′ and 3′ halves present at similar abundance for both of these tRNAs.
-
Figure 3—source data 1
Original images of Northern blots used in Figure 3.
- https://cdn.elifesciences.org/articles/77616/elife-77616-fig3-data1-v2.zip
-
Figure 3—source data 2
Annotated Northern blots for source data.
- https://cdn.elifesciences.org/articles/77616/elife-77616-fig3-data2-v2.zip
Figure 3—figure supplement 1
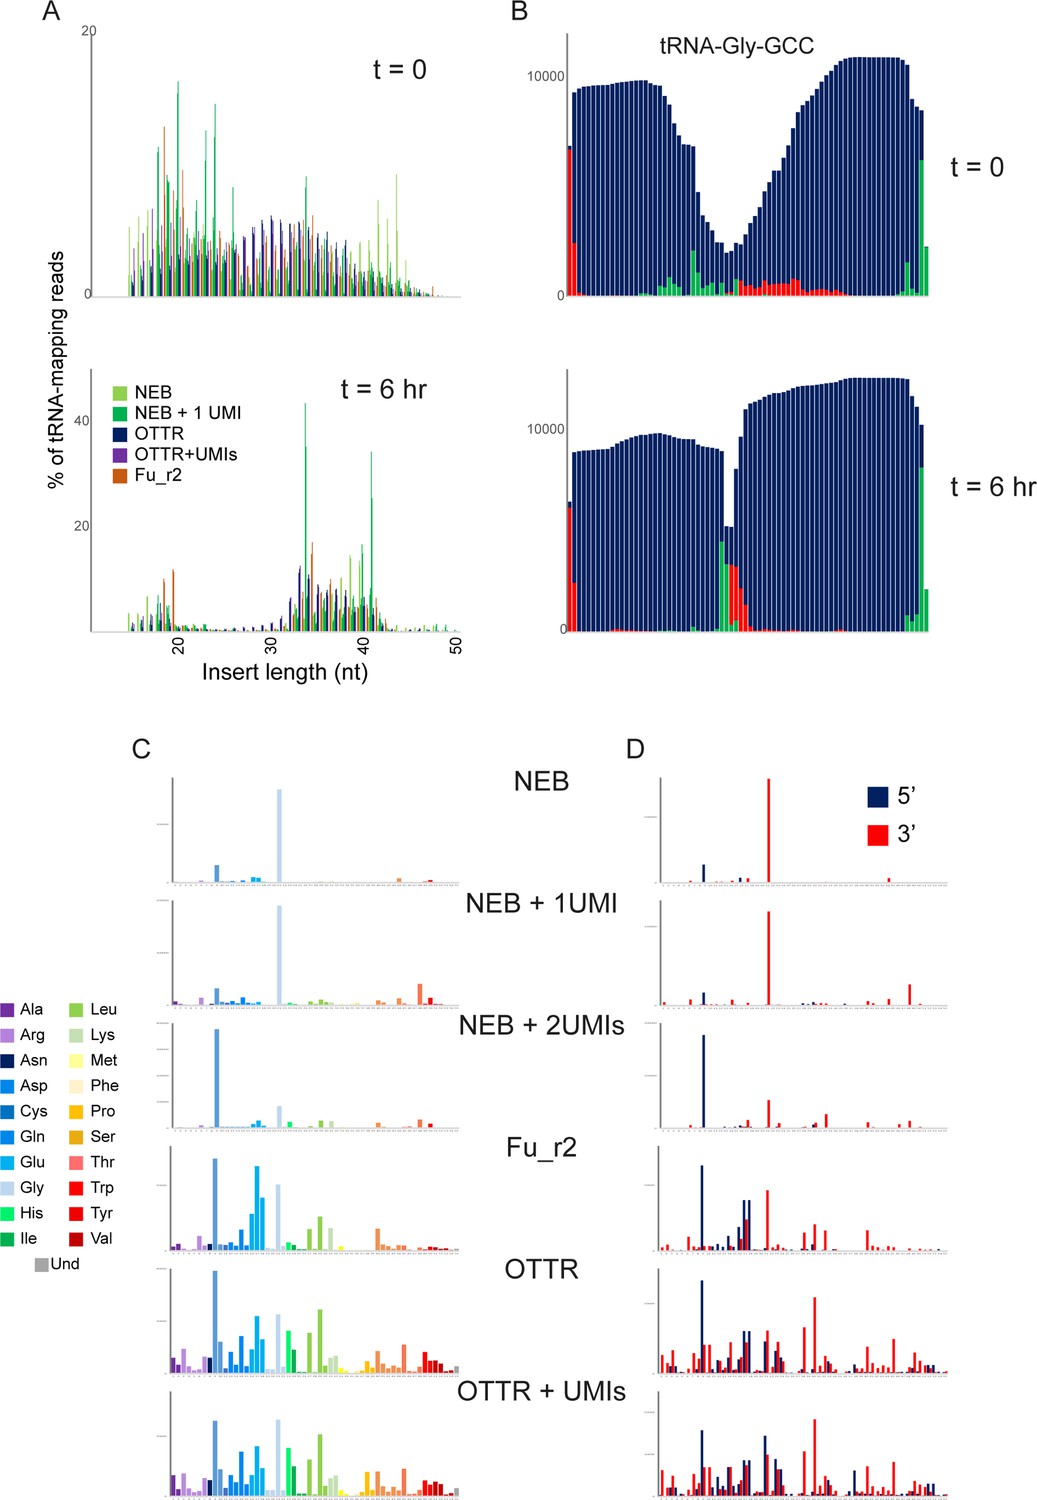
tRF profiling in budding yeast following RNY1p expression.
(A) Size distribution of tRNA-mapping reads in the indicated libraries prepared from yeast carrying the pGal:RNY1 plasmid grown under noninducing raffinose conditions (top panel), or grown for 6 hours in galactose to induce RNY1p (bottom panel). The wide rage of fragment sizes prior to RNY1p induction likely reflects tRNA degradation during RNA handling, in contrast to the induction of precise cleavage at the anticodon following RNY1p induction. In addition, spike-ins of Schizosaccharomyces pombe total RNA for normalization confirm an ~10-fold increase (not shown) in tRNA fragments following RNY1p induction in S. cerevisiae. (B) Coverage of tRNA-Gly-GCC in OTTR libraries before (top) and after (bottom) RNY1p overexpression. As in panel (A), specific cleavage at the anticodon is readily distinguished from the more nonspecific tRNA degradation seen in uninduced conditions. (C) Coverage of tRNA fragments in RNY1p-induced yeast. As in Figure 3C, for all libraries sequenced. (D) 5′ and 3′ tRF detection. As in panel (C), but here reads were separately mapped to tRNA 5′ or 3′ halves and the two halves are plotted separately, as indicated.
Figure 3—figure supplement 2
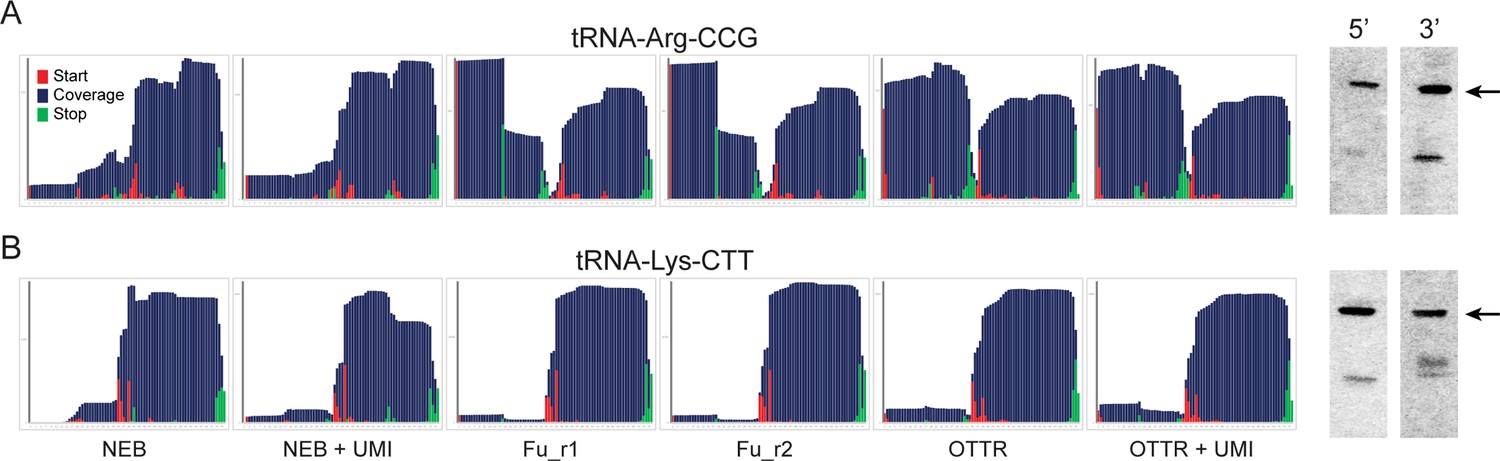
Northern blotting validates OTTR capture of tRNA halves in yeast overexpressing RNY1p.
As in Figure 3D and E, for two additional tRNAs.
-
Figure 3—figure supplement 2—source data 1
Original images of Northern blots used in Figure 3—figure supplement 2.
- https://cdn.elifesciences.org/articles/77616/elife-77616-fig3-figsupp2-data1-v2.zip
-
Figure 3—figure supplement 2—source data 2
Annotated Northern blots for source data.
- https://cdn.elifesciences.org/articles/77616/elife-77616-fig3-figsupp2-data2-v2.zip
Figure 4 with 2 supplements
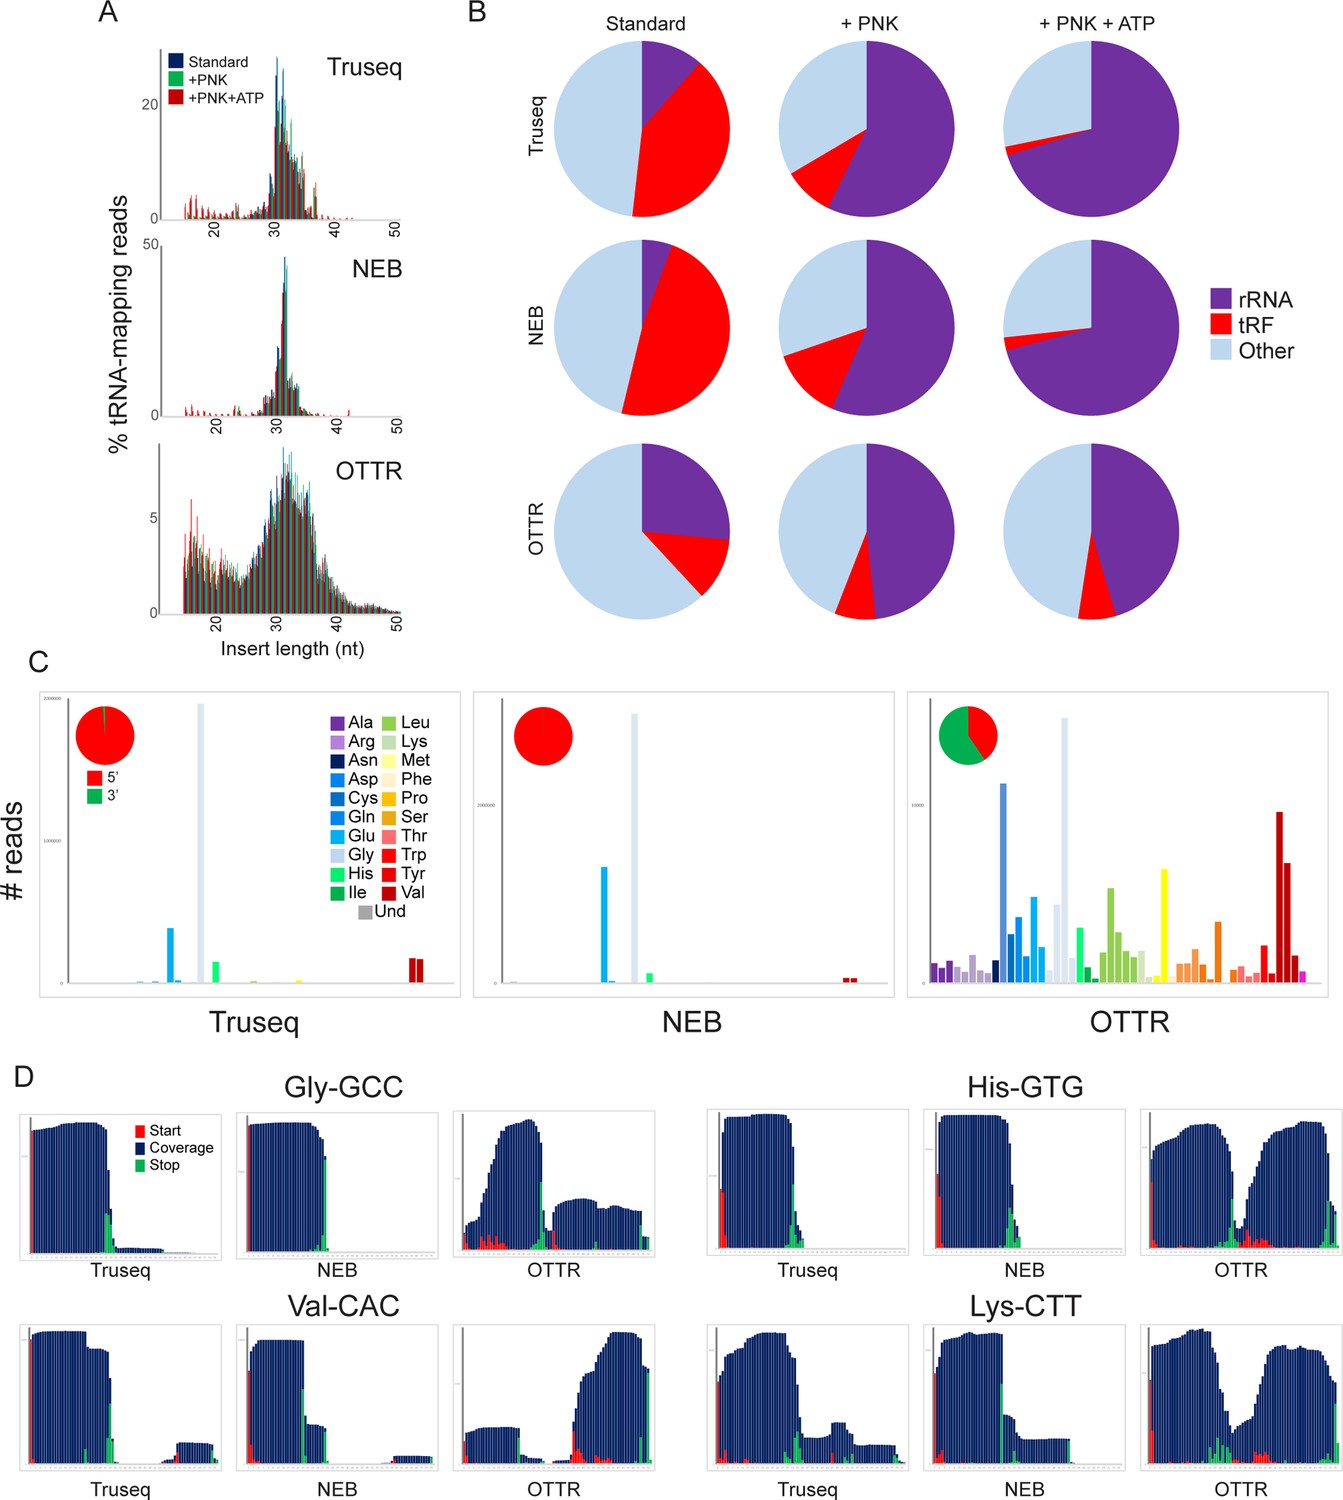
A revised view of the mouse sperm small RNA payload.
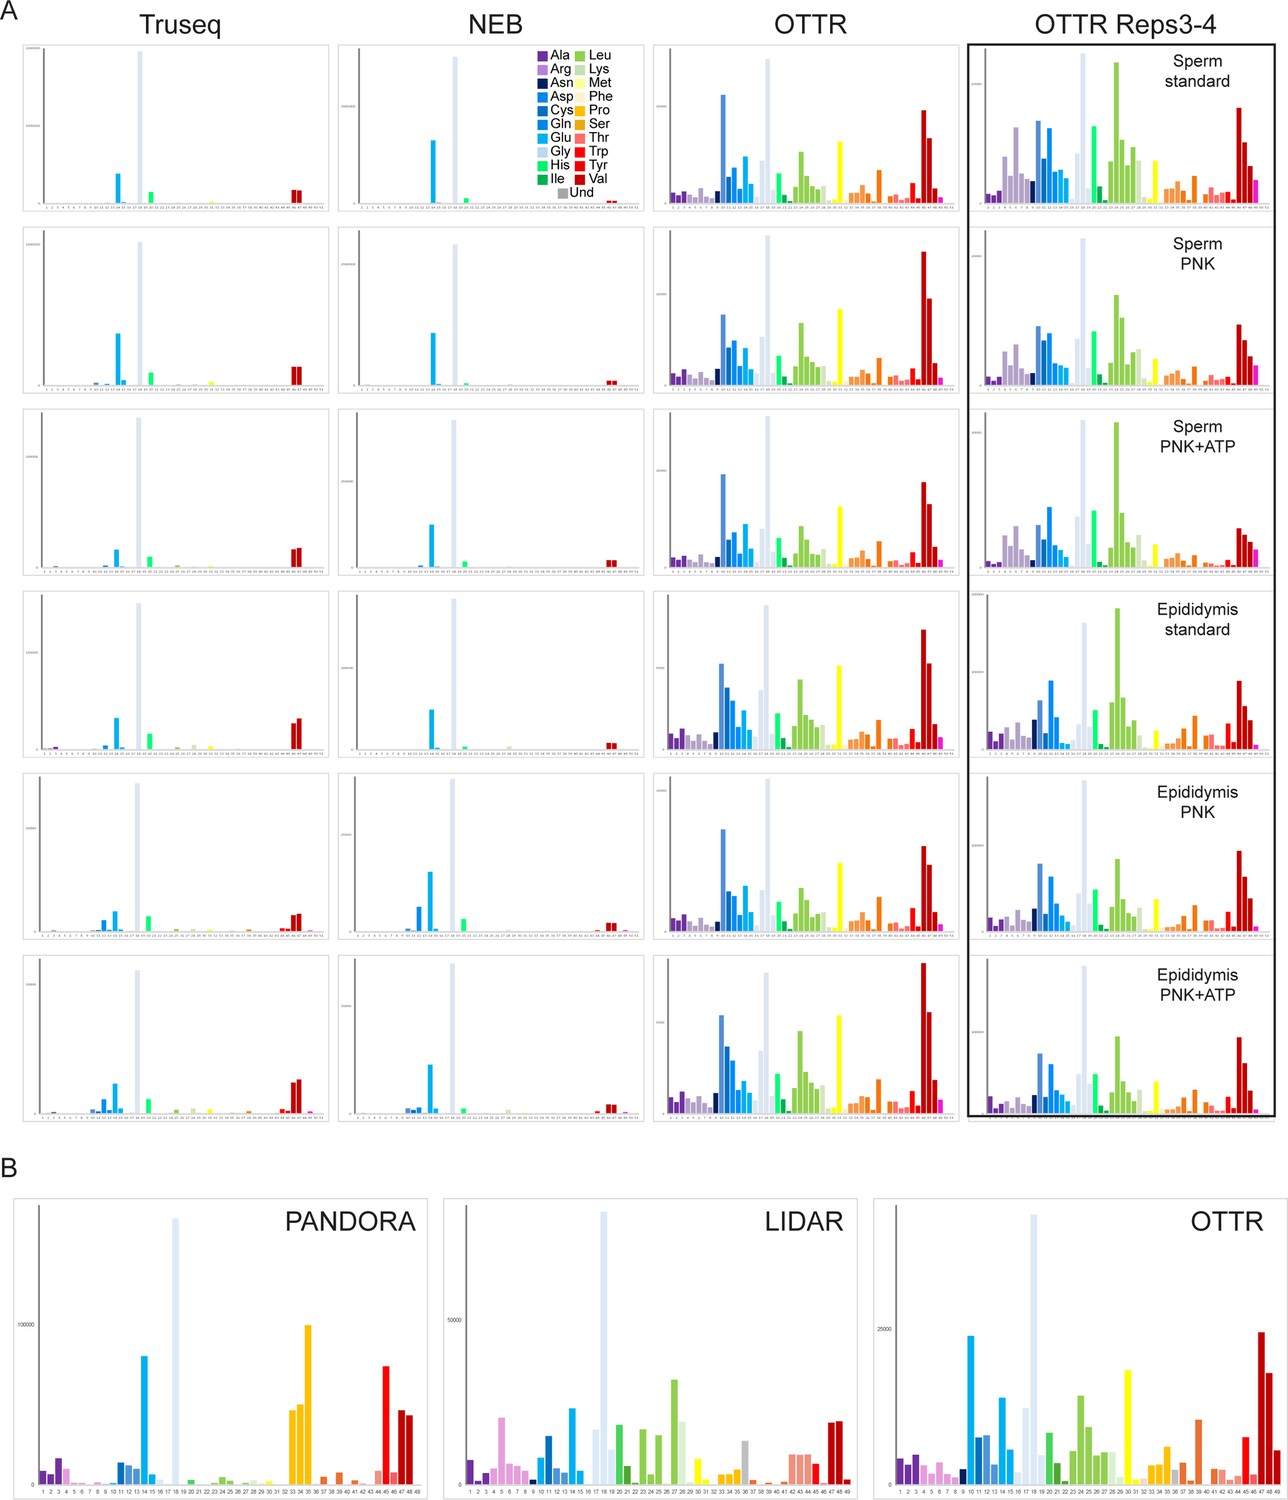
(A) Small RNA length distributions, as in Figure 3B, for tRNA-mapping reads in various mouse sperm RNA libraries generated using the indicated protocols. (B) Pie charts showing overall mapping of each library to the indicated RNA classes. (C) Overall coverage of all tRNA species in each dataset, as in Figure 3C. Here, each dataset also has a pie chart showing the percentage of tRNA-mapping reads derived from the 5′ or the 3′ half of tRNAs, as indicated. See also Figure 4—figure supplement 1. (D) Coverage plots for four typical tRNAs, as in Figure 3D and E.
Figure 4—figure supplement 1
Global tRNA coverage in mouse sperm small RNA OTTR libraries.
(A) Coverage of all mouse tRNAs species in the indicated libraries, plotted as in Figure 4C. Note that for each library type, we performed two biological replicate experiments; as these were essentially indistinguishable, only one replicate is shown here. The right column includes data from a second batch of OTTR datasets, in which we generated two biological replicates for mouse sperm and for mouse cauda epididymis. Again, only one of the two replicates is shown here as both replicates were nearly identical. (B) As in panel (A), including published mouse sperm datasets obtained using LIDAR (Scacchetti et al., 2024) or PANDORA (Shi et al., 2021).
Figure 4—figure supplement 2
Effects of PNK treatment on tRF levels.
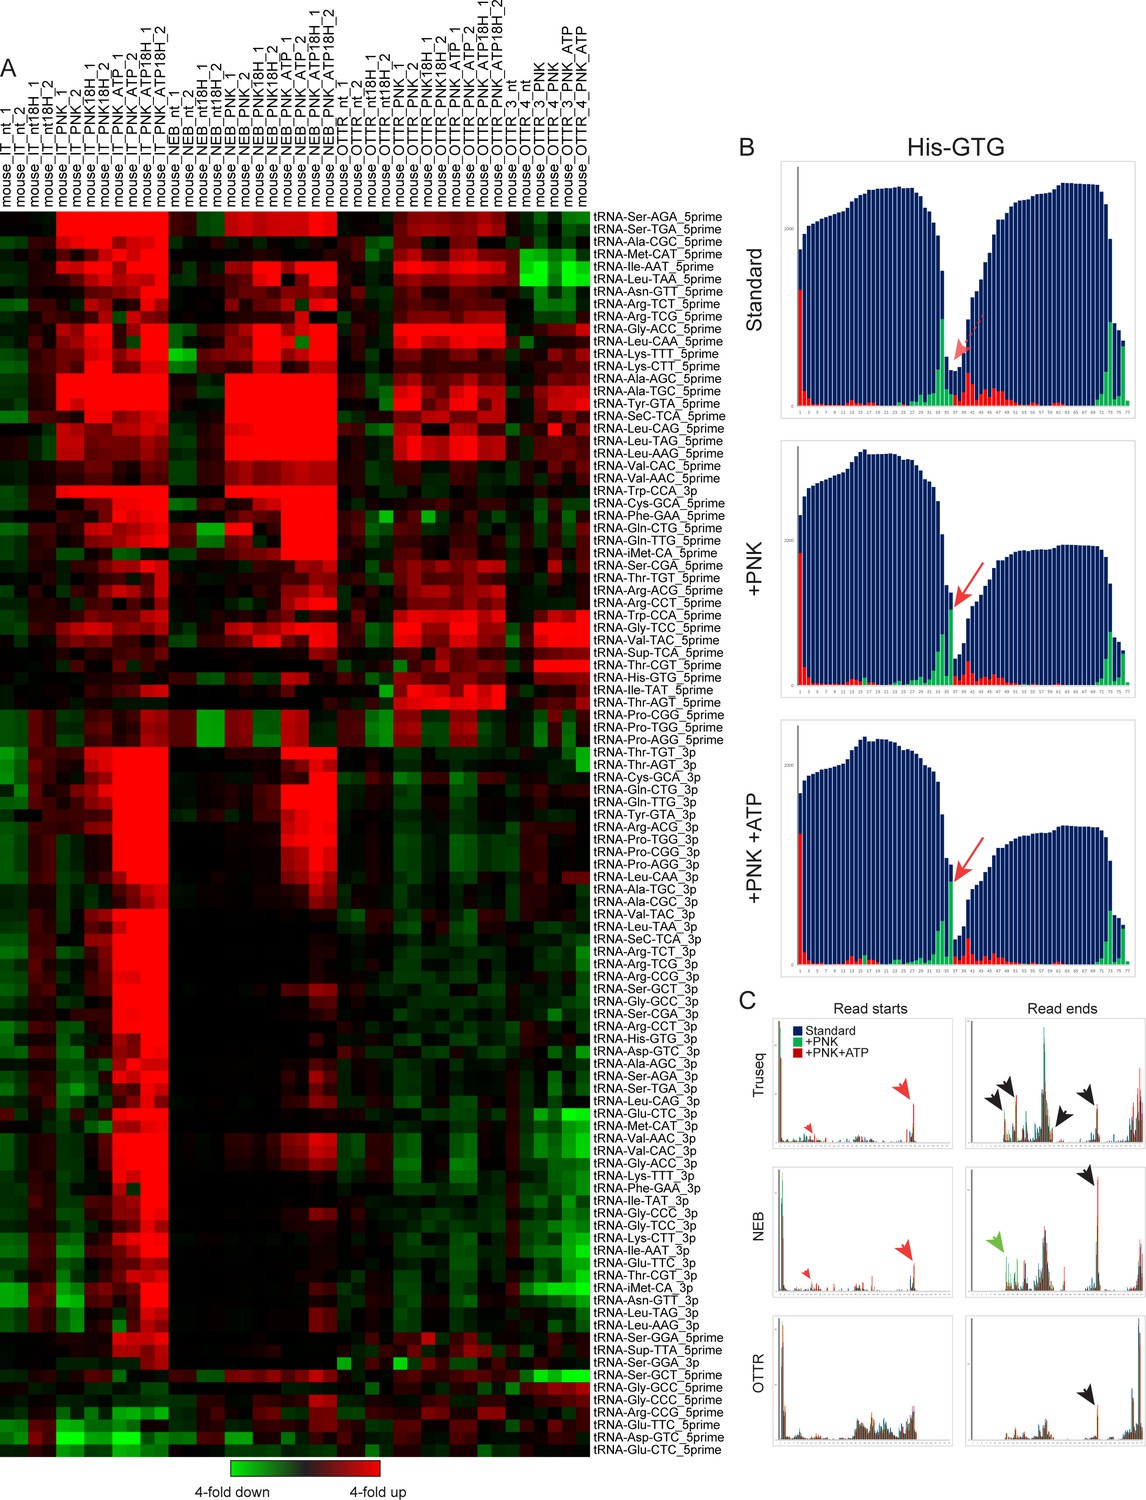
(A) For each set of libraries – TruSeq, NEB, OTTR reps1-2, and OTTR reps3-4 – relative abundance of 5′ and 3′ tRFs for each dataset was normalized relative to the median value across the four untreated (eg no PNK) libraries. Dataset labels describe the sample (mouse), library preparation protocol (IT, NEB, OTTR), and protocol variation (nt: untreated; 18 H: extended RT time; PNK: PNK treatment without ATP; PNK_ATP; PNK + ATP). This visualization reveals increased abundance of a wide range of tRFs resulting from PNK treatment, as for example 3′ tRNA fragments were generally increased in abundance in TruSeq and NEB libraries following PNK + ATP treatment. That said, even after PNK +ATP treatment these tRFs were still scarce in TruSeq and NEB libraries compared to OTTR libraries with or without PNK pre-treatment (not visualized here using within-protocol normalization; see Figure 4C). Many 5′ tRFs were enriched following PNK treatment in all three library conditions (eg Leu-CAA), while a smaller subset of 5′ tRFs were PNK-enriched in TruSeq and NEB datasets only (eg Cys-GCA). The capacity for OTTR to capture 2′–3′ cyclic phosphate-containing templates excluded by ligase-dependent library preparations likely contributed to the reported improvements in library capture bias in ribosome profiling libraries where RNase I was used to prepare mRNA ribosome protected fragments (Ferguson et al., 2023). (B) Example of PNK-dependent cleavage-site capture in OTTR libraries. All three panels show read start, stop, and coverage for tRNA-His-GTG. Red arrow shows the 3′ end of a longer 5′ tRF seen only following PNK treatment. (C) For each tRNA in the mouse genome with over 100 reads of total coverage, the percentage of read starts (left column) or read ends (right column) was calculated for each library type. Read starts and stops percentages were then averaged across all tRNAs, and are plotted for untreated, PNK-treated, and PNK + ATP-treated libraries. Red arrows highlight PNK-specific peaks, green arrows highlight PNK + ATP-specific peaks, and black arrows highlight peaks enriched in both PNK and PNK + ATP treatments compared to untreated RNA libraries.
Figure 5
Removing nucleotide modifications improves tRNA capture using OTTR.
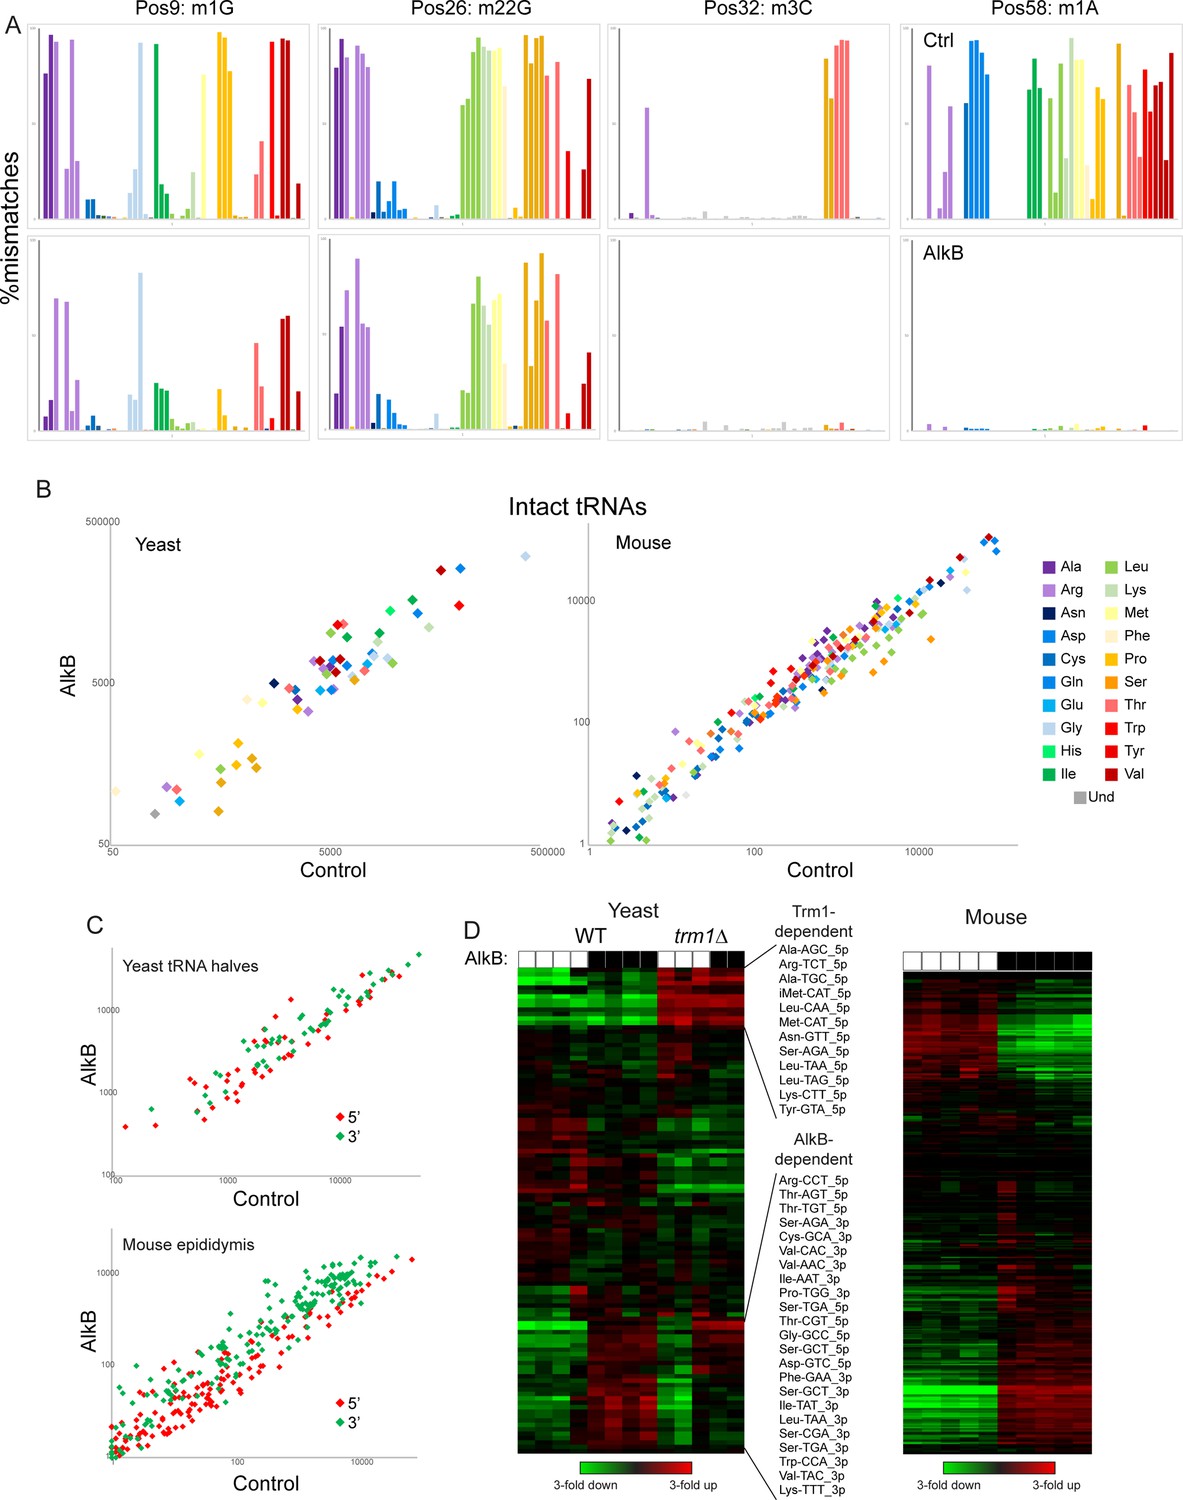
(A) Mismatches at the indicated positions are plotted as in Figure 2F for full-length tRNA sequencing from yeast. Top row shows control-treated yeast RNAs, bottom row shows AlkB-treated RNAs. (B) Scatterplots for intact tRNA abundance in yeast (left) and mouse testis (right), comparing control-treated RNA (x axis) with AlkB-treated RNA (y axis). Some tRNAs, particularly a subset of serine and leucine tRNAs in the mouse sample, exhibit ~threefold differences in abundance following AlkB treatment. (C) Scatterplots show abundance of 5′ and 3′ tRNA fragments in yeast overexpressing RNY1 (top panel), or in the mouse epididymis (bottom panel), before and after AlkB treatment. (D) Heatmaps showing changes in tRNA fragment representation across the indicated samples for yeast (left panel) and mouse epididymis (right panel).
Additional files
Download links
A two-part list of links to download the article, or parts of the article, in various formats.
Downloads (link to download the article as PDF)
Open citations (links to open the citations from this article in various online reference manager services)
Cite this article (links to download the citations from this article in formats compatible with various reference manager tools)
Deep sequencing of yeast and mouse tRNAs and tRNA fragments using OTTR
eLife 14:e77616.
https://doi.org/10.7554/eLife.77616


