Ear pinnae in a neotropical katydid (Orthoptera: Tettigoniidae) function as ultrasound guides for bat detection
- University of Lincoln, School of Life & Environmental Sciences, Joseph Banks Laboratories, Green Lane, United Kingdom
- Smithsonian Tropical Research Institute, Panama
- CoSys Lab, Faculty of Applied Engineering, University of Antwerp, Belgium
- Flanders Make Strategic Research Centre, Belgium
Figures
Figure 1
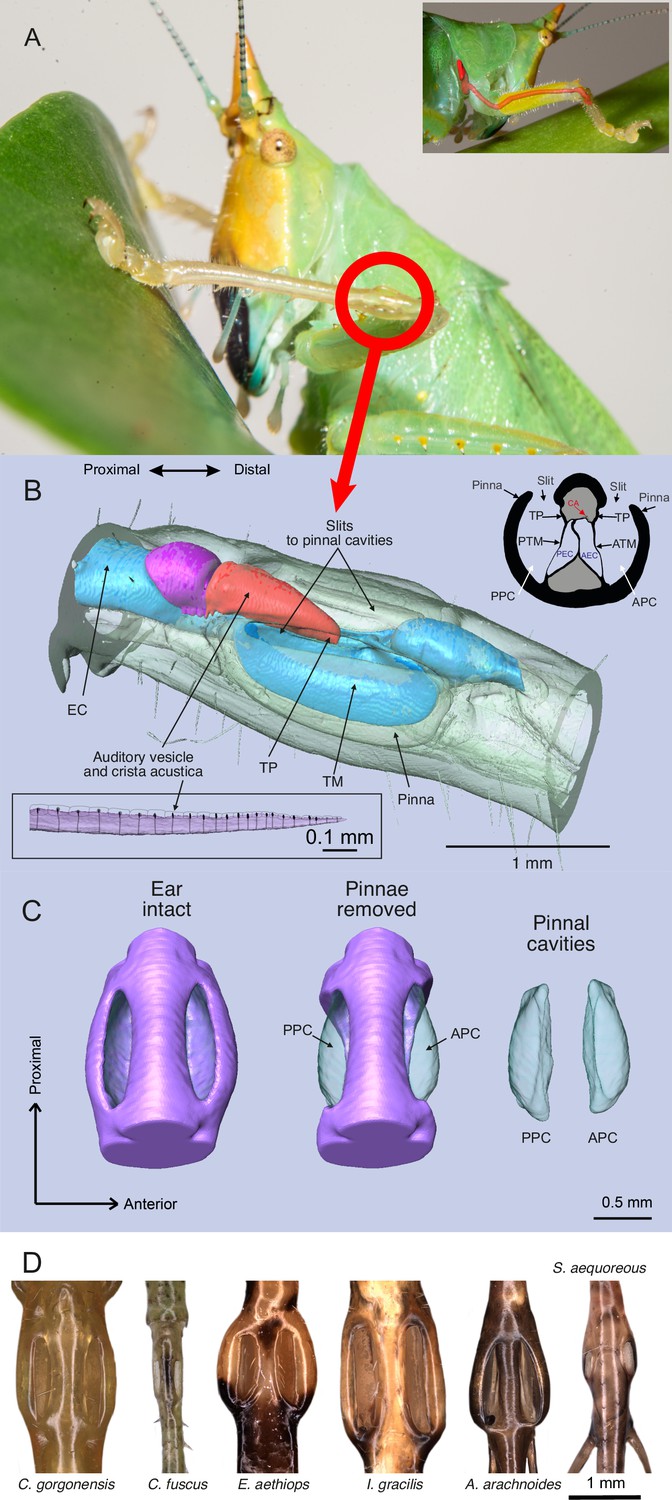
The ear of Copiphora gorgonensis.
(A) Location of the ear in the foreleg with a smaller panel illustrating the ear canal extending from the prothorax (acoustic spiracle) to the femoro-tibial “knee” joint through the foreleg. (B) 3D reconstruction of the tympanal organ of C. gorgonensis, showing external and internal structures. Inset in the upper right corner shows a cross section through the ear, inset in the lower left corner shows a lateral view of the crista acustica with sensory cells. EC = ear canal, TP = tympanal plate, ATM = anterior tympanal membrane, PTM posterior tympanal membrane, PEC = posterior ear canal division AEC = anterior ear canal division, CA = crista Acustica, AV = auditory vesicle. APC = anterior pinnal cavity, PPC = posterior pinnal cavity; (C) 3D anatomy of the ear, with pinnae present, removed, and pinnal cavity volumes; (D) Examples of cuticular pinnae of various katydids from three ensiferan subfamilies: (L–R): C. gorgonensis (Conocephalinae), Conocephalus fuscus (Conocephalinae), Eubliastes aethiops (Pseudophyllinae), Ischnomela gracilis (Pseudophyllinae), Arachnoscelis arachnoides (Meconematinae), and Supersonus aequoreus (Meconematinae).
Figure 2 with 2 supplements

The effect of pinnae in the time domain and numerical simulations.
(A) Time plots from five incidence angles for the 60 kHz test sound illustrating changes in oscillation phase between the anterior (ATM, in red) and posterior (PTM, in blue) tympana of the same ear. Notice the phase difference of 0.25 cycles is 90° at –10° and 10°. An anatomical cross section of the ear is shown with each tympanum (ATM and PTM), auditory vesicle (AV), posterior and anterior bifurcated ear canal branches (PEC and AEC), haemolymph channel (HC) and posterior and anterior pinnal structures (PP and AP). (B) Mean displacement amplitudes (nm) of the tympanal membranes for each tested frequency (23, 40, and 60 kHz) with and without the presence of cuticular pinnae (n = 9 ears). (C) Cavity-induced pressure gains with pinnae compared to sound pressure (Pa) predictions with the pinnae ablated from numerical models using Comsol Multiphysics (17 ears; 10 females, 7 males). For means comparison plots (B) & (C), significance symbols from post hoc analyses: ‘***’ 0.001, ‘**’ 0.01, ‘*’ 0.05, ‘ns’ 0.1, and ‘ ’ 1. Grey bars with cuticular pinnae and black bars without cuticular pinnae showing standard error.
Figure 2—figure supplement 1
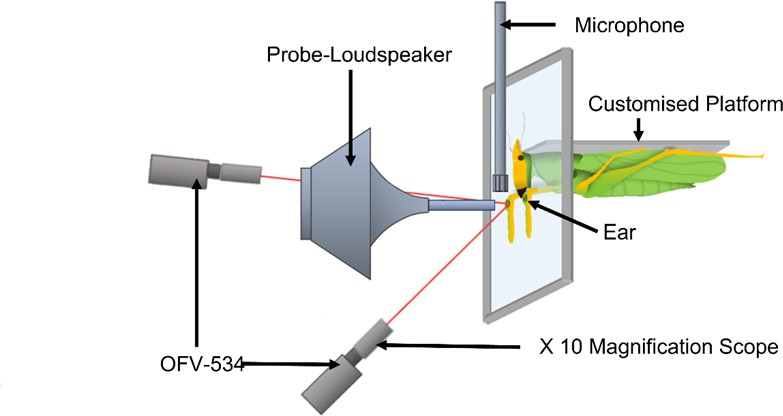
Diagram of experimental arena with a mounted Copiphora gorgonensis (not drawn to scale) on specialised (input isolating) platform with a rotating probe-tipped loudspeaker perpendicular to the tympanal septum and single point sensor heads (OFV-534) in perpendicular position.
Figure 2—figure supplement 2
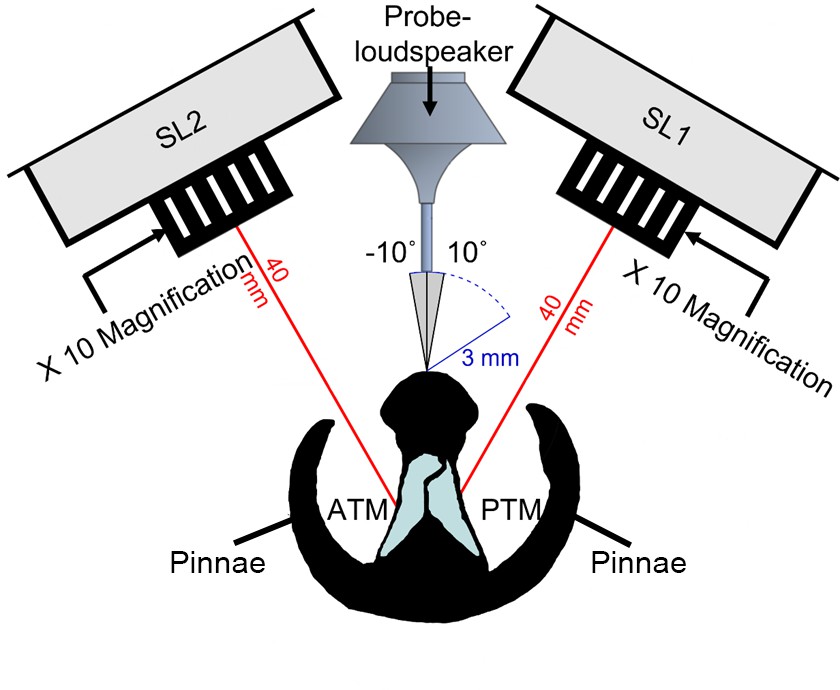
Illustration of experimental arena with a cross section of the copiphorine ear positioned in relation to the single point laser sensor heads with magnifying lenses (SL1 and SL2) and the rotating probe-loudspeaker.
The loudspeaker was rotated along a 12 cm semi-circle in 1° steps (each automated step about 0.56 mm) from –10° to 10° perpendicular to the centre of the ear and presented a four-cycle sinusoidal wave at the frequencies 23, 40, and 60 kHz in sequence.
Figure 3 with 1 supplement
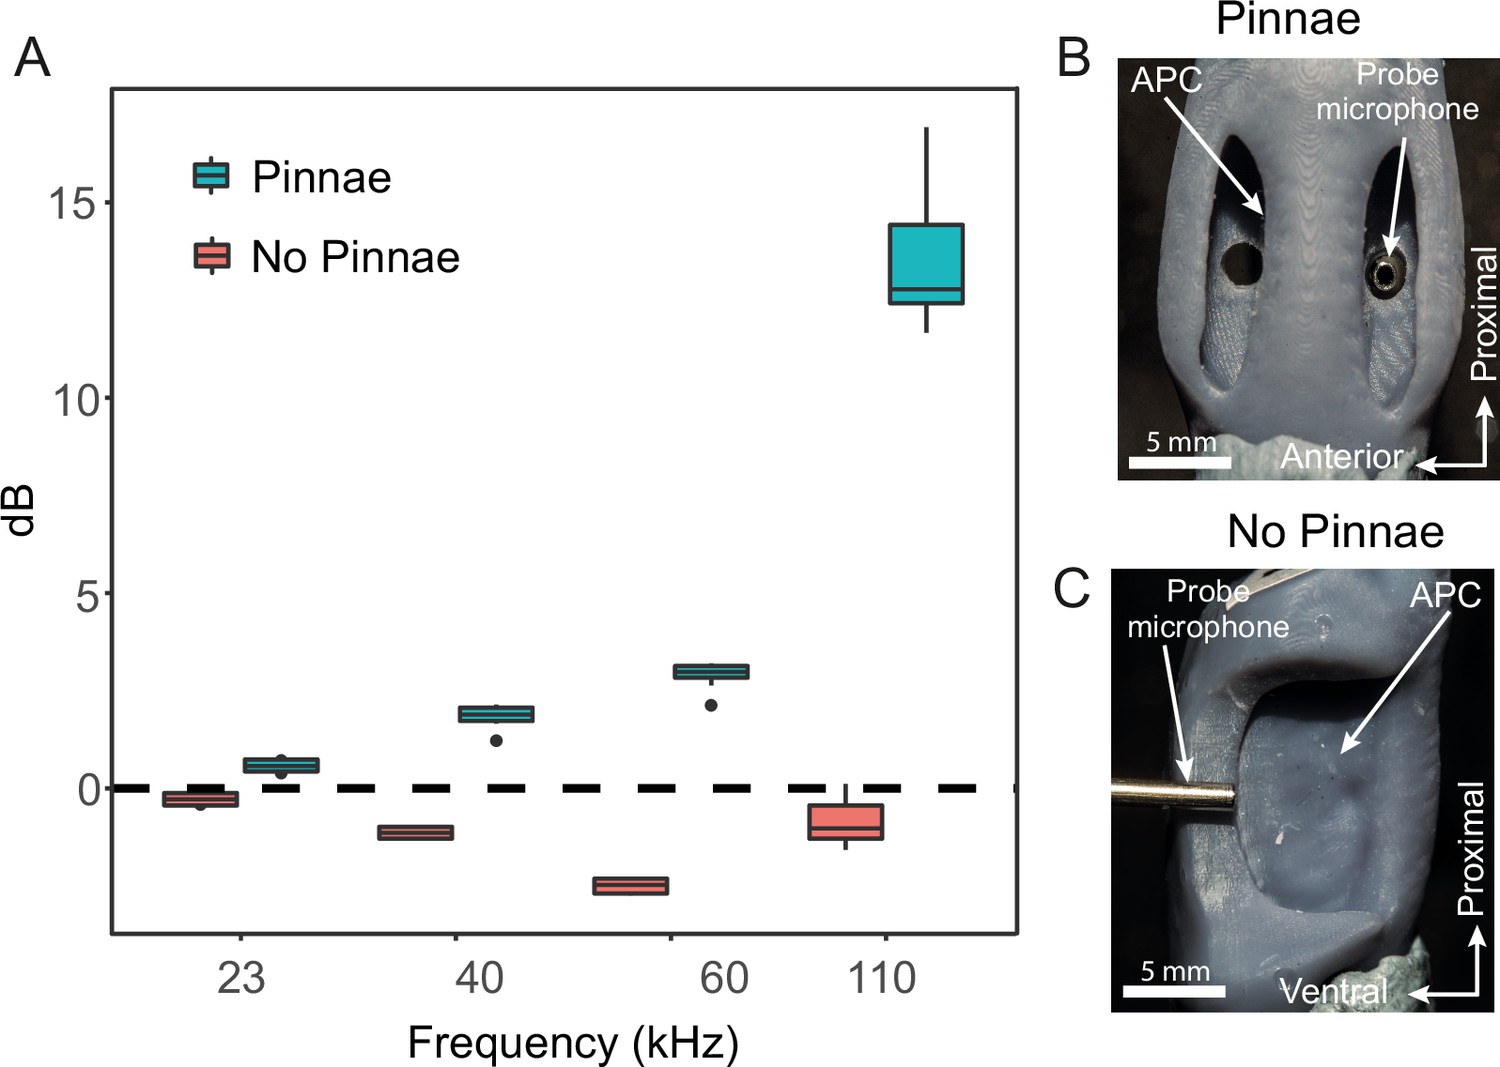
Acoustic experiments with 3D printed scaled ear models.
(A) Sound pressure gains (dB SPL) of 3D printed ears (n = 8; 4 males and 4 females) calculated from scaled time domain recordings for 23, 40, 60, and 110 kHz 4-cycle pure tones. (B) An example of a 3D printed ear model with pinnae present (dorsal view) showing the probe microphone inside the posterior tympanum. (C) An example of a 3D printed ear model with pinnae ablated (anterior lateral view), showing probe microphone placement.
Figure 3—figure supplement 1
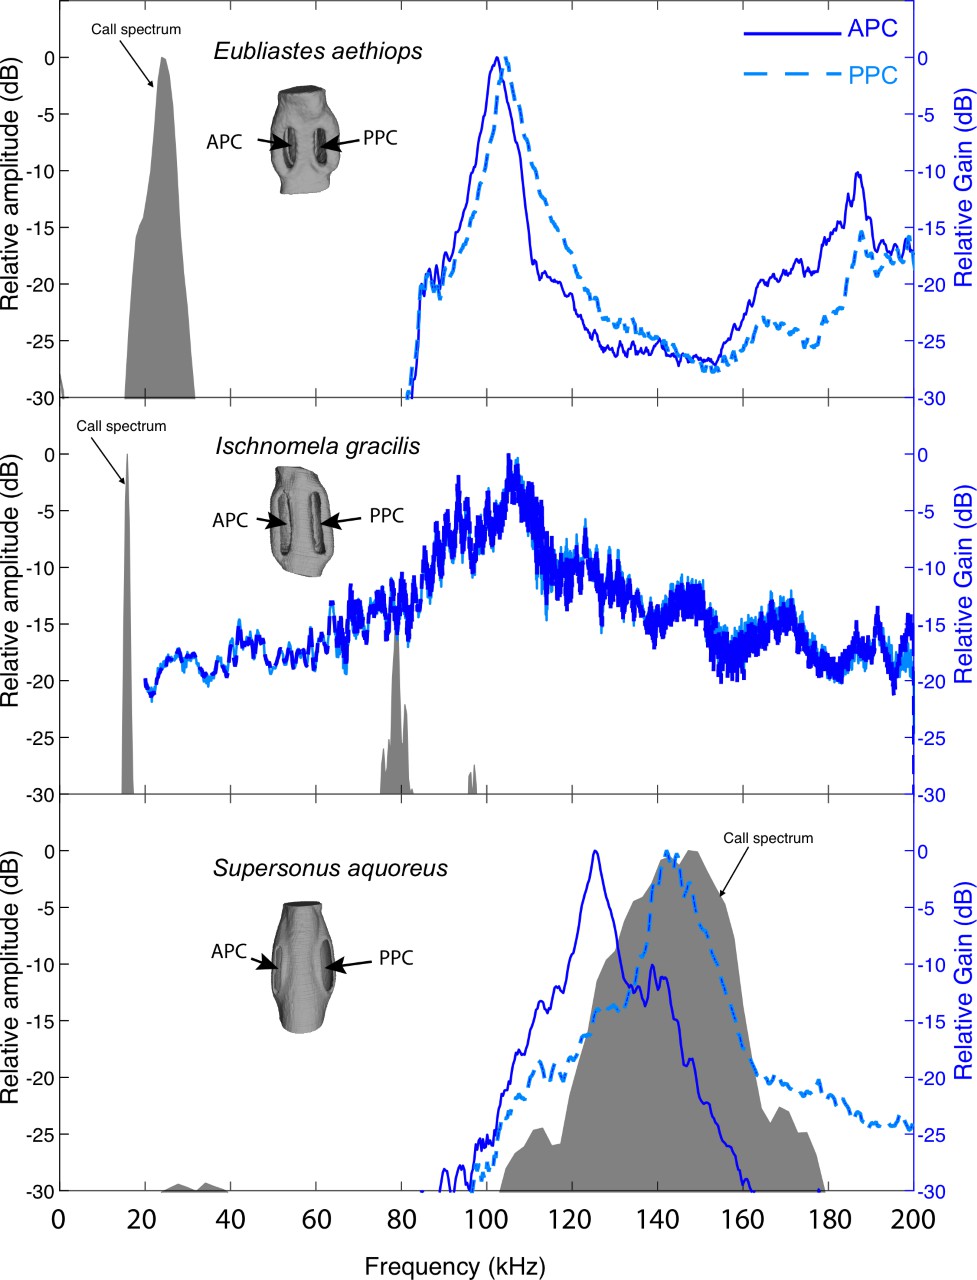
Pinnal cavity relative gain (dB) of sympatric katydid species with auditory pinnae, from the island of Gorgona, Colombia, in response to scaled broadband chirps.
Ischnomela gracilis (Pseudophyllinae) printed scale 1:12 showing resonance peaks of 104 kHz in both anterior (APC) and posterior (PPC), Eubliastes aethiops (Pseudophyllinae) printed scale of 1:13.1 showing resonance peaks of 102 kHz APC and 104 kHz PPC, and Supersonus aquoreus (Meconematinae) printed scale 1:21.5 showing resonance showing resonance peaks of 125 kHz APC and 142 kHz PPC. APC in blue continuous outline, and PPC in blue dashed lines (relative gain in dB, blue axis). Shaded grey area represents a frequency spectrum of the conspecific calling song of each species (relative amplitude dB).
Figure 4 with 1 supplement
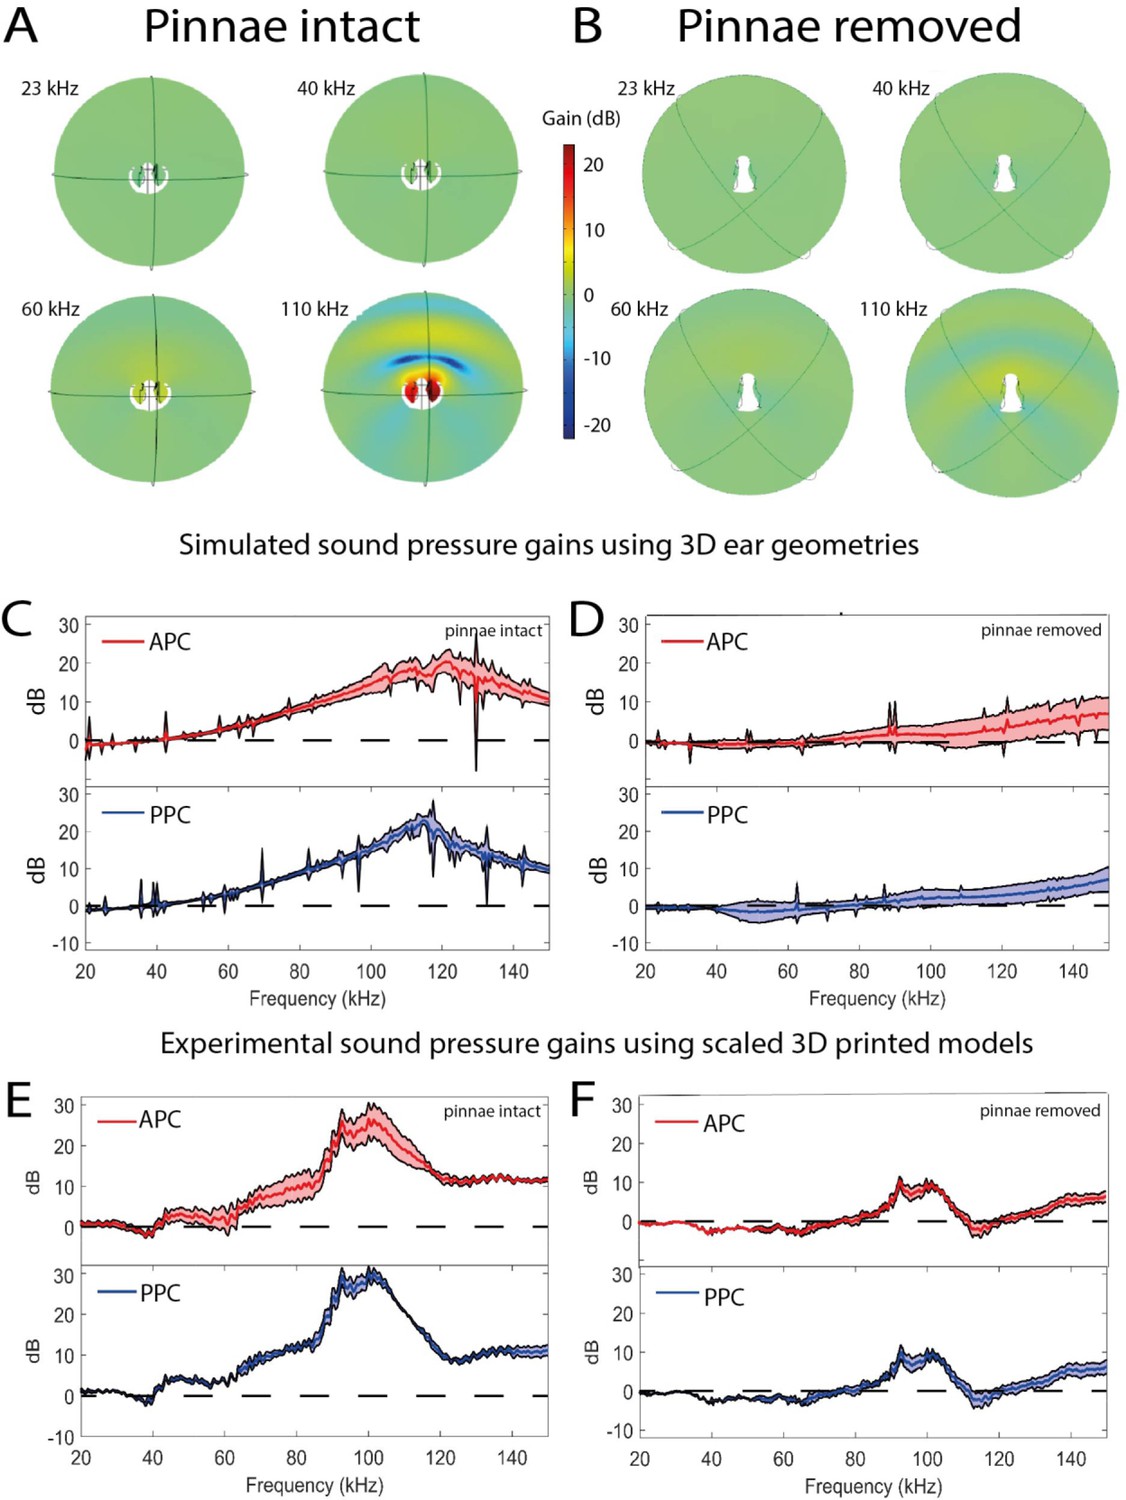
Sound pressure gains measured by numerical simulations of sound capture in the pinnal cavities (using Comsol Multiphysics) and experimentally using printed 3D-scaled ear geometries.
Panels (A), (C), and (E) depict cavity-induced sound pressure distribution and gains with pinnae, panels (B), (D), and (F) represent sound pressure gains without the pinnae. (A and B) Numerical simulations obtained on 3D ear geometries. Cross-section of the ear of Copiphora gorgonensis with the pinnae intact (A) and ablated (B). Sound pressure intensities depicted with colours for simulations of 23, 40, 60, and 110 kHz. Low sound pressure dB (blue) to high sound pressure dB (red) distributions inside and outside the cavities. (C and D) Simulated sound pressure gains (dB SPL) in the frequency ranges of 20–150 kHz for each tympanum. (E and F) Relative dB gain of the pinnal cavities in the 3D printed ears. APC in red and PPCin blue.
Figure 4—figure supplement 1
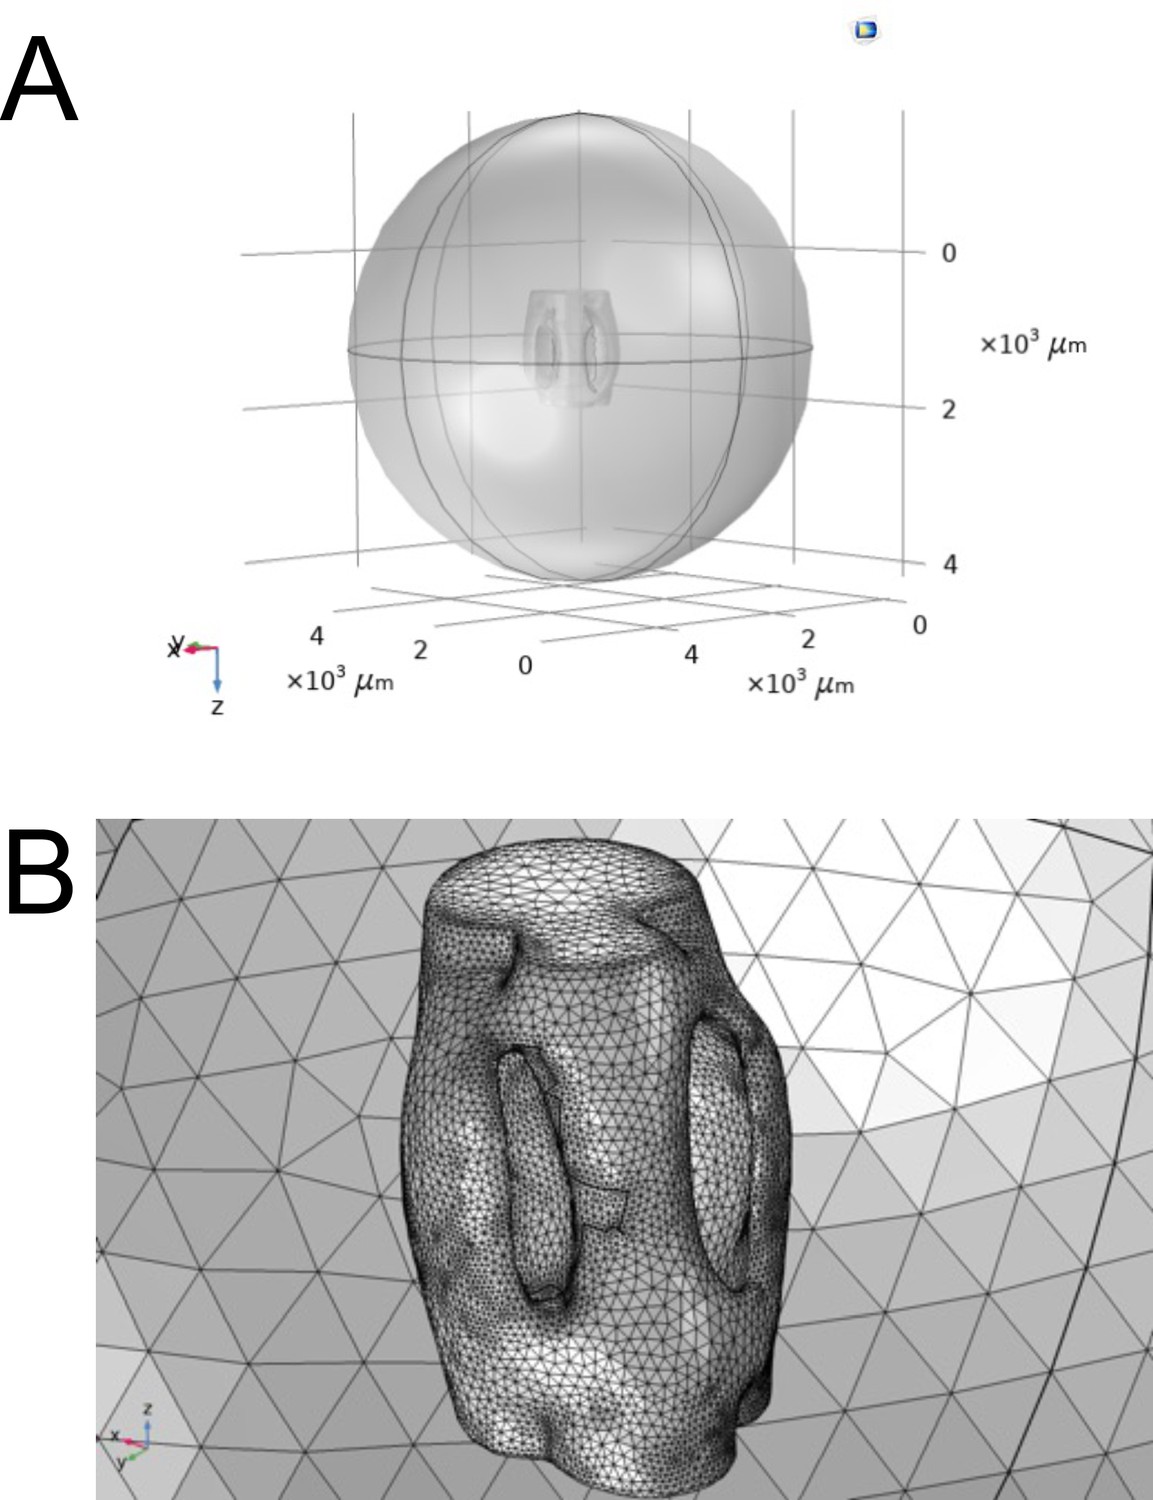
Comsol Multiphysics reconstruction of ear geometry.
(A) The air acoustic domain of a truncated sphere with a 3 mm radius centered around the reconstructed micro-CT geometry of the ear. (B) Finite element mesh sphere composed of tetrahedral elements of maximum diameter , where and enclosing 3 mm diameter ear.
Figure 5 with 1 supplement
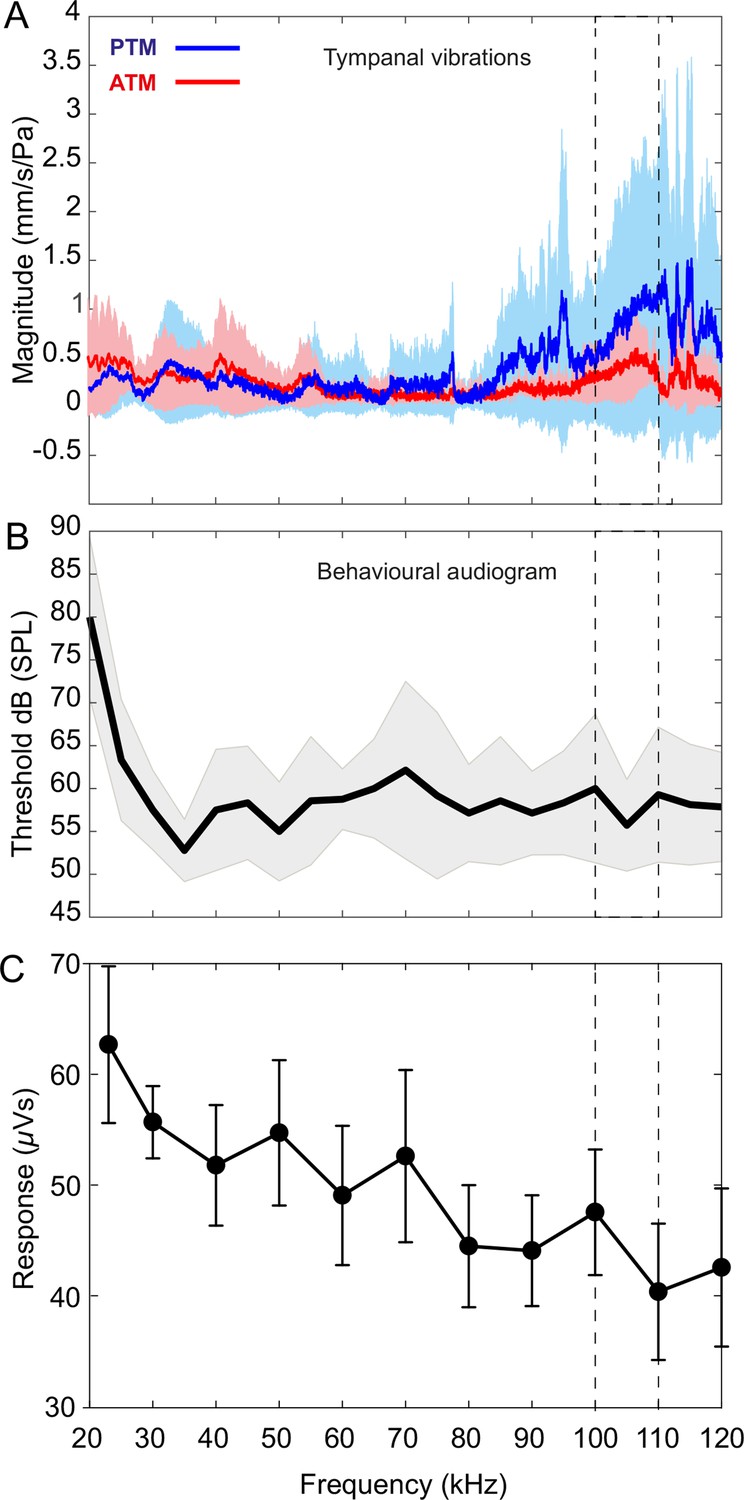
Tympanal tuning, behavioural and neural audiograms of Copiphora gorgonensis.
(A) Vibrational responses to broadband chirps (20–120 kHz) of real tympanal membranes (n = 7; 14 ears; four males and three females) of live C. gorgonensis. Maxima resonance peaks at 107.84 ± 3.74 kHz for the posterior tympanum and 111.13 ± 4.24 kHz for the anterior tympanum. Blue bar for PTM and red bar for ATM. (B) Black outline with grey shadow indicate the behavioural audiogram of ultrasound response in nine (n = 9) female C. gorgonensis. Note the drop in threshold within the pinnal frequency range (within the dotted lines) which indicates increased sensitivity. Black outline shows mean vector of SPL response at a particular frequency, shaded area represents the standard deviation across measured SPL. (C) Mean ± SEM neural responses at 70 dB across all sound frequencies tested (n = 5). Dotted lines indicate high-frequency sensitivity in each measurement, within the range of pinnal resonances.
Figure 5—figure supplement 1
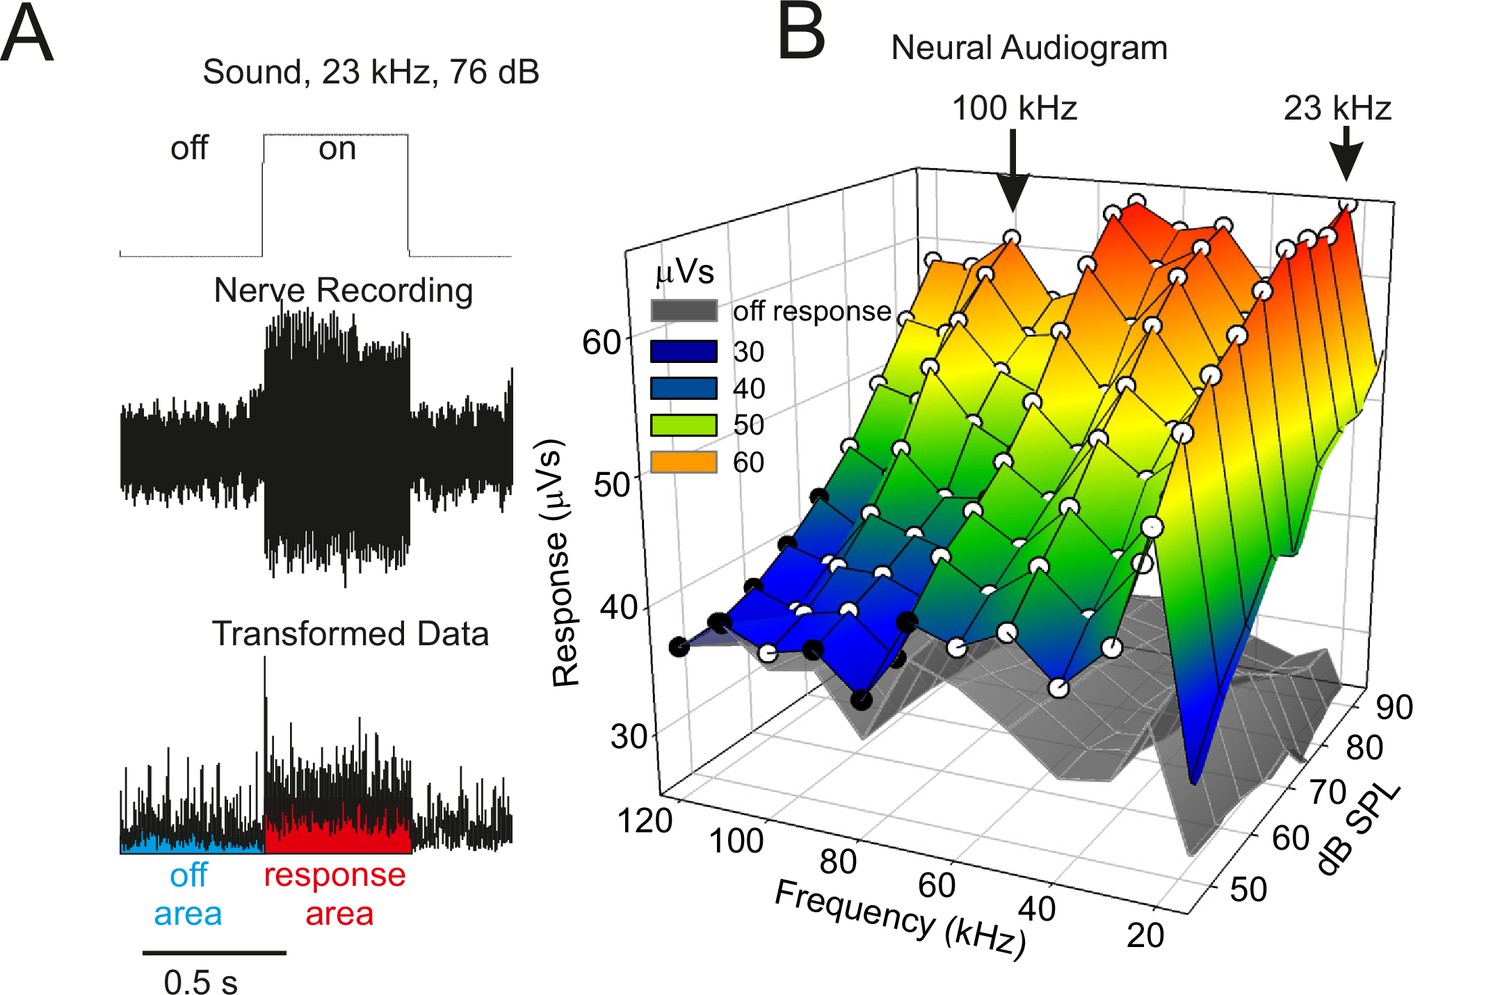
Neural audiogram showing electrical activity in extracellular recordings of the auditory nerve during sound stimulation as sound pressure intensity (dB SPL) and sound frequency (kHz) are systematically altered.
(A) Example of the neural response in the auditory nerve when a sound stimulus (top) is presented. The neural response was root-mean-square transformed (bottom) and the area under the curve during (red) and in between (blue) sound stimuli measured, giving a response in units of µVs. (B) The coloured mesh shows the mean neuronal activity during the presentation of sound, and the grey mesh the mean neuronal activity during silent inter-pulse intervals. White circular symbols indicate a significant difference (p < 0.05) in paired t-tests comparing the sound-on and sound-off responses in each katydid tested; black circular symbols indicate a non-significant difference (n = 5). A strong neuronal response was apparent across a wide range of frequencies including to calling song (23 kHz) and to the high ultrasonic frequencies used by hunting bats (e.g., 100 kHz).
Figure 6 with 1 supplement
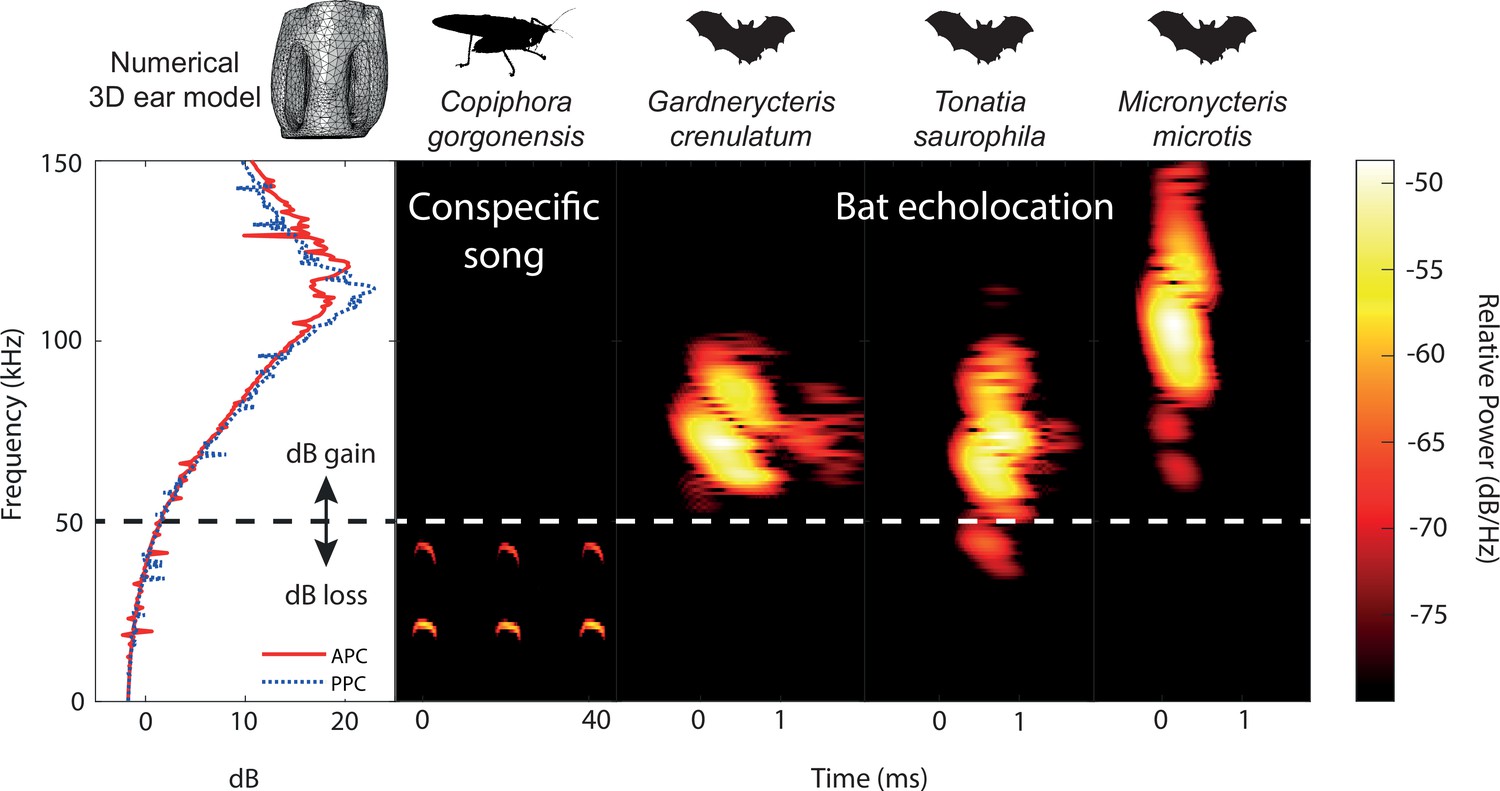
Ecological relevance of pinnae in Copiphora gorgonensis.
Numerical results of sound pressure level gains (left subpanel) induced by the pinnae are present only at frequencies above c.a. 50 kHz, covering the range of echolocation frequencies of three native insectivorous gleaning bat species. The conspecific call of C. gorgonensis (dominant frequency and harmonics) on the other hand (dBpeak at 23 kHz), is not enhanced by the presence of the pinnae (dB loss). Dotted line indicates the frequency at which gain = 0 dB. Spectrogram parameters: FFT size 512, Hamming window, 50% overlap; frequency resolution: 512 Hz, temporal resolution: 0.078ms. APC = anterior pinnal cavity, PPC = posterior pinnal cavity.
Figure 6—figure supplement 1
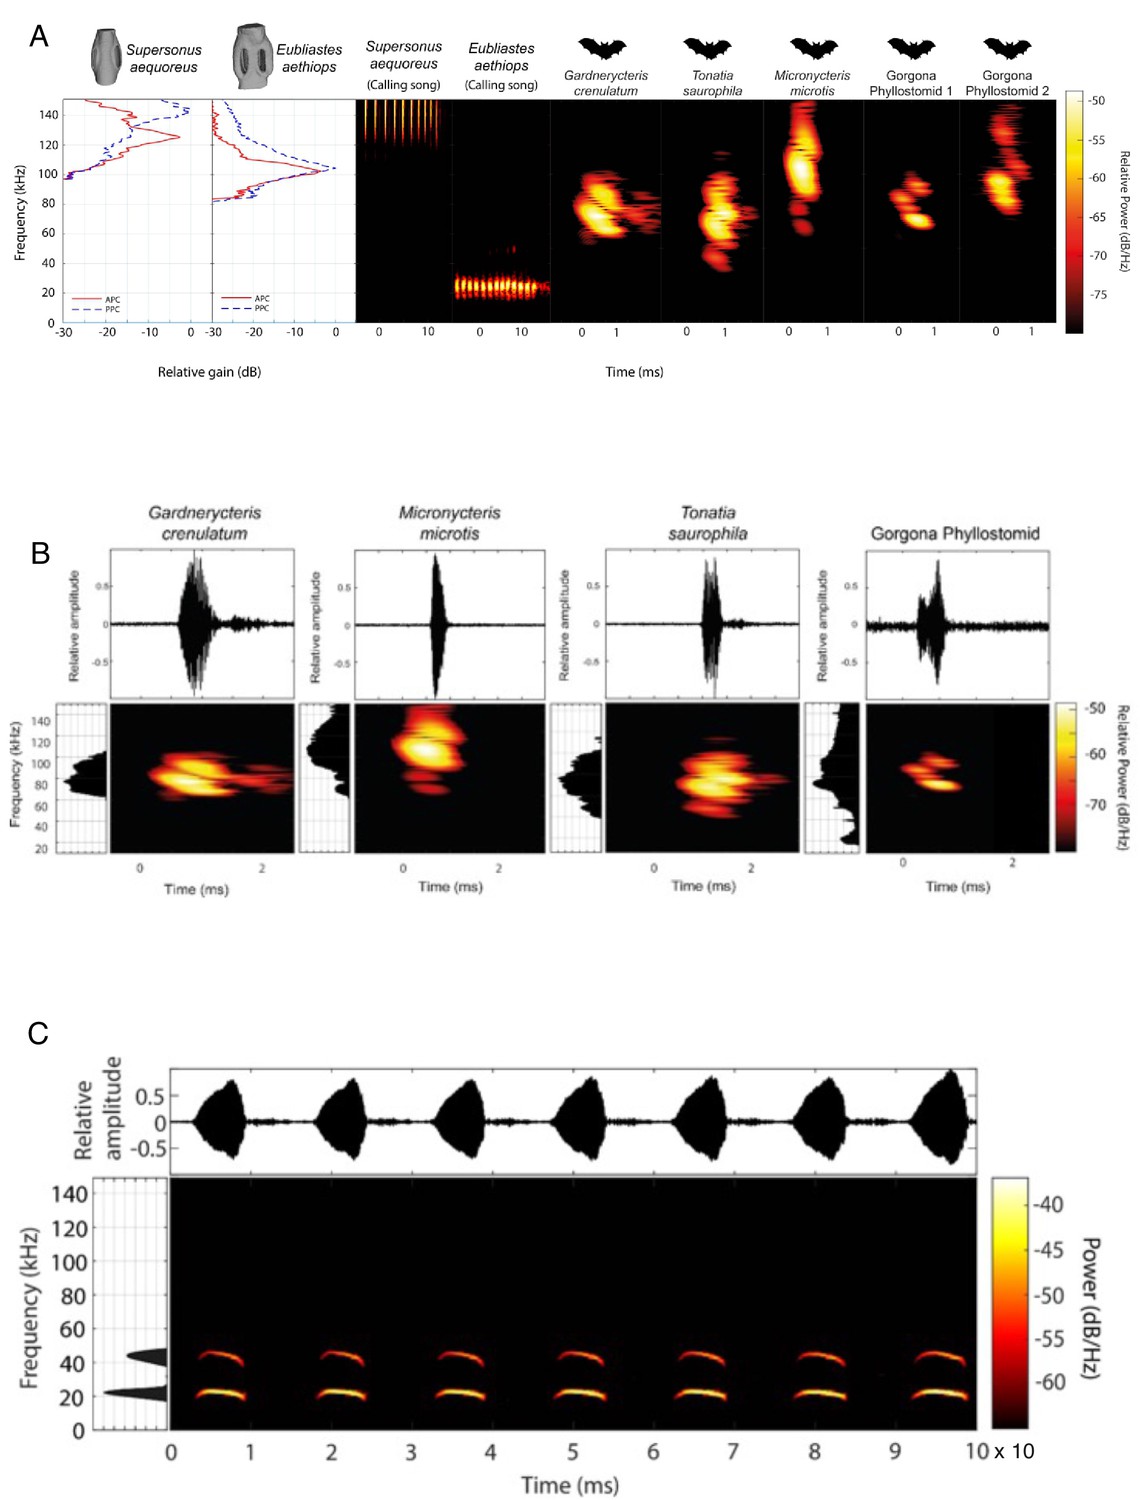
Comparison of acoustic behaviour of bats and katydids.
(A) Ecological relevance of pinnae in Supersonus aequoreus and Eubliastes aethiops. Sound pressure level gains (left) induced by the pinnae are present only at frequencies >80 kHz, covering the range of echolocation frequencies of the three native insectivorous gleaning bat species recorded for Gorgona (Murillo et al., 2014) Gorgona phyllostomid 1 and Gorgona phyllostomid 2 represent two representative bat calls recorded on the island. The conspecific call of Eubliastes aethiops is not enhanced by the pinnae (dBpeak at 22 kHz); however, Supersonus aequoreus likely uses pinnae for both conspecific calls and bat detection, if predated by bats (dBpeak at 144 kHz). Spectrogram parameters: FFT size 512, Hamming window, 50% overlap, frequency resolution: 512 Hz, temporal resolution: 0.078ms. (B). Elaborated echolocation descriptions from four (Gardnercyteris crenulaum, Micronycteris microtis, Tonatia saurophila, Gorgona phyllostomid) insectivorous phyllostomid bats (Chiroptera: Phyllostomidae). For each species, the waveform (top), frequency spectrum and FFT power spectrum (lateral to each spectrogram, 30 dB below peak shown) of a single call is presented. Spectrogram parameters: FFT size 512, Hamming window, 50% overlap, frequency resolution: 512 Hz, temporal resolution: 0.078ms. (C) Conspecific call description of male Copiphora gorgonensis. Waveform of multiple syllables within a call, showing the interval between chirps (top). Spectrogram of full signal in the same time range, and FFT power spectrum (lateral, 30 dB below peak shown). Spectrogram parameters: FFT size 512, Hamming window, 50% overlap, frequency resolution: 512 Hz, temporal resolution: 0.078ms.
Videos
Video 1
3D print ear with microphone.
Video recording of probe microphone placement inside the 3D printed ear of C. gorgonensis. A digital micromanipulator with a holder restraining the 3D printed ear moved the ear along the probe tip. The microphone remained stationary. Scaled stimuli 6.67 kHz (60 kHz).
Video 2
3D print ear with microphone receiving broadband chirp.
3D printed ear of C. gorgonensis (1:11.512) receiving a scaled broadband chirp of 2.6–17 kHz (corresponding to 30–200 kHz) as the ear is moved into position with the probe microphone inside the cavity. Gain shown in magnitude (mPa). (Note: printed ear and broadband chirp frequency range shown in video are not representative of actual experiments).
Video 3
3D print ear refractometry.
Quantitative imaging of acoustic waves using refracto-vibrometry in the field around the 3D printed ear of C. gorgonensis (Malkin et al., 2014). Screen recording software of scaled stimuli 9.63 kHz (110 kHz). Note the wave passing over the ear and the piston motion of the air inside showing the effect of the Helmholtz resonator.
Tables
Table 1
Linear mixed models (LMM) of experimental and numerical simulation data.
Parameters showing effects of angle, pinnae, frequency, tympanum, angle × pinnae and pinnae × frequency for time domain data (experimental time and displacement) and sound pressure (numerical simulations and 3D print models). Experimental models n = 13 ears. Numerical model n = 17 ears. 3D model n = 4 ears.
| Model | Parameter | F | p |
|---|---|---|---|
| Experimental Time Domain | Angle (polynomial) | 5.35 | 0.005 |
| Pinnae (Y/N) | 254.60 | <0.001 | |
| Frequency | 2097.26 | <0.001 | |
| Tympanum | 5.07 | 0.024 | |
| Angle × Pinnae | 4.47 | 0.012 | |
| Pinnae × Frequency | 31.93 | <0.001 | |
| Experimental Displacement | Angle (polynomial) | 3.29 | 0.037 |
| Pinnae (Y/N) | 0.90 | 0.344 | |
| Frequency | 270.57 | <0.001 | |
| Tympanum | 17.32 | <0.001 | |
| Angle × Pinnae | 4.89 | 0.008 | |
| Pinnae × Frequency | 5.41 | 0.004 | |
| Numerical Sound Pressure | Angle (polynomial) | 0.72 | 0.489 |
| Pinnae (Y/N) | 336.55 | <0.001 | |
| Frequency | 69.29 | <0.001 | |
| Tympanum | 0.02 | 0.879 | |
| Angle × Pinnae | 1.31 | 0.271 | |
| Pinnae × Frequency | 761.46 | <0.001 | |
| 3D Model Sound Pressure | Pinnae (Y/N) | 1175.9 | <0.001 |
| Frequency | 314.58 | <0.001 | |
| Tympanum | 0.01 | 0.9111 | |
| Pinnae × Frequency | 296.70 | <0.001 |
Table 2
Measured parameters of the ear of C. gorgonensis (n = 8 ears; 3 females, 2 males).
Given are mean values (± SD). Abbreviations: APC = anterior pinnal cavity; PPC = posterior pinnal cavity.
| APC volume (mm3) | PPC volume (mm3) | Distance between slits (mm) | Cross-sectional width of foreleg below ear (mm) | Cross-sectional width of ear (mm) | APC slit area (mm2) | PPC slit area (mm2) | Protrusion of anterior pinna (mm) | Protrusion of posterior pinna (mm) |
|---|---|---|---|---|---|---|---|---|
| 0.14 (±0.01) | 0.15 (±0.01) | 0.42 (±0.03) | 0.84 (±0.02) | 1.14 (±0.35) | 0.16 (±0.01) | 0.16 (±0.01) | 0.39 (±0.02) | 0.45 (±0.03) |
Table 3
Raw data for the behavioural audiogram of ultrasound response in nine female C. gorgonensis.
NaN denotes that no response was shown to a particular stimulus. Mean and standard deviation calculated ignoring missing data (NaN) for each frequency in the lower rows of the table. All values in dB SPL.
| ID | Frequency (kHz) | ||||||||||||||||||||
|---|---|---|---|---|---|---|---|---|---|---|---|---|---|---|---|---|---|---|---|---|---|
| 20 | 25 | 30 | 35 | 40 | 45 | 50 | 55 | 60 | 65 | 70 | 75 | 80 | 85 | 90 | 95 | 100 | 105 | 110 | 115 | 120 | |
| F1 | 90 | 55 | NaN | 50 | NaN | 55 | 50 | 50 | NaN | NaN | NaN | NaN | 55 | NaN | 55 | NaN | 50 | 50 | 55 | 50 | 60 |
| F2 | 85 | 60 | 55 | 55 | 55 | 50 | 55 | 55 | 55 | 55 | 55 | NaN | 60 | 55 | 60 | 55 | 55 | 55 | 55 | 55 | 55 |
| F3 | 80 | 60 | 60 | 60 | 60 | 60 | 60 | 60 | 60 | 60 | 60 | 60 | 60 | 60 | NaN | 60 | NaN | 60 | 60 | 55 | 60 |
| F4 | 75 | 65 | 65 | 55 | 65 | 65 | 65 | 65 | 65 | 65 | 65 | 65 | 65 | 65 | 65 | 65 | 70 | NaN | 60 | 65 | NaN |
| F5 | 60 | 70 | 50 | 50 | 70 | 70 | 50 | 70 | 60 | 70 | 70 | 55 | 50 | 70 | NaN | NaN | NaN | 55 | 75 | 50 | 70 |
| F6 | 75 | 75 | 55 | 50 | 50 | 60 | NaN | NaN | 60 | 55 | 80 | 75 | NaN | 50 | 60 | NaN | 60 | NaN | 60 | 70 | 50 |
| F7 | 80 | 70 | 60 | 50 | 55 | 55 | 50 | 60 | 55 | 55 | 50 | 50 | 50 | 50 | 50 | 65 | 65 | 55 | NaN | 60 | 55 |
| F8 | 85 | 55 | 55 | 55 | 50 | 50 | NaN | NaN | 55 | 60 | NaN | 50 | NaN | NaN | 55 | 50 | 70 | 65 | 50 | NaN | NaN |
| F9 | 90 | 60 | 60 | 50 | 55 | 60 | 55 | 50 | 60 | NaN | 55 | NaN | 60 | 60 | 55 | 55 | 50 | 50 | NaN | 60 | 55 |
| Mean | 80 | 63 | 57.5 | 53 | 57.5 | 58 | 55 | 59 | 58.8 | 60 | 62.1 | 59 | 57 | 58.6 | 57.1 | 58.3 | 60 | 56 | 59 | 58 | 58 |
| STD | 9 | 7 | 4.63 | 4 | 7.07 | 6.6 | 5.77 | 7.5 | 3.54 | 5.77 | 10.4 | 9.7 | 5.7 | 7.48 | 4.88 | 6.06 | 8.7 | 5.3 | 7.9 | 7 | 6.4 |
Additional files
Download links
A two-part list of links to download the article, or parts of the article, in various formats.
Downloads (link to download the article as PDF)
Open citations (links to open the citations from this article in various online reference manager services)
Cite this article (links to download the citations from this article in formats compatible with various reference manager tools)
Ear pinnae in a neotropical katydid (Orthoptera: Tettigoniidae) function as ultrasound guides for bat detection
eLife 11:e77628.
https://doi.org/10.7554/eLife.77628


