Measurements of damage and repair of binary health attributes in aging mice and humans reveal that robustness and resilience decrease with age, operate over broad timescales, and are affected differently by interventions
- Department of Physics, University of Toronto, Canada
- Blavatnik Institute, Department of Genetics, Paul F. Glenn Center for Biology of Aging Research at Harvard Medical School, United States
- Department of Pharmacology, Dalhousie University, Canada
- Department of Medicine (GeriatricMedicine), Dalhousie University, Canada
- Department of Physics and Atmospheric Science, Dalhousie University, Canada
Figures
Figure 1
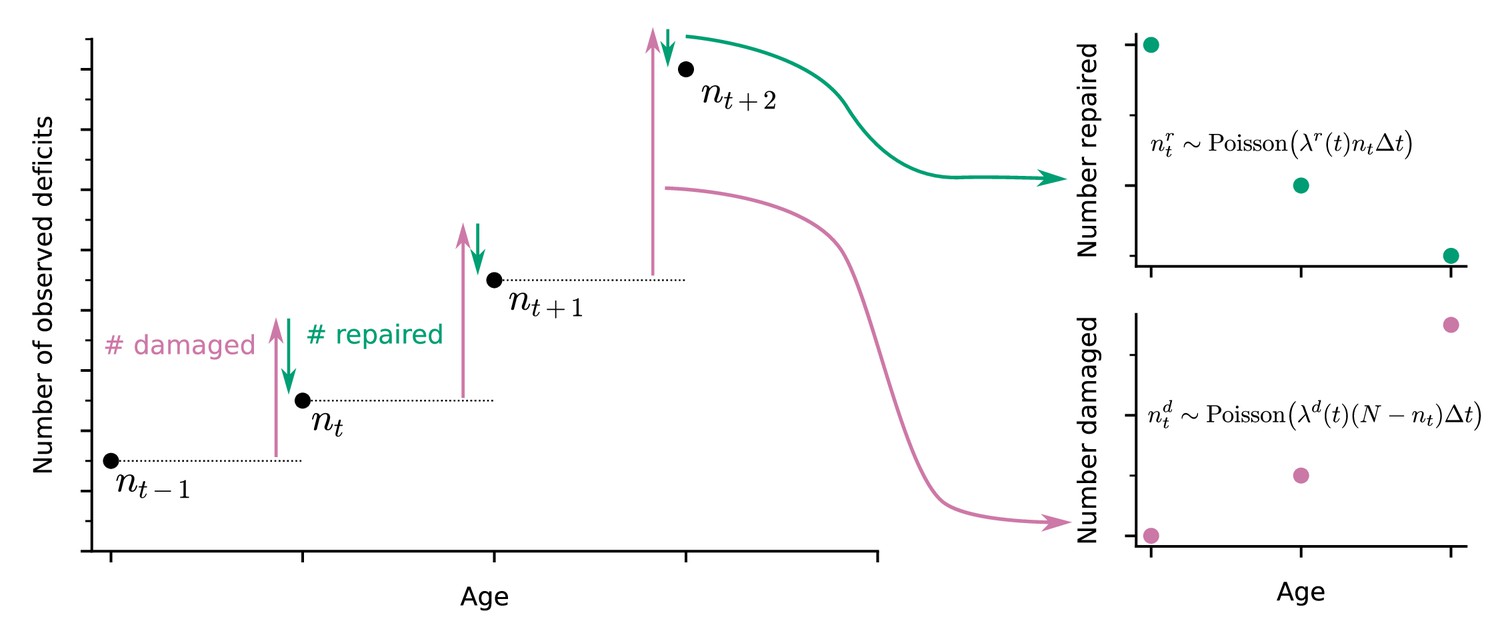
Extracting damage and repair from the longitudinal observation of binary health deficits.
Instead of just considering the Frailty Index (FI) or net count of deficits at each age nt (i.e. FI multiplied by the total number N of deficits considered) as a measure of health, we separately consider the number of deficits damaged or repaired within a time interval . Time-dependent damage and repair rates are extracted using Poisson models for the counts of repaired or damaged deficits.
Figure 2 with 2 supplements
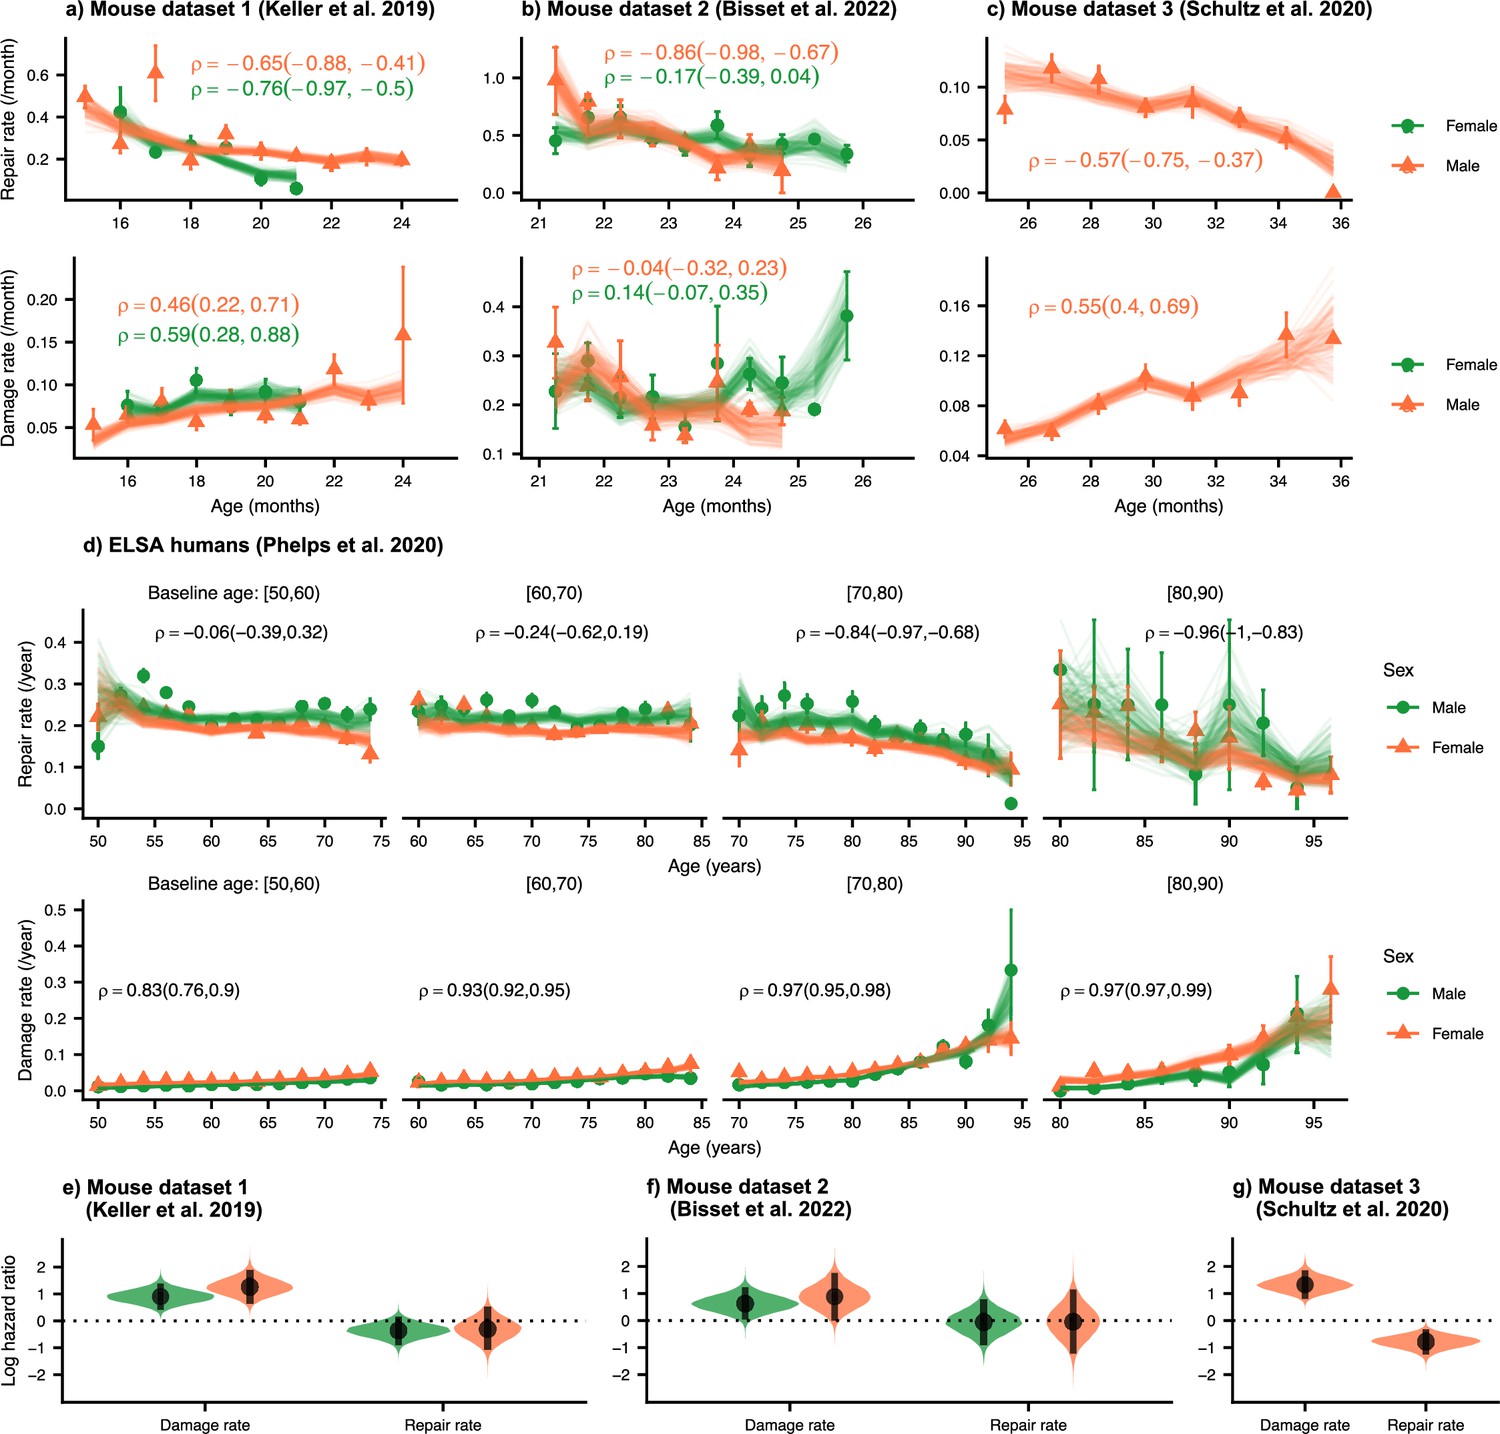
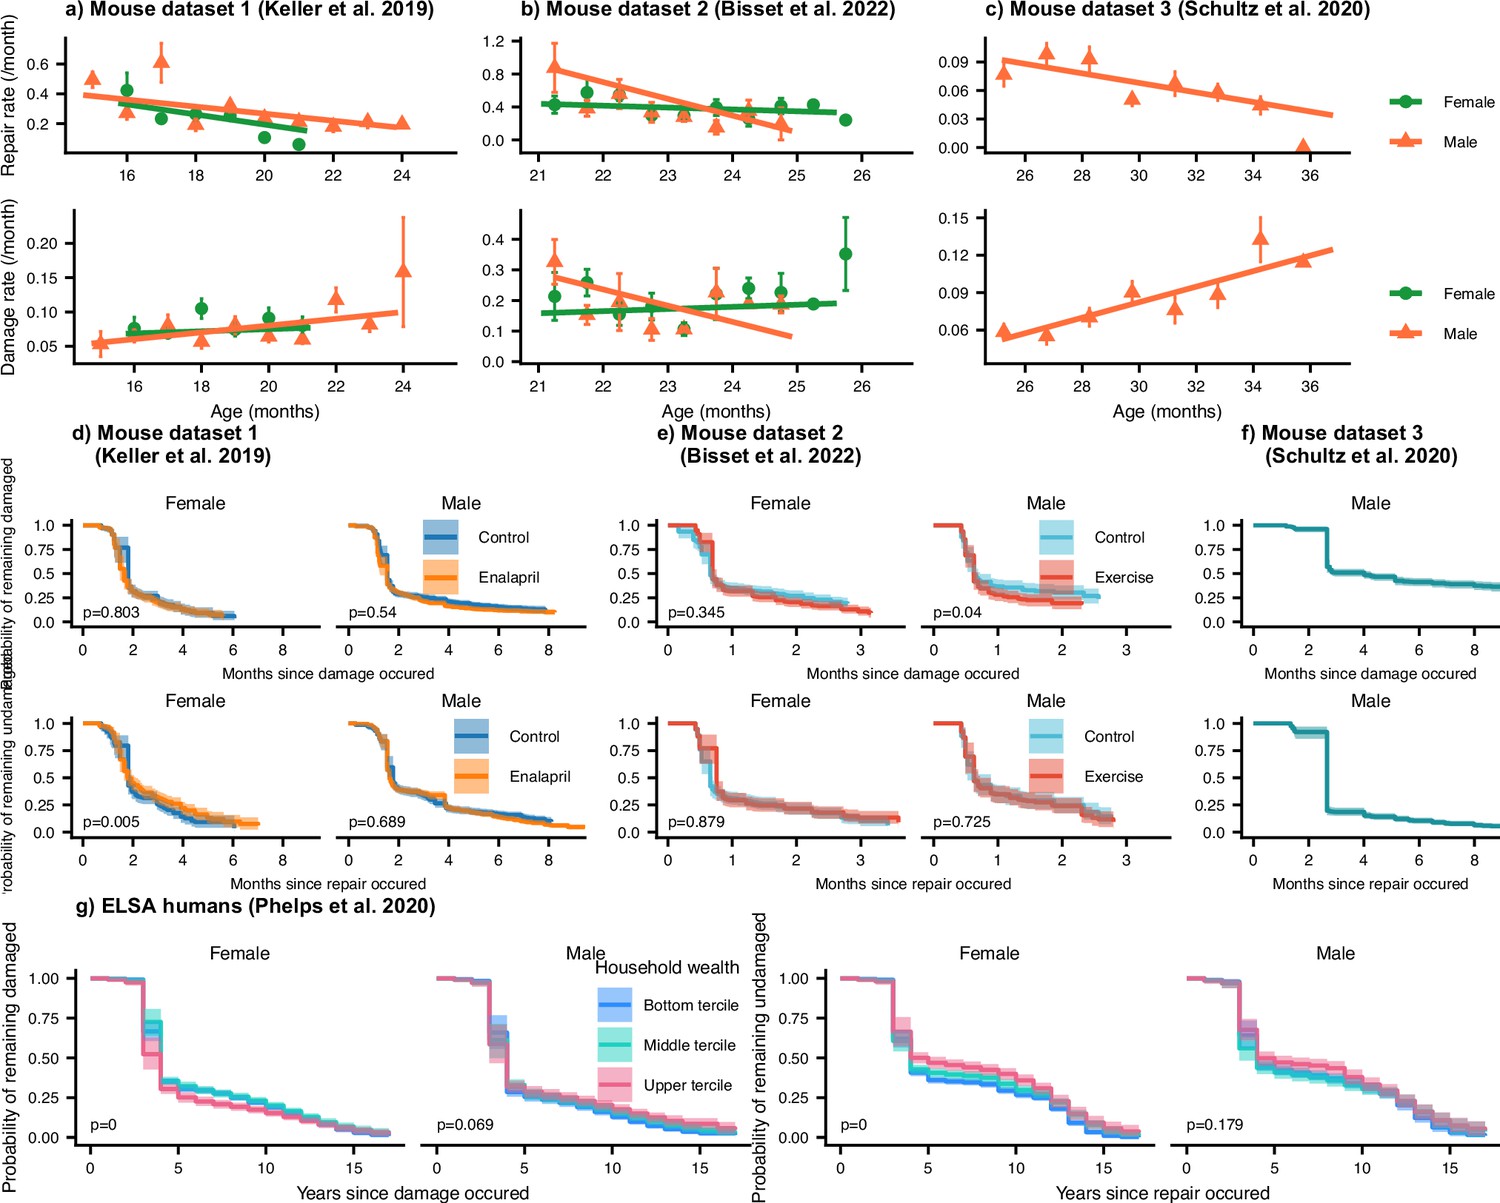
Repair rates decrease and damage rates increase with age.
Repair rates vs age (top), damage rates vs age (bottom) for (a) Mouse dataset 1 (Keller et al., 2019), (b) Mouse dataset 2 (Bisset et al., 2022), (c) Mouse dataset 3 (Schultz et al., 2020) and (d) ELSA humans (Phelps et al., 2020; Steptoe et al., 2014) plotted by decades of baseline age. Points in all plots represent binned averages of rates from the data with standard errors, and lines represent posterior samples from Bayesian models of the rates (see Methods). For each plot, the mean Spearman’s rank correlation between the rate and age is indicated by the median of the posterior and a 95% posterior credible interval in parenthesis. (e-g) Posterior distributions of log hazard ratios of death for damage and repair rates are shown as violin plots for the mouse datasets. These hazard ratios correspond to a 1 standard deviation increase in the damage or repair rates. The black interval shows a 95% credible interval around the median point.
-
Figure 2—source data 1
Data used in figure.
- https://cdn.elifesciences.org/articles/77632/elife-77632-fig2-data1-v2.zip
Figure 2—figure supplement 1
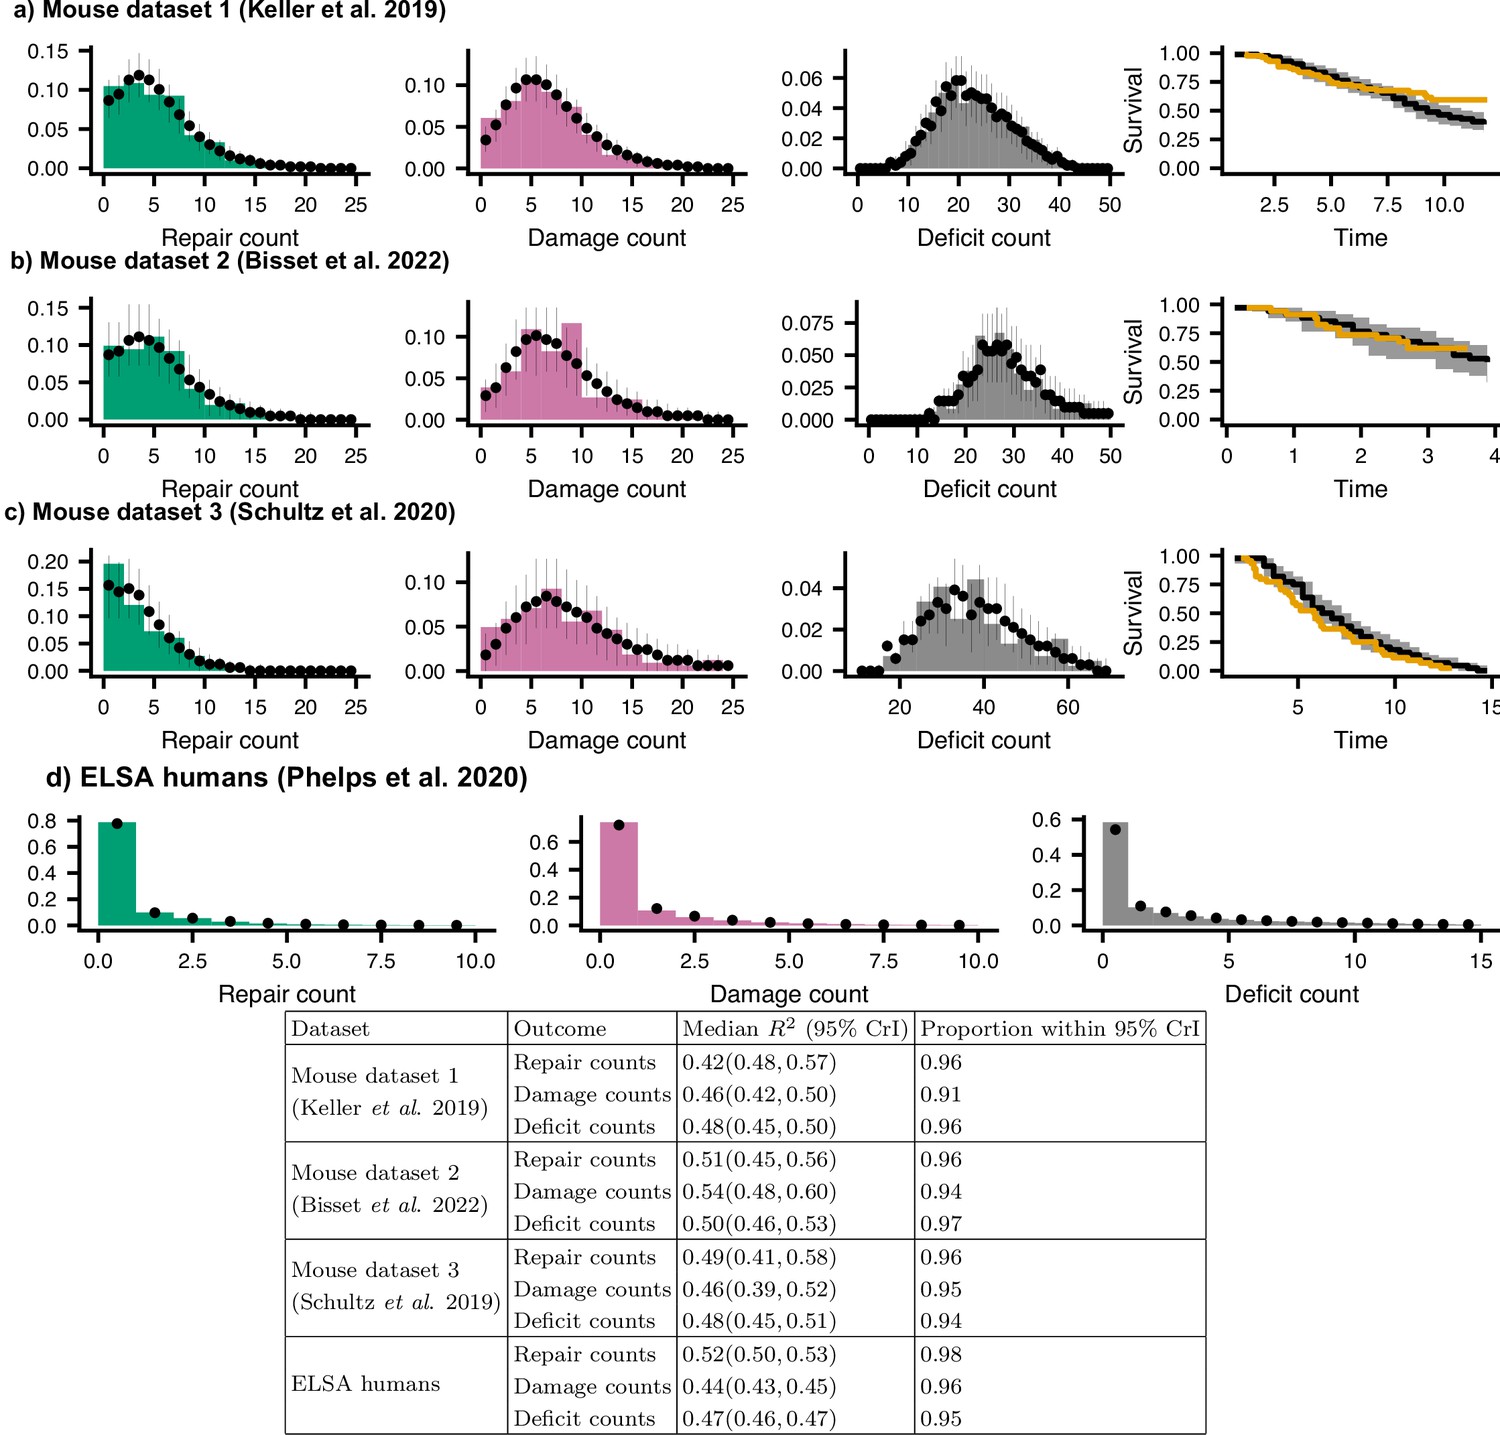
Posterior predictive check for joint models.
We compare histograms of the observed repair counts (green), damage counts (magenta), total deficit counts (grey), and survival probability (orange) with posterior samples from the model (black points, showing medians and 95% credible intervals) for (a) Mouse dataset 1 (Keller et al., 2019), (b) Mouse dataset 2 (Bisset et al., 2022), (c) Mouse dataset 3 (Schultz et al., 2020), and (d) ELSA humans (Phelps et al., 2020; Steptoe et al., 2014). These distributions show the distributions of these counts for all individuals, all time-points, and all sex and treatment groups. The table shows statistics and the proportion of posterior 95% credible intervals (CrI) for data-points where the residual includes zero (expected to be 0.95). These tests show that the models accurately represent the observed data.
-
Figure 2—figure supplement 1—source data 1
Data used in figure.
- https://cdn.elifesciences.org/articles/77632/elife-77632-fig2-figsupp1-data1-v2.zip
Figure 2—figure supplement 2

Increase in Frailty Index in mice and humans.
The increase in the Frailty Index with age for (a) Mouse dataset 1, (b) Mouse dataset 2, (c) Mouse dataset 3, and (d) ELSA human dataset. We observe higher FI for females (green) than males (orange) for both mice and humans.
-
Figure 2—figure supplement 2—source data 1
Data used in figure.
- https://cdn.elifesciences.org/articles/77632/elife-77632-fig2-figsupp2-data1-v2.zip
Figure 3 with 1 supplement
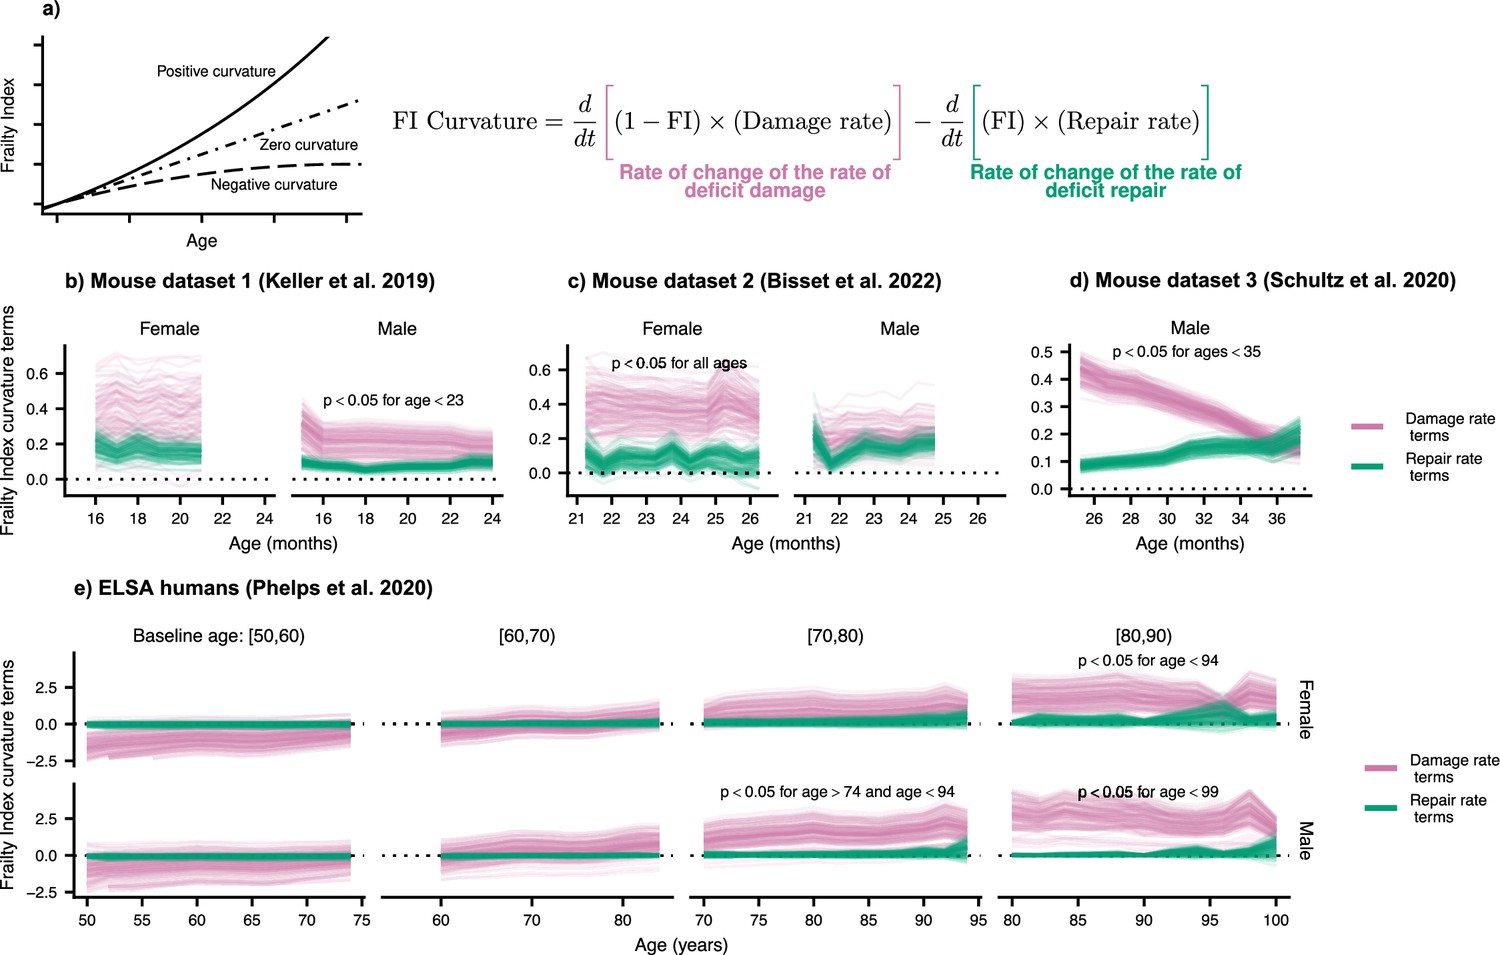
Frailty Index curvature is dominated by declining robustness.
(a) Frailty Index curvature measures the rate of accumulation of damage. Positive curvature indicates an acceleration of damage accumulation, zero curvature indicates a constant accumulation of damage, and negative curvature indicates a decelerating accumulation of damage. Curvature is computed with the second time-derivative of the Frailty Index (Methods Equation 22). Terms of the curvature involving the repair rate (green) and the damage rate (pink) are separately shown. Lines represent posterior samples from our Bayesian models for (b) Mouse dataset 1 (Keller et al., 2019), (c) Mouse dataset 2 (Bisset et al., 2022), (d) Mouse dataset 3 (Schultz et al., 2020) and (e) ELSA humans (Phelps et al., 2020; Steptoe et al., 2014), plotted separately by decades of baseline age. On all plots, we indicate for which ages the proportion of the posterior for the difference in these terms that is negative is below 0.05; the Bayesian analogue of a p-value testing the contributions of robustness and resilience.
-
Figure 3—source data 1
Data used in figure.
- https://cdn.elifesciences.org/articles/77632/elife-77632-fig3-data1-v2.zip
Figure 3—figure supplement 1
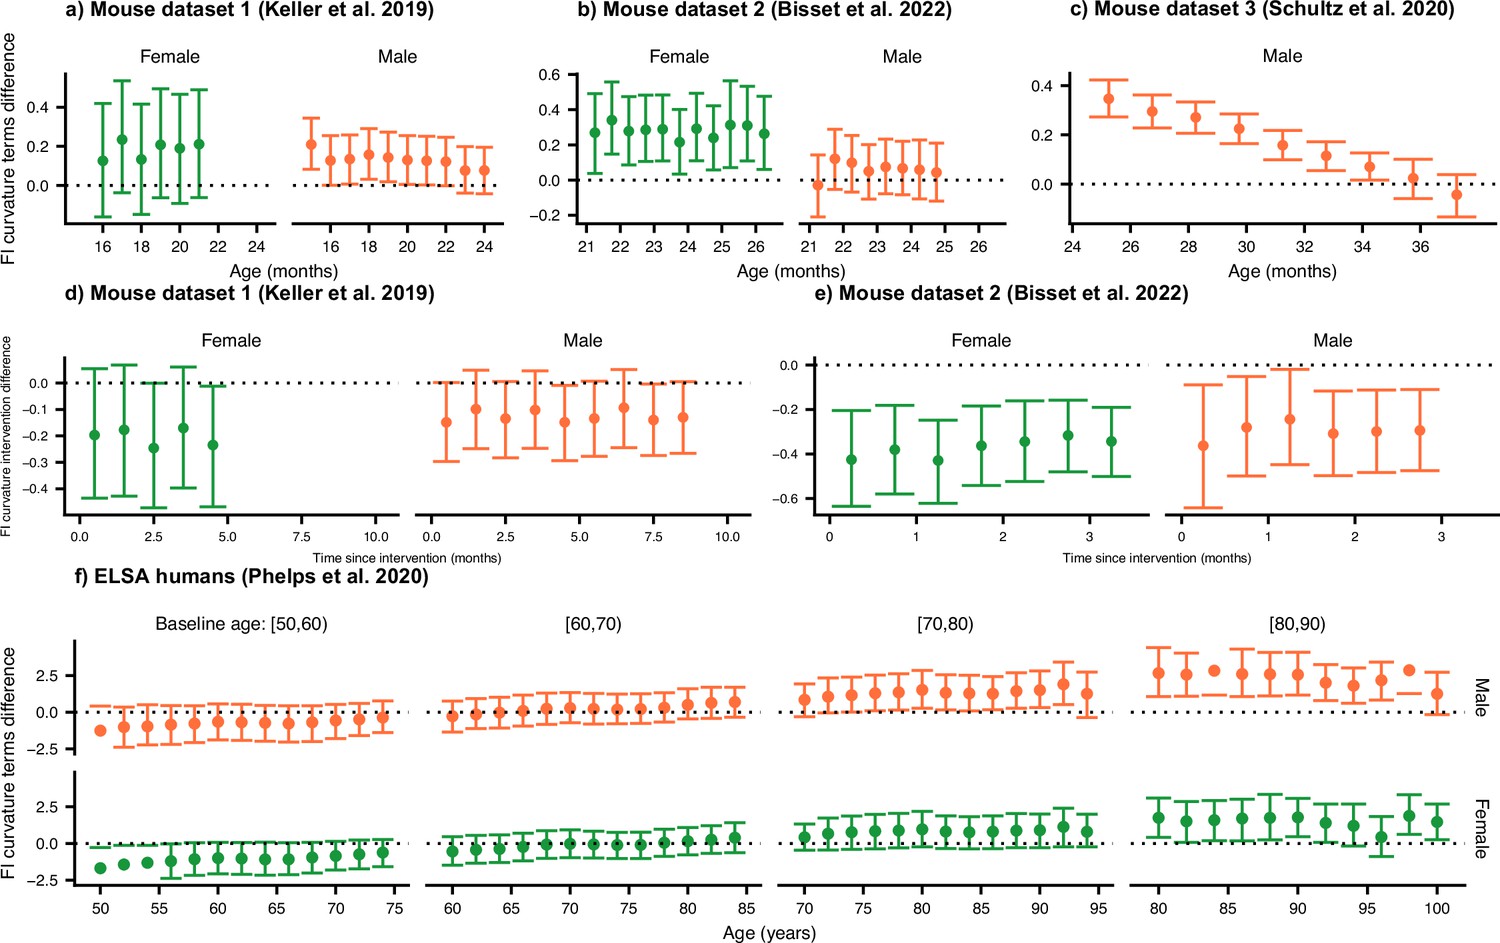
Testing the effect of robustness, resilience, and interventions on curvature.
We compute the posterior distribution mean difference between the curvature terms involving damage rates and repair rates for the control. Here we show the median of the posterior (points) with 95% credible intervals for the control groups for mouse datasets (a) 1, (b) 2, and (c) 3. For credible intervals above zero, the effect of the damage rate on the curvature is considered significant at the 95% level. In (d and e), we show test the effect of enalapril and exercise on the curvature, showing that exercise strongly reduces curvature. (f) We compute the posterior distribution mean difference between the curvature terms involving damage rates and repair rates for humans.
-
Figure 3—figure supplement 1—source data 1
Data used in figure.
- https://cdn.elifesciences.org/articles/77632/elife-77632-fig3-figsupp1-data1-v2.zip
Figure 4 with 2 supplements

Interventions both increase resilience and decrease damage.
(a, b) The effect of enalapril and exercise on Frailty Index curvature for mice for mouse datasets 1 and 2. 95% credible intervals for these curvatures are shown by errorbars around the median (point). Asterisks (*) indicate credible intervals for the difference between intervention and control fully exclude zero. (c ,d) Repair rates and damage rates time-slopes vs time since intervention for the effect of enalapril and exercise for mouse datasets 1 and 2. 95% credible intervals for these curvatures are shown by errorbars around the median (point). Asterisks (*) indicate credible intervals for the difference between intervention and control fully exclude zero. (e) Spearman rank correlation between wealth and repair rate (green) and damage rate (pink), vs age for ELSA humans. Individuals are separated by decades of baseline age, and 95% credible intervals for these correlations are shown as coloured regions around the median (thick line). We restrict this plot to ages with at least 3 individuals.
-
Figure 4—source data 1
Data used in figure.
- https://cdn.elifesciences.org/articles/77632/elife-77632-fig4-data1-v2.zip
Figure 4—figure supplement 1
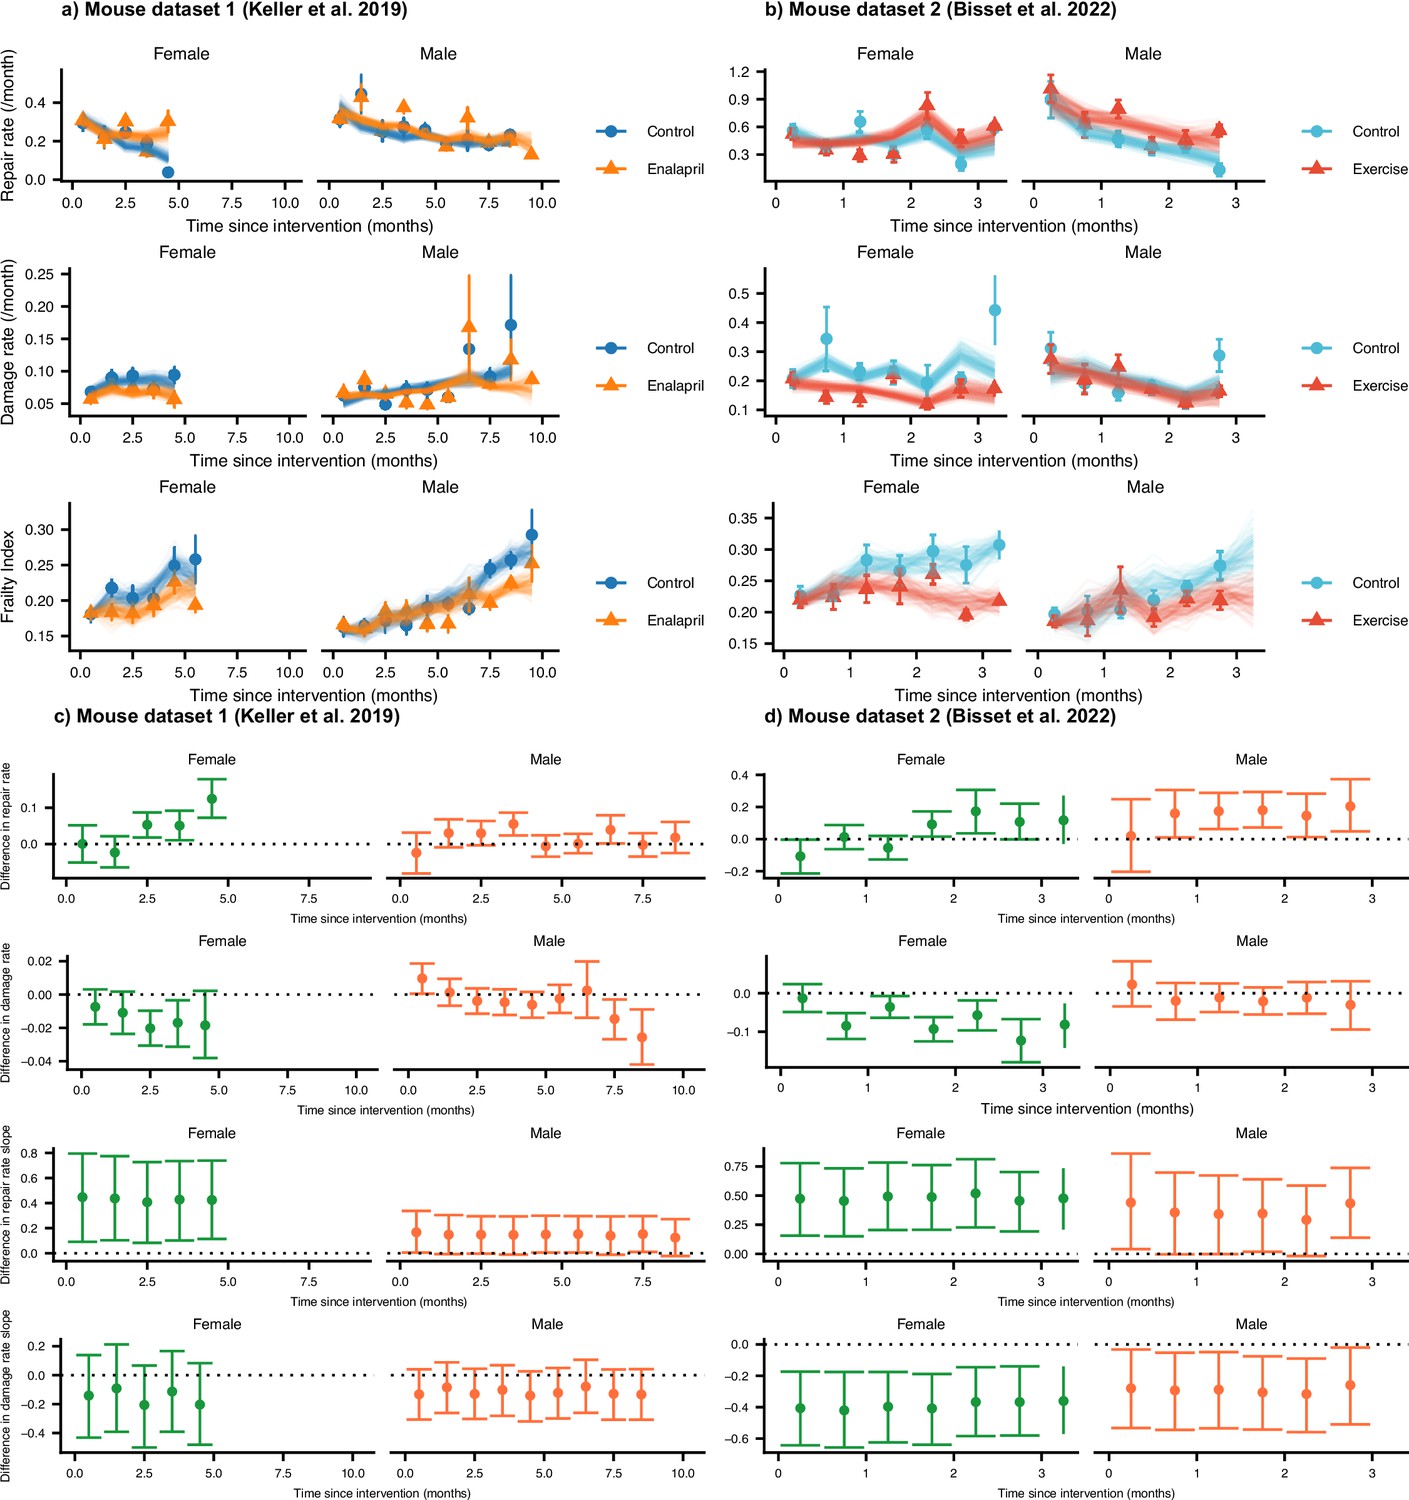
The effect of interventions on repair, damage, and Frailty Index in mice.
(a) Repair rates, damage rates, and Frailty Index vs age for control mice and mice treated with enalapril from Keller et al., 2019. (b) Repair rates, damage rates, and Frailty Index vs age for control mice and mice with voluntary exercise from Bisset et al., 2022. Both enalapril and exercise impact repair and damage rates, leading to a lower Frailty Index. These plots show binned averages of the rates of Frailty Index as the points with standard errors, overlayed with posterior samples from the models. In (c and d), we test the difference between intervention and control groups for repair rates, damage rates, repair rate time slopes, and damage rate time slopes by showing the posterior median and 95% credible intervals. Intervals that don’t cross zero are considered significant at the 95% level.
-
Figure 4—figure supplement 1—source data 1
Data used in figure.
- https://cdn.elifesciences.org/articles/77632/elife-77632-fig4-figsupp1-data1-v2.zip
Figure 4—figure supplement 2
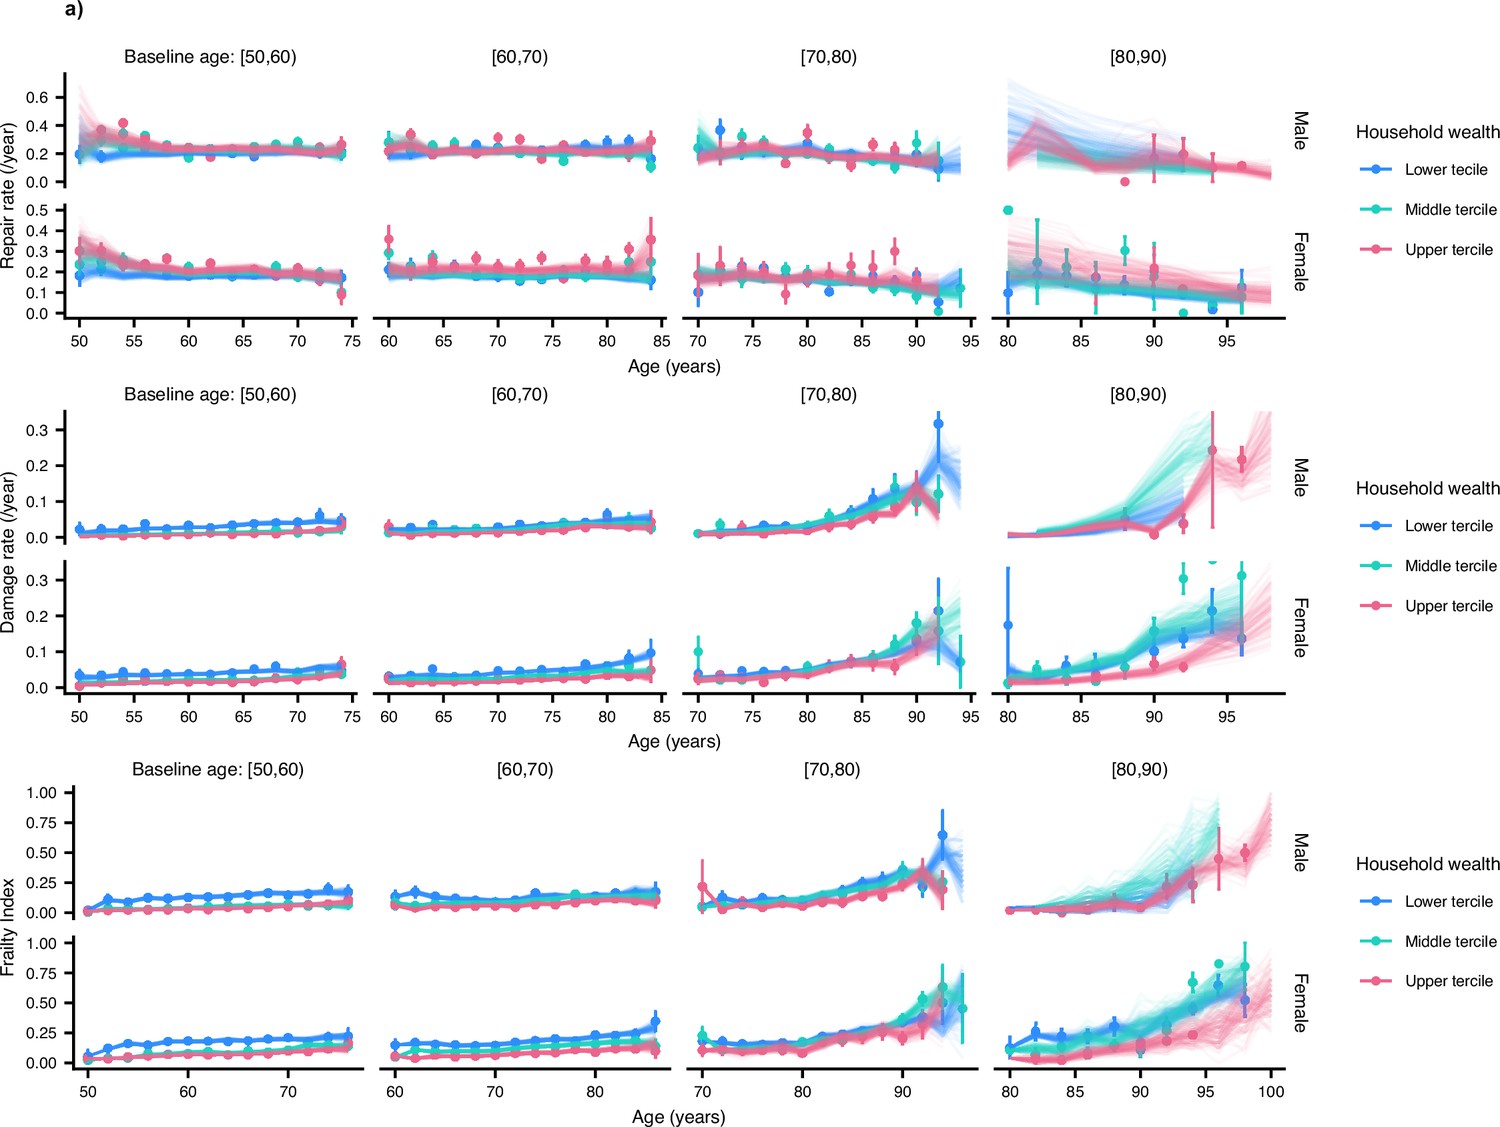
Humans stratified by terciles of household wealth.
Repair rate, damage rate and Frailty Index vs age for ELSA humans (Phelps et al., 2020; Steptoe et al., 2014) are shown, stratified by terciles of net household wealth. These plots show binned averages of the rates of Frailty Index as the points with standard errors, overlayed with posterior samples from the models. The lowest tercile exhibits lower repair rates and higher damage rates for younger ages.
-
Figure 4—figure supplement 2—source data 1
Data used in figure.
- https://cdn.elifesciences.org/articles/77632/elife-77632-fig4-figsupp2-data1-v2.zip
Figure 5 with 4 supplements
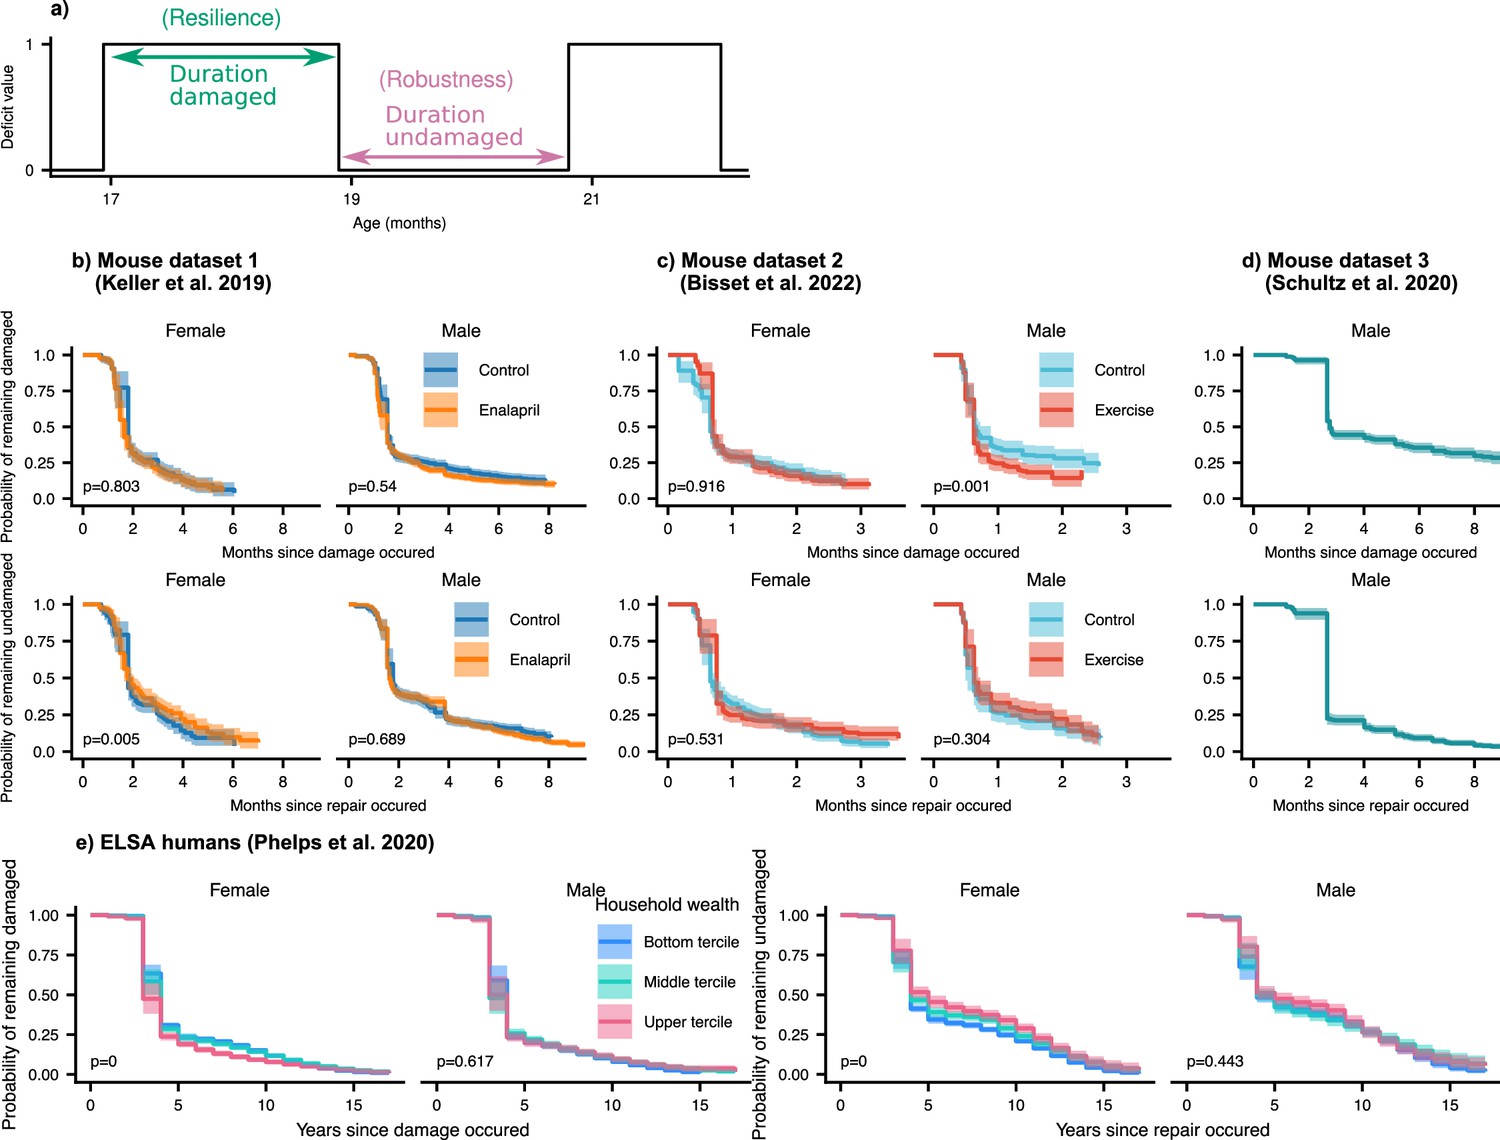
Resilience and robustness occur over both short and long time-scales in both mice and humans.
(a) The time-scale of resilience is measured as the lifetime of the damaged state. The time-scale of robustness is measured as the lifetime of the undamaged state. Deficit state-survival curves, showing the probability of remaining in the current damaged or undamaged state since time of transition, are shown for (b) Mouse dataset 1, (c) Mouse dataset 2, (d) Mouse dataset 3, and (e) ELSA human dataset. The shaded regions are 95% posterior credible intervals. p-Values are shown on the lower left of each plot for generalized log-rank tests for the equality of the survival functions between the intervention or wealth groups (Zhao et al., 2008 and Zhaeo, 2012).
-
Figure 5—source data 1
Data used in figure.
- https://cdn.elifesciences.org/articles/77632/elife-77632-fig5-data1-v2.zip
Figure 5—figure supplement 1
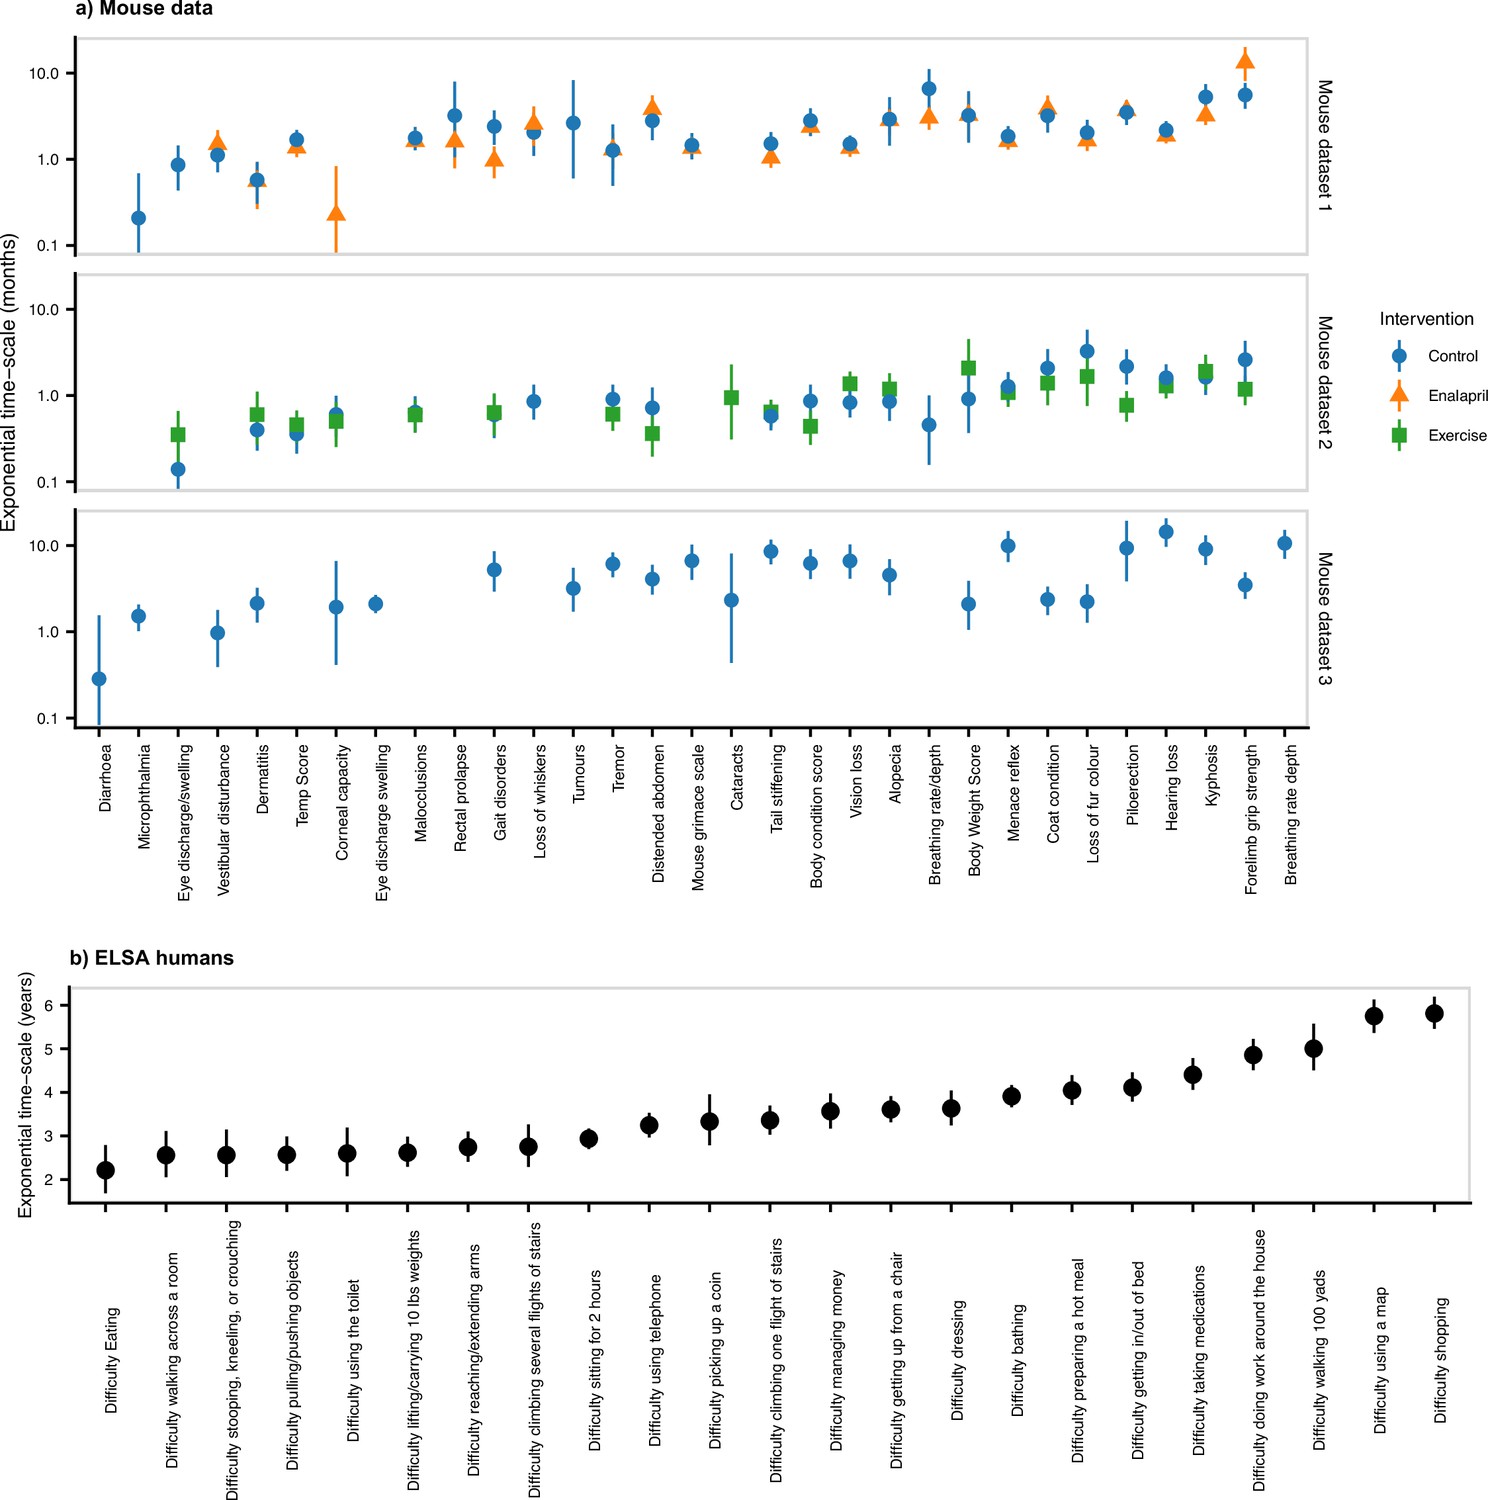
Time-scales of resilience for individual deficits.
Exponential time-scales for damaged state survival curves. Exponential survival models are fit for the survival of the damaged state for each binary health variable. Time-scales are computed as the inverse of the exponential rate, and the posterior median is shown as a point, with a 95% credible interval. This is shown for (a) mouse datasets 1, 2, and 3, and (b) the ELSA human data. Variables are sorted by the ascending mean-timescale over all datasets. We see that there is a broad range of time-scales.
Figure 5—figure supplement 2

Time-scales of robustness for individual deficits.
Exponential time-scales for undamaged state survival curves. Exponential time-scales for undamaged state survival curves. Exponential survival models are fit for the survival of the undamaged state for each binary health variable. Time-scales are computed as the inverse of the exponential rate, and the posterior median is shown as a point, with a 95% credible interval. This is shown for (a) mouse datasets 1, 2, and 3, and (b) the ELSA human data. Variables are sorted by the ascending mean-timescale over all datasets. We see that there is a broad range of time-scales.
-
Figure 5—figure supplement 2—source data 1
Data used in figure.
- https://cdn.elifesciences.org/articles/77632/elife-77632-fig5-figsupp2-data1-v2.zip
Figure 5—figure supplement 3
Sensitivity analysis of damage/repair.
We do a sensitivity analysis by pruning isolated damage/repair events that may be due to an error in measurement or a data entry error, i.e. deficit time series becomes and becomes . In (a-c) we show that removing these isolated events does not significantly change the temporal evolution of repair rates and damage rates. In (d-g) we show that the time-scales of resilience and robustness are also not significantly changed for all 3 mouse datasets and the human dataset.
-
Figure 5—figure supplement 3—source data 1
Data used in figure.
- https://cdn.elifesciences.org/articles/77632/elife-77632-fig5-figsupp3-data1-v2.zip
Figure 5—figure supplement 4

Sensitivity analysis of damage/repair.
We do a sensitivity analysis by pruning isolated damage/repair events that may be due to an error in measurement or a data entry error, that is deficit time series becomes and becomes . In (a-d) we show the number of damage/repair events removed, and for which deficits they occurred. The total number events removed is low, explaining the limited effect these have on our results. In (e-h) we show the total number of repair events, observing small number of repair events for deficits like ‘tumors’ and ‘cataracts’. The number total of repair events is much larger than the number pruned.
-
Figure 5—figure supplement 4—source data 1
Data used in figure.
- https://cdn.elifesciences.org/articles/77632/elife-77632-fig5-figsupp4-data1-v2.zip
Additional files
-
Supplementary file 1
Evidence for deficits that can reverse.
- https://cdn.elifesciences.org/articles/77632/elife-77632-supp1-v2.docx
-
Transparent reporting form
- https://cdn.elifesciences.org/articles/77632/elife-77632-transrepform1-v2.pdf
Download links
A two-part list of links to download the article, or parts of the article, in various formats.
Downloads (link to download the article as PDF)
Open citations (links to open the citations from this article in various online reference manager services)
Cite this article (links to download the citations from this article in formats compatible with various reference manager tools)
Measurements of damage and repair of binary health attributes in aging mice and humans reveal that robustness and resilience decrease with age, operate over broad timescales, and are affected differently by interventions
eLife 11:e77632.
https://doi.org/10.7554/eLife.77632


