The influence of biological, epidemiological, and treatment factors on the establishment and spread of drug-resistant Plasmodium falciparum
- Swiss Tropical and Public Health Institute, Switzerland
- University of Basel, Switzerland
- Liverpool School of Tropical Medicine, United Kingdom
Figures
Figure 1
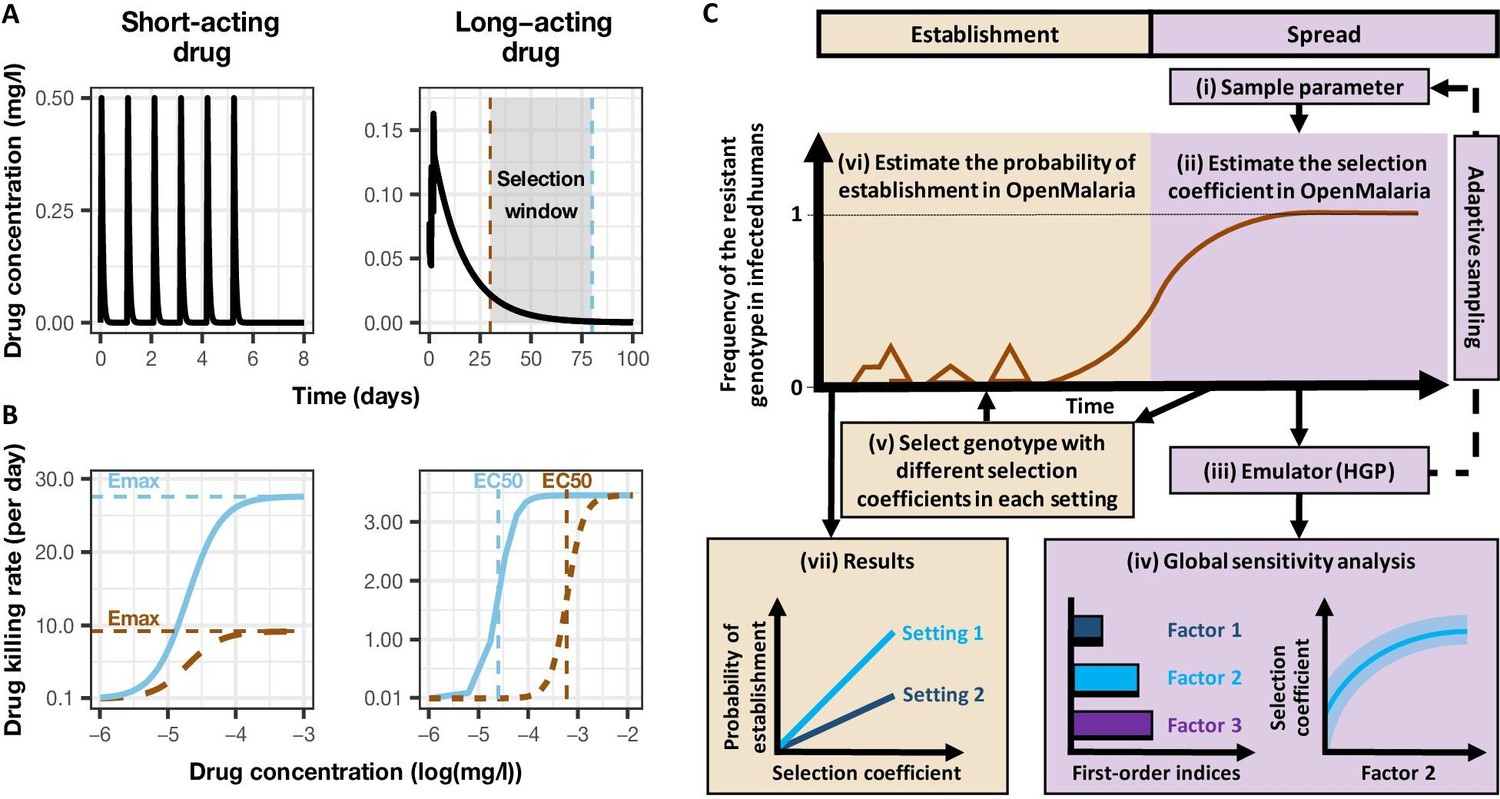
Overview of treatment profiles and the modelling workflow.
(A) Examples of the modelled within-host concentration (mg/l) of both the short- and long-acting drugs used as monotherapy. Here, patients received a daily dose of the short-acting drug for 6 days or a daily dose of the long-acting drug for 3 days. The grey shaded area represents an exemplar selection window (defined as the period of time post-treatment when drug concentration is sufficiently high to prevent reinfection by drug-sensitive infections but is sufficiently low to allow reinfection by drug-resistant infections). The short- and long-acting drugs used in combination (like ACTs) had the same respective profile as in monotherapy, but patients received a daily dosage of each drug over 3 days, as recommended by WHO for ACTs (WHO, 2021). (B) Illustrations of the modelled relationship between the concentration (log[mg/l]) and the killing effect (per day) of the short- and long-acting drugs on the resistant (brown dashed curve) and sensitive genotypes (solid blue curve). Compared with sensitive genotypes, resistant parasites had a reduced maximum killing rate (Emax) when resistant to the short-acting drug and an increased half-maximal effective concentration (EC50) when resistant to the long-acting drug. (C) Schematic of the modelling workflow: central plot, brown curve represents an exemplar frequency of the resistant genotype in infected humans. The purple area (right side) shows the steps for assessing the influence of factors on the rate of spread (selection coefficient) of a resistant genotype through global sensitivity analysis of an emulator trained on our model simulations (see Materials and methods). In brief: (i) randomly sampling combinations of parameters, (ii) assessing the rate of spread of the resistant genotype for each parameter combination, (iii) training an emulator to learn the relationship between the input (for the different drivers) and output (the rate of spread) with iterative improvements to fitting through adaptive sampling, (iv) performing the global sensitivity using the trained emulator. The global sensitivity analysis estimates both first-order indices of each factor (representing their influence on the rate of spread) and the 25th, 50th, and 75th quantiles of the estimated selection coefficient from the emulator across each parameter range. The orange area (left side) shows the steps to assess the relationship between the selection coefficient and the probability of establishment in different transmission settings (see Materials and methods). In brief: (v) selecting genotypes with different selection coefficients in each setting, (vi) assessing their probability of establishment, and (vii) visualising the relationship between the probability of establishment and the section coefficient in each setting. HGP: Heteroskedastic Gaussian Process.
Figure 2 with 1 supplement
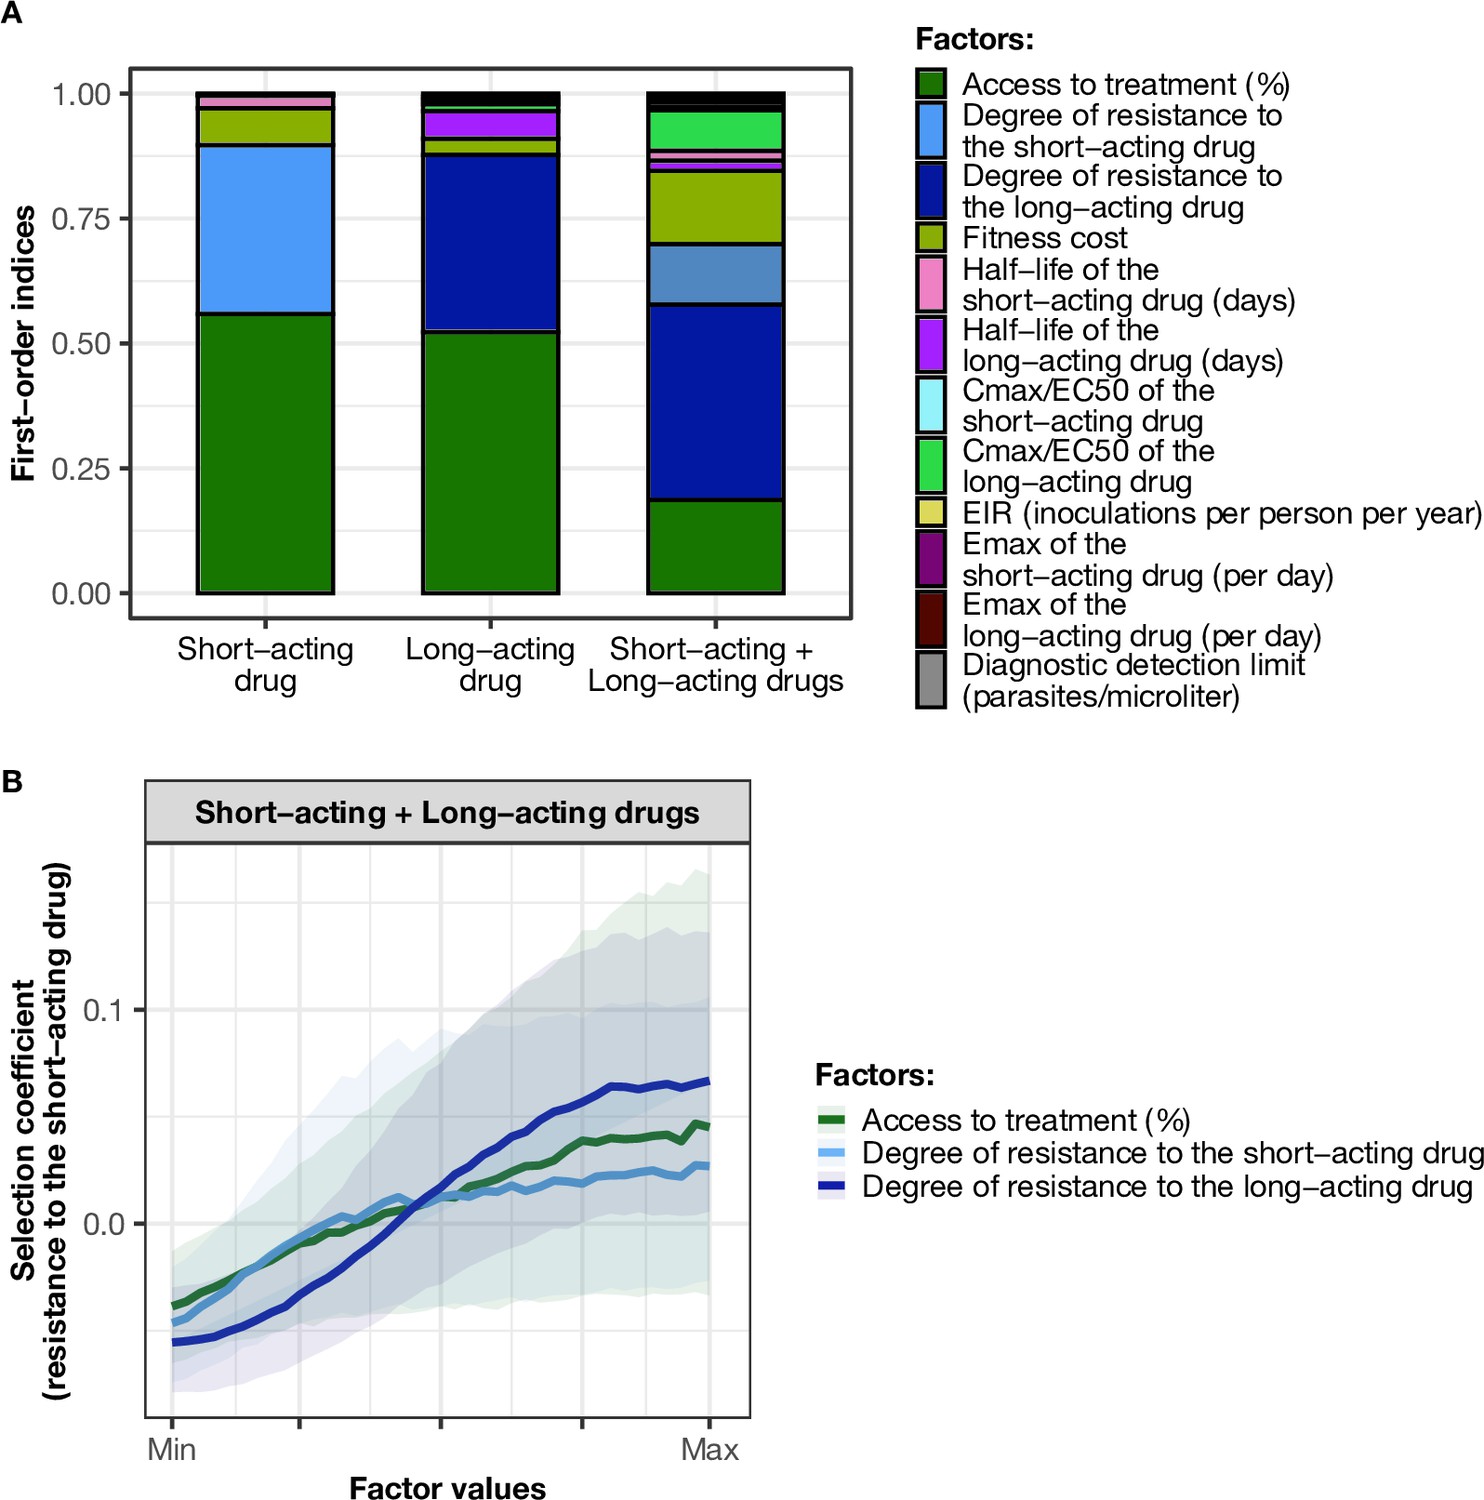
Influence of drug properties, fitness costs, degrees of resistance, transmission levels, and health system factors on estimated selection coefficients for three treatment profiles.
(A) The first-order indices from our variance decomposition analysis indicate the level of importance of drug properties, fitness costs, degrees of resistance, transmission levels, access to treatment, and diagnostic limits in determining the spread of drug resistance. Indices are shown for each treatment profile in a non-seasonal setting with a population fully adherent to treatment. Selection coefficients are considered for the short-acting drug and the long-acting drug when each drug is used as monotherapy and for the short-acting drug when both drugs are used in combination. Definitions and ranges of parameters investigated are listed in Table 1. (B) Influence of factors on the selection coefficient of genotypes resistant to the short-acting drug in a population that used the short-acting and the long-acting drugs in combination. Curves and shaded areas represent the median and interquartile range of selection coefficients estimated during the global sensitivity analyses over the following parameter ranges: access to treatment (10–80%); the degree of resistance of the resistant genotype to the short-acting drug (1–50-fold reduction in Emax); and the degree of resistance of both sensitive and resistant genotypes to the long-acting drug (1–20-fold increase in EC50). A selection coefficient below zero implies that resistance does not spread in the population but is being lost due to its fitness costs. The transmission setting was non-seasonal and all treated individuals were fully adherent to treatment.
-
Figure 2—source data 1
Related to Figure 2A.
- https://cdn.elifesciences.org/articles/77634/elife-77634-fig2-data1-v1.csv
-
Figure 2—source data 2
Related to Figure 2B.
- https://cdn.elifesciences.org/articles/77634/elife-77634-fig2-data2-v1.csv
Figure 2—figure supplement 1

Influence of the access to treatment and degree of resistance on the estimated selection coefficients of a genotype resistant to the short-acting drug or the long-acting drug used in monotherapy.
Lines represent medians and shaded areas represent interquartile ranges of the selection coefficients estimated during the global sensitivity analysis over the parameter range for levels of access to treatment (10–80%), the degree of resistance to the short-acting drug (1–50-fold decrease in Emax), and the degree of resistance to the long-acting drug (1–20-fold increase in EC50).
-
Figure 2—figure supplement 1—source data 1
Related to Figure 2—figure supplement 1.
- https://cdn.elifesciences.org/articles/77634/elife-77634-fig2-figsupp1-data1-v1.csv
Figure 3 with 9 supplements
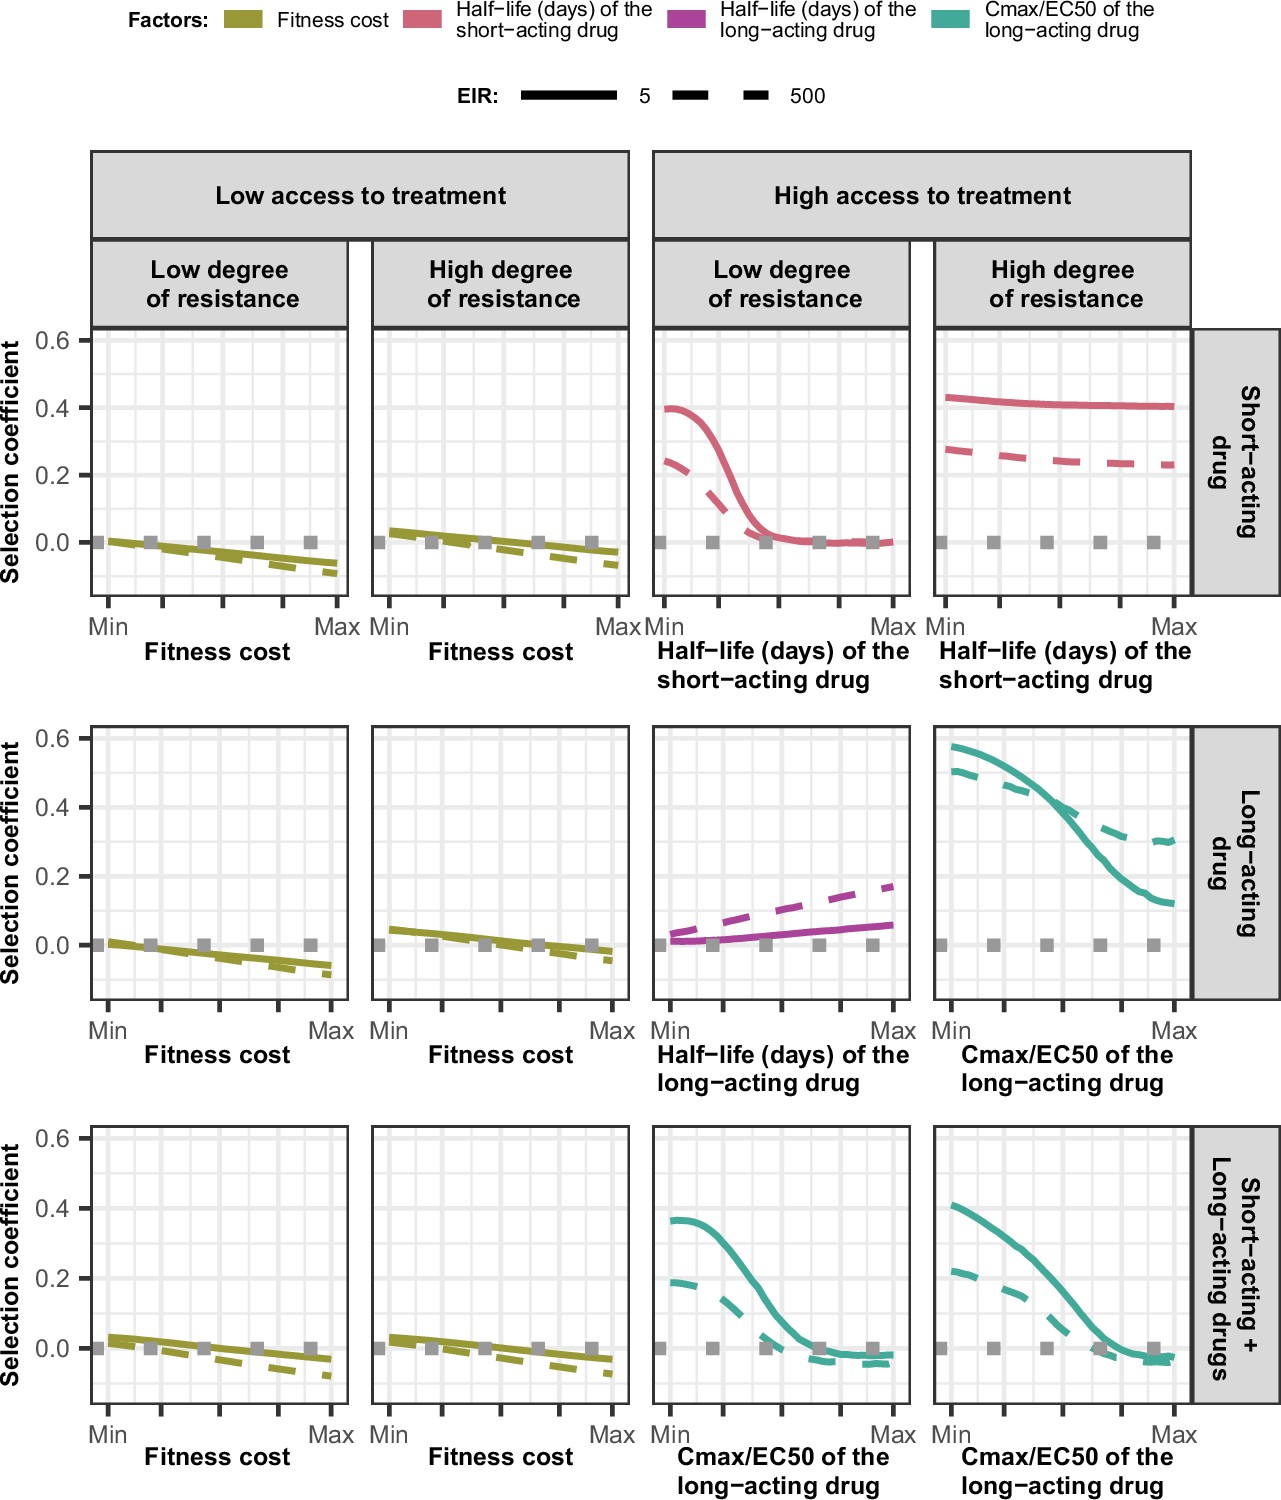
Magnitude and direction of effect of drug properties and fitness cost on estimated selection coefficients for low and high levels of transmission, degrees of drug resistance, and levels of access to treatment with monotherapy or combination treatment.
The curves represent median selection coefficients over the parameter ranges of factors that were determined to have key influences on the rate of spread of drug-resistant genotypes in settings that had an entomological inoculation rate (EIR) of 5 (solid curves) or 500 (dashed curves) inoculations per person per year, and low (10%) or high (80%) levels of access to treatment. Selection coefficients illustrated the spread of parasites resistant to the short- and long-acting drugs when each drug was used as monotherapy and parasites resistant to the short-acting drug when both drugs were used in combination. For each treatment profile, results are shown for parasites with two different degrees of resistance; degree of resistance of 7 (low) and 18 (high) to the short-acting drug (Emax shift), 2.5 (low) and 10 (high) to the long-acting drug (EC50 shift), for the combination of the short-acting and the long-acting drugs, 7 (low) and 18 (high) to the short-acting drug and 10 to the long-acting drug. Results are illustrated for settings with a seasonality pattern of transmission and a population fully adherent to treatment. The impacts of all factors in all settings are shown in Figure 3—figure supplements 1–2. Parameter ranges are as follows: fitness cost (1.0–1.1); the half-life of the short-acting drug (0.035–0.175 days); the half-life of the long-acting drug (6–22 days); Cmax/EC50 ratio of the long-acting drug (5.1–21.7).
-
Figure 3—source data 1
Related to Figure 3.
- https://cdn.elifesciences.org/articles/77634/elife-77634-fig3-data1-v1.csv
Figure 3—figure supplement 1

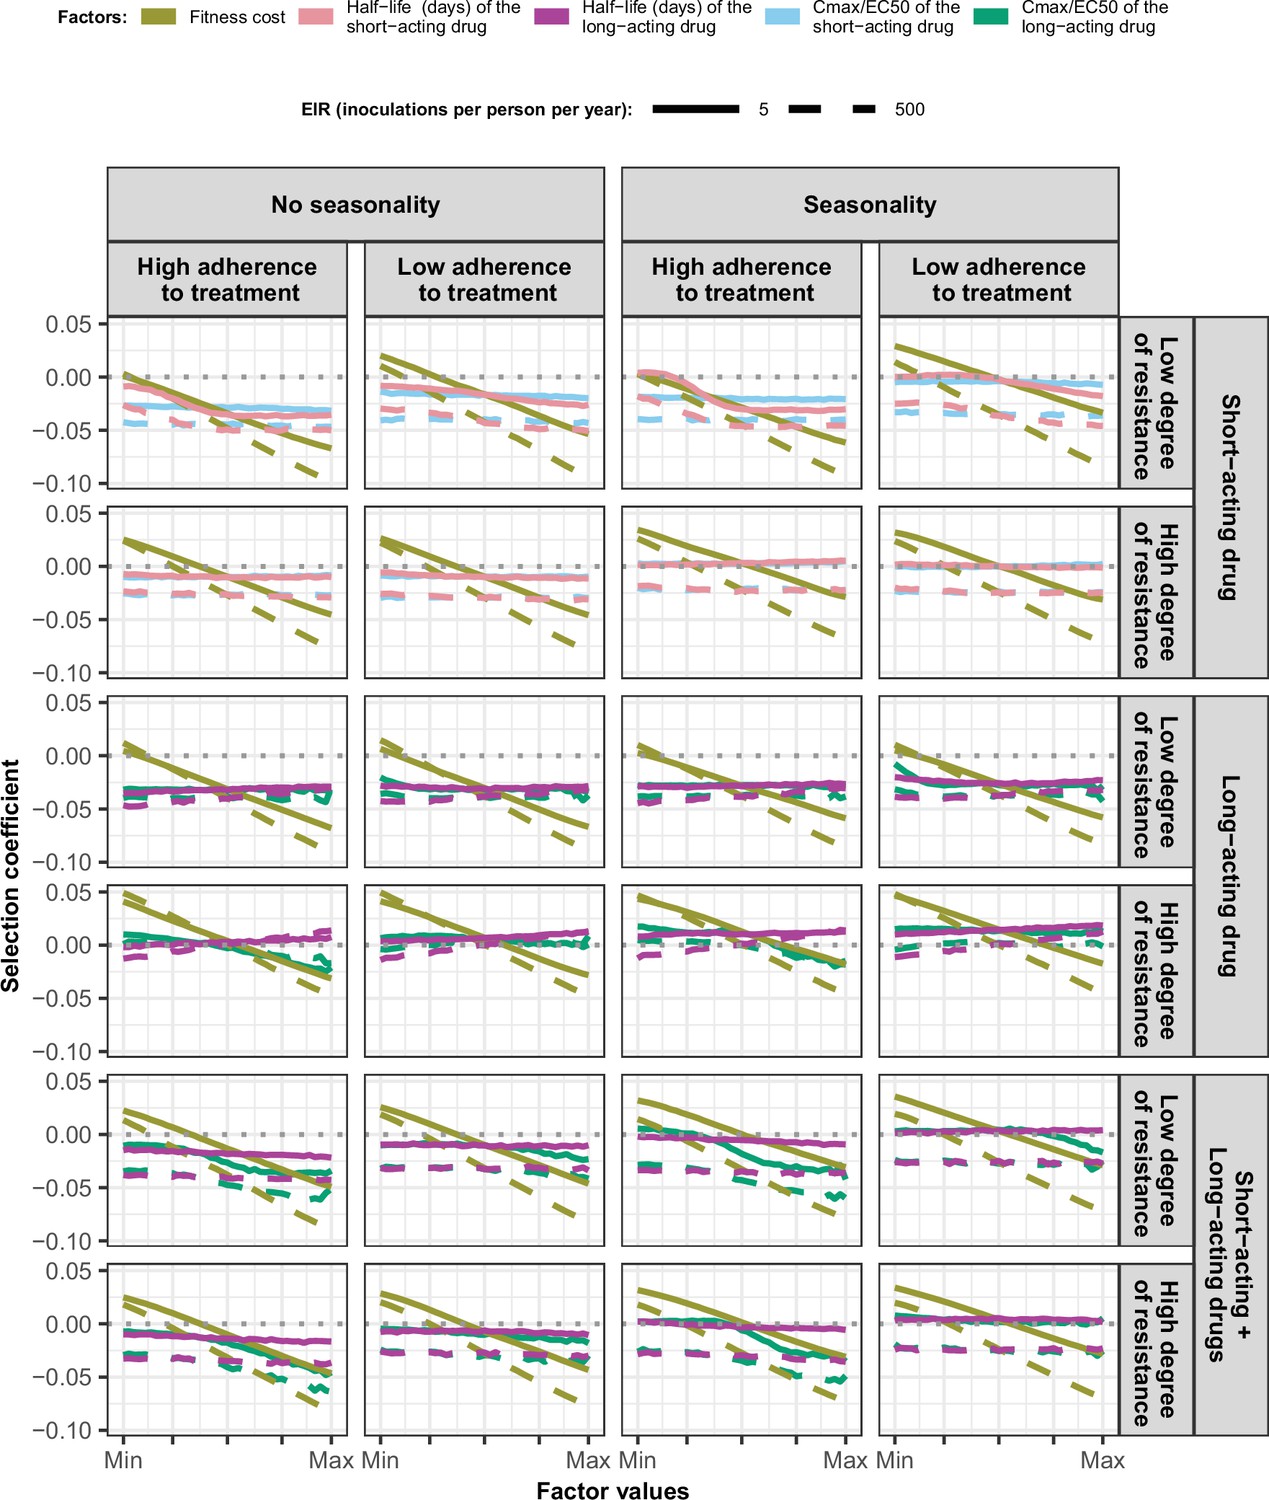
Magnitude and direction of effect of drug properties and fitness cost on estimated selection coefficients in settings with high access to treatment and different levels of transmission, degrees of drug resistance, treatment adherence in seasonal, or perennial settings with monotherapy or combination treatment.
The curves represent median selection coefficients over the parameter ranges estimated in each setting that had high access to treatment (80%) and an entomological inoculation rate (EIR) of 5 (solid curves) or 500 (dashed curves) inoculations per person per year. Settings were varied in their seasonality pattern of transmission and level of adherence to treatment (67% [low] or 100% [high] of treatment doses adhered to by the population). For each treatment profile, results are shown for parasites with two different degrees of resistance; degree of resistance of 7 (low) and 18 (high) to the short-acting drug (Emax shift), 2.5 (low) and 10 (high) to the long-acting drug (EC50 shift), for the combination of the short-acting and the long-acting drugs, 7 (low) and 18 (high) to the short-acting drug and 10 to the long-acting drug. Parameter ranges are as follows: fitness cost (1.0–1.1); the short-acting drug half-life (0.035–0.175days); the long-acting drug half-life (6–22days); Cmax/EC50 ratio of the short-acting drug (55.0–312.0); Cmax/EC50 ratio of the long-acting drug at a high level of adherence to treatment (5.4–21.7) and at a low level of adherence (4.0–16.2).
-
Figure 3—figure supplement 1—source data 1
Related to Figure 3—figure supplement 1.
- https://cdn.elifesciences.org/articles/77634/elife-77634-fig3-figsupp1-data1-v1.csv
Figure 3—figure supplement 2
Magnitude and direction of effect of drug properties and fitness cost on estimated selection coefficients in settings with low access to treatment and different levels of transmission, degree of drug resistance, treatment adherence in seasonal, or perennial settings with monotherapy or combination treatment.
The solid and dashed lines represent the median selection coefficients over the parameter ranges estimated in each setting that had low access to treatment (10%) and an entomological inoculation rate (EIR) of 5 (solid lines) or 500 (dashed lines) inoculations per person per year. Settings varied in their seasonality pattern and level of adherence to treatment (low = 67%and high = 100%). For each treatment profile, we show results for parasites with two different degrees of resistance; degree of resistance of 7 (low) and 18 (high) to the short-acting drug (Emax shift), 2.5 (low) and 10 (high) to the long-acting drug (EC50 shift), and with combination of the short-acting and the long-acting drugs, 7 (low) and 18 (high) to the short-acting drug and 10 to the long-acting drug. The parameter ranges were the following: fitness cost (1, 1.1); the short-acting drug half-life (0.035, 0.175) days; the long-acting drug half-life (6, 22) days; Cmax/EC50 ratio of the short-acting drug (55, 312); Cmax/EC50 ratio of the long-acting drug at a high level of adherence to treatment (5.4, 21.7); and at a low level of adherence (4.0, 16.2).
-
Figure 3—figure supplement 2—source data 1
Related to Figure 3—figure supplement 2.
- https://cdn.elifesciences.org/articles/77634/elife-77634-fig3-figsupp2-data1-v1.csv
Figure 3—figure supplement 3

First-order indices describing level of importance of each factor varied in the constrained sensitivity analysis of the spread of a genotype resistant to the short-acting drug used in monotherapy.
The first-order indices were assessed for parasites that had different degrees of resistance to the short-acting drug (low = 7and high = 18-fold decrease in Emax) in settings that differ in their levels of access to treatment (high = 10%and low = 80%), levels of transmission (5, 10, and 500 inoculations per person per year), transmission patterns (no seasonality and seasonality), and levels of adherence to treatment (low = 67% and high = 100%). The explored parameter ranges were the following: the fitness cost (1, 1.1); the half-life of the short-acting drug (0.035, 0.175) days; the ratio Cmax/EC50 of the short-acting drug (55, 312); the Emax of the short-acting drug (27.5, 31.0) per day; and the diagnostic detection limit (2, 50) parasites/µl.
-
Figure 3—figure supplement 3—source data 1
Related to Figure 3—figure supplement 3.
- https://cdn.elifesciences.org/articles/77634/elife-77634-fig3-figsupp3-data1-v1.csv
Figure 3—figure supplement 4
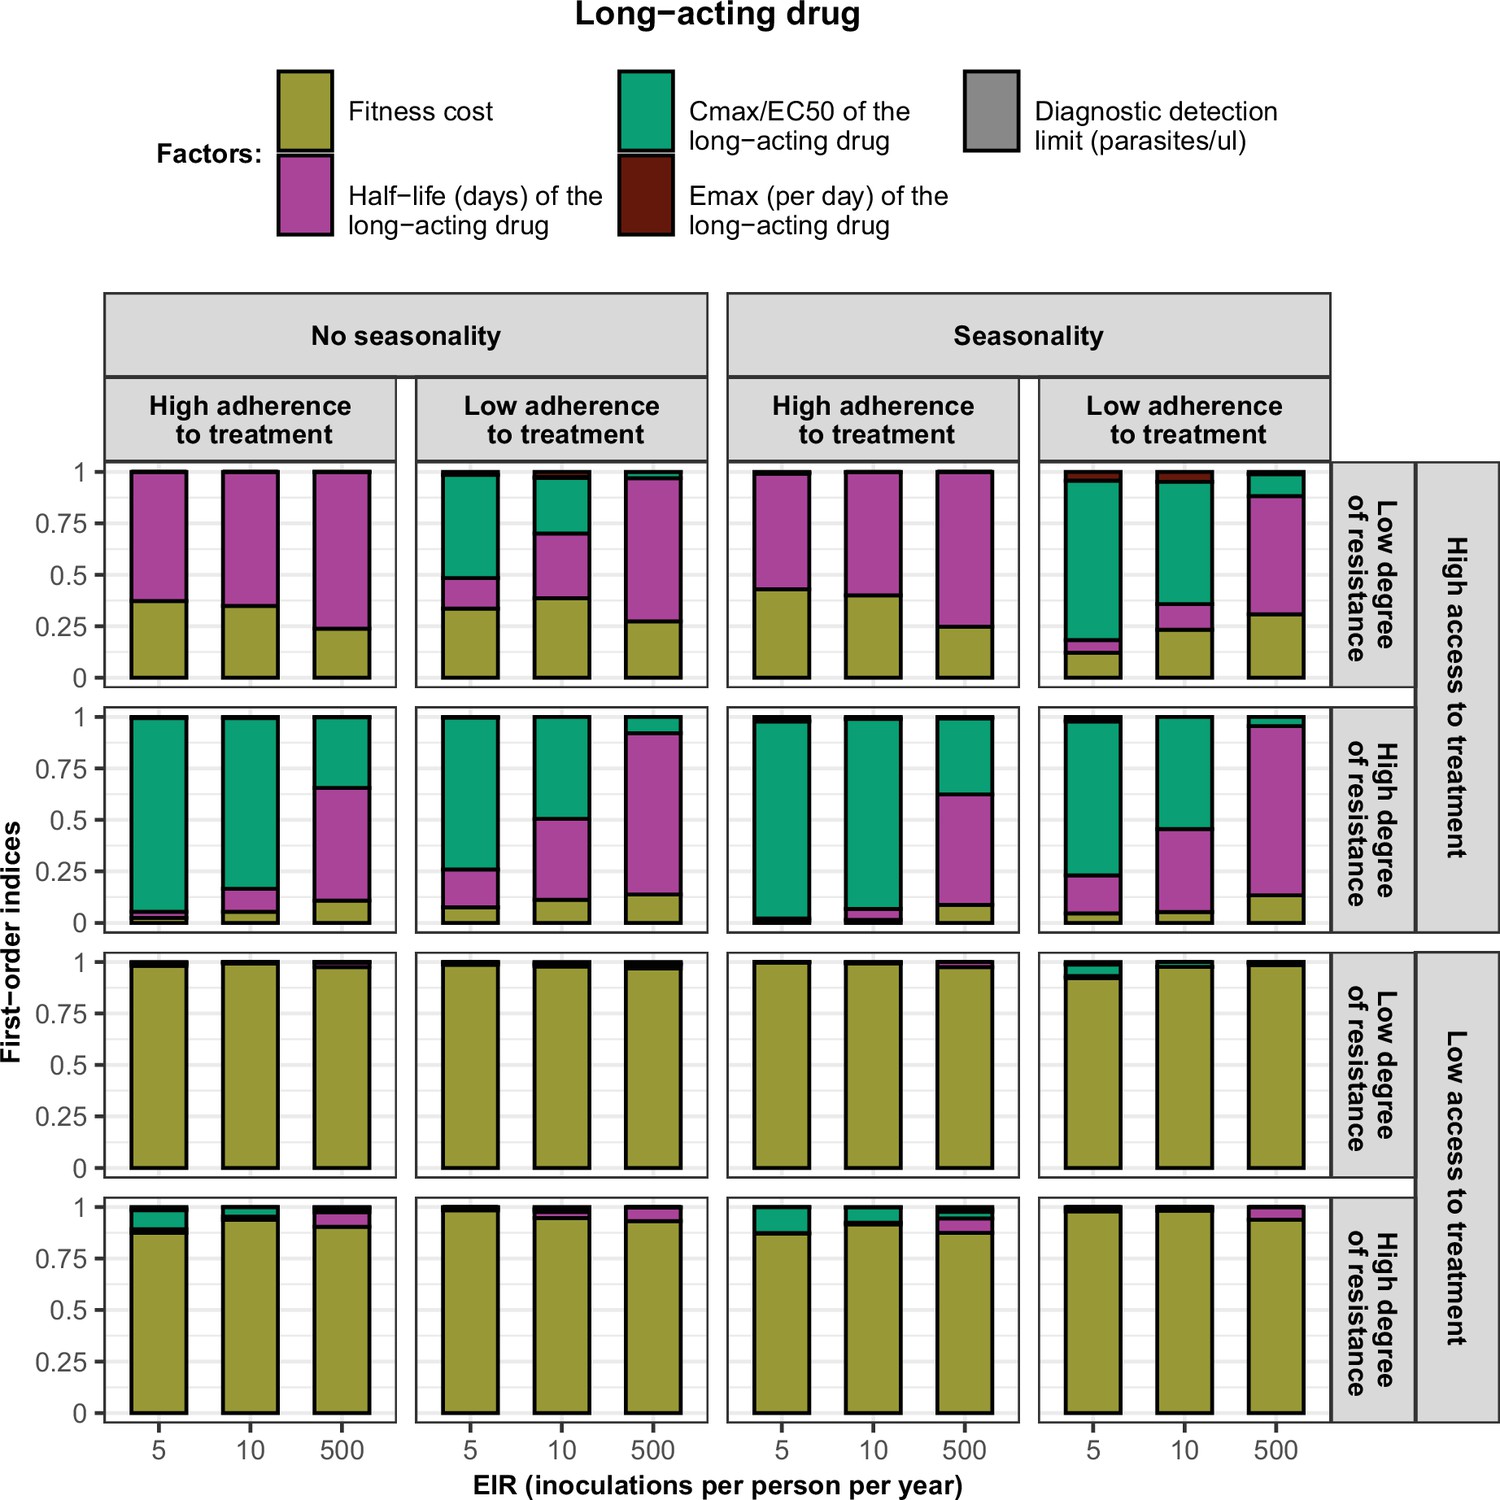
First-order indices of each factor varied in the constrained sensitivity analysis of the spread of a genotype resistant to the long-acting drug used in monotherapy.
The first-order indices were assessed for parasites that had different degrees of resistance to the long-acting drug (low = 2.5and high = 10-fold increase in EC50) in settings that differ in their levels of access to treatment (low = 10 % and high = 80%), levels of transmission (5, 10, and 500 inoculations per person per year), transmission patterns (no seasonality and seasonality), and levels of adherence to treatment (low = 67% and high = 100%). The explored parameter ranges were the following: the fitness cost (1, 1.1); the half-life of the long-acting drug (6, 22) days; the ratio Cmax/EC50 of the long-acting drug at a high level of adherence to treatment (5.4, 21.7) and at a low level of adherence to treatment (4.0, 16.2); the Emax of the long-acting drug (3.45, 5.00) per day; and the diagnostic detection limit (2, 50) parasites/µl.
-
Figure 3—figure supplement 4—source data 1
Related to Figure 3—figure supplement 4.
- https://cdn.elifesciences.org/articles/77634/elife-77634-fig3-figsupp4-data1-v1.csv
Figure 3—figure supplement 5
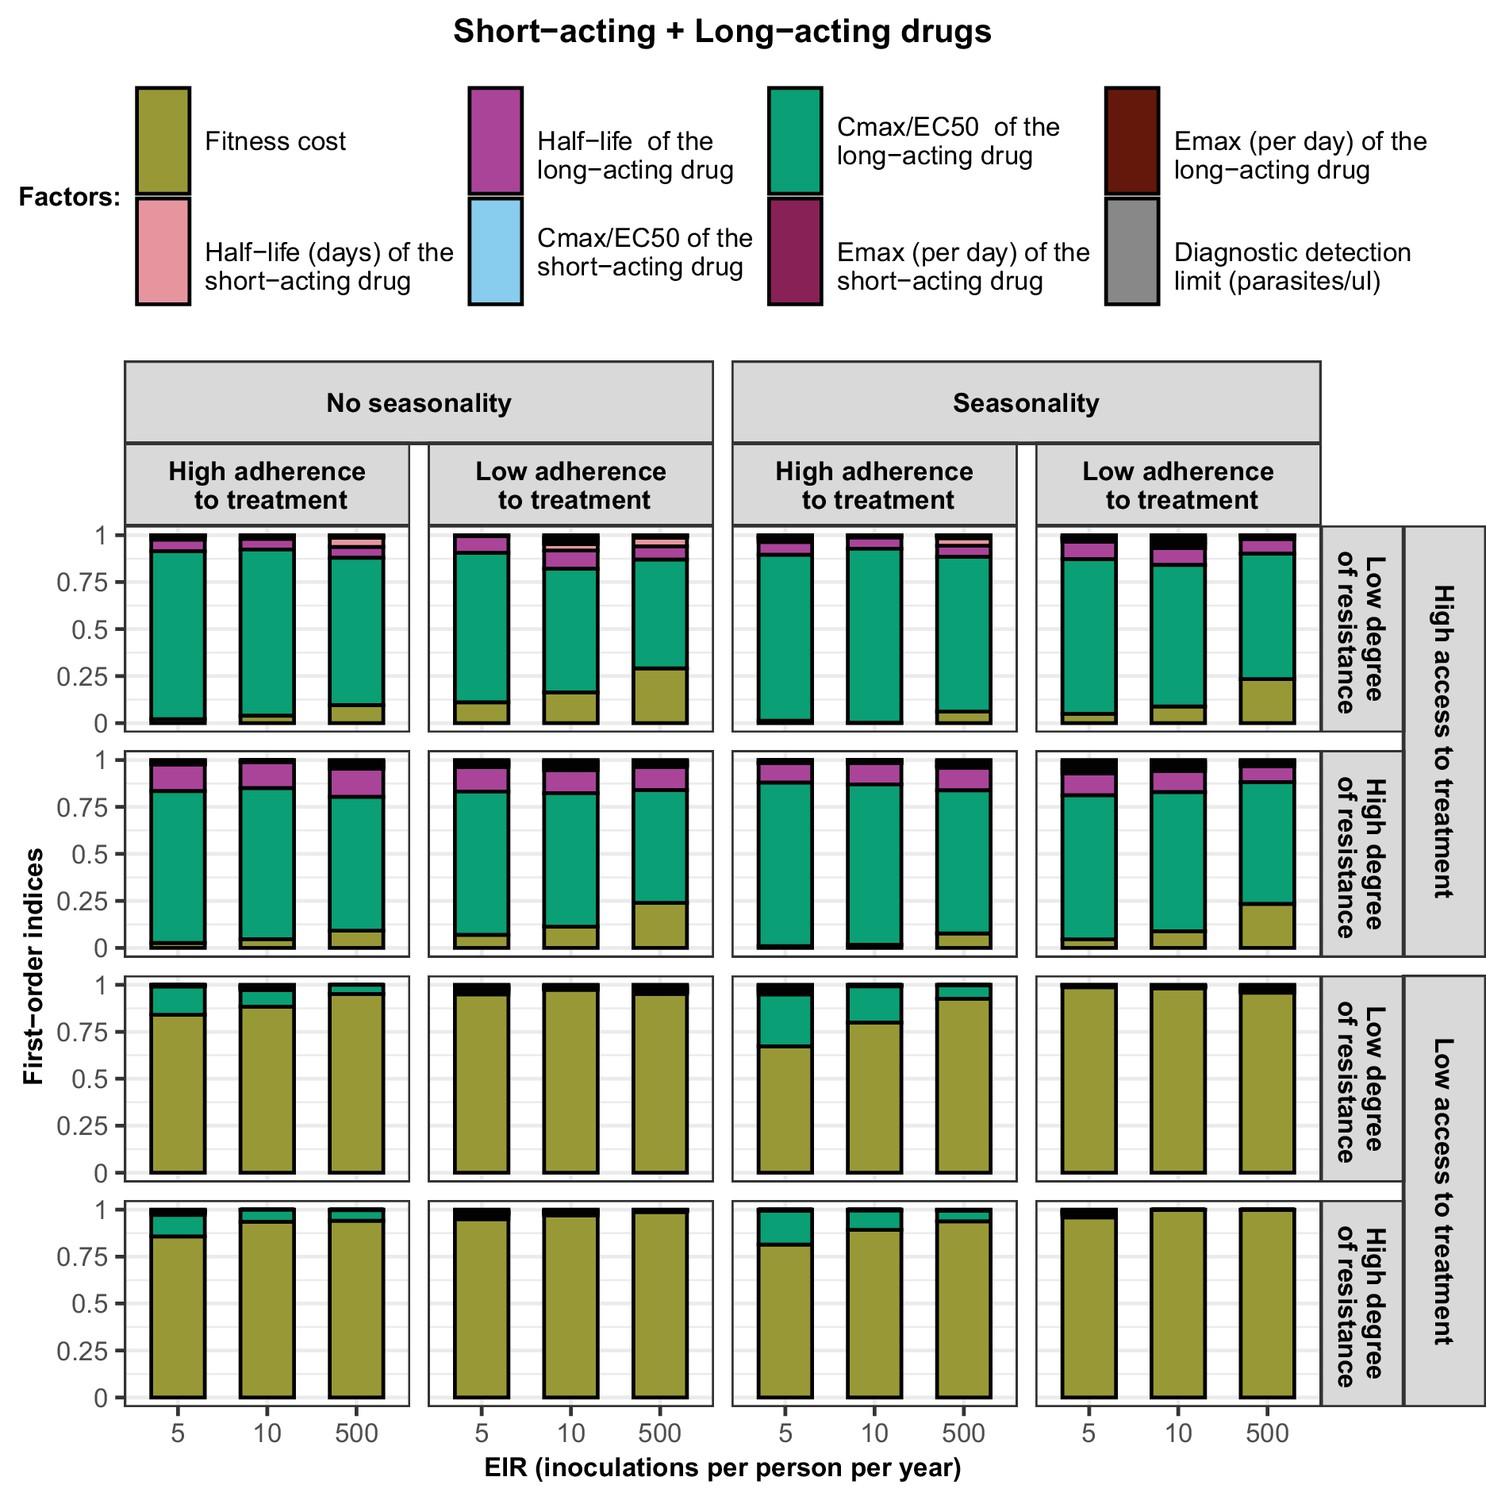
First-order indices of each factor varied in the constrained sensitivity analysis of the spread of a genotype resistant to the short-acting drug when the short-acting drug and the long-acting drug are used in combination.
The first-order indices were assessed for parasites that had different degrees of resistance to the short-acting drug (low = 7and high = 18-fold decrease in Emax) in settings that differ in their levels of access to treatment (low = 10% and high = 80%), levels of transmission (5, 10, and 500 inoculations per person per year), transmission patterns (no seasonality and seasonality), and levels of adherence to treatment (low = 67% and high = 100%). The explored parameter ranges were the following: the fitness cost (1, 1.1); the half-life of the short-acting drug (0.035, 0.175) days; the half-life of the long-acting drug (6, 22) days; the ratio Cmax/EC50 of the short-acting drug (55, 312); the ratio Cmax/EC50 of the long-acting drug at a high level of adherence to treatment (5.4, 21.7) and at a low level of adherence to treatment (4.0, 16.2); the Emax of the short-acting drug (27.5, 31.0) per day; the Emax of the long-acting drug (3.45, 5) per day; and the diagnostic detection limit (2, 50) parasites/µl.
-
Figure 3—figure supplement 5—source data 1
Related to Figure 3—figure supplement 5.
- https://cdn.elifesciences.org/articles/77634/elife-77634-fig3-figsupp5-data1-v1.csv
Figure 3—figure supplement 6

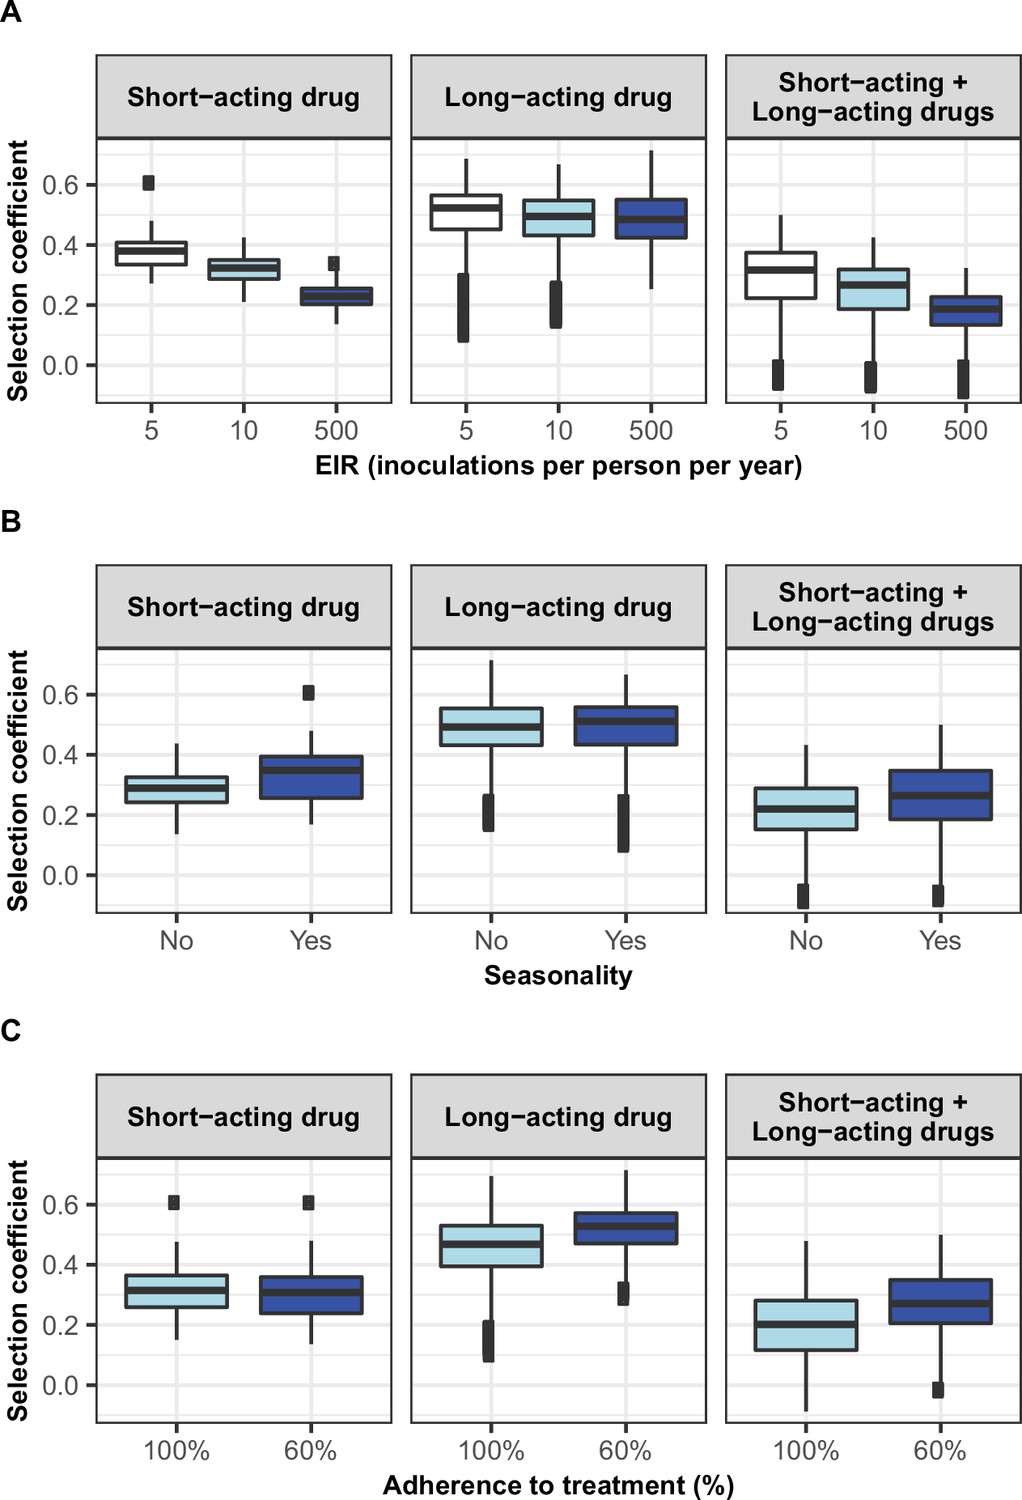
Distribution of the estimated selection coefficient for resistant parasites with a low degree of resistance in different transmission settings with high access to treatment.
Selection coefficients of resistant genotypes were estimated for each treatment profile during the constrained sensitivity analysis assuming resistant parasites have a low degree of resistance (equal to 7 for the short-acting drug [Emax shift] and 2.5 for the long-acting drug [EC50 shift]), in settings with a high access to treatment (80%). The distributions are stratified by (A) the intensity of transmission (B) the seasonality pattern, and (C) the level of adherence to treatment in the settings.
-
Figure 3—figure supplement 6—source data 1
Related to Figure 3—figure supplement 6.
- https://cdn.elifesciences.org/articles/77634/elife-77634-fig3-figsupp6-data1-v1.csv
Figure 3—figure supplement 7
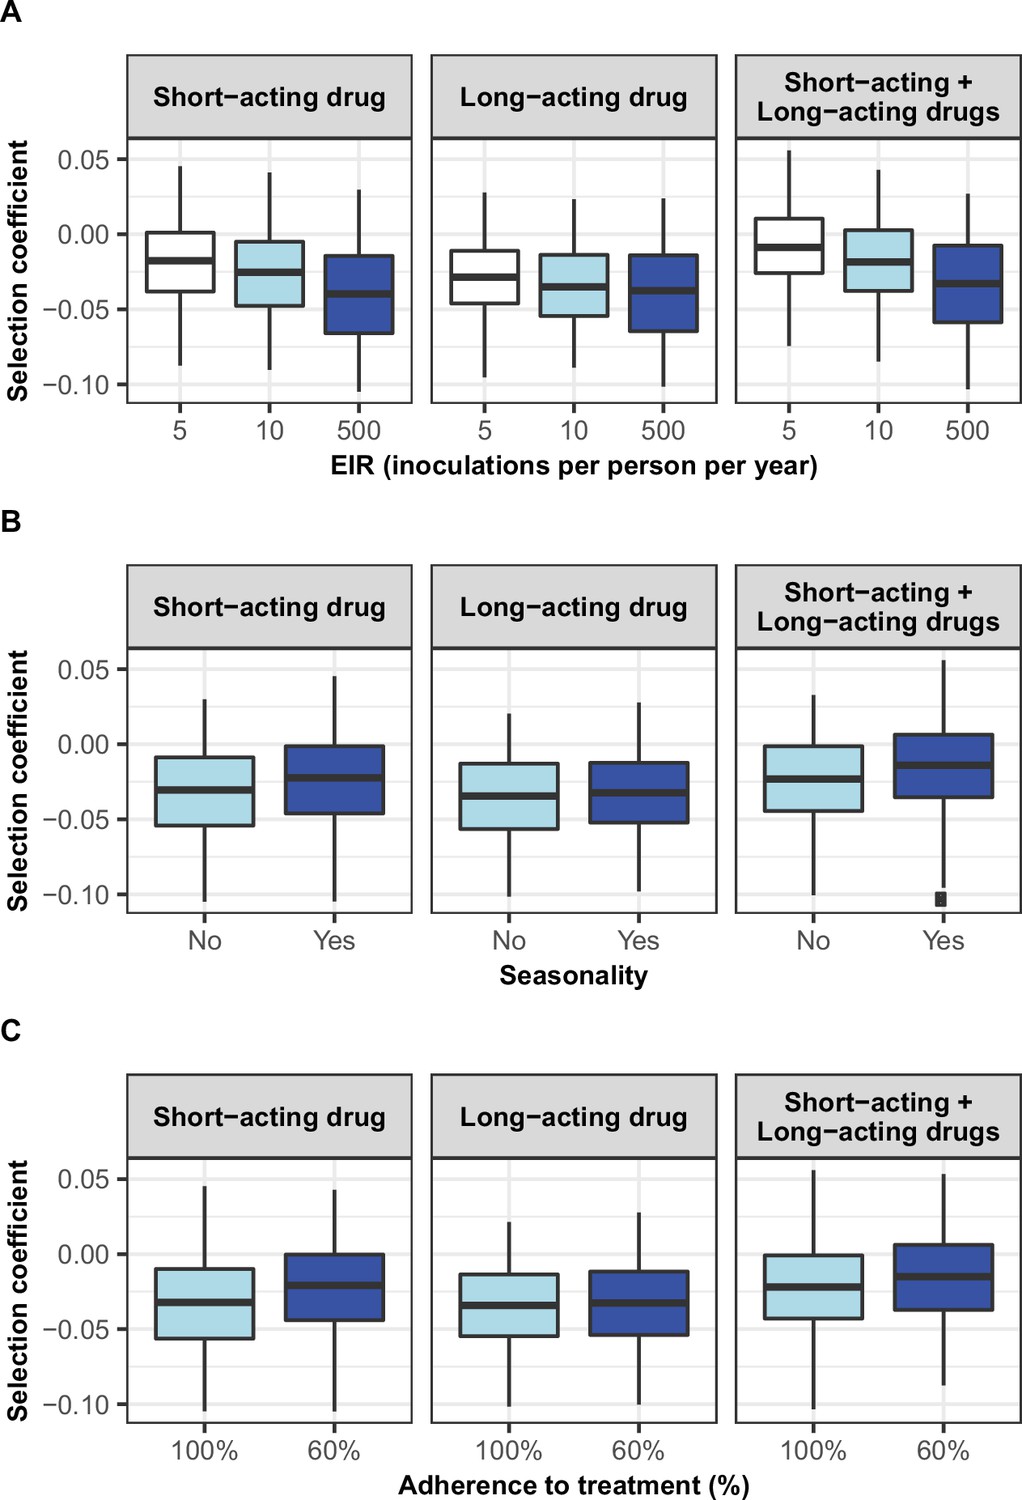
Distribution of the estimated selection coefficients for resistant parasites with a high degree of resistance in different transmission settings with high access to treatment.
Selection coefficients of resistant genotypes were estimated for each treatment profile during the constrained sensitivity analysis assuming resistant genotypes have a high degree of resistance (equal to 18 for the short-acting drug [Emax shift] and 10 for the long-acting drug [EC50 shift]), in settings with high access to treatment (80%). Distributions were stratified by (A) intensity of transmission, (B) seasonality pattern, and (C) the level of adherence to treatment in the settings.
-
Figure 3—figure supplement 7—source data 1
Related to Figure 3—figure supplement 7.
- https://cdn.elifesciences.org/articles/77634/elife-77634-fig3-figsupp7-data1-v1.csv
Figure 3—figure supplement 8

Treatment usage.
The figure highlights the relationship between the transmission intensity (EIR) and the percentage of people that received treatment during a month (orange dots) and the percentage of infected people that received treatment during a month (blue dots). In this illustration, the level of access to treatment was equal to 80%, and the transmission was perennial. EIR: entomological inoculation rate.
-
Figure 3—figure supplement 8—source data 1
Related to Figure 3—figure supplement 8.
- https://cdn.elifesciences.org/articles/77634/elife-77634-fig3-figsupp8-data1-v1.csv
Figure 3—figure supplement 9
Distribution of selection coefficient of parasites with a low degree of resistance in different settings with low access to treatment.
The selection coefficients were estimated for each treatment profile during the constrained sensitivity analysis of the spread of resistant genotypes having a low degree of resistance (equal to 7 for the short-acting drug [Emax shift] and 2.5 for the long-acting drug [EC50 shift]), in settings with a low access to treatment (10%). The distributions are stratified by (A) the intensity of transmission, (B) the seasonality pattern, and (C) the level of adherence to treatment in the settings.
-
Figure 3—figure supplement 9—source data 1
Related to Figure 3—figure supplement 9.
- https://cdn.elifesciences.org/articles/77634/elife-77634-fig3-figsupp9-data1-v1.csv
Figure 4
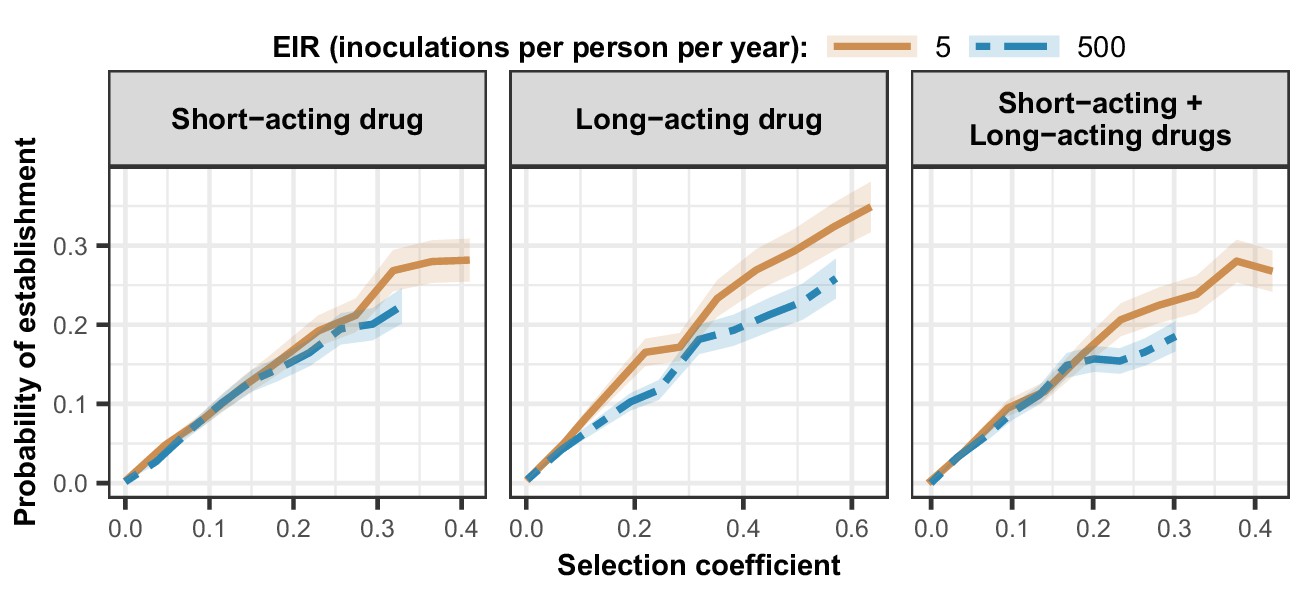
Estimated probability of establishment of mutations conferring drug resistance across transmission settings.
Solid brown curves and blue dashed curves represent the relationship between the selection coefficient and the estimated probability of establishment of resistant parasites across settings that differ in transmission intensities (5 and 500 inoculations per person per year, respectively). The relationships are illustrated for parasites resistant to the short- and long-acting drugs when each drug was used as monotherapy and parasites resistant to the short-acting drug when both drugs were combined. The shaded area represents the 95% confidence intervals estimated as described in Materials and methods. The range of selection coefficients include higher values at a low entomological inoculation rate (EIR). For each setting, the level of access to treatment was specified as 80%, the population was assumed to be fully adherent to treatment (100%), and transmission was non-seasonal.
-
Figure 4—source data 1
Related to Figure 4.
- https://cdn.elifesciences.org/articles/77634/elife-77634-fig4-data1-v1.csv
Appendix 1—figure 1
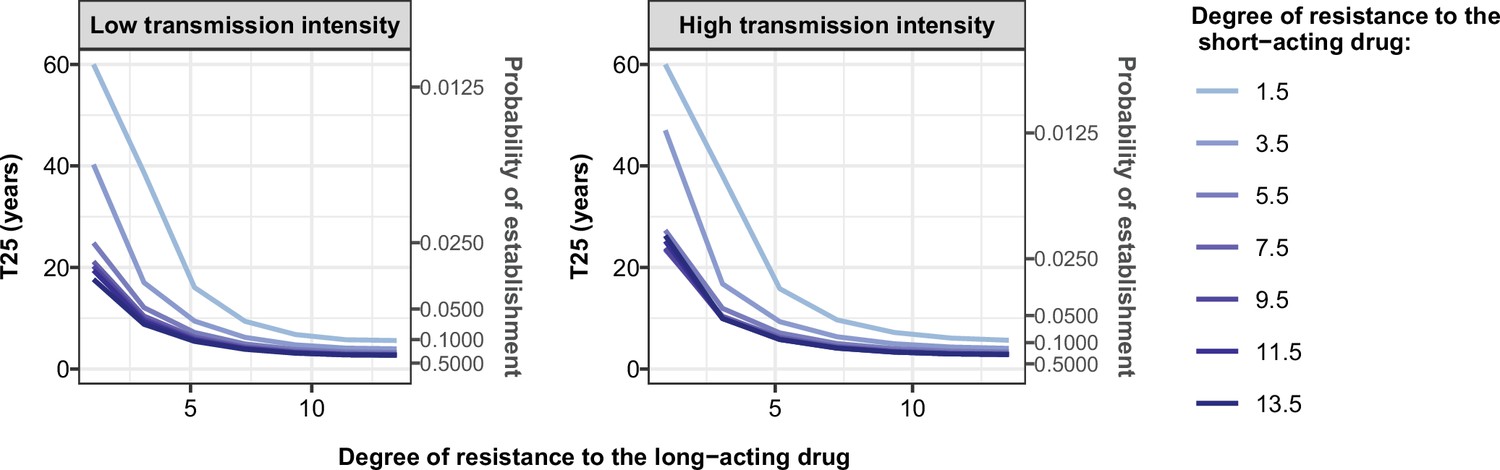
Illustration of the benefit of combination therapy on the evolution of drug resistance as time to 25% frequency of resistant genotypes.
We estimated the probability of establishment and the time needed for parasites resistant to the short-acting drug to spread from 1 to 25% of inoculations carrying the resistant genotype, T25, for multiple degrees of resistance of the resistant genotype to the short-acting drug (Emax shift) and multiple degrees of resistance of both genotypes to the long-acting drug (EC50 shift). We assumed the short-acting drug has a similar drug profile of dihydroartemisinin and the long-acting drug of piperaquine. We assumed a level of access to treatment of 100%. The population fully adhered to treatment. The resistant parasites had no fitness cost. The transmission intensity was equal to 5 (low transmission intensity) or 500 (high transmission intensity) inoculations per person per year (reflected low to very high transmission). The transmission was perennial.
-
Appendix 1—figure 1—source data 1
Related to Appendix 1—figure 1.
- https://cdn.elifesciences.org/articles/77634/elife-77634-app1-fig1-data1-v1.csv
Appendix 1—figure 2

The seasonal transmission of malaria.
Entomological inoculation rate (EIR) (inoculations per person per month) plotted for a year in our assumed seasonal setting of malaria transmission, based on field studies conducted in Tanzania (Maire et al., 2006b). Here the total EIR is 360 inoculations per person per year.
Appendix 1—figure 3
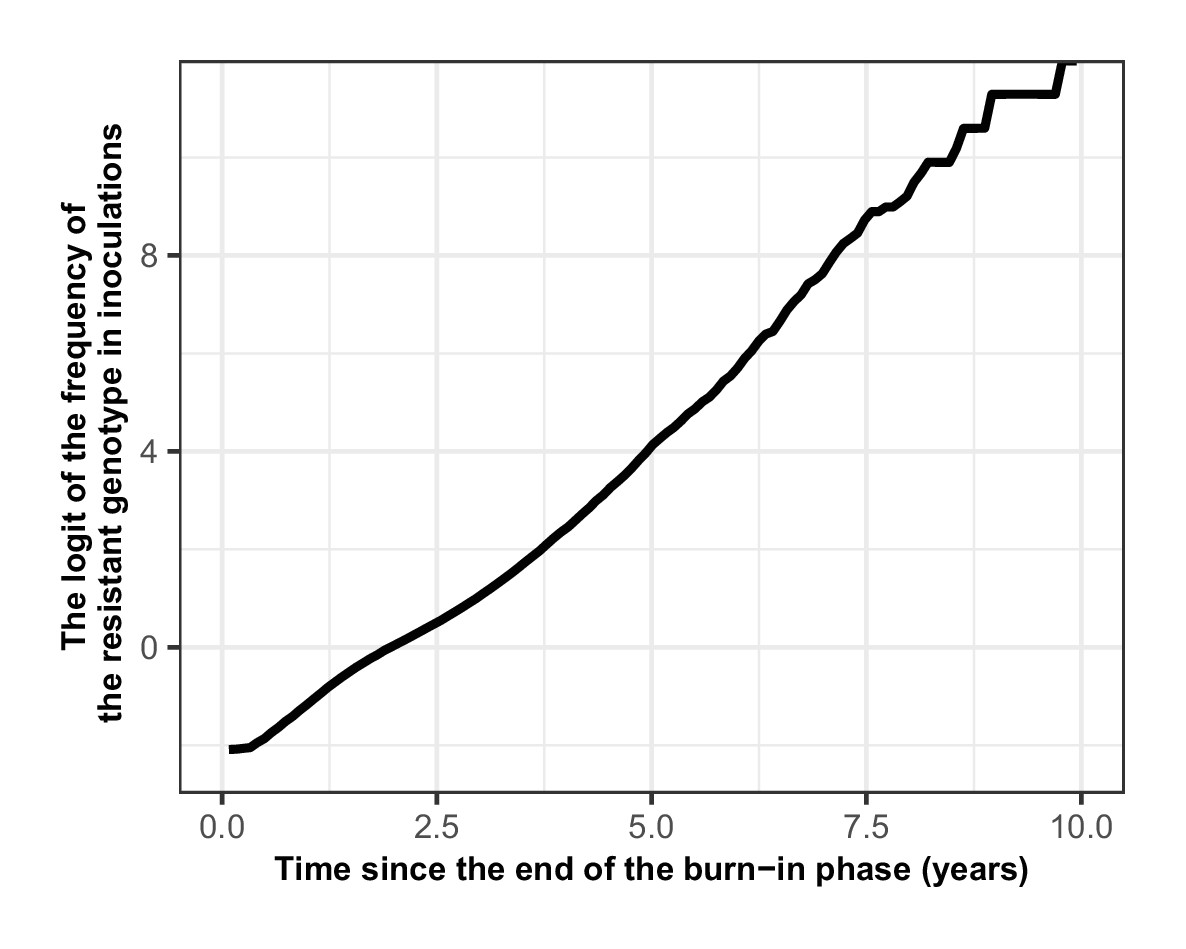
Proof that the selection coefficient is not frequency-dependent in OpenMalaria.
The figure illustrates the logit of the frequency of the resistant genotype over time when the initial frequency of infected humans carrying the resistant genotype was 5%. The selection coefficient (slope of the logistic regression) was less stable after 6 years because the percentage of inoculations carrying the sensitive genotype was lower than 0.5%. Thus, the influence of stochastic processes was strong.
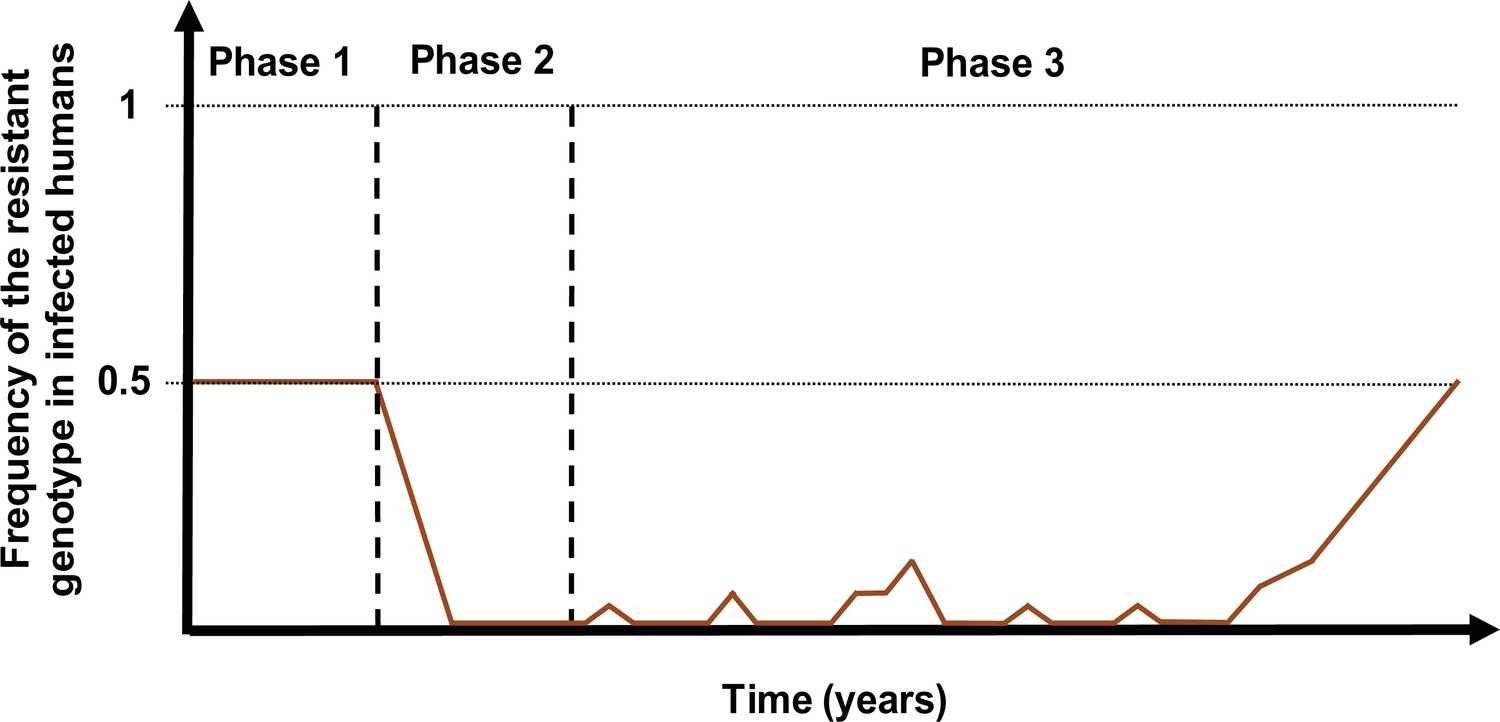
Appendix 1—figure 4
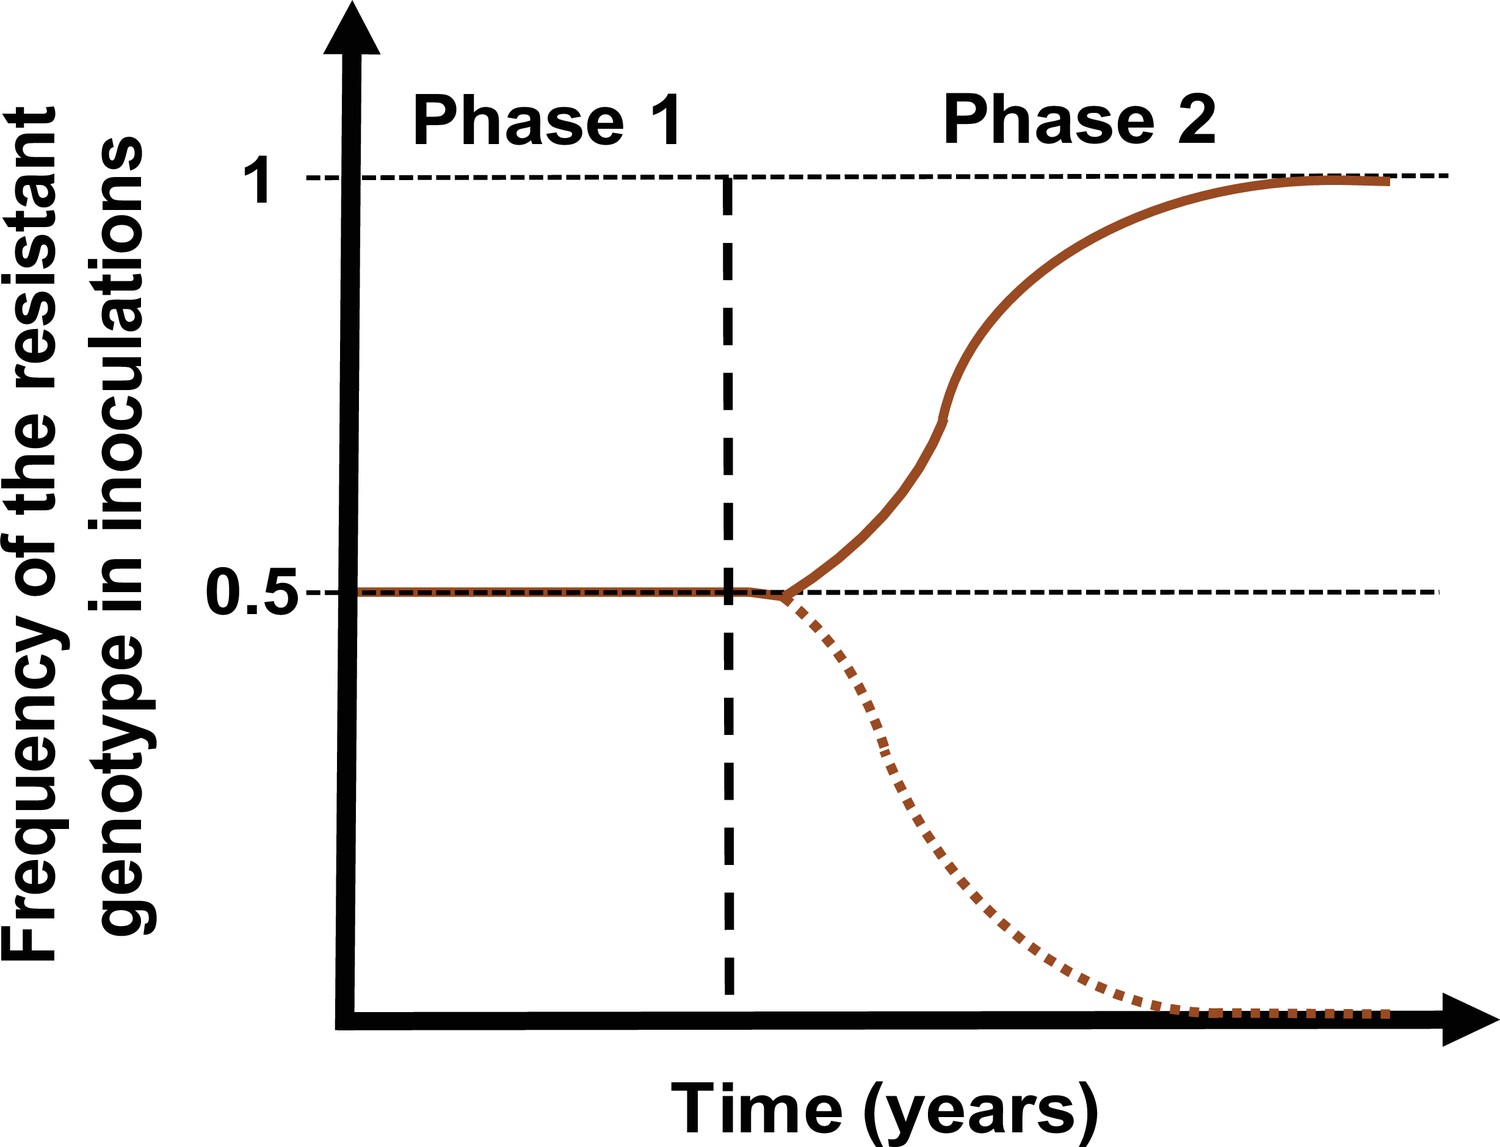
Schematic illustration of typical simulations run in OpenMalaria to estimate the rate of spread of a drug-resistant genotype.
The brown line represents the frequency of the resistant genotypes inoculations. The solid line illustrates a simulation in which the resistant genotype spreads in the population (selection coefficient above 0). The dotted line illustrates a simulation in which the resistant genotype did not spread in the population (selection coefficient below 0). Illustrative phase 1 represents the burn-in phase. The vertical dashed black line highlights when we introduced the fitness cost and the drug for which the resistant genotype had reduced sensitivity. Phase 2 is the phase during which the rate of spread of the resistant genotype was assessed.
Appendix 1—figure 5

Illustration of the estimation of the selection coefficient in seasonal settings.
The black dots represent the logit of the frequency of the resistant genotype. The blue dots represent the logit of the moving average of frequency of the resistant genotype. The moving average of a measurement at a time t included all the measurements from 6 months before time t and 6 months after the time t. Using this method, the selection coefficient (slope of the logistic regression) was constant over time.
Appendix 1—figure 6
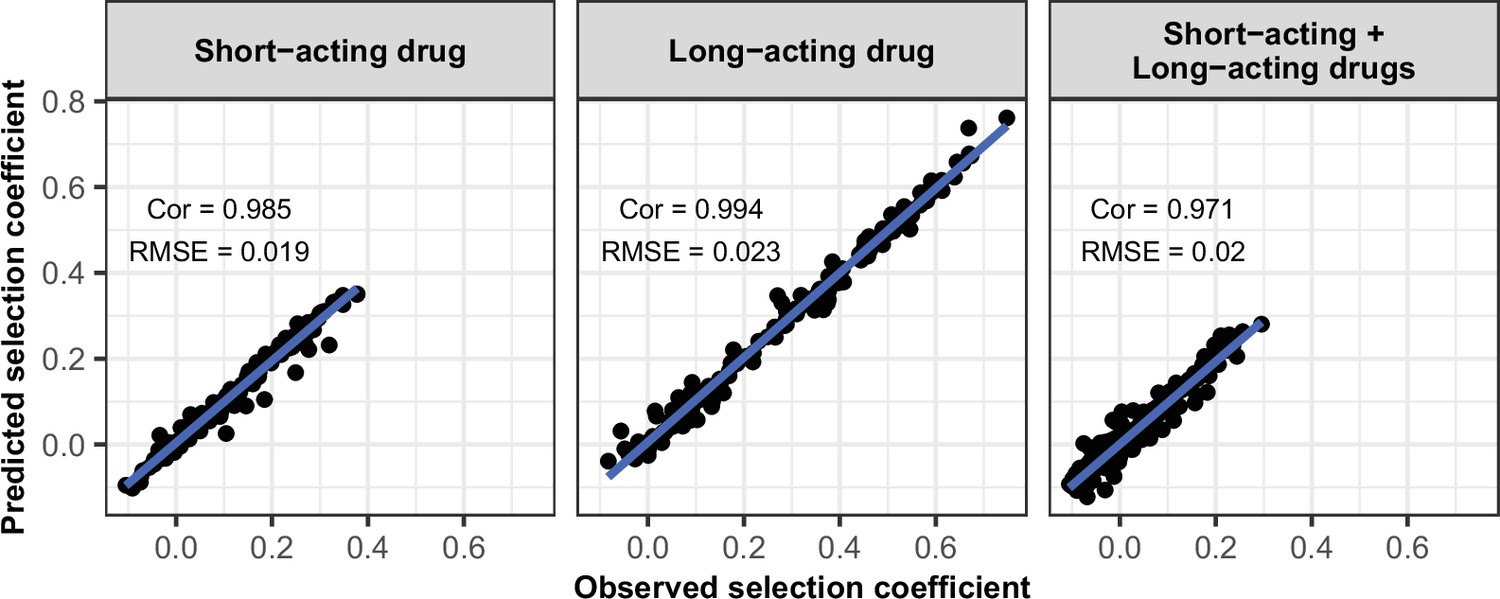
Accuracy of the emulators used for the global sensitivity analyses of each treatment profile.
For each treatment profile, the comparison between the selection coefficients of the test dataset estimated using OpenMalaria (i.e. the observed ‘true’ selection coefficient) and the corresponding prediction from the emulator during the final round of adaptive sampling. ‘Cor’ is the Spearman correlation coefficient, ‘RMSE’ is the root means squared error, and the blue lines are the linear regression fits.
-
Appendix 1—figure 6—source data 1
Related to Appendix 1—figure 6.
- https://cdn.elifesciences.org/articles/77634/elife-77634-app1-fig6-data1-v1.csv
Appendix 1—figure 7
Accuracy of the emulators used for each constrained sensitivity analysis of the spread of a genotype resistant to the short-acting drug used in monotherapy in each setting with low access to treatment (10%).
The comparison between the selection coefficients for the test dataset between the observed ‘truth’ from OpenMalaria, and the prediction from the emulators during the final round of adaptive sampling. The EIR is in inoculations per person per year (5, 10, and 500). The degree of resistance is the relative decrease in the Emax of the resistant genotype compared with the sensitive one. ‘Cor’ is the Spearman correlation coefficient, ‘RMSE’ is the root means squared error, and the blue lines are the linear regression fits.
-
Appendix 1—figure 7—source data 1
Related to Appendix 1—figure 7.
- https://cdn.elifesciences.org/articles/77634/elife-77634-app1-fig7-data1-v1.csv
Appendix 1—figure 8

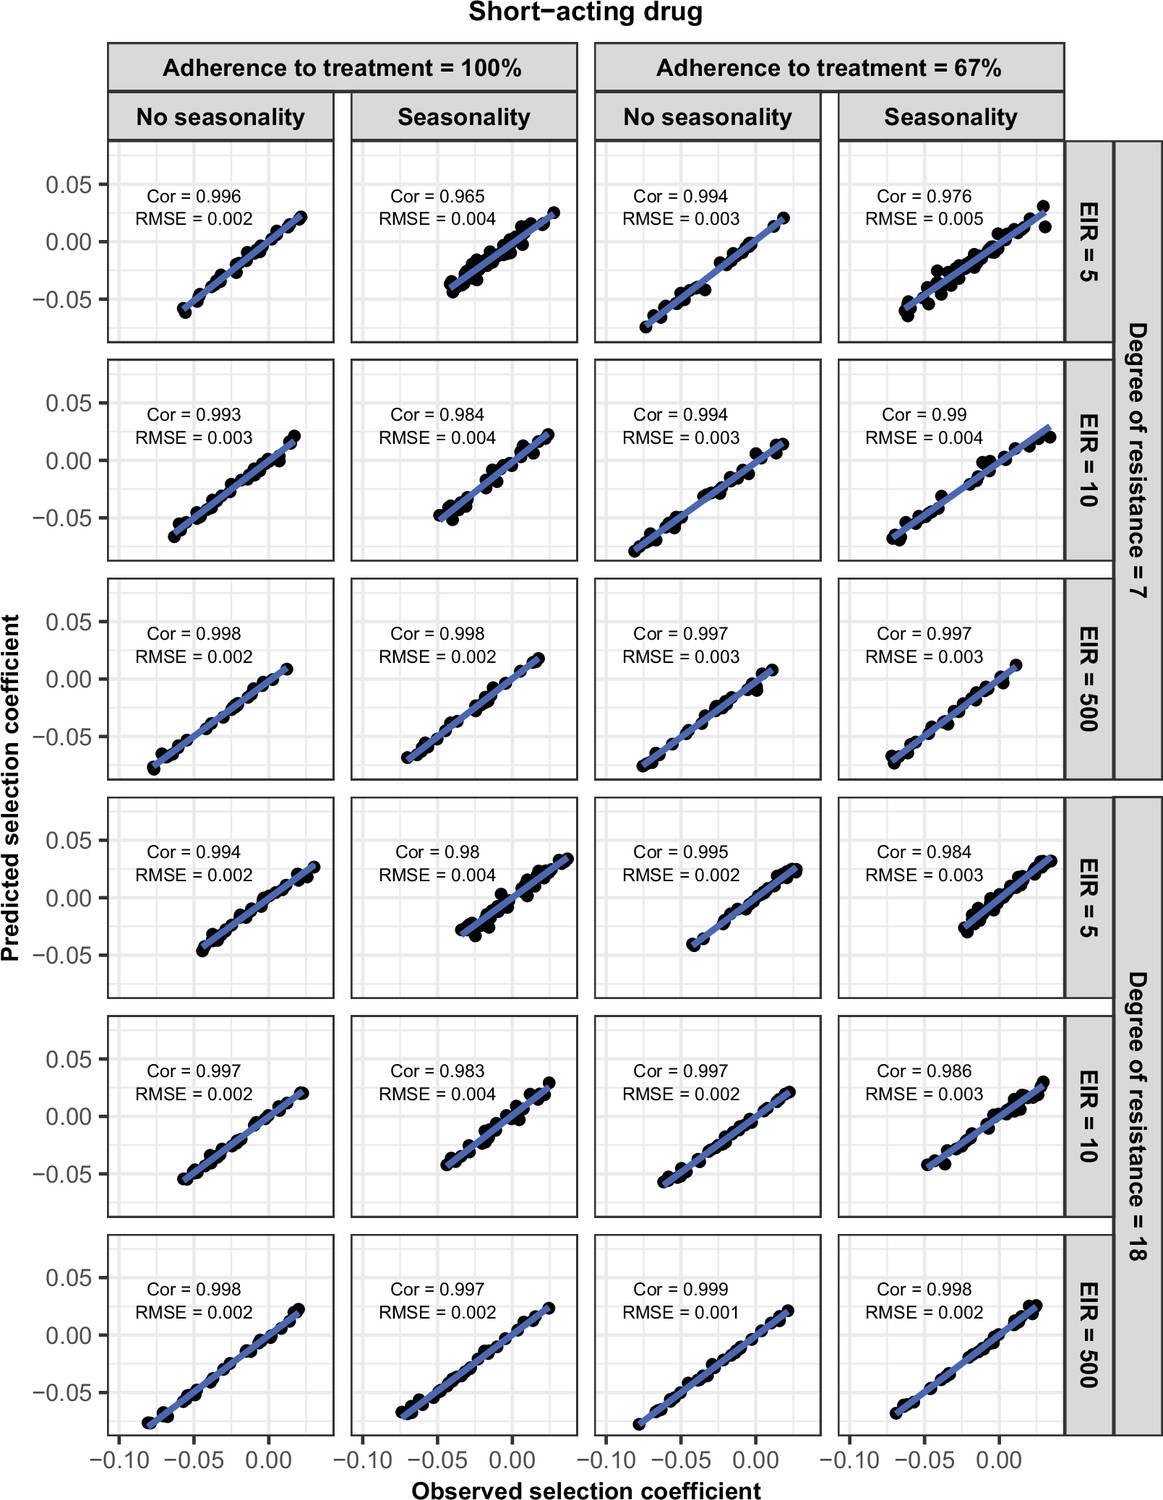
Accuracy of the emulators used for each constrained sensitivity analysis of the spread of a genotype resistant to the short-acting drug used in monotherapy in each setting with high access to treatment (80%).
The comparison between the selection coefficients for the test dataset between the observed ‘truth’ from OpenMalaria, and the prediction from the emulators during the final round of adaptive sampling. The EIR is in inoculations per person per year (5, 10, or 500). The degree of resistance is the relative decrease in the Emax of the resistant genotype compared with the sensitive one. ‘Cor’ is the Spearman correlation coefficient, ‘RMSE’ is the root means squared error, and the blue lines are the linear regression fits.
-
Appendix 1—figure 8—source data 1
Related to Appendix 1—figure 8.
- https://cdn.elifesciences.org/articles/77634/elife-77634-app1-fig8-data1-v1.csv
Appendix 1—figure 9

Accuracy of the emulators used for each constrained sensitivity analysis of the spread of a genotype resistant to the long-acting drug used in monotherapy in each setting with low access to treatment (10%).
The comparison between the selection coefficients for the test dataset between the observed ‘truth’ from OpenMalaria, and the prediction from the emulators during the final round of adaptive sampling. The EIR is in inoculations per person per year (5, 10, or 500). The degree of resistance is the relative increase in the EC50 of the resistant genotype compared with the sensitive one. ‘Cor’ is the Spearman correlation coefficient, ‘RMSE’ is the root means squared error, and the blue lines are the linear regression fits.
-
Appendix 1—figure 9—source data 1
Related to Appendix 1—figure 9.
- https://cdn.elifesciences.org/articles/77634/elife-77634-app1-fig9-data1-v1.csv
Appendix 1—figure 10

Accuracy of the emulators used for each constrained sensitivity analysis of the spread of a genotype resistant to the long-acting drug used in monotherapy in each setting with high access to treatment (80%).
The comparison between the selection coefficients for the test dataset between the observed ‘truth’ from OpenMalaria, and the prediction from the emulators during the final round of adaptive sampling. The EIR is in inoculations per person per year (5, 10, or 500). The degree of resistance is the relative increase in the EC50 of the resistant genotype compared with the sensitive one. ‘Cor’ is the Spearman correlation coefficient, ‘RMSE’ is the root means squared error, and the blue lines are the linear regression fits.
-
Appendix 1—figure 10—source data 1
Related to Appendix 1—figure 10.
- https://cdn.elifesciences.org/articles/77634/elife-77634-app1-fig10-data1-v1.csv
Appendix 1—figure 11
Accuracy of the emulators used for each constrained sensitivity analysis of the spread of a genotype resistant to the short-acting drug, when used in combination with the long-acting drug, in each setting with low access to treatment (10%).
The comparison between the selection coefficients for the test dataset between the observed ‘truth’ from OpenMalaria, and the prediction from the emulators during the final round of adaptive sampling. The EIR is in inoculations per person per year (5, 10, or 500). The degree of resistance to the short-acting drug is the relative decrease in the Emax of the resistant genotype compared with the sensitive one. ‘Cor’ is the Spearman correlation coefficient, ‘RMSE’ is the root means squared error, and the blue lines are the linear regression fits.
-
Appendix 1—figure 11—source data 1
Related to Appendix 1—figure 11.
- https://cdn.elifesciences.org/articles/77634/elife-77634-app1-fig11-data1-v1.csv
Appendix 1—figure 12
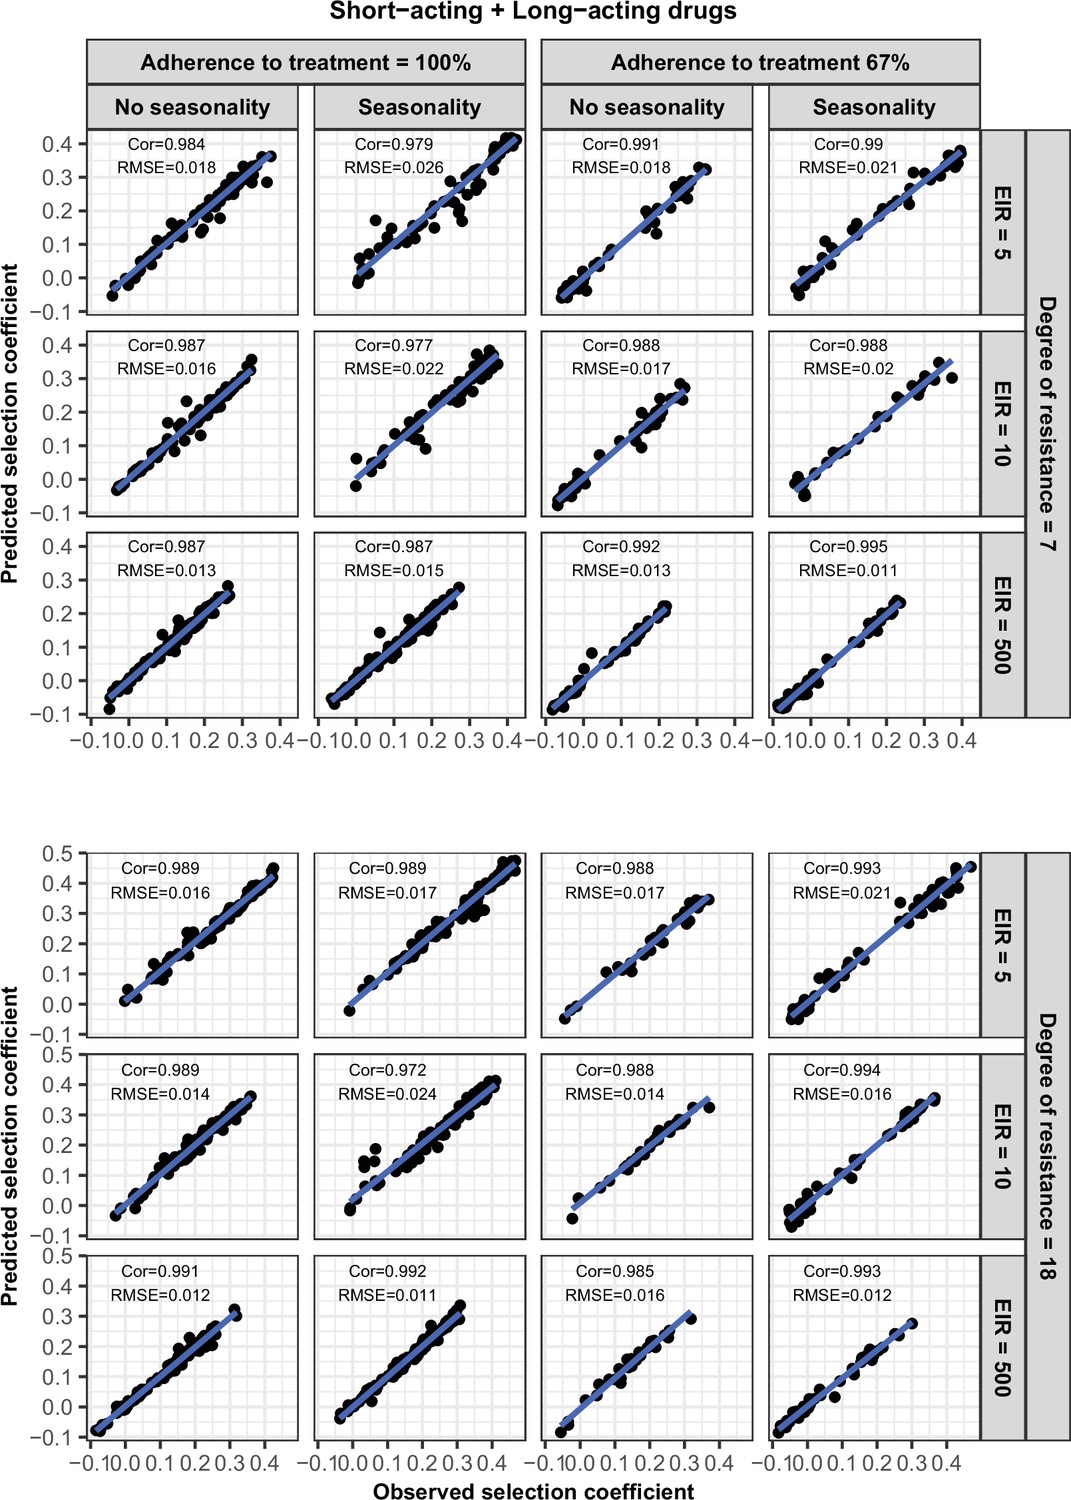
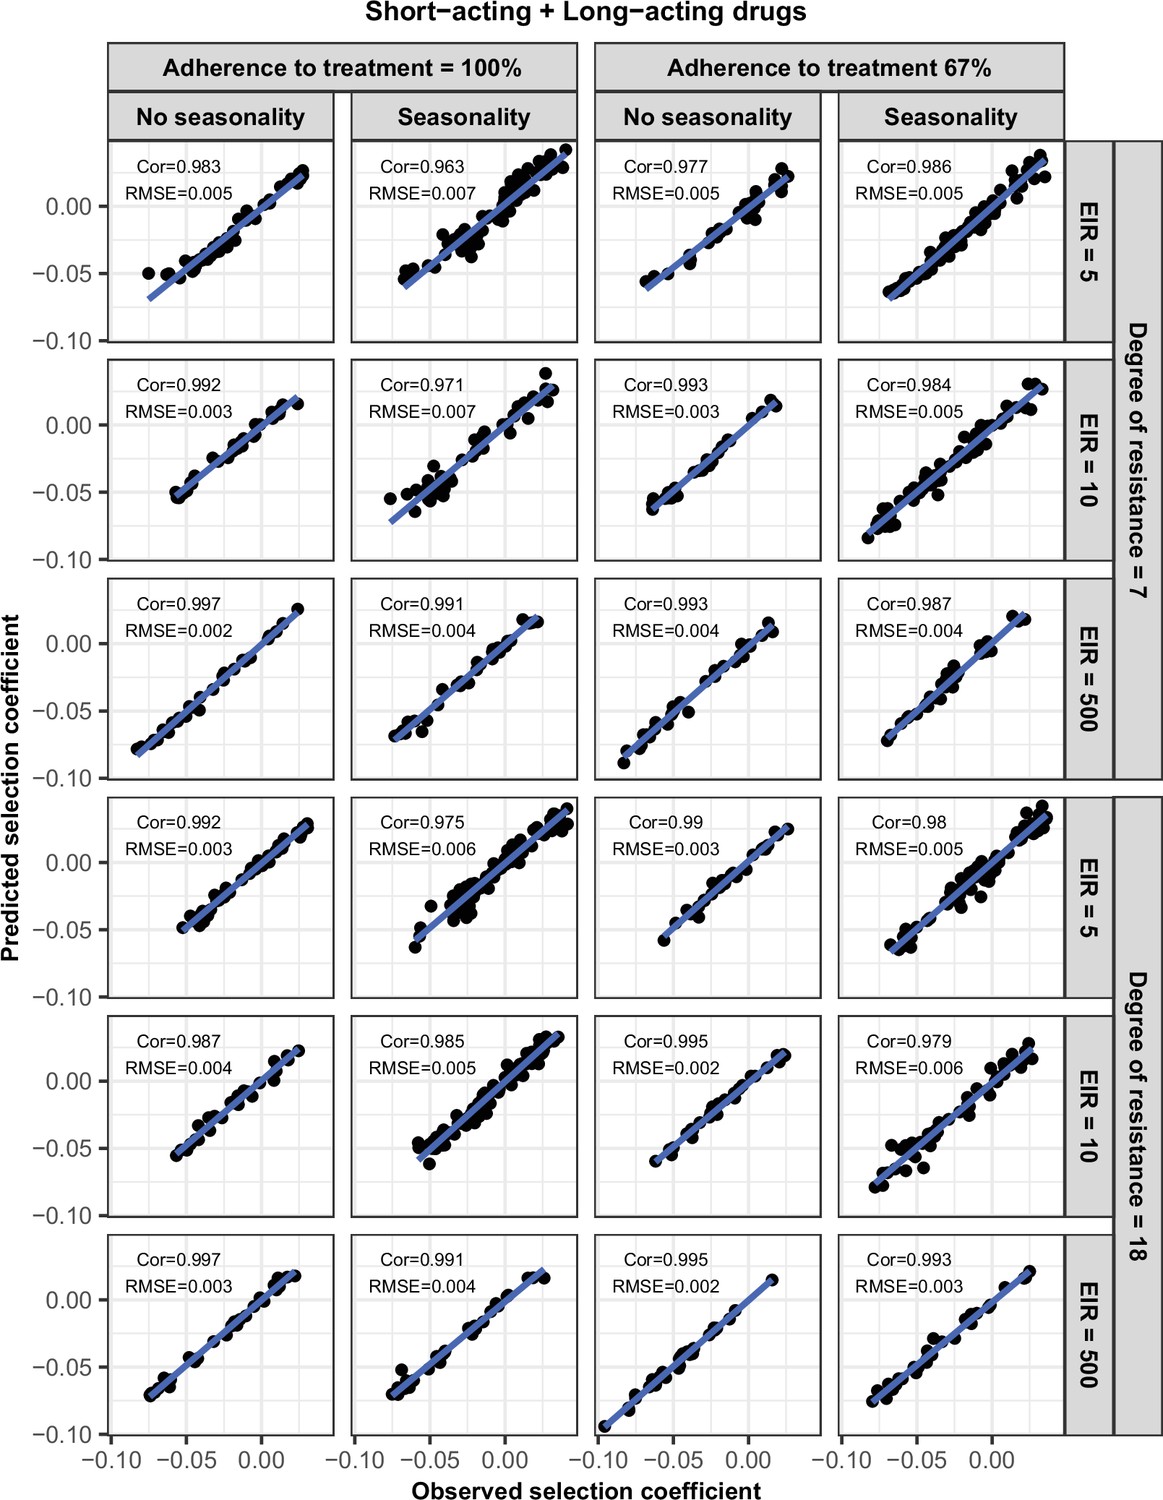
Accuracy of the emulators used for each constrained sensitivity analysis of the spread of a genotype resistant to the short-acting drug, when used in combination with the long-acting drug, in each setting with high access to treatment (80%).
The comparison between the selection coefficients for the test dataset between the observed ‘truth’ from OpenMalaria, and the prediction from the emulators during the final round of adaptive sampling. The EIR is in inoculations per person per year (5, 10, or 500). The degree of resistance to the short-acting drug is the relative decrease in the Emax of the resistant genotype compared with the sensitive one. ‘Cor’ is the Spearman correlation coefficient, ‘RMSE’ is the root means squared error, and the blue lines are the linear regression fits.
-
Appendix 1—figure 12—source data 1
Related to Appendix 1—figure 12.
- https://cdn.elifesciences.org/articles/77634/elife-77634-app1-fig12-data1-v1.csv
Appendix 1—figure 13
Schematic illustration of typical simulations run in OpenMalaria to estimate the probability of establishment of a drug-resistant genotype.
The brown curve represents the frequency of the resistant genotypes in inoculations. Phase 1 represents the burn-in phase. In the second phase, we introduced a drug to which resistant parasites were hypersensitive. In the last phase, we imported mutation conferring drug resistance at a low rate until one mutation established.
Author response image 1
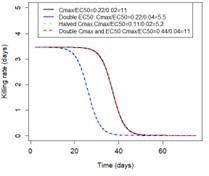
Illustration of the impact of Cmax/EC50 ratio on the duration of the drug killing effect The figure illustrates the drug killing rate post-treatment of drugs having various Cmax and EC50 values.
Tables
Table 1
Potential drivers of the spread of drug resistance.
List of factors and their parameter ranges investigated in the global sensitivity analyses of the spread of parasites resistant to each treatment profile. The parameter ranges were defined based on the literature as described in Materials and methods. Note that the parameter ranges of the short-acting drug captured the parameter values of typical artemisinin derivatives, and the parameter ranges of the long-acting drug captured the parameter values of partner drugs of artemisinin derivatives such as mefloquine, piperaquine, and lumefantrine. In addition, note that the ratio maximum drug concentration/half-maximal effective concentration (Cmax/EC50) is not a direct input of the model, but we varied this ratio by varying the EC50 of the sensitive genotype and the drug dosage (which impacted Cmax). We initially assessed the effect of Cmax and EC50 on the rate of spread independently; however, we found that the impact of the EC50 and the Cmax on the drug killing effect post-treatment depended on their ratio (see Materials and methods). A Latin hypercube sampling (LHS) algorithm was used to sample from the ranges of all parameters (Gramacy, 2007).
| Component | Determinant | Definition | Parameter range(References) | |
|---|---|---|---|---|
| Short-acting drug | Long-acting drug | |||
| Drug properties (PK/PD model) | Half-life | Time for the drug concentration to fall by 50% (days) | (0.035, 0.175) (Kay et al., 2013; Winter and Hastings, 2011) | (6, 22) (Charles et al., 2007; Staehli Hodel et al., 2013; Jullien et al., 2014; Karunajeewa et al., 2008; Maganda et al., 2015) |
| Emax | Maximum killing rate the drug can achieve (per day) | (27.5, 31.0) (Kay et al., 2013) | (3.45, 5.00) (Winter and Hastings, 2011) | |
| Cmax/EC50 | The ratio between the maximum drug concentration (Cmax) and the half-maximal effective concentrations (EC50) of the sensitive genotype. This calculated ratio captures the duration of the drug killing effect by capturing how high the Cmax is compared to the EC50 | (55.0–312.0) (Kay et al., 2013; Winter and Hastings, 2011) | (5.1–21.7) (Kay et al., 2013; Winter and Hastings, 2011) | |
| Parasite biology | Degree of resistance (PK/PD model) | For the short-acting drug: relative decrease of the Emax of the resistant genotype compared with the sensitive one For the long-acting drug: relative increase of the EC50 of the resistant genotype compared with the sensitive one (see Materials and methods) | (1, 50) | (1, 20) |
| Fitness cost | Relative reduction of the resistant genotype multiplication rate within the human host compared to the sensitive one | (1.0, 1.1) (Kublin et al., 2003; Mita et al., 2003) | ||
| Transmission level | Entomological inoculation rate | Mean number of infective mosquito bites received by an individual during a year (inoculations per person per year) | (5, 500) (Edwards et al., 2019a; Hay et al., 2000; Chaumeau et al., 2018; Edwards et al., 2019b; Yamba et al., 2020) | |
| Health system | Level of access to treatment | The probability of symptomatic cases to receive treatment within two weeks from the onset of symptom onset (%) | (10, 80) | |
| Diagnostic detection limit | Parasite density for which the probability of having a positive diagnostic test is 50% (parasites/μl) | (2, 50) (Kilian et al., 2000; Murray et al., 2008) | ||
-
PK/PD: pharmacokinetic-pharmacodynamics; Cmax: maximum drug concentration; EC50: half-maximal effective concentration.
Appendix 1—table 1
Pharmacokinetics (PK) and pharmacodynamics (PD) parameter values for the short-acting drug that were kept constant throughout the sensitivity analyses.
| Component | Parameter | Value | Reference |
|---|---|---|---|
| PK | Volume distribution (l/kg) | 1.49 | Kay et al., 2013 |
| Treatment dosage (mg/kg) | 4.00 | Kay et al., 2013; Winter and Hastings, 2011 | |
| PD | Slope of the effect curve | 4.00 | Kay et al., 2013; Winter and Hastings, 2011 |
Appendix 1—table 2
Pharmacokinetics (PK) and pharmacodynamics (PD) parameter values for the long-acting drug that were kept constant throughout the sensitivity analyses.
| Component | Parameter | Value | Reference |
|---|---|---|---|
| PK | Absorption rate (per day) | 11.16 | Staehli Hodel et al., 2013 |
| Rate at which the drug moves from the central compartment to the peripheral compartment (per day) | 8.46 | Staehli Hodel et al., 2013 | |
| Rate at which the drug moves from the peripheral compartment to the central compartment (per day) | 3.30 | Staehli Hodel et al., 2013 | |
| Volume distribution (l/kg) | 173.00 | Staehli Hodel et al., 2013 | |
| PD | Slope of the effect curve | 6.00 | Winter and Hastings, 2011; Staehli Hodel et al., 2013 |
Additional files
-
Transparent reporting form
- https://cdn.elifesciences.org/articles/77634/elife-77634-transrepform1-v1.docx
-
Appendix 1—figure 1—source data 1
Related to Appendix 1—figure 1.
- https://cdn.elifesciences.org/articles/77634/elife-77634-app1-fig1-data1-v1.csv
-
Appendix 1—figure 6—source data 1
Related to Appendix 1—figure 6.
- https://cdn.elifesciences.org/articles/77634/elife-77634-app1-fig6-data1-v1.csv
-
Appendix 1—figure 7—source data 1
Related to Appendix 1—figure 7.
- https://cdn.elifesciences.org/articles/77634/elife-77634-app1-fig7-data1-v1.csv
-
Appendix 1—figure 8—source data 1
Related to Appendix 1—figure 8.
- https://cdn.elifesciences.org/articles/77634/elife-77634-app1-fig8-data1-v1.csv
-
Appendix 1—figure 9—source data 1
Related to Appendix 1—figure 9.
- https://cdn.elifesciences.org/articles/77634/elife-77634-app1-fig9-data1-v1.csv
-
Appendix 1—figure 10—source data 1
Related to Appendix 1—figure 10.
- https://cdn.elifesciences.org/articles/77634/elife-77634-app1-fig10-data1-v1.csv
-
Appendix 1—figure 11—source data 1
Related to Appendix 1—figure 11.
- https://cdn.elifesciences.org/articles/77634/elife-77634-app1-fig11-data1-v1.csv
-
Appendix 1—figure 12—source data 1
Related to Appendix 1—figure 12.
- https://cdn.elifesciences.org/articles/77634/elife-77634-app1-fig12-data1-v1.csv
Download links
A two-part list of links to download the article, or parts of the article, in various formats.
Downloads (link to download the article as PDF)
Open citations (links to open the citations from this article in various online reference manager services)
Cite this article (links to download the citations from this article in formats compatible with various reference manager tools)
The influence of biological, epidemiological, and treatment factors on the establishment and spread of drug-resistant Plasmodium falciparum
eLife 11:e77634.
https://doi.org/10.7554/eLife.77634


