Excitatory and inhibitory D-serine binding to the NMDA receptor
- Department of Biophysics and Biophysical Chemistry, Johns Hopkins University School of Medicine, United States
- W.M. Keck Structural Biology Laboratory, Cold Spring Harbor Laboratory, United States
- Department of Biology, Johns Hopkins University, United States
Figures
Figure 1 with 4 supplements
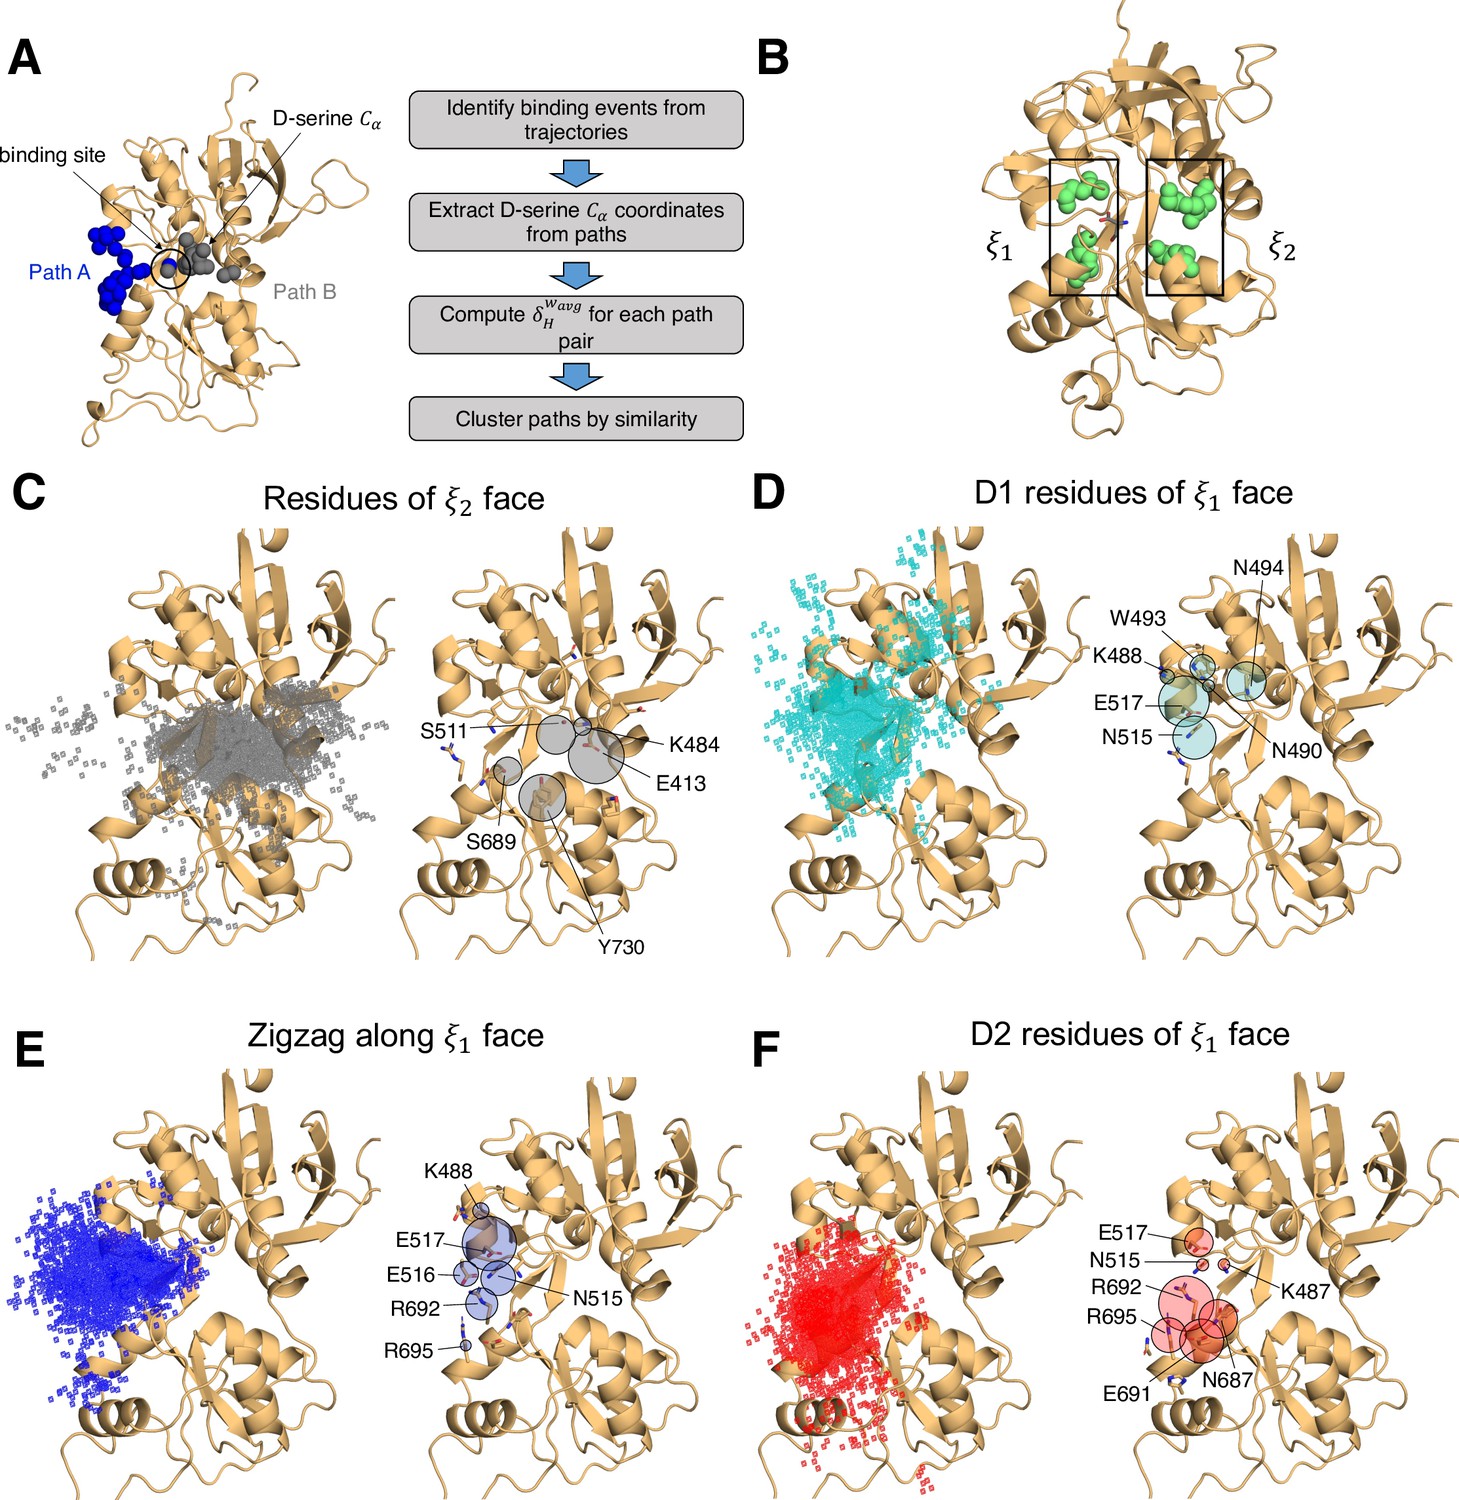
Identifying D-serine binding pathways for GluN2A using pathway similarity analysis (PSA).
(A) Overview of the PSA workflow for quantifying similarity between D-serine binding pathways. (B) 2-dimensional order parameter () that describes the degree of GluN2A LBD closure. For each of the above (C–F), the left image shows D-serine density, while the right image shows the residues most frequently contacted by D-serine as it enters/leaves the binding site for each cluster. Labeled residues demonstrate ≥ 0.2 fractional occurrence defined relative to the most contacted residue in each cluster, but all residues with ≥ 0.1 fractional occurrence are shown in stick representation (see Figure 1—source data 3). (C) Cluster 1 involves residues of the face of the LBD. (D) Cluster 2 involves residues of the face of the D1 lobe. (E) In Cluster 3, D-serine zigzags between D1 and D2 lobe residues of the face. (F) Cluster 4 primarily involves D2 lobe residues on the face.
-
Figure 1—source data 1
Simulation summary: overview of simulation systems.
- https://cdn.elifesciences.org/articles/77645/elife-77645-fig1-data1-v1.xlsx
-
Figure 1—source data 2
Record of all successful binding pathways in each simulation system for D-serine binding to GluN2A.
- https://cdn.elifesciences.org/articles/77645/elife-77645-fig1-data2-v1.xlsx
-
Figure 1—source data 3
Per-residue contact frequency analysis for D-serine binding to GluN2A by cluster identified with PSA.
- https://cdn.elifesciences.org/articles/77645/elife-77645-fig1-data3-v1.xlsx
-
Figure 1—source data 4
GluN2A residues most frequently contacted by D-serine given that the pathway results in successful binding – listed for each simulation system.
- https://cdn.elifesciences.org/articles/77645/elife-77645-fig1-data4-v1.xlsx
Figure 1—figure supplement 1
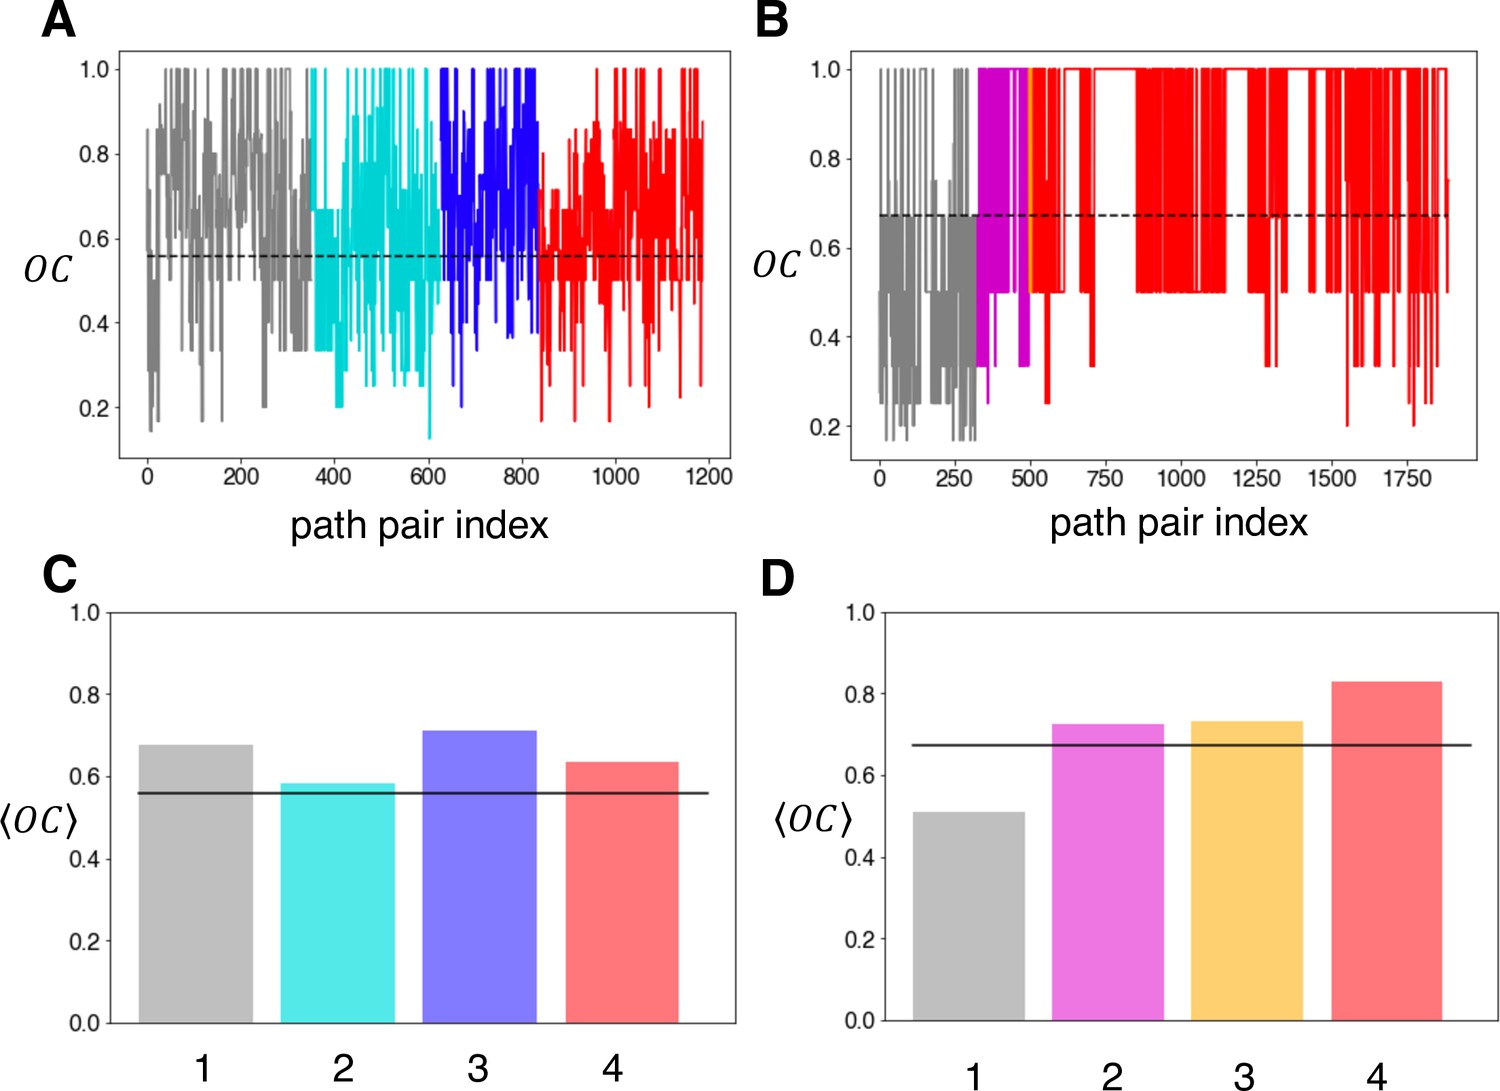
Overlap coefficient analysis for GluN2A and GluN1 binding pathways.
This figure supplement relates to Figures 1 and 2. The overlap coefficient was computed for each pair of paths within each cluster for (A) GluN2A and (B) GluN1. The dotted line in each plot indicates the global mean = 0.557 for GluN2A and = 0.671 for GluN1. The mean for each cluster was computed for (C) GluN2A and (D) GluN1. For reference, the black solid line indicates the global mean.
Figure 1—figure supplement 2
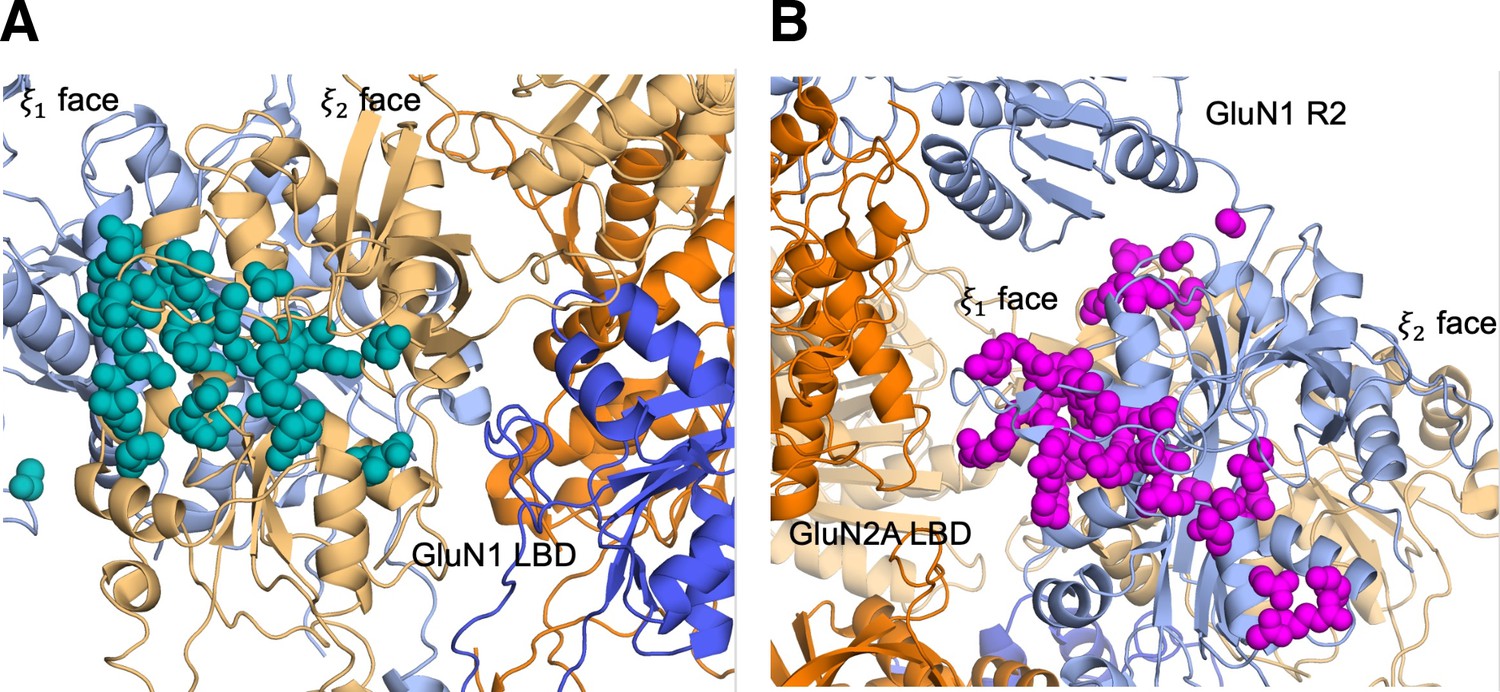
D-serine pathway residues mapped onto the intact GluN2A NMDAR (PDB ID: 6MMM Hansen et al., 2021).
Figure 1—figure supplement 3
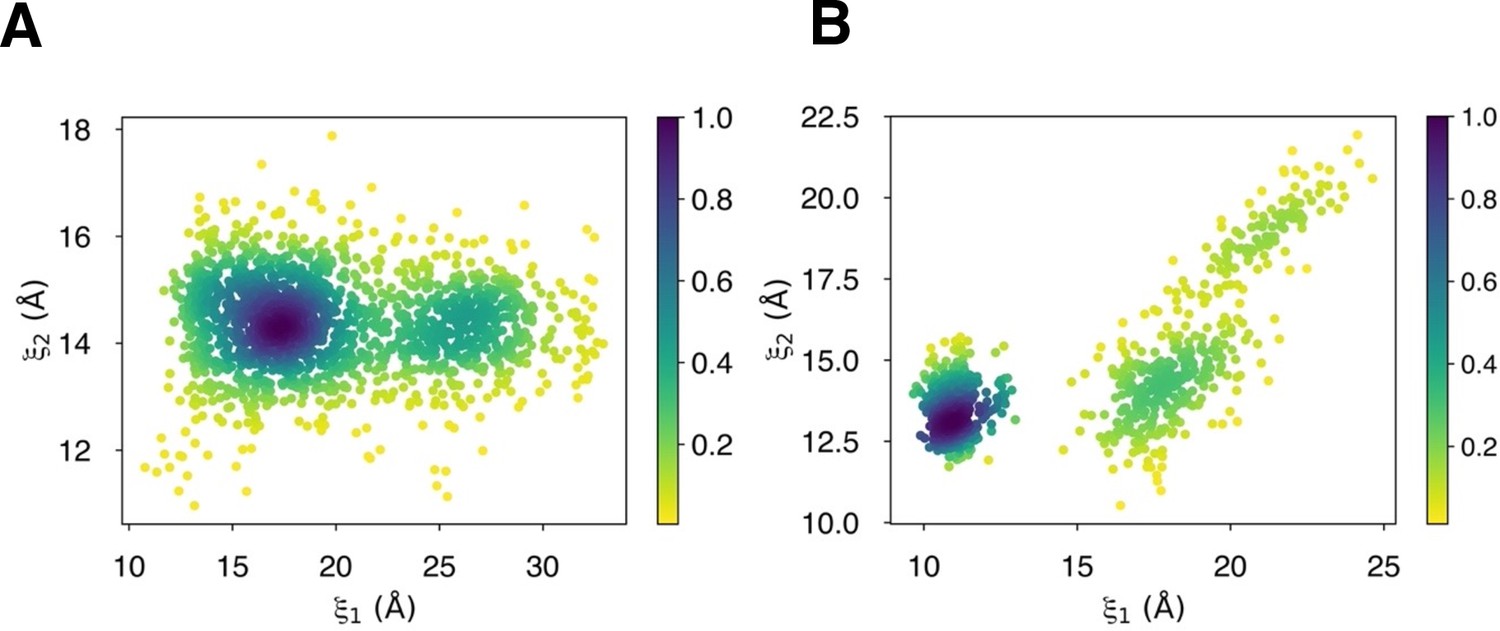
Degree of LBD closure during D-serine binding pathways to (A) GluN2A and (B) GluN1.
Figure 1—figure supplement 4
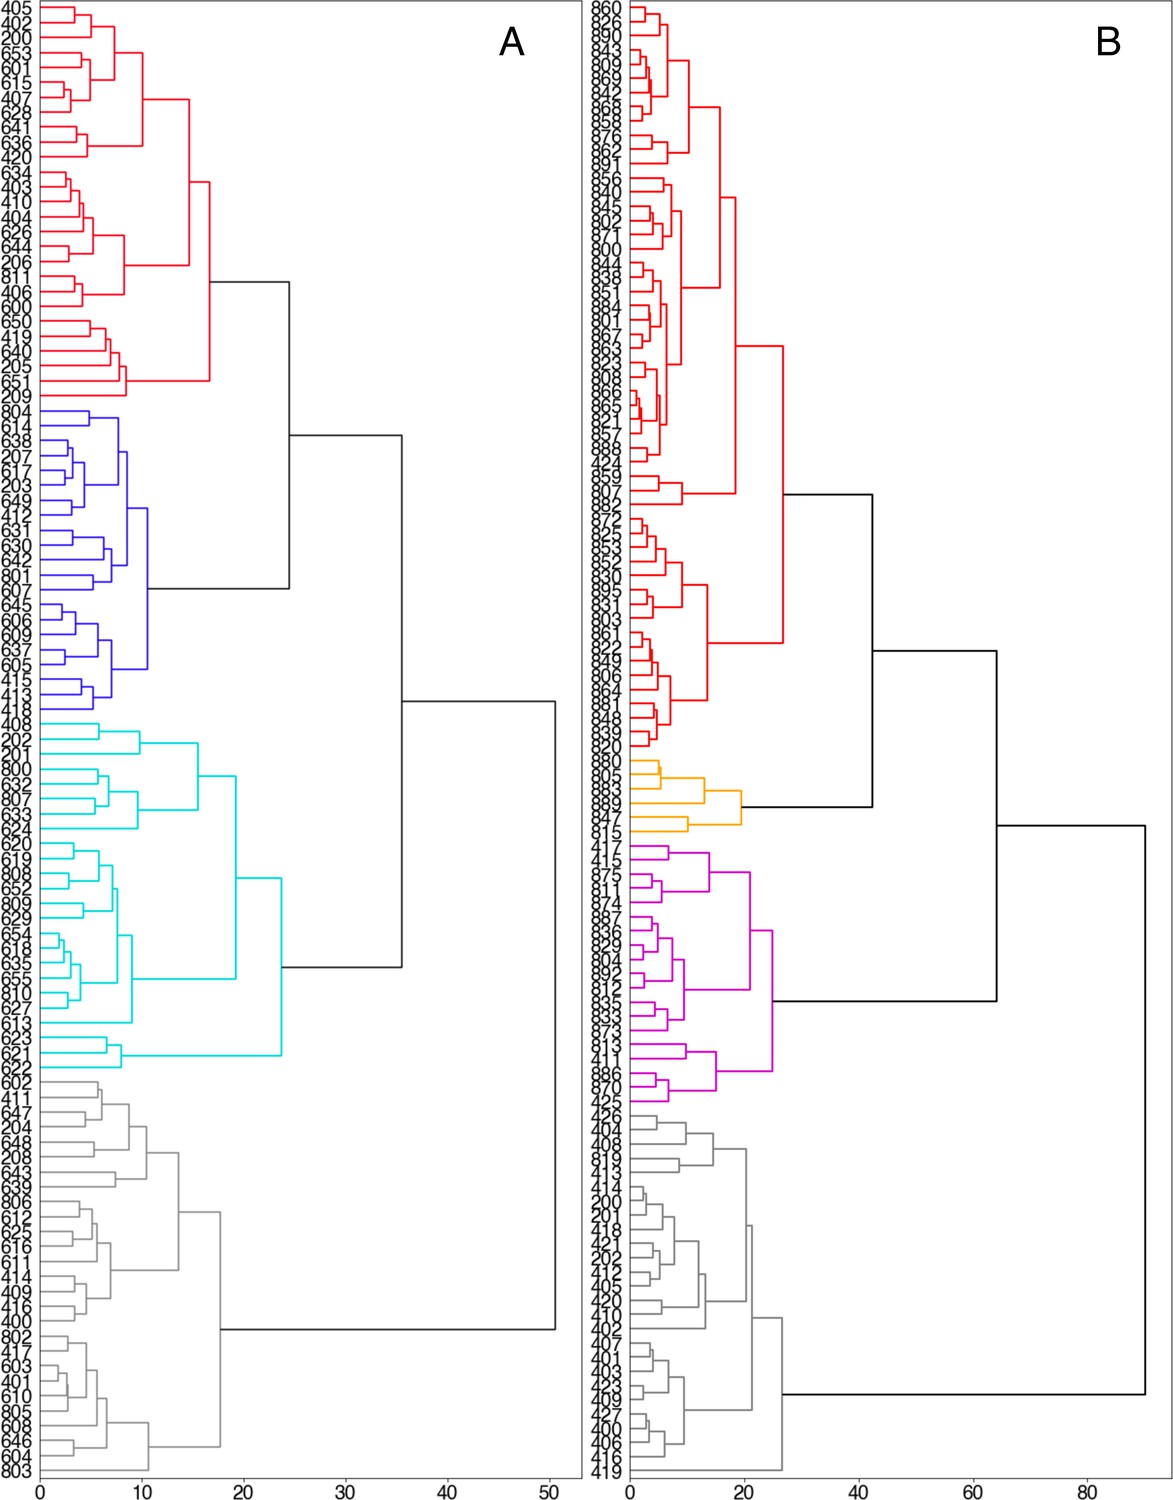
Dendrograms for hierarchical clustering of weighted average Hausdorff distances for D-serine binding pathways for (A) GluN2A and (B) GluN1 according to the Ward linkage criterion.
Figure 2
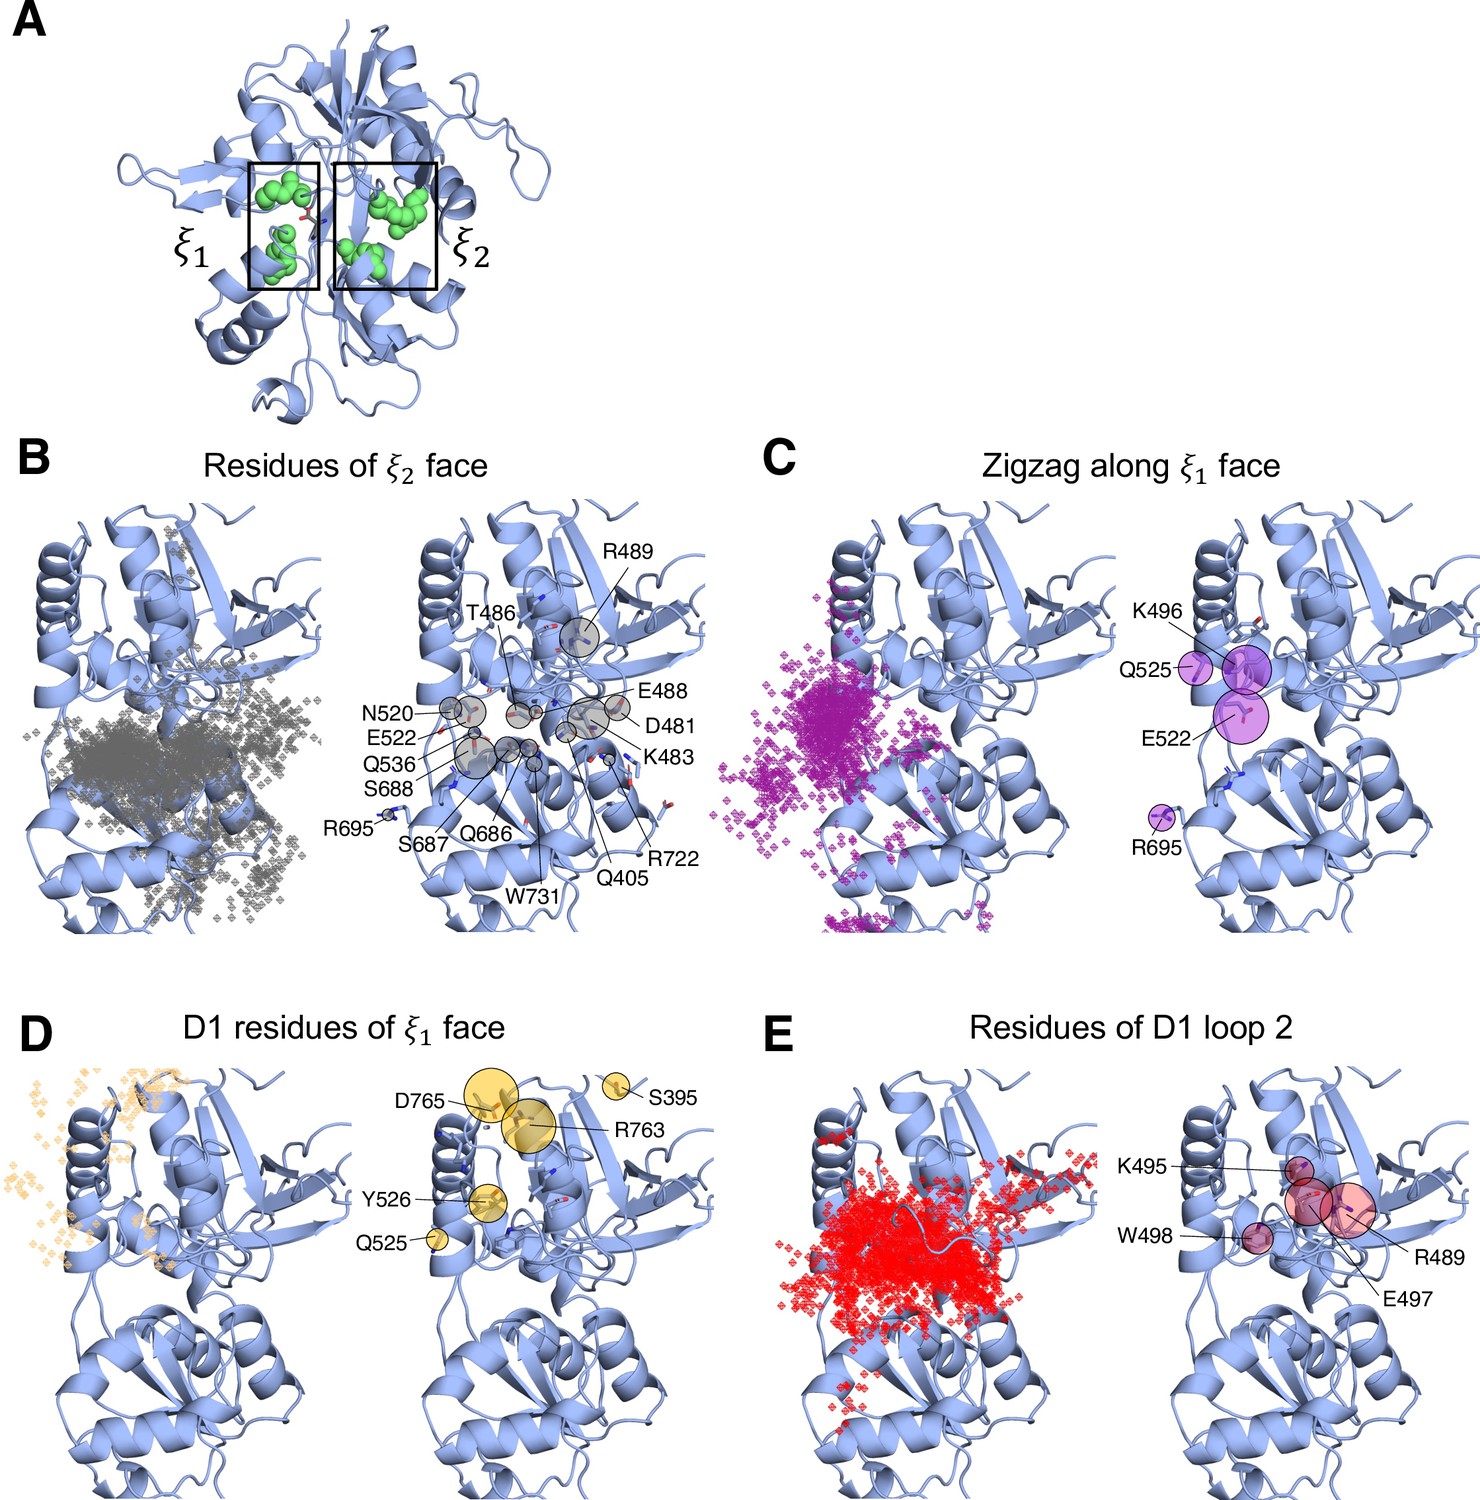
Identifying D-serine binding pathways for GluN1 using pathway similarity analysis (PSA).
(A) 2-dimensional order parameter () that describes the degree of GluN1 LBD closure. For each of the above (B–E), the left image shows D-serine density, while the right image shows the residues most frequently contacted by D-serine as it enters/leaves the binding site for each cluster. Labeled residues demonstrate ≥ 0.2 fractional occurrence defined relative to the most contacted residue in each cluster, but all residues with ≥ 0.1 fractional occurrence are shown in stick representation (see Figure 2—source data 2). (B) In Cluster 1, D-Serine contacts residues on the face of the LBD. (C) Cluster 2 involves interactions with both D1 and D2 residues of the face. (D) Cluster 3 involves contacts with residues at the top of the D1 lobe on the face. (E) Cluster 4 is defined by interactions with D1 loop 2 that reaches into solution.
-
Figure 2—source data 1
Record of all successful binding pathways in each simulation system for D-serine binding to GluN1.
- https://cdn.elifesciences.org/articles/77645/elife-77645-fig2-data1-v1.xlsx
-
Figure 2—source data 2
Per residue contact frequency analysis for D-serine binding to GluN1 by cluster identified with PSA.
- https://cdn.elifesciences.org/articles/77645/elife-77645-fig2-data2-v1.xlsx
-
Figure 2—source data 3
GluN1 residues most frequently contacted by D-serine given that the pathway results in successful binding – listed for each simulation system.
- https://cdn.elifesciences.org/articles/77645/elife-77645-fig2-data3-v1.xlsx
Figure 3 with 2 supplements

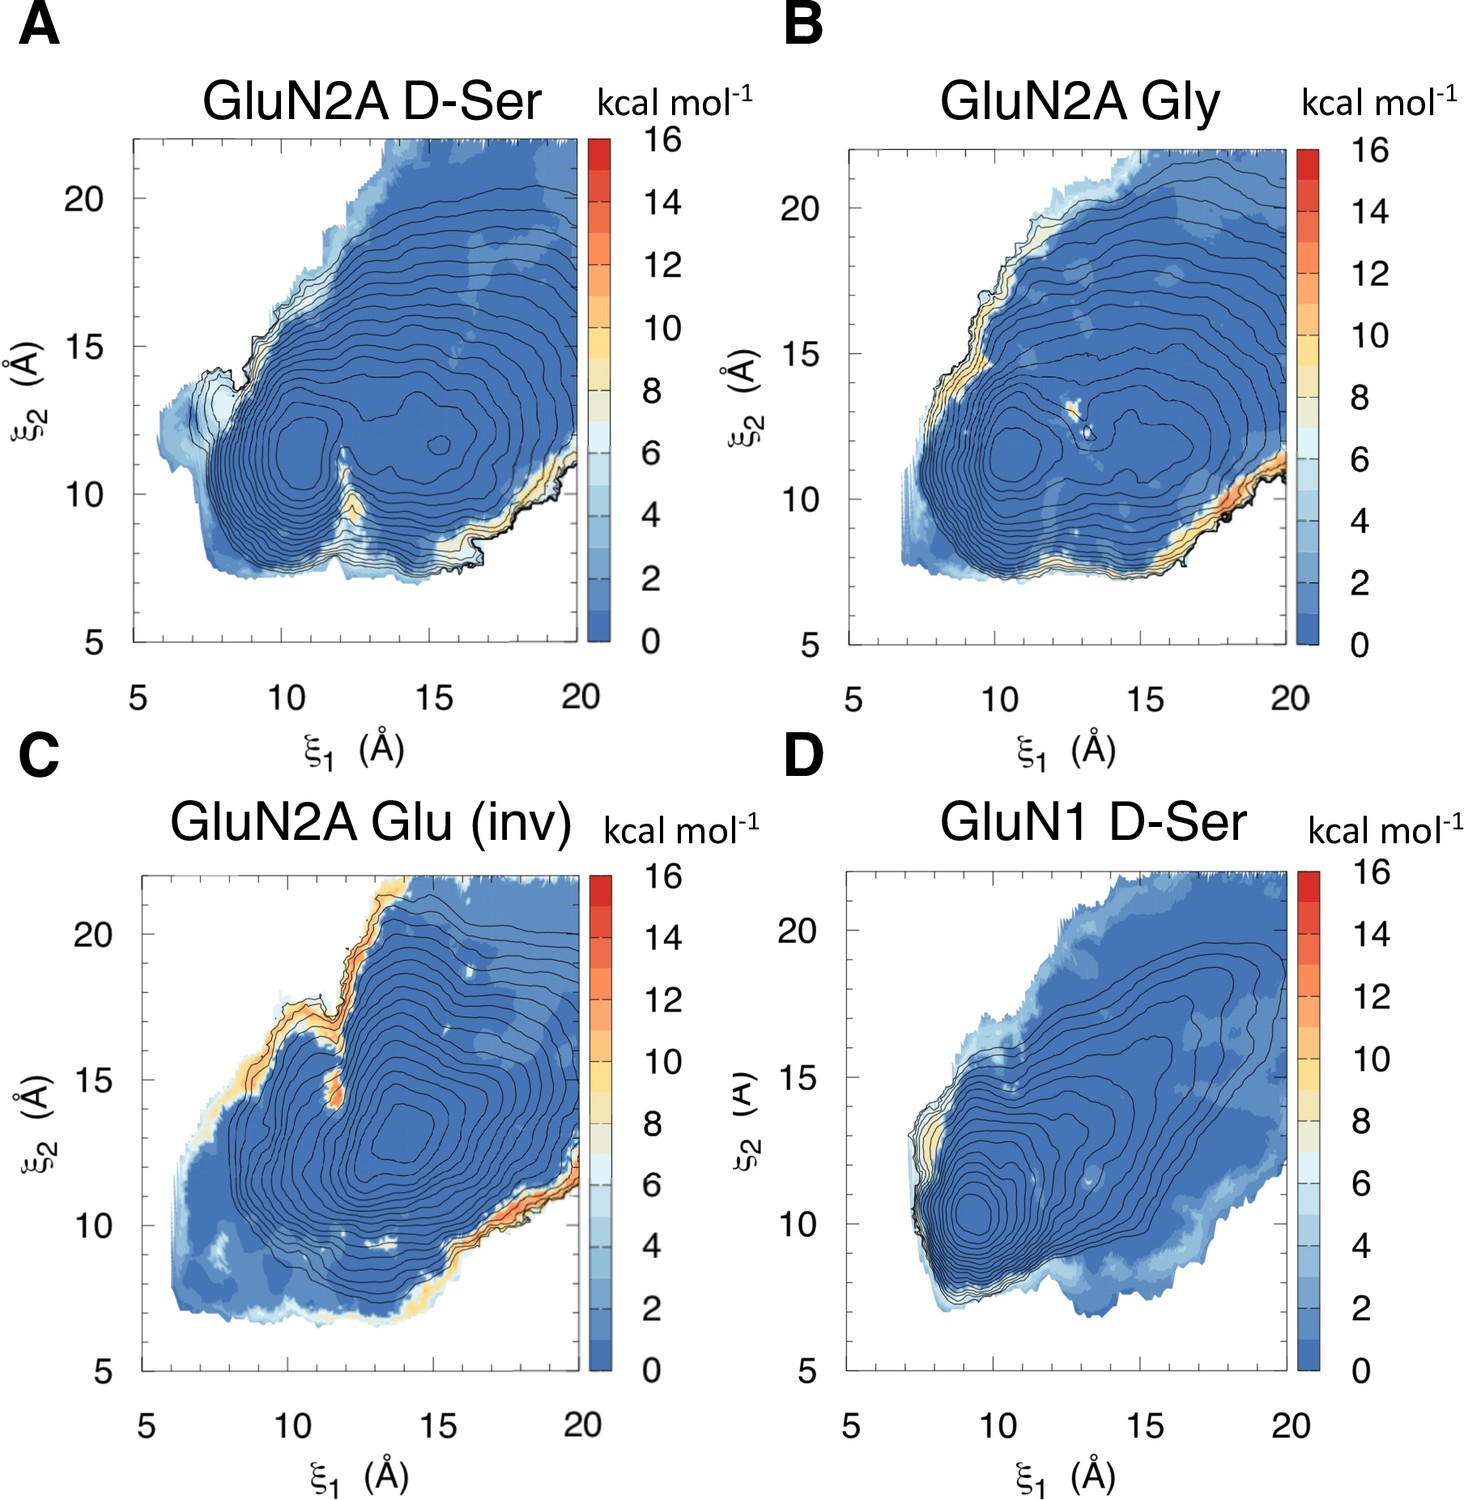
Conformational free energy landscapes for GluN2A and GluN1 LBDs.
Umbrella sampling molecular dynamics simulations were used to compute the potential of mean force (PMF) along the () order parameter for (A) D-serine bound to GluN2A, (B) glycine bound to GluN2A, (C) apo GluN2A previously computed in [196], (D) glutamate bound to GluN2A in its crystallographic pose previously computed in [196], (E) glutamate bound to GluN2A in the inverted pose identified in [218], (F) D-serine bound to GluN1, (G) glycine bound to GluN1 previously computed in [196], (H) apo GluN1 previously computed in Yao et al., 2013.
-
Figure 3—source data 1
Per-residue contact frequency analysis of the bound state for each agonist computed from lowest-energy conformers extracted from umbrella sampling simulations.
- https://cdn.elifesciences.org/articles/77645/elife-77645-fig3-data1-v1.xlsx
Figure 3—figure supplement 1
GluN2A residues contacting D-serine in lowest-energy conformers.
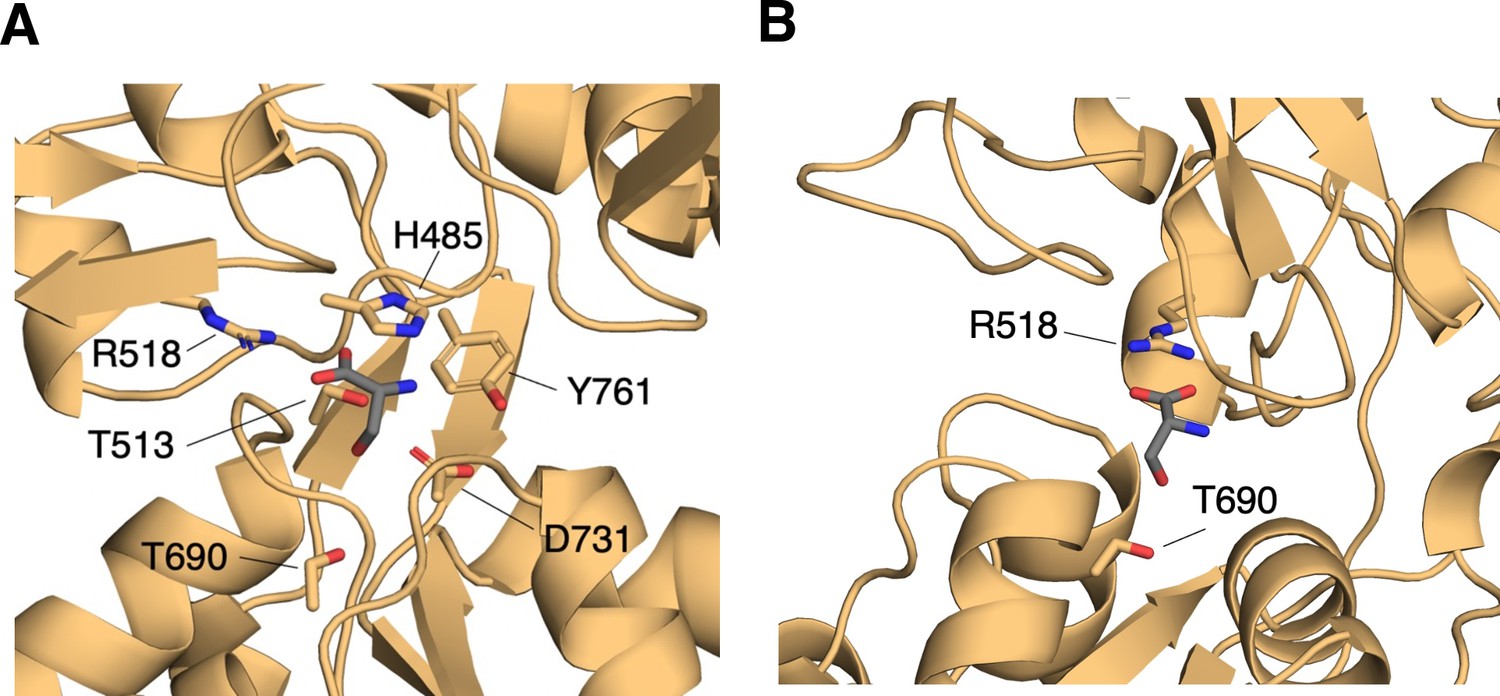
(A) Binding-site residues for D-serine bound to the GluN2A LBD computed from lowest-energy conformers (1 kcal mol–1) from umbrella sampling simulations. Residues with >50% contact frequency in the ensemble of lowest-energy conformers are labeled here. (B) D-serine interaction with Thr-690 present in lowest-energy conformers.
Figure 3—figure supplement 2
Error of umbrella sampling PMFs computed by block averaging for (A) D-serine bound to GluN2A, (B) glycine bound to GluN2A, (C) glutamate bound to GluN2A in the inverted pose, and (D) D-serine bound to GluN1.
The colors of the colorbar correspond to the standard deviation in kcal mol–1, which was computed for each window over 10 blocks.
Figure 4

D-serine competes glutamate binding as an antagonist at high concentration.
(A) Representative Two-electrode voltage clamp (TEVC) recording on GluN1/GluN2A NMDARs expressing oocytes. The traces show inhibition of the NMDAR current by the GluN1 agonists D-serine (left) and glycine (right) at a high concentration. 6 μM of glutamate is present throughout the recording. (B) D-serine inhibition at various concentrations of glutamate (1, 3, 10, and 30 μM). . (C) Glutamate responses at various concentrations of D-serine (0.123, 0.37, 3.33 and 10 mM) (left). Schild plot analysis of D-serine competition against glutamate (right). The calculated slope of the Schild plot was 1.11 ± 0.13 and the intercept was 2.38 ± 0.26. DR stands for dose ratio. (D) D-serine inhibition curves (left) and IC50 values for various pathway residue mutants on GluN1 and GluN2A LBDs (right). The pairwise comparison shows that the changes in IC50 values of the mutants from the wild type are significant. The statistical analysis was done by two-tail t-test where the p values are GluN1a-R694A = 0.0061, GluN1a-R695A = 0.0065, GluN2A-R692A = 4.1 × 10⁻⁹, and GluN2A-R695A = 3.3 × 10⁻⁵. All experiments were repeated in at least four independent oocytes. Error bars represent the average current ± SD.
Figure 5
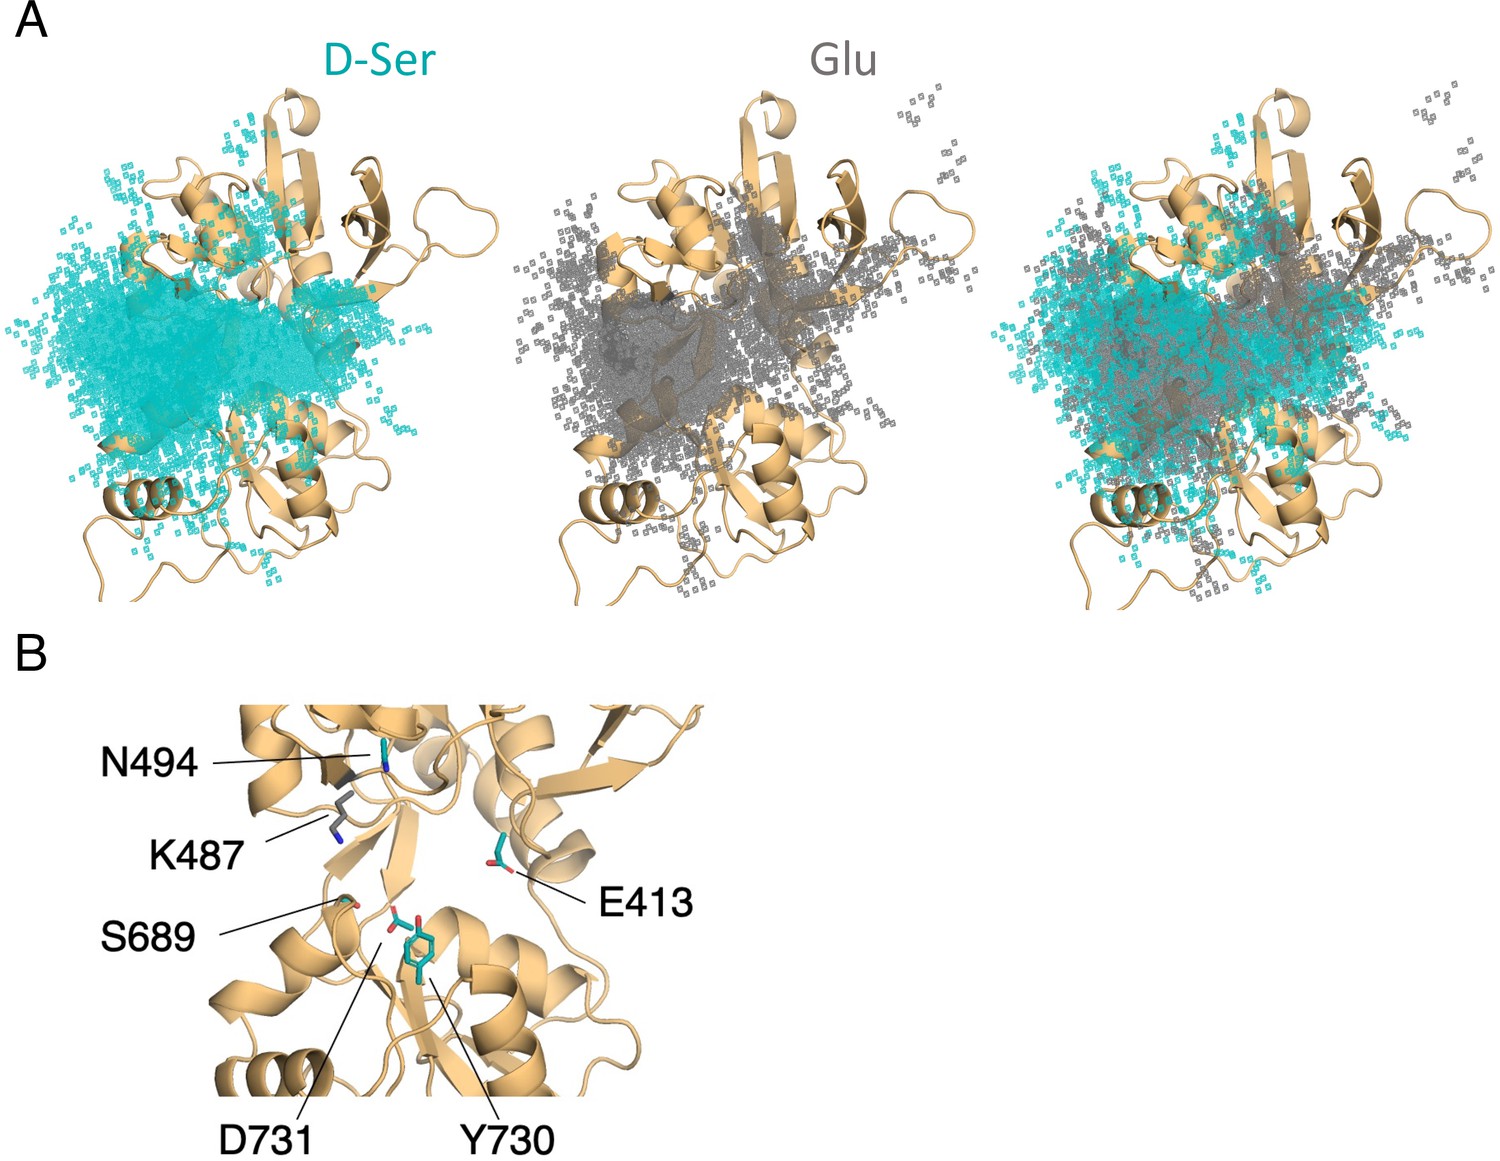
Comparison of D-serine and glutamate binding to GluN2A.
(A) Overlay of D-serine (teal) and glutamate (gray) density. (B) Residues that distinguish D-serine (teal) from glutamate (gray) binding pathways (see Figure 5—source data 2).
-
Figure 5—source data 1
Record of all successful binding pathways in each simulation system for glutamate binding to GluN2A.
- https://cdn.elifesciences.org/articles/77645/elife-77645-fig5-data1-v1.xlsx
-
Figure 5—source data 2
Comparison of relative residue contact frequency for D-serine and glutamate.
- https://cdn.elifesciences.org/articles/77645/elife-77645-fig5-data2-v1.xlsx
Figure 6 with 2 supplements
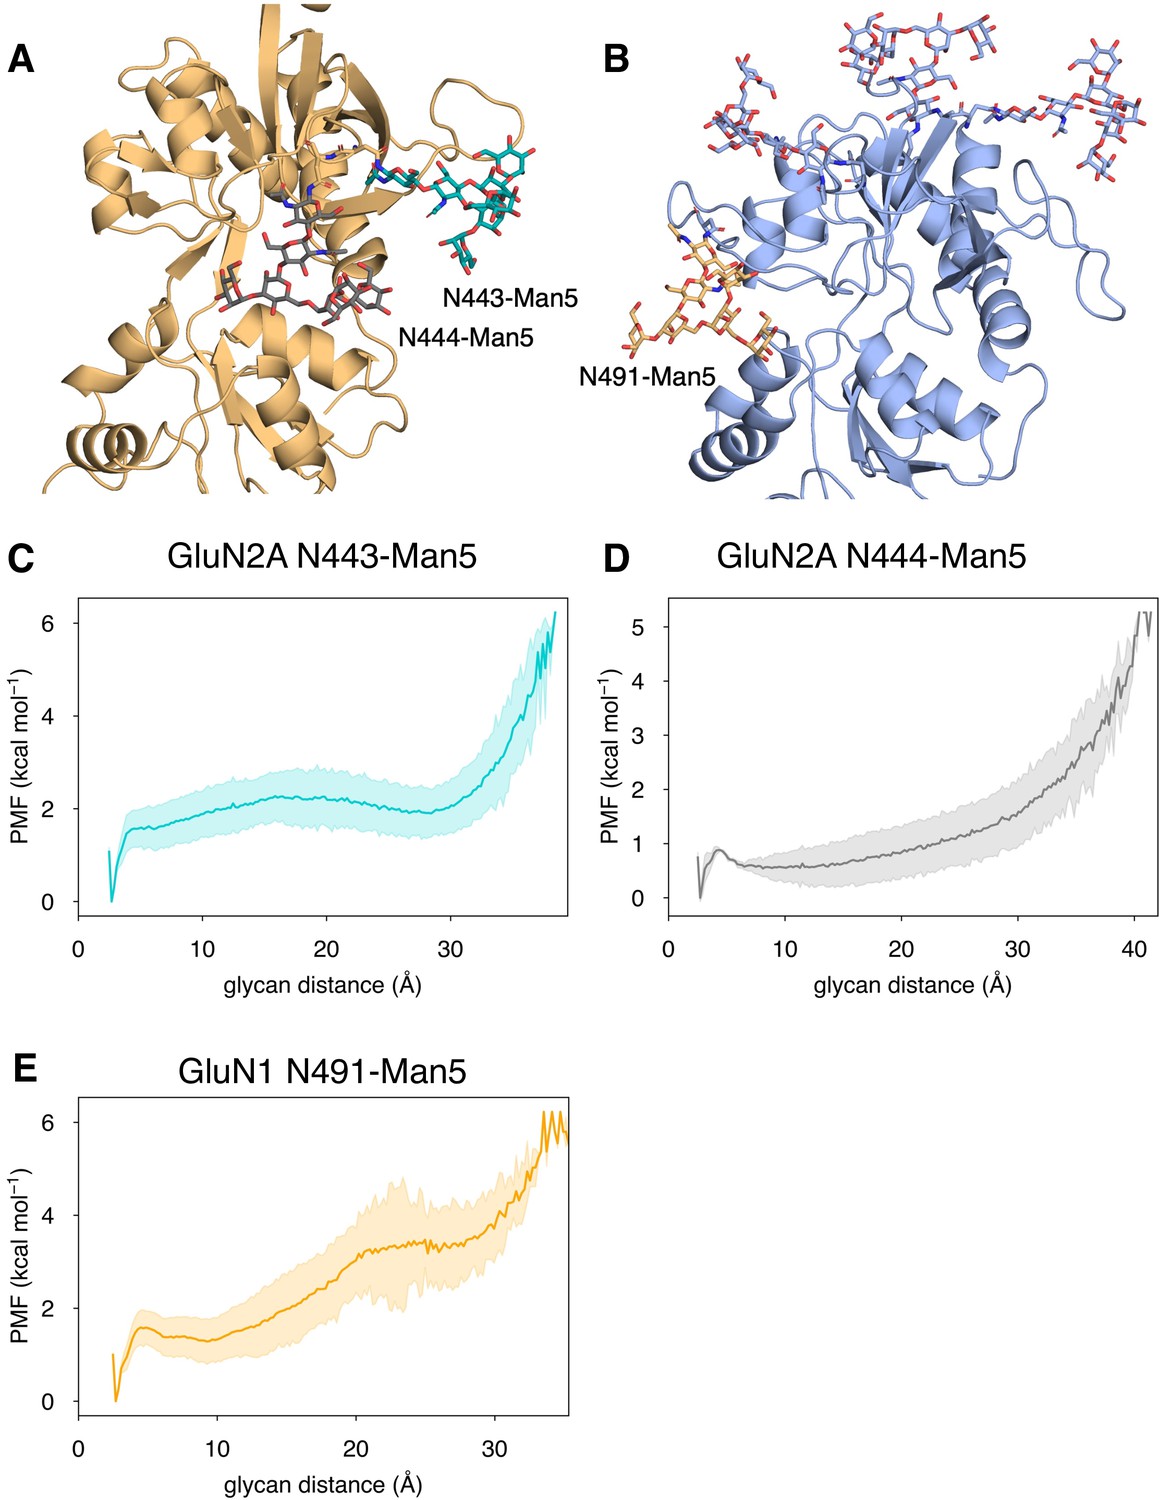
Conformational dynamics of near-pocket glycans.
N-linked Man5GlcNAc2 (Man5) glycans (A) N443-Man5 and N444-Man5 for GluN2A and (B) N491-Man5 for GluN1. Glycan conformational energy landscapes for (C) GluN2A N443-Man5, (D) GluN2A N444-Man5, and (E) GluN1 N491-Man5 were obtained by computing the minimum distance between all glycan heavy atoms and D2 lobe residues and binning the distribution from all glycosylated simulation systems. Shaded error regions were computed using a block-averaging scheme described in Methods.
-
Figure 6—source data 1
Comparison of relative residue contact frequency during GluN2A and GluN1 binding pathways for glycosylated and non-glycosylated simulations.
- https://cdn.elifesciences.org/articles/77645/elife-77645-fig6-data1-v1.xlsx
Figure 6—figure supplement 1
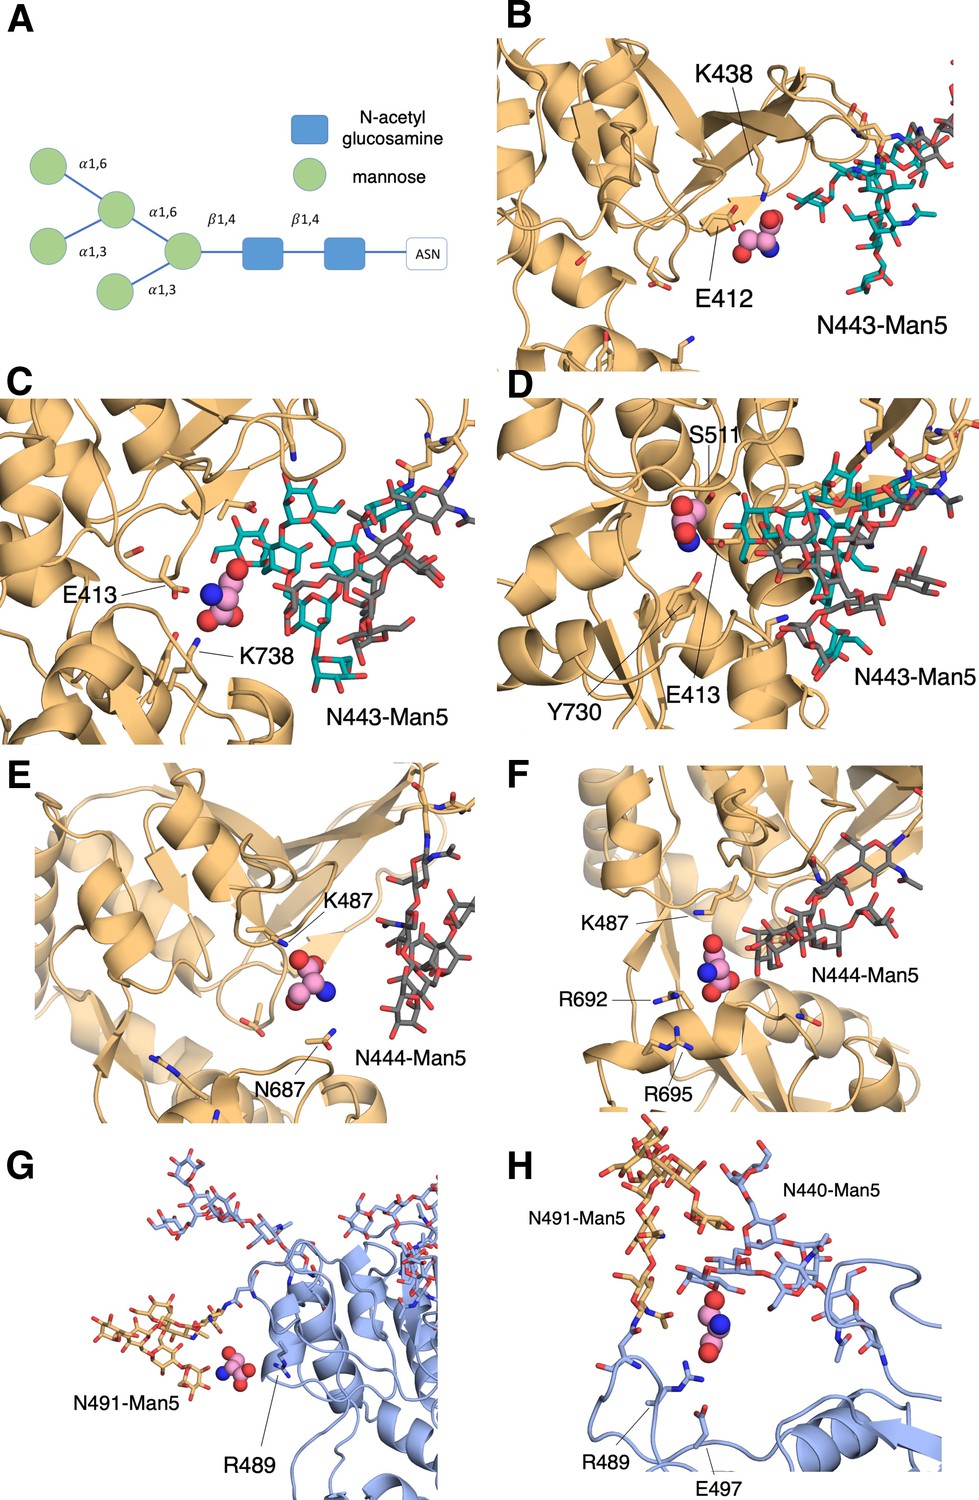
N-linked Man5GlcNAc2 (Man5) glycans interacts with D-serine as it binds.
(A) Schematic of the Man5 glycan. (B) Contact network involving the GluN2A N443-Man5 glycan and residues Glu-412 and, Lys-438, (C) Lys-738 and Glu-413, (D) Glu-413,Tyr-730, and Ser-511. (E) Contact network involving the GluN2A N444-Man5 glycan and residues Lys-487 and Asn-687, (F) Lys-487, Arg-692, and Arg-695. (G) Contact network formed between D-serine, the GluN1 N491-Man5 glycan, and Arg-489. (H) Additional GluN1 contact network formed between both GluN1 N491-Man5 and N440-Man5 glycans, residues Arg-489 and Glu-497, and D-serine.
Figure 6—figure supplement 2
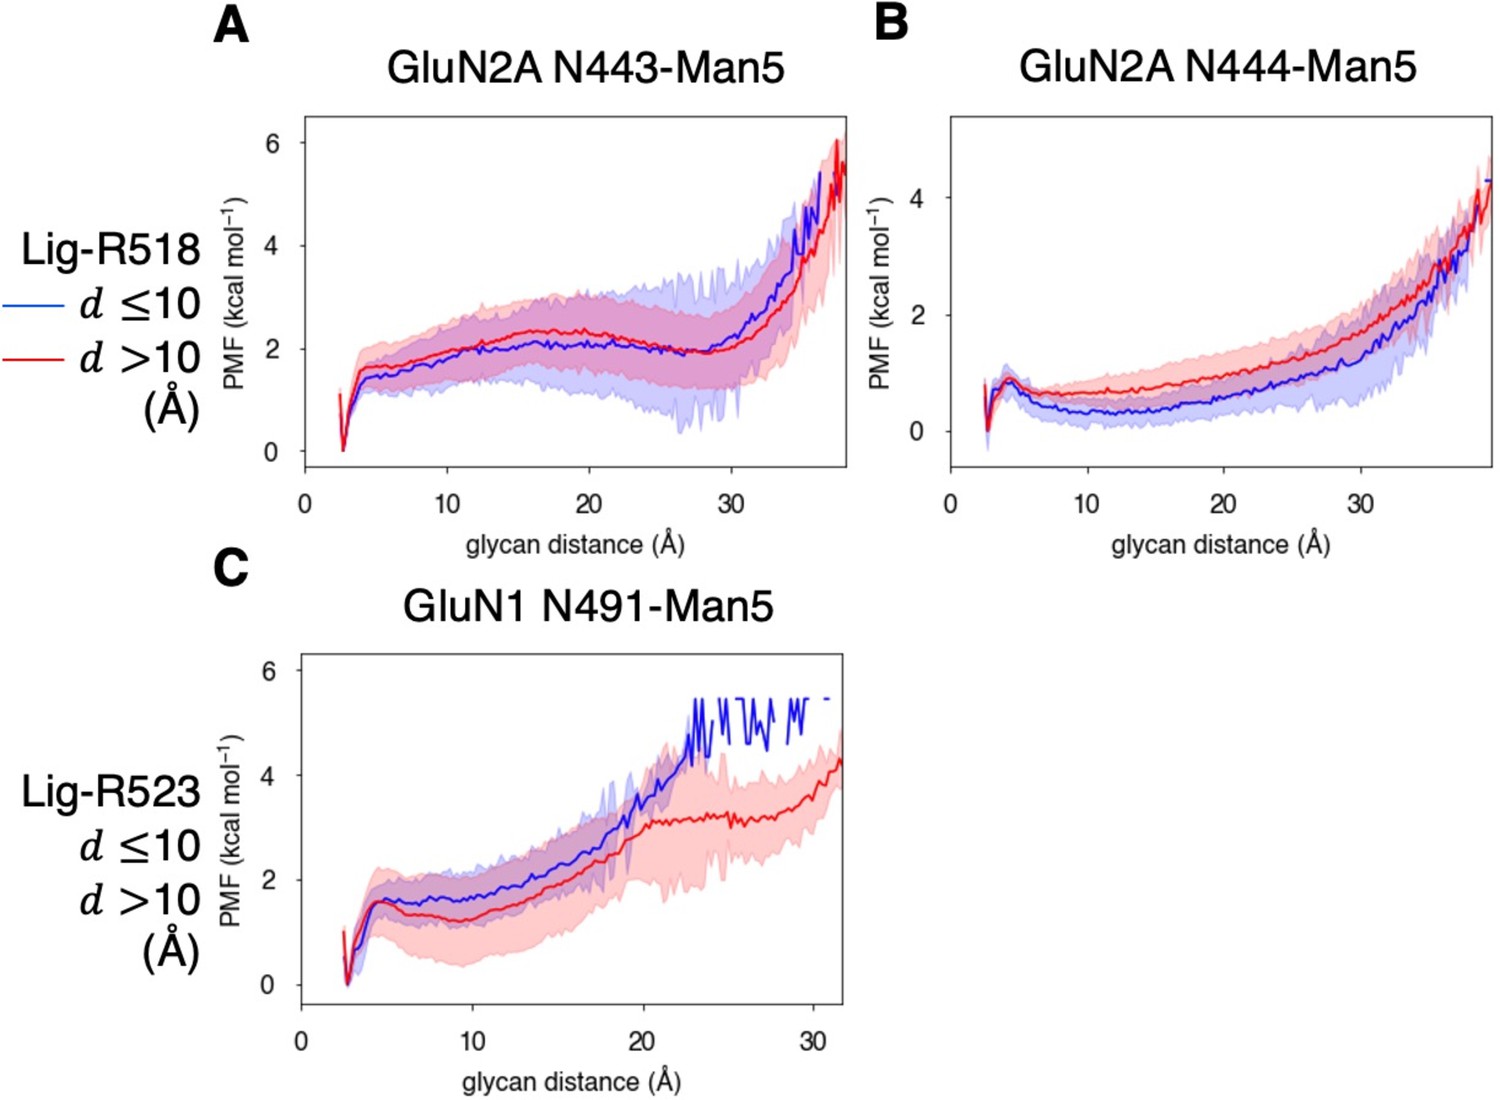
Glycan-D2 distance dependence on agonist binding for the (A) GluN2A N443-Man5 glycan, (B) GluN2A N444-Man5 glycan, and (C) GluN1 N491-Man5 glycan.
Figure 7
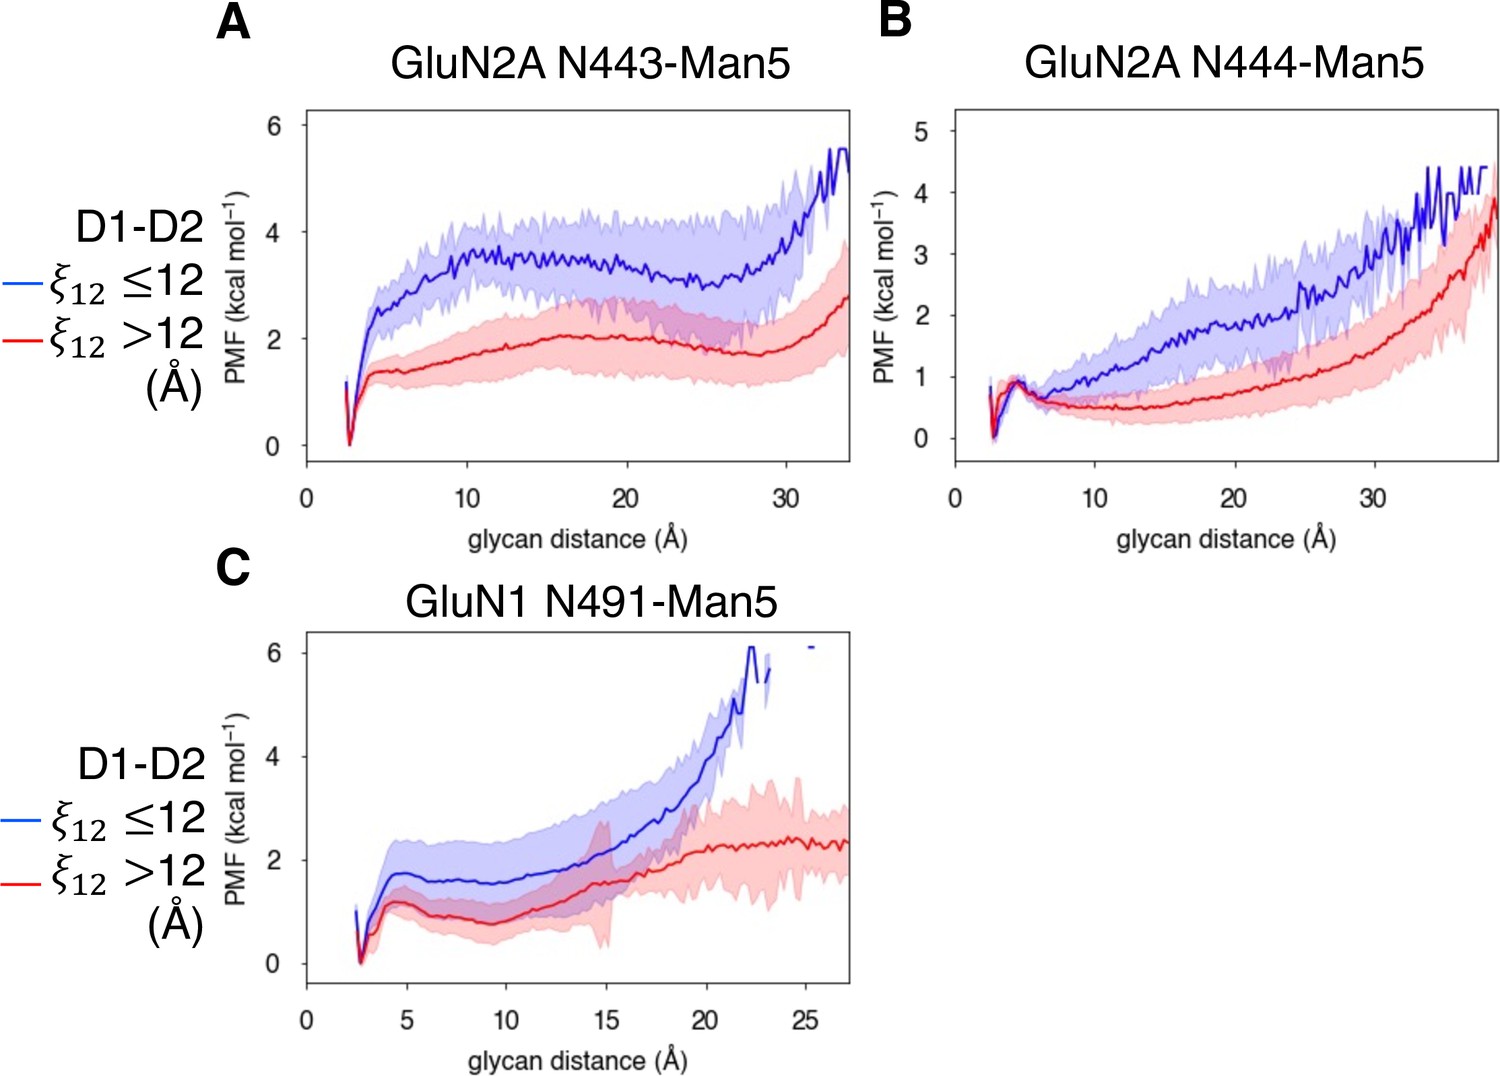
Glycan-D2 distance dependence on LBD closure for the (A) GluN2A N443-Man5 glycan, (B) GluN2A N444-Man5 glycan, and (C) GluN1 N491-Man5 glycan.
Videos
Video 1
Process of D-serine binding to the GluN2A LBD.
Video 2
Process of D-serine binding to the GluN1 LBD.
Additional files
Download links
A two-part list of links to download the article, or parts of the article, in various formats.
Downloads (link to download the article as PDF)
Open citations (links to open the citations from this article in various online reference manager services)
Cite this article (links to download the citations from this article in formats compatible with various reference manager tools)
Excitatory and inhibitory D-serine binding to the NMDA receptor
eLife 11:e77645.
https://doi.org/10.7554/eLife.77645


