Effects of an IgE receptor polymorphism acting on immunity, susceptibility to infection, and reproduction in a wild rodent
- Institute of Infection, Veterinary and Ecological Sciences, University of Liverpool, United Kingdom
- School of Life Sciences, University of Nottingham, United Kingdom
- School of Environment and Life Sciences, University of Salford, United Kingdom
Figures
Figure 1
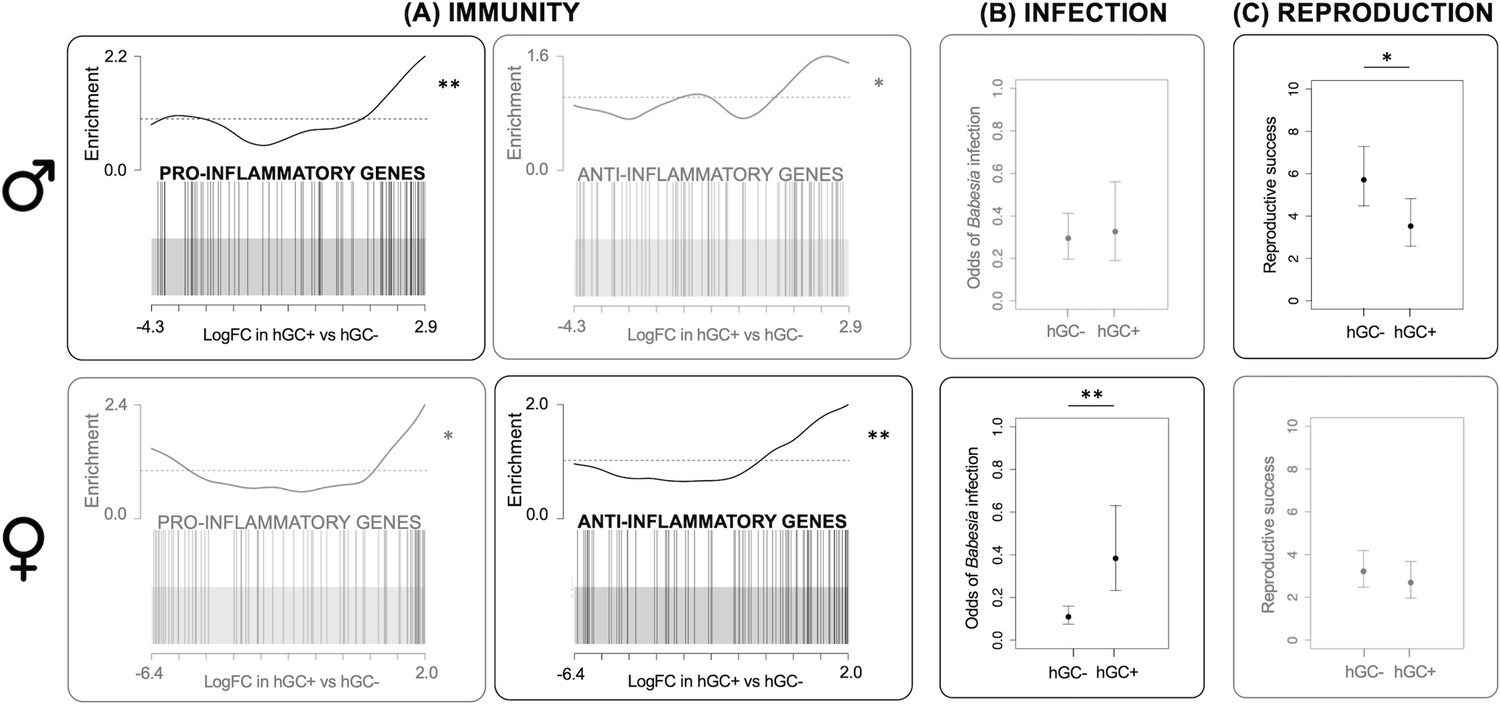
Effects of GC haplotype (hGC).
Upper panel: males. Lower panel: females: (A) Unstimulated immune gene expression: Barcode plots showing enrichment of the GO terms GO:0050729 (pro-inflammatory genes) and GO:0050728 (anti-inflammatory genes) in unstimulated splenocytes taken from individuals with (hGC+) vs. without (hGC-) the haplotype, showing that males with the haplotype have a pro-inflammatory bias, whereas females have an anti-inflammatory bias. In each plot, x-axis shows log fold change (logFC) in hGC+ vs. hGC-, black bars represent genes annotated with the GO terms and the worm shows relative enrichment. (B) Susceptibility to infection: association between hGC and the odds of infection with Babesia microti, showing that females with the haplotype have an increased susceptibility to infection (from a GLMM). (C) Reproduction: association between hGC and reproductive success, showing that males with the haplotype have lower reproductive success (from a GLM) (error bars represent ± standard error; *p<0.05; **p<0.01; see Table 1 for sample sizes). GLM = generalized linear model; GLMM = generalized linear mixed effects model.
Tables
Table 1
Model specifications including, for each main model, covariates included in the full model, datasets used, and sample sizes (F = included as a fixed effect; R = included as a random effect).
| DGE analysis | Haplotype association analyses | ||||
|---|---|---|---|---|---|
| Response variable | |||||
| Immune gene expression | Parasite infection | Reproductive success | SOD1activity | ||
| Covariates Snout-vent length | F | F | |||
| Eye lens weight | F | F | |||
| Reproductive status | F | F | F | ||
| Body condition | F | F | F | ||
| Birth month | F | ||||
| Culled or not | F | ||||
| Site | F; R (Il17a LMM) | F (Macro); R (Micro) | F | F | |
| Year | F | F | F | F | |
| Season | F; R (Il17a LMM) | F (Macro); R (Micro) | F | ||
| Individual ID | R (Micro) | ||||
| Assay plate | R (Il17a LMM) | ||||
| Dataset | C | C | C (Macro) L (Micro) | C+L | C |
| Sample size | ♀31 ♂53 | Il17a LMM: ♀73 ♂220 | Macro: ♀82 ♂235 B. microti: ♀1075 ♂1247 Bartonella spp.: ♀1283 ♂1104 | ♀419 ♂232 | ♀81 ♂227 |
-
C = cross-sectional; L = longitudinal; DGE = differential gene expression; LMM = linear mixed effects model.
Appendix 1—table 1
Position of single-nucleotide polymorphisms (SNPs) and other key features in the Fcer1a gene.
Features lie in scaffold CADCXT010006977 within assembly GCA_902806775.
| Feature | Start | End |
|---|---|---|
| Fcer1a gene | 10745528 | 10745528 |
| Exon 5 | 10745528 | 10745881 |
| Exon 4 | 10746818 | 10747076 |
| Exon 3 | 10748609 | 10748864 |
| Exon 2 | 10750044 | 10750065 |
| Exon 1 | 10750465 | 10750642 |
| 5’ UTR | 10750520 | 10750642 |
| CDS | 10750465 | 10750520 |
| CDS | 10750044 | 10750065 |
| CDS | 10748609 | 10748864 |
| CDS | 10746818 | 10747076 |
| CDS | 10745729 | 10745881 |
| 3’ UTR | 10745528 | 10745729 |
| SNP 2 | 10748718 | 10748719 |
| SNP 1 | 10746846 | 10746847 |
Appendix 1—table 2
Top 10 annotated genes that were differentially expressed between males with vs. without the GC haplotype, including associated log fold changes (logFC), p-values, and q-values (false discovery rate [FDR]-corrected p-values).
| Gene | Protein | LogFC | p-value | q-value |
|---|---|---|---|---|
| Snai3 | Snail family zinc finger 3 | 1.698 | 1.220 × 10⁻⁹ | 1.574 × 10⁻⁵ |
| Pla2g4c | Phospholipase A2, group IVC (cytosolic, calcium-independent) | 2.904 | 6.386 × 10⁻⁹ | 4.120 × 10⁻⁵ |
| Il33 | Interleukin 33 | 2.756 | 1.474 × 10⁻⁷ | 4.755 × 10⁻⁴ |
| Mmp13 | Matrix metallopeptidase 13 | 2.571 | 4.427 × 10⁻⁷ | 1.142 × 10⁻³ |
| Uba7 | Ubiquitin-like modifier activating enzyme 7 | 0.771 | 5.979 × 10⁻⁷ | 1.286 × 10⁻³ |
| Robo4 | Roundabout guidance receptor 4 | 0.892 | 3.738 × 10⁻⁶ | 4.385 × 10⁻³ |
| Ttn | Titin | 1.665 | 8.995 × 10⁻⁶ | 7.254 × 10⁻³ |
| Flnc | Filamin C, gamma | 1.554 | 1.245 × 10⁻⁵ | 9.447 × 10⁻³ |
| Crb2 | Crumbs family member 2 | 1.327 | 1.567 × 10⁻⁵ | 1.063 × 10⁻² |
| Muc16 | Mucin 16 | 1.937 | 1.971 × 10⁻⁵ | 1.156 × 10⁻² |
Appendix 1—table 3
Annotated genes that were differentially expressed (q ≤ 0.1) between females with vs. without the GC haplotype, including associated log fold changes (logFC), p-values, and q-values (false discovery rate [FDR]-corrected p-values).
| Gene | Protein | LogFC | p-value | q-value |
|---|---|---|---|---|
| Tldc1 | TBC/LysM associated domain containing 1 | 1.489 | 2.502 × 10⁻⁸ | 3.228 × 10⁻⁴ |
| Peg3 | Paternally expressed 3 | 1.440 | 5.369 × 10⁻⁵ | 0.049 |
| Socs3 | Suppressor of cytokine signaling 3 | 1.071 | 6.061 × 10⁻⁵ | 0.052 |
Appendix 1—table 4
Top 10 annotated genes that were differentially expressed between males with vs. without the GC haplotype when controlling for cestode burden, including associated log fold changes (logFC), p-values, and q-values (false discovery rate [FDR]-corrected p-values).
| Gene | Protein | LogFC | p-value | q-value |
|---|---|---|---|---|
| Il33 | Interleukin 33 | 3.091 | 2.473 × 10⁻¹⁰ | 3.191 × 10⁻⁶ |
| Snai3 | Snail family zinc finger 3 | 1.672 | 5.259 × 10⁻⁹ | 3.393 × 10⁻⁵ |
| Pla2g4c | Phospholipase A2, group IVC (cytosolic, calcium-independent) | 2.883 | 1.562 × 10⁻⁸ | 6.721 × 10⁻⁵ |
| Uba7 | Ubiquitin-like modifier activating enzyme 7 | 0.809 | 2.477 × 10⁻⁸ | 7.990 × 10⁻⁵ |
| Mmp13 | Matrix metallopeptidase 13 | 2.606 | 4.090 × 10⁻⁷ | 8.796 × 10⁻⁴ |
| Robo4 | Roundabout guidance receptor 4 | 0.892 | 8.160 × 10⁻⁶ | 9.572 × 10⁻³ |
| Ttn | Titin | 1.599 | 2.532 × 10⁻⁵ | 1.951 × 10⁻² |
| Flnc | Filamin C, gamma | 1.493 | 2.721 × 10⁻⁵ | 1.951 × 10⁻² |
| Crb2 | Crumbs family member 2 | 1.261 | 3.512 × 10⁻⁵ | 2.151 × 10⁻² |
Appendix 1—table 5
Annotated genes that were differentially expressed (q ≤ 0.1) between females with vs. without the GC haplotype when controlling for cestode burden, including associated log fold changes (logFC), p-values, and q-values (false discovery rate [FDR]-corrected p-values).
| Gene | Protein | LogFC | p-value | q-value |
|---|---|---|---|---|
| Tldc1 | TBC/LysM associated domain containing 1 | 1.489 | 2.890 × 10⁻⁸ | 3.730 × 10⁻⁴ |
| Socs3 | Suppressor of cytokine signaling 3 | 1.083 | 4.133 × 10⁻⁵ | 0.041 |
| Peg3 | Paternally expressed 3 | 1.411 | 6.375 × 10⁻⁵ | 0.055 |
| Ppp1r3c | Protein phosphatase 1, regulatory (inhibitor) subunit 3C | 1.662 | 8.798 × 10⁻⁵ | 0.071 |
Appendix 1—table 6
Significance values from hapassoc models for expression of 18 genes (assayed by Q-PCR) in splenocytes.
Splenocytes were stimulated with anti-CD3 and anti-CD28 antibodies in order to promote the proliferation of T-cells. q-values (false discovery rate [FDR]-corrected p-values) are reported alongside original p-values for the genotype by sex interaction.
| Gene | p-value | q-value |
|---|---|---|
| Cd4 | 0.124 | 0.822 |
| Cd8a | 0.744 | 0.866 |
| Foxp3 | 0.499 | 0.845 |
| Gata3 | 0.563 | 0.845 |
| Il10 | 0.866 | 0.866 |
| Mpo | 0.173 | 0.822 |
| Tbx21 | 0.650 | 0.866 |
| Tgfb1 | 0.271 | 0.822 |
| Ifng | 0.399 | 0.822 |
| Il17a | 0.002 | 0.037 |
| Il1b | 0.749 | 0.866 |
| Il6 | 0.282 | 0.822 |
| Ms4a1 | 0.281 | 0.822 |
| Orai1 | 0.353 | 0.822 |
| Tnfa | 0.858 | 0.866 |
| Il2 | 0.411 | 0.822 |
| Apobr | 0.857 | 0.866 |
| Arg1 | 0.552 | 0.845 |
Appendix 1—table 7
Estimates, standard errors, and z-statistics from best LMM for Yeo-Johnson-transformed Il17a expression levels.
| Estimate | SE | z | |
|---|---|---|---|
| (Intercept) | 0.107 | 0.023 | 4.61 |
| Genotype | –0.115 | 0.037 | –3.10 |
| Sex male | –0.055 | 0.019 | –2.89 |
| Year 2016 | 0.084 | 0.018 | 4.60 |
| Genotype × sex male | 0.143 | 0.044 | 3.25 |
Appendix 1—table 8
Effect sizes, standard errors, z-statistics, and associated significance from Gaussian hapassoc model for SOD1 activity.
| Estimate | SE | z | p-value | |
|---|---|---|---|---|
| (Intercept) | 0.614 | 1.514 | 0.406 | 0.685 |
| hAT | –0.453 | 0.223 | –2.032 | 0.042 |
| Reproductive status active | –0.112 | 0.266 | –0.422 | 0.673 |
| Sex male | 0.031 | 0.250 | 0.124 | 0.901 |
| SVL | 0.016 | 0.017 | 0.945 | 0.345 |
| Lens weight 2 | 0.568 | 0.531 | 1.070 | 0.284 |
| Lens weight 3 | 0.440 | 0.549 | 0.801 | 0.423 |
| Lens weight 4 | 0.445 | 0.587 | 0.758 | 0.448 |
| Lens weight 5 | 0.415 | 0.653 | 0.636 | 0.525 |
| Lens weight 6 | 0.301 | 0.752 | 0.400 | 0.689 |
| Lens weight 7 | –0.307 | 1.095 | –0.280 | 0.779 |
| Body condition | 0.020 | 0.030 | 0.677 | 0.498 |
| Site CHE | 1.429 | 0.431 | 3.316 | 0.001 |
| Site COL | 2.675 | 1.099 | 2.434 | 0.015 |
| Site GRD | 1.476 | 0.437 | 3.379 | 0.001 |
| Site RAV | 0.904 | 0.918 | 0.984 | 0.325 |
| Site SCP | 1.107 | 0.419 | 2.643 | 0.008 |
| Year 2016 | 0.593 | 0.242 | 2.457 | 0.014 |
| Season early summer | –0.392 | 0.389 | –1.007 | 0.314 |
| Season late summer | –0.098 | 0.266 | –0.369 | 0.712 |
| Season spring | –0.969 | 0.383 | –2.529 | 0.011 |
Appendix 1—table 9
Effect sizes, standard errors, and z-statistics from best binomial GLMM for probability of infection with Babesia microti.
| Estimate | SE | z | |
|---|---|---|---|
| (Intercept) | –2.214 | 0.377 | –5.87 |
| Genotype | 1.254 | 0.416 | 3.02 |
| Sex male | 0.957 | 0.229 | 4.19 |
| Year 2016 | 1.260 | 0.277 | 4.55 |
| Year 2017 | 1.047 | 0.302 | 3.46 |
| Reproductive status active | 0.754 | 0.144 | 5.24 |
| Body condition | 0.044 | 0.016 | 2.76 |
| Genotype × sex male | –1.116 | 0.615 | –1.82 |
Appendix 1—table 10
Effect sizes, standard errors, and z-statistics from best binomial GLMM for probability of infection with Bartonella spp.
| Estimate | SE | z | |
|---|---|---|---|
| (Intercept) | 0.236 | 0.369 | 0.64 |
| Year 2016 | 0.740 | 0.135 | 5.49 |
| Year 2017 | 2.280 | 0.175 | 13.01 |
Appendix 1—table 11
Effect sizes, standard errors, z-statistics, and associated significance from Gaussian hapassoc model for macroparasite infection summarized by a single principal component.
| Estimate | SE | z | p-value | |
|---|---|---|---|---|
| (Intercept) | 0.050 | 0.331 | 0.152 | 0.879 |
| hAC | –0.102 | 0.130 | –0.786 | 0.432 |
| hAT | –0.108 | 0.158 | –0.682 | 0.495 |
| Sex male | –0.271 | 0.126 | –2.146 | 0.032 |
| Season early summer | –0.103 | 0.182 | –0.567 | 0.571 |
| Season late summer | 0.012 | 0.132 | 0.090 | 0.929 |
| Season spring | 0.327 | 0.176 | 1.854 | 0.064 |
| Reproductive status active | –0.222 | 0.119 | –1.868 | 0.062 |
| Body condition | –0.019 | 0.014 | –1.328 | 0.184 |
| Year 2016 | –0.473 | 0.124 | –3.810 | 0.000 |
| Site CHE | 0.714 | 0.226 | 3.157 | 0.002 |
| Site COL | 0.762 | 0.575 | 1.327 | 0.185 |
| Site GRD | 0.707 | 0.229 | 3.090 | 0.002 |
| Site RAV | 1.100 | 0.481 | 2.288 | 0.022 |
| Site SCP | 0.747 | 0.220 | 3.389 | 0.001 |
Appendix 1—table 12
Effect sizes, standard errors, z-statistics, and associated significance from best quasi-Poisson GLM for reproductive success in males.
| Estimate | SE | z | p-value | |
|---|---|---|---|---|
| (Intercept) | 1.743 | 0.243 | 7.171 | 1.05 × 10⁻¹¹ |
| Genotype | –0.484 | 0.237 | –2.042 | 0.042 |
| Year 2016 | 0.592 | 0.185 | 3.193 | 0.002 |
| Year 2017 | –0.437 | 0.199 | –2.193 | 0.029 |
| Birth month | –0.358 | 0.048 | –7.449 | 1.97 × 10⁻¹² |
| Culled yes | 0.422 | 0.150 | 2.809 | 0.005 |
Appendix 1—table 13
Effect sizes, standard errors, z-statistics, and associated significance from best quasi-Poisson GLM for reproductive success in females.
| Estimate | SE | z | p-value | |
|---|---|---|---|---|
| (Intercept) | 1.137 | 0.264 | 4.298 | 2.15 × 10⁻⁵ |
| Year 2016 | 0.520 | 0.211 | 2.466 | 0.014 |
| Year 2017 | –0.118 | 0.215 | –0.549 | 0.584 |
| Birth month | –0.298 | 0.047 | –6.391 | 4.42 × 10⁻¹⁰ |
Appendix 1—table 14
Effect sizes, standard errors, z-statistics, and associated significance from best quasi-Poisson GLM for reproductive success in males when controlling for Babesia microti and Bartonella spp. infection.
| Estimate | SE | z | p-value | |
|---|---|---|---|---|
| (Intercept) | 1.467 | 0.418 | 3.513 | 7.64 × 10⁻⁴ |
| Genotype | –1.081 | 0.425 | –2.544 | 0.013 |
| Year 2016 | 0.238 | 0.279 | 0.854 | 0.396 |
| Year 2017 | –0.912 | 0.386 | –2.338 | 0.022 |
| Birth month | –0.464 | 0.091 | –5.090 | 2.69 × 10⁻⁶ |
| Proportion of samples Babesia-positive | 0.849 | 0.276 | 3.076 | 0.003 |
| Proportion of samples Bartonella-positive | 0.997 | 0.440 | 2.268 | 0.026 |
Appendix 1—table 15
Effect sizes, standard errors, z-statistics, and associated significance from best quasi-Poisson GLM for reproductive success in females when controlling for Babesia microti and Bartonella spp. infection.
| Estimate | SE | z | p-value | |
|---|---|---|---|---|
| (Intercept) | 1.483 | 0.305 | 4.867 | 3.20 × 10⁻⁶ |
| Birth month | –0.310 | 0.073 | –4.229 | 4.38 × 10⁻⁵ |
| Proportion of samples Babesia-positive | 0.569 | 0.247 | 2.308 | 0.0226 |
Appendix 1—table 16
Panel of 18 genes for which expression levels in splenocytes stimulated with anti-CD3 and anti-CD28 antibodies were measured using two-step reverse transcription quantitative PCR (Q-PCR).
| Gene | Protein |
|---|---|
| Cd4 | T-cell surface glycoprotein CD4 |
| Cd8a | T-cell surface glycoprotein CD8 alpha chain |
| Foxp3 | Forkhead box protein P3 |
| Gata3 | GATA binding protein 3 |
| Il10 | Interleukin-10 |
| Mpo | Myeloperoxidase |
| Tbx21 | T-box transcription factor TBX21 |
| Tgfb1 | Transforming growth factor beta 1 |
| Ifng | Interferon gamma |
| Il17a | Interleukin-17a |
| Il1b | Interleukin-1 beta |
| Il6 | Interleukin-6 |
| Ms4a1 | B-lymphocyte antigen CD20 |
| Orai1 | Calcium release-activated calcium channel protein 1 |
| Tnfa | Tumor necrosis factor alpha |
| Il2 | Interleukin-2 |
| Apobr | Apolipoprotein B receptor |
| Arg1 | Arginase-1 |
Appendix 1—table 17
Loadings from principal component analysis summarizing infection by macroparasites (ticks, fleas, and cestodes).
| Macroparasite | PC1 |
|---|---|
| Cestodes | –0.481 |
| Ticks | –0.592 |
| Fleas | –0.646 |
Additional files
Download links
A two-part list of links to download the article, or parts of the article, in various formats.
Downloads (link to download the article as PDF)
Open citations (links to open the citations from this article in various online reference manager services)
Cite this article (links to download the citations from this article in formats compatible with various reference manager tools)
Effects of an IgE receptor polymorphism acting on immunity, susceptibility to infection, and reproduction in a wild rodent
eLife 12:e77666.
https://doi.org/10.7554/eLife.77666


