Subtype-specific responses of hKv7.4 and hKv7.5 channels to polyunsaturated fatty acids reveal an unconventional modulatory site and mechanism
- Department of Biomedical and Clinical Sciences, Linköping University, Sweden
- Science for Life Laboratory, Department of Applied Physics, KTH Royal Institute of Technology, Sweden
Figures
Figure 1 with 1 supplement
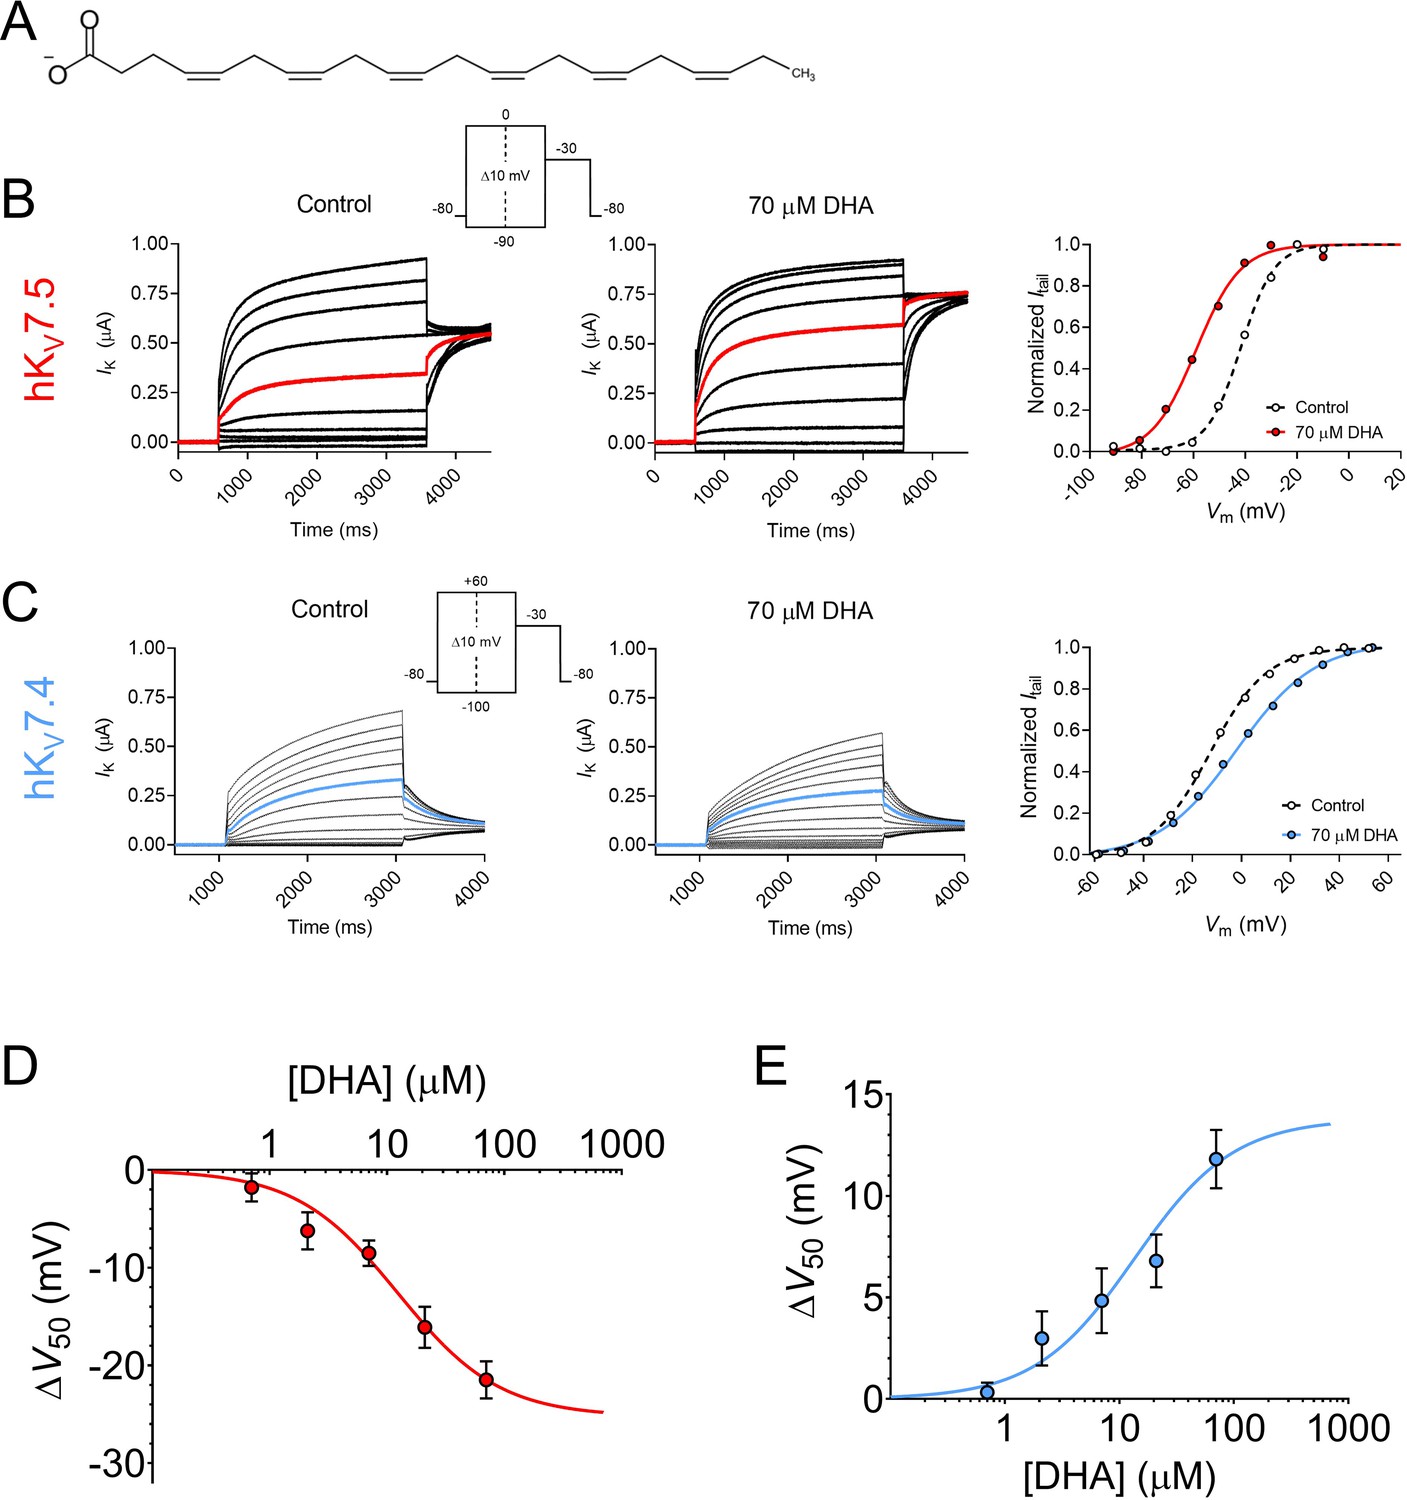
Docosahexaenoic acid facilitates the activation of hKV7.5 but inhibits the activation of hKV7.4.
(A) Molecular structure of DHA. (B) Representative current family with corresponding G(V) curve of hKV7.5 in the absence (left) and presence (middle) of 70 µM DHA. Currents generated by the voltage protocol shown as inset. Red traces denote current generated by a test voltage to –40 mV. The G(V) curves (right) have been normalized between 0 and 1, as described in Materials and methods, to better visualize shifts in V50. Curves represent Boltzmann fits (see Materials and methods for details). V50 for this specific cell: V50,ctrl = –41.7 mV, V50,DHA = –59 mV. (C) Same as in B but for hKV7.4. Blue traces denote current generated by a test voltage to 0 mV. V50 for this specific cell: V50,ctrl = –12.6 mV, V50,DHA = –2.0 mV. (D–E) Concentration-response curve of the DHA effect on V50 of hKV7.5 (D) and hKV7.4 (E). Curves represent concentration-response fits (see Materials and methods for details). Best fits: ΔV50,max is –25.3 mV for hKV7.5 and +13.8 mV for hKV7.4. EC50 is 12 µM for hKV7.5 and 14 µM for hKV7.4. Data shown as mean ± SEM. n = 3–15. See also Figure 1—figure supplement 1, Figure 1—source data 1.
-
Figure 1—source data 1
Numerical data for Figure 1.
- https://cdn.elifesciences.org/articles/77672/elife-77672-fig1-data1-v1.xlsx
Figure 1—figure supplement 1

The DHA response has a rapid onset for both hKV7.5 and hKV7.4.
Representative data showing wash-in and wash-out of 70 µM DHA on hKV7.5 (A) and hKV7.4 (B) for one oocyte each. Data points represent the current amplitude recorded following a test voltage to –40 mV (for hKV7.5) or +20 mV (for hKV7.4). The onset of DHA-induced activation of the hKV7.5 channel was quick, reaching a stable level of enhanced current within 5 min. Neither standard recording solution nor recording solution supplemented with BSA completely removed the DHA effect, and the enhanced current amplitude remained at almost threefold that of the baseline current amplitude. The onset of DHA-induced inhibition of the hKV7.4 channel was also quick, reaching a stable level of reduced current amplitude within 4.5 min. While not fully reversible, the DHA effect was reduced following re-perfusion with standard recording solution. Recording solution supplemented with 100 mg/mL BSA also reduced the inhibitory effect, with the current amplitude reaching approximately 89% of baseline current amplitude. Related to Figure 1.
Figure 2
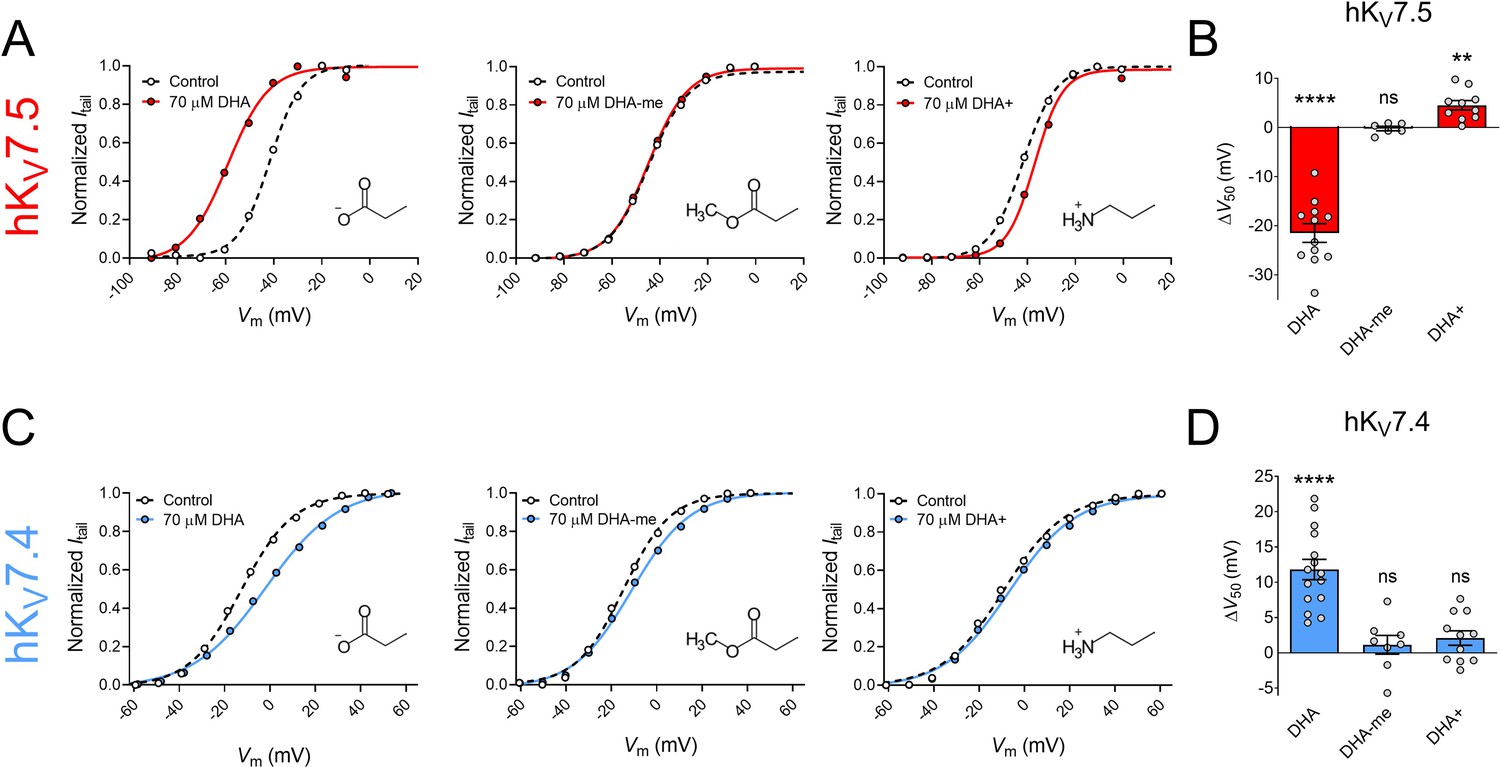
The impact of PUFA head group charge for hKV7.5 and hKV7.4 effects.
(A–B) Impact of the head group charge on the ability of DHA to shift V50 of hKV7.5, assessed by comparing the effect of negatively charged DHA, uncharged DHA-me, and positively charged DHA+ at 70 µM. (A) Representative examples of the negative shift in V50 induced by DHA (left, same data as shown in Figure 1B), the lack of effect of DHA-me (middle, V50,ctrl = –43.9 mV; V50,DHA-me = -44.6 mV), and the positive shift in V50 induced by DHA+ (right, V50,ctrl = –42.0 mV; V50,DHA+ = –37.0 mV). Molecular structure of head groups are shown as insets. (B) Summary of responses to indicated DHA compound. Data shown as mean ± SEM. n = 6–12. Statistics denote one sample t test against a hypothetical mean of 0 mV. ns denotes not significant, ** denotes p ≤ 0.01, **** denotes p ≤ 0.0001. (C–D) same as in A-B but for hKV7.4. (C) Representative examples of the depolarizing shift in V50 induced by DHA (left, same data as shown in Figure 1C), the lack of effect of DHA-me (middle, V50,ctrl = –14.6 mV; V50,DHA-me = –11.1 mV), and the lack of effect of DHA+ (right, V50,ctrl = –9.1 mV; V50,DHA+ = –6.6 mV). (D) Summary of responses to indicated DHA compound. Data shown as mean ± SEM. n = 8–15. Statistics denote one sample t test against a hypothetical mean of 0 mV. ns denotes not significant, **** denotes p ≤ 0.0001. See also Figure 2—source data 1.
-
Figure 2—source data 1
Numerical data for Figure 2.
- https://cdn.elifesciences.org/articles/77672/elife-77672-fig2-data1-v1.xlsx
Figure 3
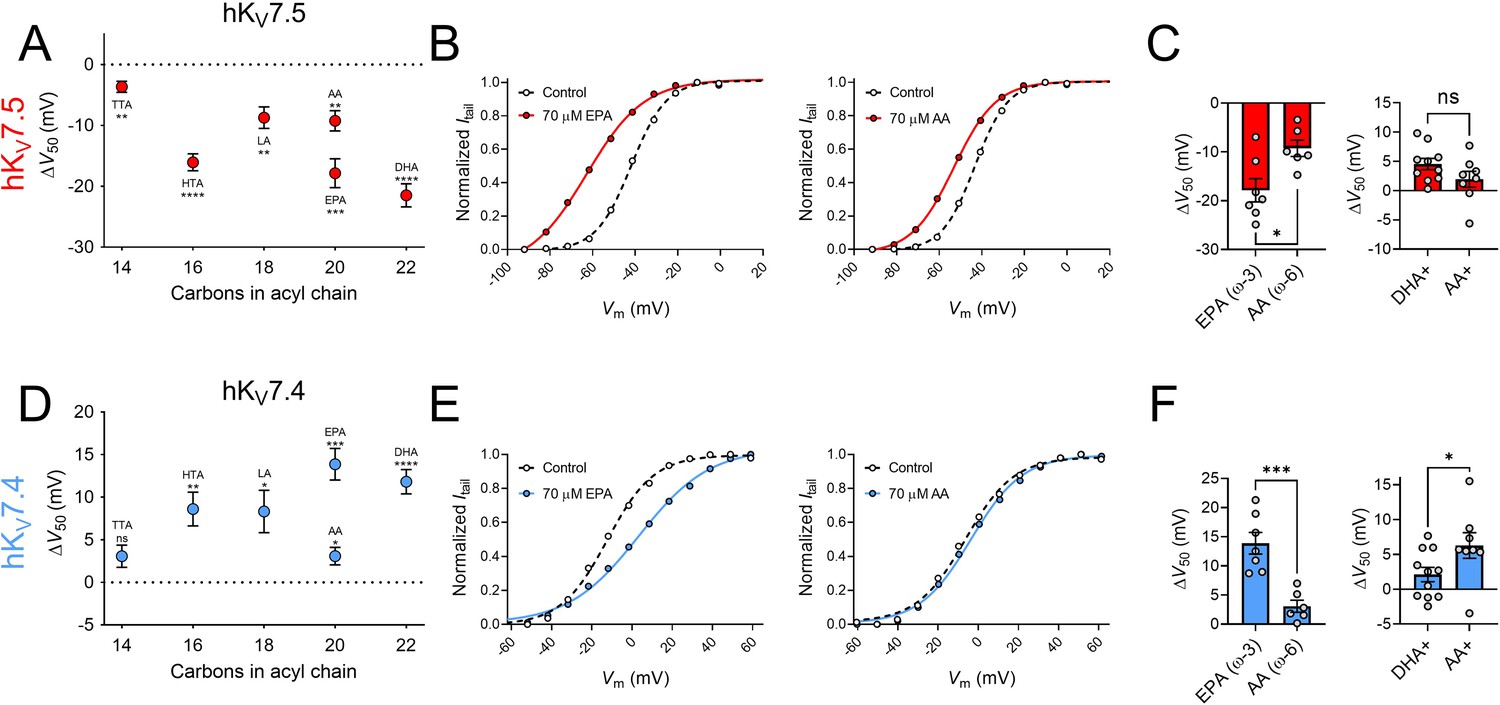
The impact of PUFA tail properties for hKV7.5 and hKV7.4 effects.
(A–C) Impact of PUFA tail properties for the ability of PUFAs to shift V50 of hKV7.5, assessed by comparing the response to 70 µM of indicated PUFAs (see Table 1 for molecular structures). (A) Average effect of indicated PUFAs. Data shown as mean ± SEM. n = 6–8. Statistics denote one sample t test against a hypothetical mean of 0 mV ns denotes not significant, ** denotes p ≤ 0.01, *** denotes p ≤ 0.001, **** denotes p ≤ 0.0001. (B) Representative examples of response to 70 µM of the ω–3 PUFA EPA (left, V50,ctrl = -41.9 mV; V50,EPA = -62.8 mV) and ω–6 PUFA AA (middle, V50,ctrl = –43.3 mV; V50,AA = –53.1 mV). (C) Bar graphs with comparison of average response to 70 µM of EPA and AA (n = 6–7) and DHA+ and AA+ (n = 8–10). Statistics denote Student’s t test. ns denotes not significant, * denotes p ≤ 0.05. (D–F) same as in A-C but for hKV7.4. (D) n = 6–8. (E) Left: V50,ctrl = –12.3 mV; V50,EPA = +3.4 mV. Middle: V50,ctrl = –6.5 mV; V50,AA = –3.6 mV. (F) n = 6–7 and n = 8–11, respectively. * denotes p ≤ 0.05, ** denotes p ≤ 0.01, *** denotes p ≤ 0.001, **** denotes p ≤ 0.0001. See also Figure 3—source data 1.
-
Figure 3—source data 1
Numerical data for Figure 3.
- https://cdn.elifesciences.org/articles/77672/elife-77672-fig3-data1-v1.xlsx
Figure 4

hKV7.4/7.5 co-expression and disease-associated hKv7.4 mutations, but not hKCNE4 co-expression, influence the response to DHA.
(A) Representative current family with corresponding G(V) curve of hKV7.4/7.5 in the absence (left) and presence (middle) of 70 µM DHA. Purple traces denote current generated by a test voltage to –20 mV. Curves represent Boltzmann fits. V50 for this specific cell: V50,ctrl = –22.8 mV; V50,DHA = –23.1 mV. (B) Representative current family with corresponding G(V) curve of hKV7.4/KCNE4 in the absence (left) and presence (middle) of 70 µM DHA. Blue traces denote current generated by a test voltage to 0 mV. Curves represent Boltzmann fits. V50 for this specific cell: V50,ctrl = –10.7 mV; V50,DHA = –3.5 mV. (C) Summary of response of hKV7.4/7.5 and hKV7.4/KCNE4 to 70 µM DHA, with responses of hKV7.4 and hKV7.5 for reference. Data shown as mean ± SEM. n = 7–15. Statistics denote one sample t test against a hypothetical mean of 0 mV. ns denotes not significant, *** denotes p ≤ 0.001, **** denotes p ≤ 0.0001. (D–E) Impact of hKV7.4 mutations F182L (D) and S273A (E) on the response to DHA. Structural model (PDB ID - 7BYL, Li et al., 2021) of hKV7.4 with position of F182 and S273 marked. Representative G(V) curve of indicated hKV7.4 mutants in the absence and presence of 70 µM DHA. Curves represent Boltzmann fits. For these specific cells: F182L: V50,ctrl = –18.7 mV; V50,DHA = –12.4 mV. For S273A: V50,ctrl = –15.8 mV; V50,DHA = –10.8 mV. (F) Summary of response of WT hKV7.4 and indicated mutants to 70 µM DHA. Data shown as mean ± SEM. n = 5–15. Statistics denote one-way ANOVA followed by Dunnett’s multiple comparisons test to compare the response of mutants to that of the wild-type. * denotes p ≤ 0.05. See also Figure 4—source data 1.
-
Figure 4—source data 1
Numerical data for Figure 4.
- https://cdn.elifesciences.org/articles/77672/elife-77672-fig4-data1-v1.xlsx
Figure 5 with 1 supplement
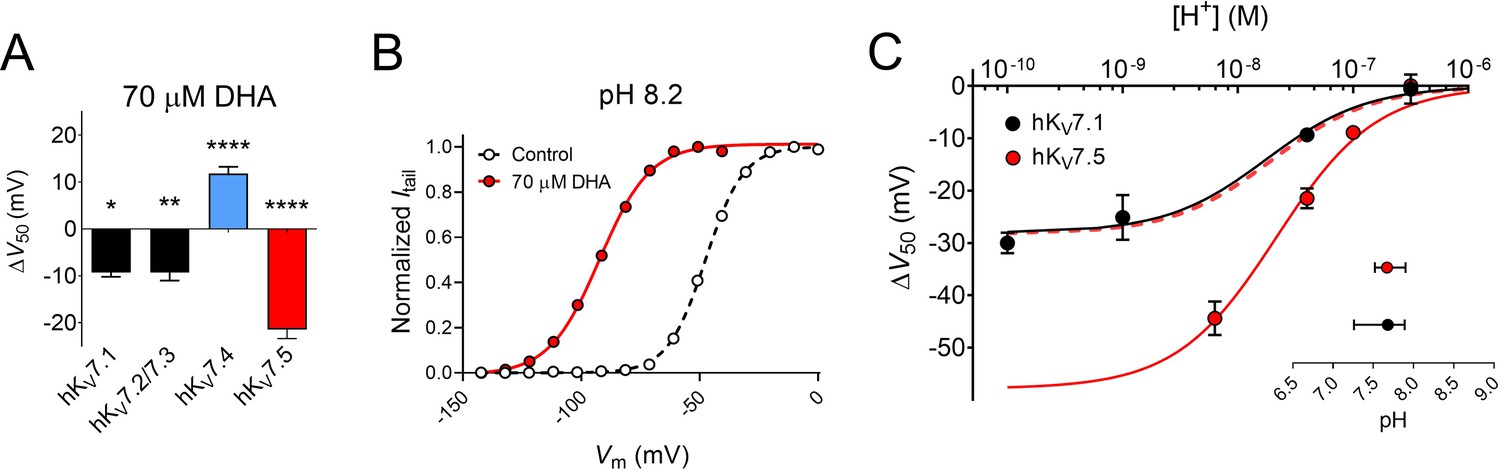
Extracellular pH tunes the DHA response of hKV7.5.
(A) Comparison of the V50 shift of hKV7 subtypes in response to 70 µM DHA. Data for hKV7.1 and hKV7.2/7.3 shown as reported in Liin et al., 2016; Liin et al., 2015. Data for hKV7.4 and hKV7.5 from the present study. Data shown as mean ± SEM. n = 3–15. Statistics denote one sample t test against a hypothetical mean of 0 mV. * denotes p ≤ 0.05, ** denotes p ≤ 0.01, **** denotes p ≤ 0.0001. (B–C) Altering extracellular pH tunes the shift in V50 of hKV7.5 induced by 70 µM DHA, with a greater response observed at more alkaline pH. Note that in all experiments, the pH of the control solution and DHA-supplemented control solution was identical. (B) Representative example of the DHA response at pH 8.2 (V50,ctrl = –47.6 mV; V50,DHA = –92.4 mV). (C) pH-response curve for the DHA effect on V50. Data shown as mean ± SEM. n = 3–9. Curves represent pH-response fits (see Materials and methods for details). Best fit for hKV7.5: ΔV50,max is –57.9 mV. Data for hKV7.1 as reported in Liin et al., 2015 is included for comparison (Best fit for hKV7.1: ΔV50,max is –26.3 mV.) Dashed line denotes the pH-response curve for hKV7.5 normalized to ΔV50,max for hKV7.1 to illustrate the comparable apparent pKa. Inset shows apparent pKa with 95% CI: hKV7.1 apparent pKa = 7.68 with 95% CI [7.26, 7.89]; hKV7.5 apparent pKa = 7.67 with 95% CI [7.52, 7.90]. Note that inconsistent behavior of hKV7.5 under control conditions at pH higher than 8.2 prevented us from determining the DHA effect on hKV7.5 at pH 9 and 10. See also Figure 5—figure supplement 1, Figure 5—source data 1.
-
Figure 5—source data 1
Numerical data for Figure 5.
- https://cdn.elifesciences.org/articles/77672/elife-77672-fig5-data1-v1.xlsx
Figure 5—figure supplement 1
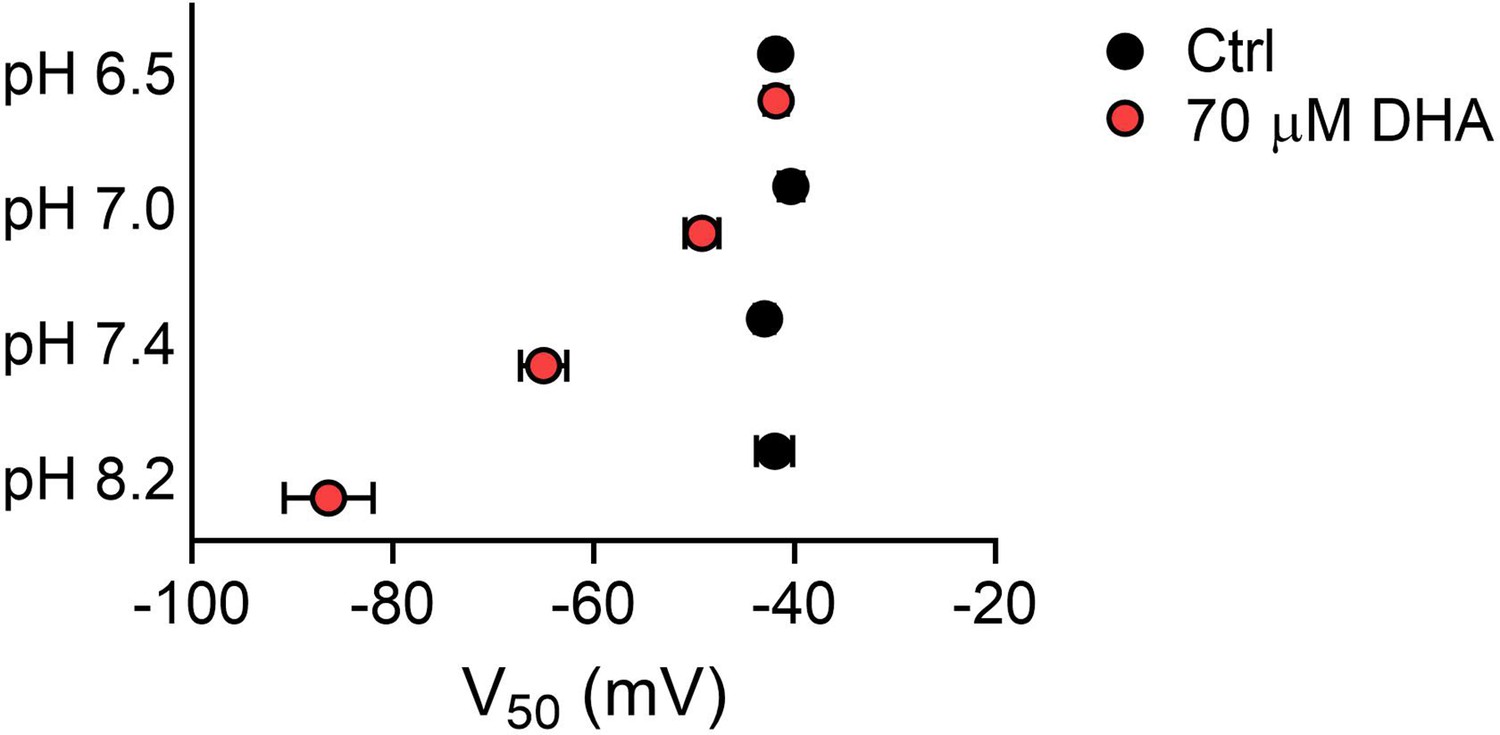
pH dependence of the DHA response of hKV7.5.
Altering extracellular pH does not affect V50 of hKV7.5 under control conditions (black symbols), which remains close to –40 mV in experiments using control recording solution with the indicated pH values. In contrast, altering extracellular pH tunes the shift in V50 of hKV7.5 induced by 70 µM DHA, with a greater response observed at more alkaline pH. Red symbols denote V50 in experiments using DHA-supplemented recording solution with indicated pH values, which ranges from about –40 mV at pH 6.5 to about –85 mV at pH 8.2. Data shown as mean ± SEM. n = 6–11. The DHA-induced shift in V50 (ΔV50) shown in Figure 5C is calculated as the difference in V50 in control recording solution and DHA-supplemented recording solution at each pH (i.e. the difference between the black and red symbol at each pH), and plotted as a function of H+ concentration of the extracellular recording solution. Related to Figure 5.
Figure 6 with 3 supplements
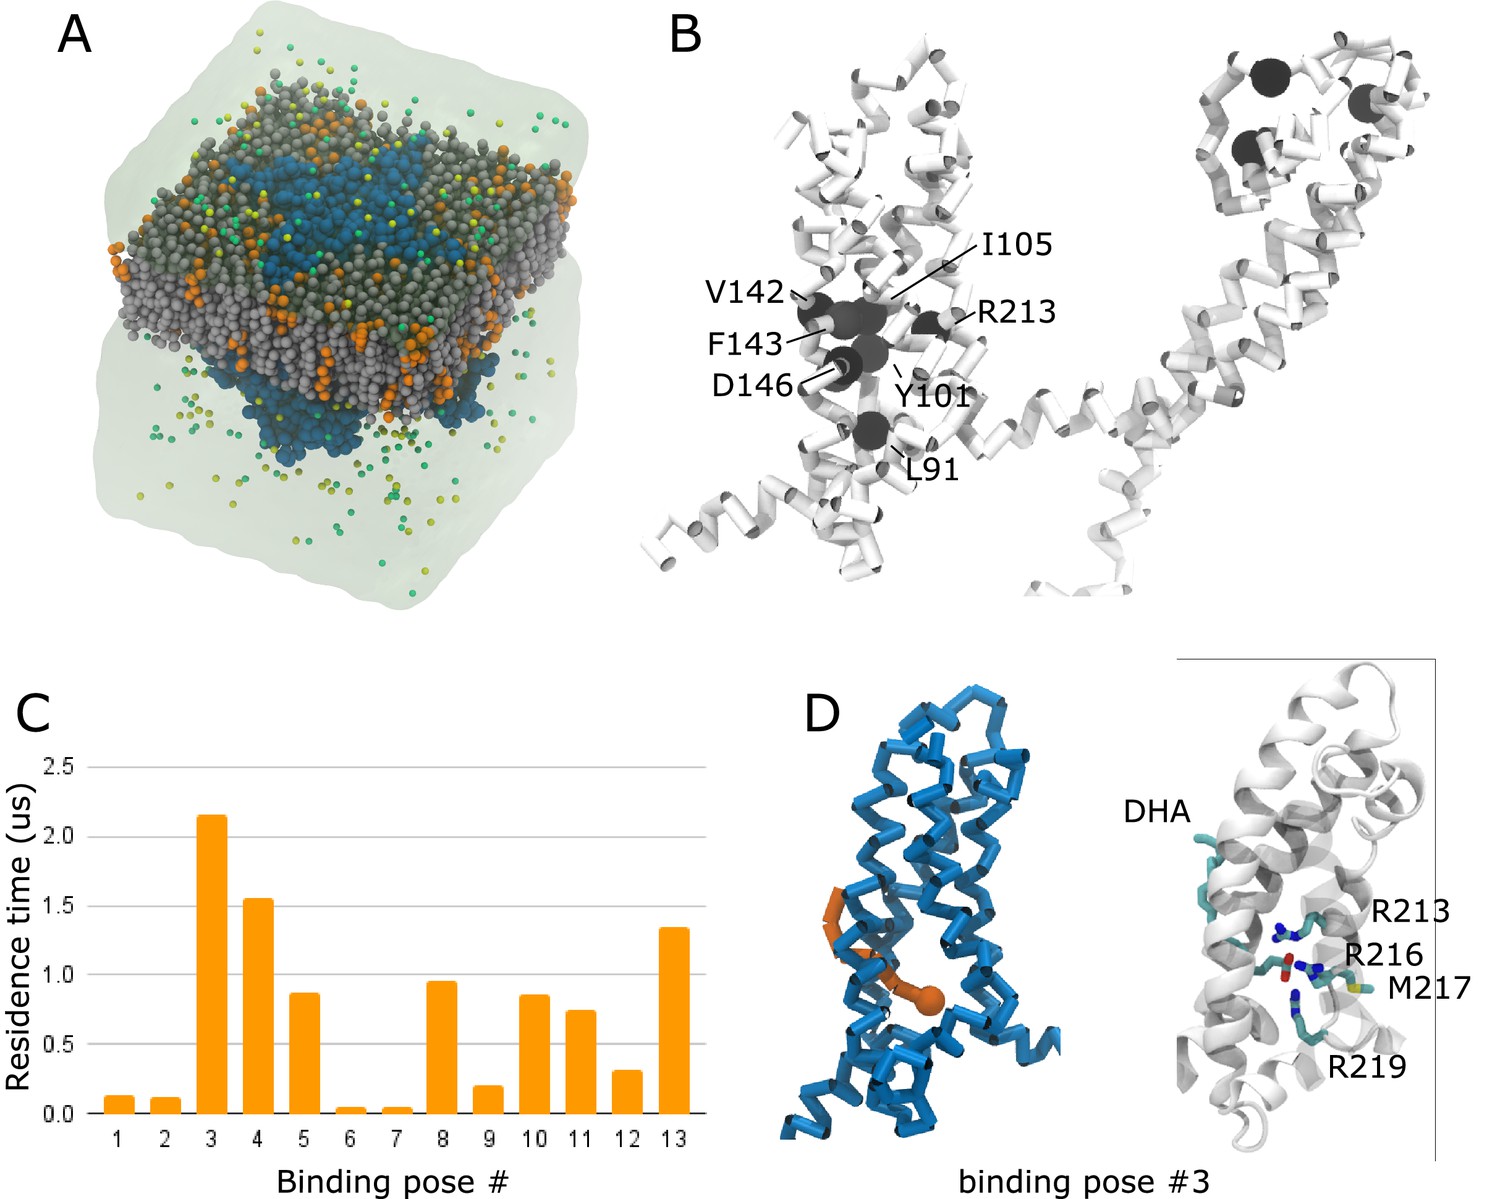
Molecular dynamics simulation predicts an unconventional inner VSD site for DHA in hKV7.4.
(A) Coarse-grained simulation system, containing hKV7.4 (blue) in a bilayer made of 75% POPC (grey) and 25% DHA (orange) plunged in a KCl bath. (B) Residence times of interactions between DHA and individual hKV7.4 residues projected as a color scale ranging from white (short residence times) to black (long residence times). Residues with a residence time above 4.4 µs are highlighted as black spheres. Note the cluster of such residues in the lower half of the VSD. (C) Residence time of DHA in 13 different binding poses identified through a clustering analysis. (D) The binding pose in the cluster with the highest residence time (cluster #3) is shown in the coarse-grained representation used to run the simulations (left - hKV7.4 VSD in blue, DHA in orange) and in an all-atom representation obtained by backmapping the coarse-grained system to all-atom representation (right – protein backbone in white ribbons, DHA and residues interacting with the charged head group as sticks colored by atom type, C – cyan, N – blue, O – red, S – yellow, H omitted for clarity). See also Figure 6—figure supplements 1–3. Source data, including code, for molecular dynamics simulations is accessible at https://osf.io/6fuqs/.
Figure 6—figure supplement 1
Overview of predicted interaction of negatively charged DHA with hKV7.4.
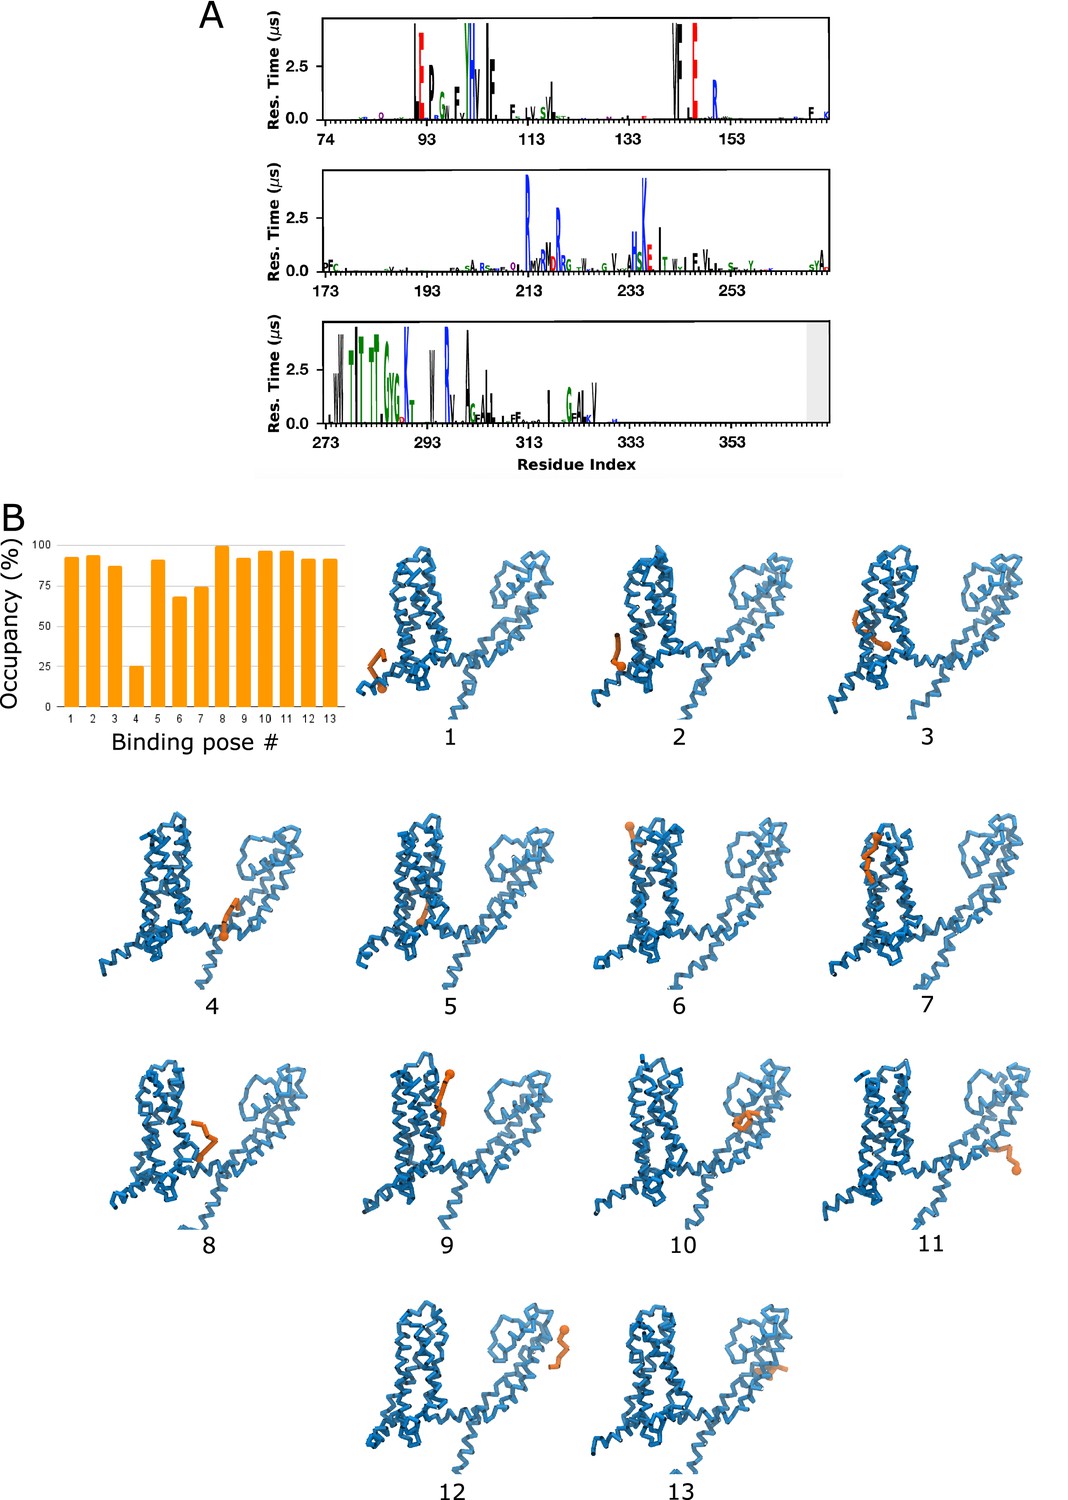
(A) Residence time of DHA projected along the hKV7.4 amino acid sequence, calculated from coarse-grained simulations of hKV7.4 embedded in a mixture of POPC and charged DHA. The higher the logo letter, the higher the residence time. (B) Occupancy of DHA in 13 different binding poses identified through a clustering analysis and molecular models corresponding to the 13 poses. Related to Figure 6.
Figure 6—figure supplement 2
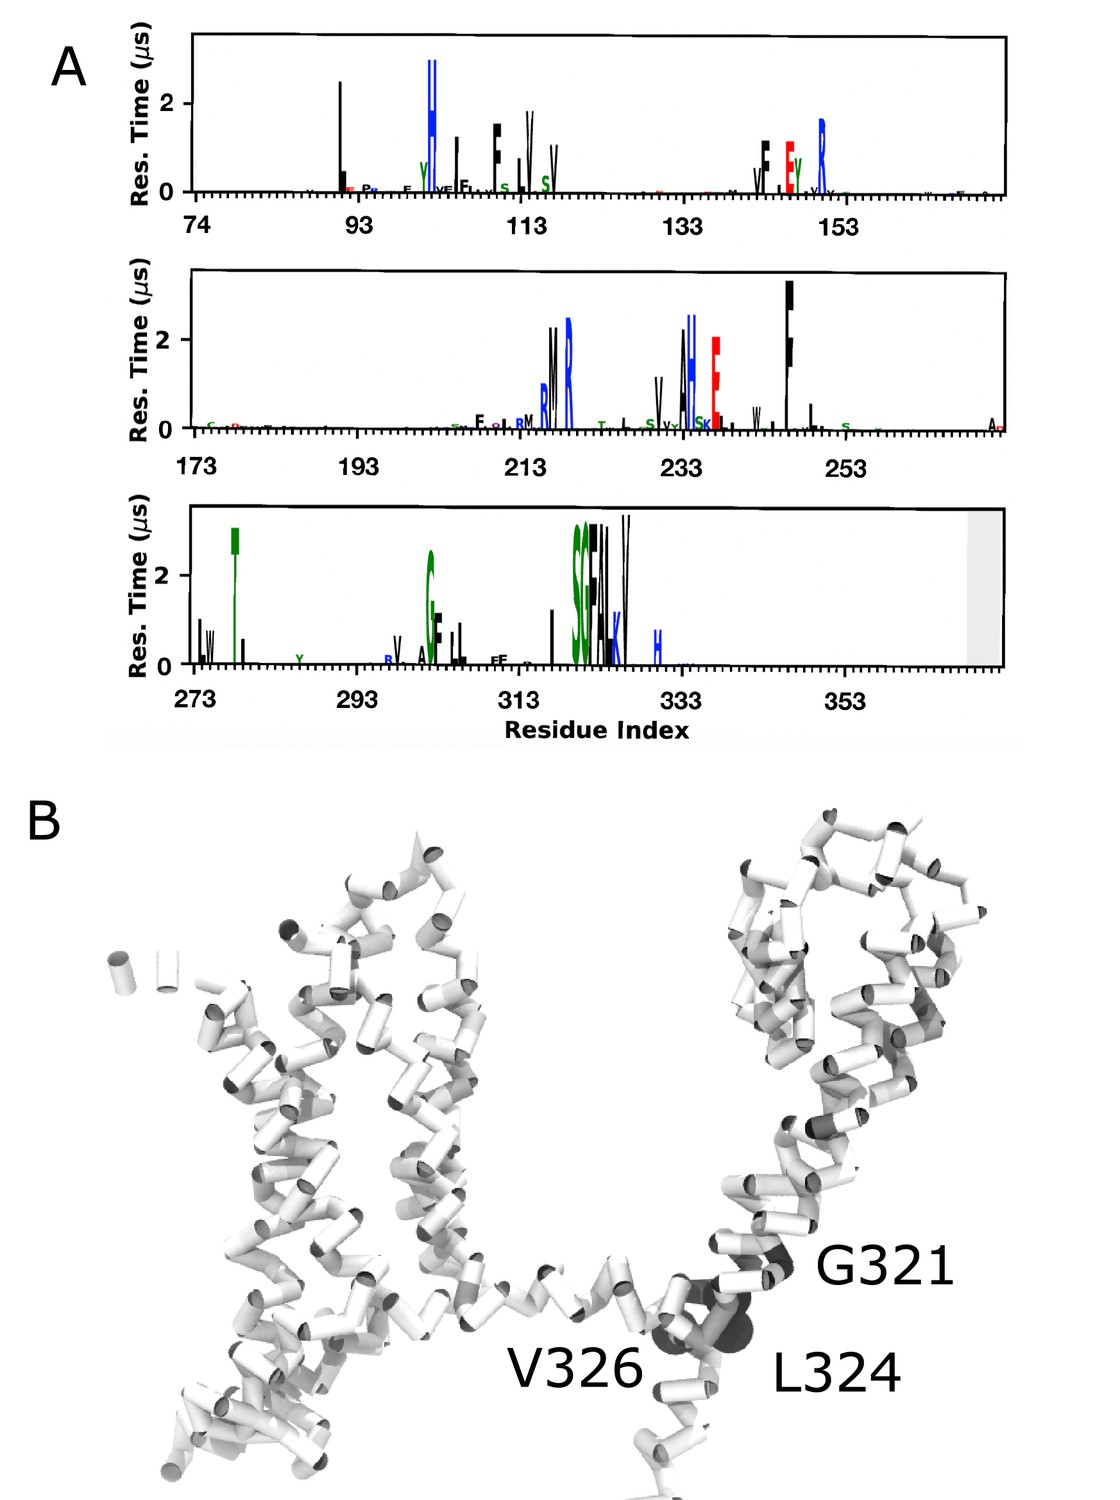
Overview of predicted interaction of uncharged DHA with hKV7.4.
(A) Residence time of DHA projected along the hKV7.4 amino acid sequence, calculated from coarse-grained simulations of hKV7.4 embedded in a mixture of POPC and neutral DHA. (B) Residence times projected as a color scale ranging from white (short residence times) to black (long residence times). Residues with a residence time above 4.4 µs are highlighted as black spheres. Note the absence of a cluster of such residues in the lower half of the VSD. Related to Figure 6.
Figure 6—figure supplement 3
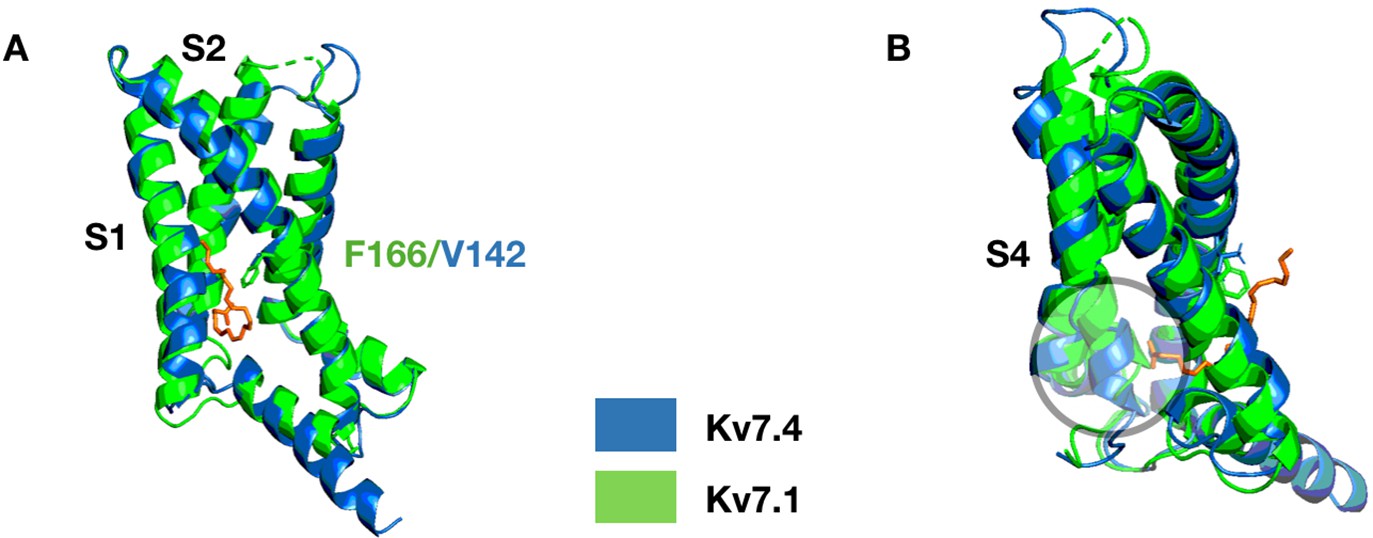
Structural alignment between the VSDs of hKV7.1 and hKV7.4 highlighting differences in the inner VSD site.
(A) Structural alignment of the VSDs of hKV7.4 (blue, PDB ID – 7BYL) and hKV7.1 (green, PDB ID – 6UZZ) highlighting structural differences that may permit DHA binding in hKV7.4 but not in hKV7.1. F166 (present in hKV7.1) can block the entry pathway for DHA (orange sticks), whereas V142 (present in hKV7.4) and its smaller side chain permit entry to the unconventional inner site. (B) A 90 degree counter-clockwise rotation of the structural alignment in (A) shows a decreased cavity size (highlighted with the black circle) in hKV7.1, as the S4 helix of hKV7.1 is pushed more into the cavity relative to S4 of KV7.4. Related to Figure 6.
Figure 7 with 1 supplement

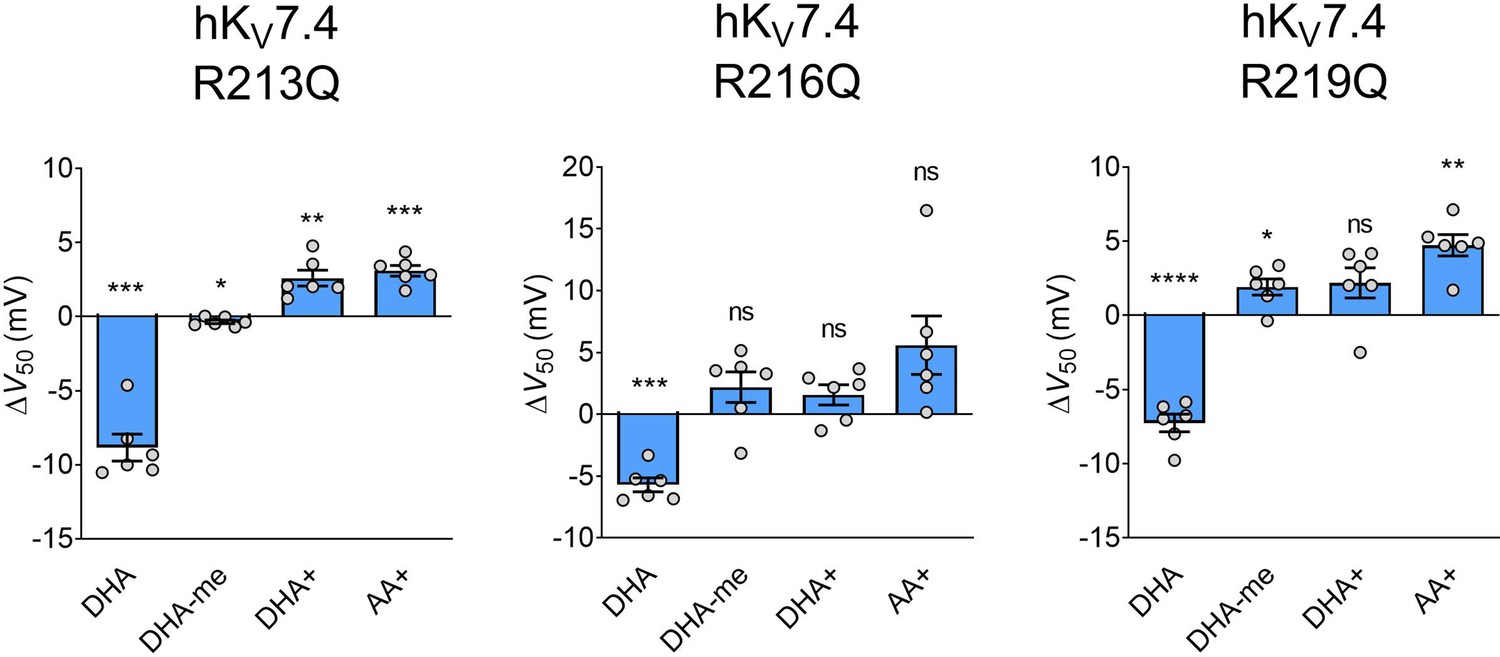
Substitution of innermost S4 arginines with charge-neutral glutamine unmasks PUFA-mediated facilitation of hKV7.4 activation.
(A) Representative current family with corresponding G(V) curve of hKV7.4 R213Q in the absence (left) and presence (middle) of 70 µM DHA. Blue traces denote current generated by a test voltage to –10 mV. Curves represent Boltzmann fits. V50 for this specific cell: V50,ctrl = –3.8 mV; V50,DHA = –13.2 mV. (B) Same as in A but for hKV7.4 R216Q. Blue traces denote current generated by a test voltage to –30 mV. V50 for this specific cell: V50,ctrl = -28.7 mV; V50,DHA = –35.3 mV. (C) Same as in A but for hKV7.4 R219Q. Blue traces denote current generated by a test voltage to –10 mV. V50 for this specific cell: V50,ctrl = 8.6 mV; V50,DHA = +0.6 mV. (D) Summary of the response of hKV7.4 gating charge mutants to 70 μM DHA. Data for wild-type hKV7.4 has been added for reference. Dashed line indicates the mean ΔV50 observed in hKV7.1 and hKV7.2/7.3 channels exposed to 70 μM DHA (same data as in Figure 5A). Data shown as mean ± SEM. n = 6–15. Statistics denote one sample t test against a hypothetical mean of 0 mV. *** denotes p ≤ 0.001, **** denotes p ≤ 0.0001. (E) Cartoon illustrating facilitation of channel opening from the conventional outer VSD site (left, in red) and inhibition of channel opening from the unconventional inner VSD site (right, in blue) mediated by PUFAs (gray). In the outer VSD site, PUFAs interact with the outermost positively charged gating charges of S4, which facilitates channel activation and channel opening. In the inner VSD site, PUFAs interact with the innermost gating charges of S4, stabilizing an intermediate or resting conformation that impairs channel opening. See also Figure 7—figure supplement 1, Figure 7—source data 1.
-
Figure 7—source data 1
Numerical data for Figure 7.
- https://cdn.elifesciences.org/articles/77672/elife-77672-fig7-data1-v1.xlsx
Figure 7—figure supplement 1
The impact of PUFA head group charge for effects on hKV7.4 arginine mutants.
Summary of the impact of the head group charge on the ability of PUFAs to shift V50 of indicated hKV7.4 arginine mutants, assessed by comparing the effects of negatively charged DHA, uncharged DHA-me, and positively charged DHA+ or AA+. Data shown as mean ± SEM. n = 6. Statistics denote one sample t test against a hypothetical mean of 0 mV. ns denotes not significant, * denotes p ≤ 0.05, ** denotes p ≤ 0.01, ** denotes p ≤ 0.001, **** denotes p ≤ 0.0001. Related to Figure 7.
Tables
Table 1
List of PUFAs and PUFA analogues used in this study.
| IUPAC name | Lipid no. (C:DBs) | Omega no. | Molecular structure |
|---|---|---|---|
| PUFAs: | |||
| Tetradecatrienoic acid (TTA) | 14:3 | ω–3 | 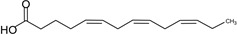 |
| Hexadecatrienoic acid (HTA) | 16:3 | ω–3 | 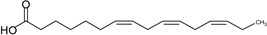 |
| Linoleic acid (LA) | 18:2 | ω–6 | 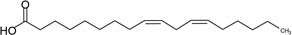 |
| Arachidonic acid (AA) | 20:4 | ω–6 | 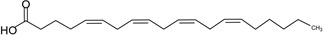 |
| Eicosapentaenoic acid (EPA) | 20:5 | ω–3 | 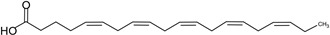 |
| Docosahexaenoic acid (DHA) | 22:6 | ω–3 |  |
| PUFA analogues: | |||
| Arachidonoyl amine (AA+) | 20:4 | ω–6 |  |
| Docosahexaneoic acid methyl ester (DHA-me) | 22:6 | ω–3 |  |
| Docosahexaenoyl amine (DHA+) | 22:6 | ω–3 |  |
-
C denotes number of carbon atoms in tail, DB denotes double bonds.
Table 2
Biophysical properties of tested constructs under control conditions.
| Channel | Variant | V50 (mV)Mean ± SEM | Slope (mV)Mean ± SEM | n |
|---|---|---|---|---|
| hKV7.4 | Wild-type | –11.1 ± 1.4 | 13.1 ± 0.2 | 20 |
| F182L | –21.0 ± 2.9 | 12.0 ± 0.5 | 10 | |
| R213Q | 4.6 ± 1.3 | 12.2 ± 0.4 | 24 | |
| R216Q | –26 ± 0.8 | 11.4 ± 0.3 | 24 | |
| R219Q | 13.3 ± 1.0 | 12.7 ± 0.2 | 24 | |
| S273A | –15.9 ± 3.1 | 14.1 ± 1.9 | 15 | |
| hKV7.5 | Wild-type | –42.2 ± 0.7 | 8.4 ± 0.2 | 23 |
| hKV7.4/7.5 | Wild-type | –22.9 ± 0.6 | 10.8 ± 0.2 | 18 |
| hKV7.4/KCNE4 | Wild-type | –12.9 ± 2.2 | 12.9 ± 1.3 | 7 |
-
n denotes number of cells. V50 and slope were determined from Boltzmann fits, as described in Materials and methods. See also Table 2—source data 1.
-
Table 2—source data 1
Numerical data for Table 2.
- https://cdn.elifesciences.org/articles/77672/elife-77672-table2-data1-v1.xlsx
Key resources table
| Reagent type (species) or resource | Designation | Source or reference | Identifiers | Additional information |
|---|---|---|---|---|
| Gene (human) | KCNQ4 | GenBank | Acc.No. NM_004700 | |
| Gene (human) | KCNQ5 | GenBank | Acc.No. NM_001160133 | |
| Gene (human) | KCNE4 | GenBank | Acc.No. NM_080671 | |
| Chemical compound, drug | Tetradecatrienoic acid (TTA) | Larodan | Cat#: 10–1403 | |
| Chemical compound, drug | Hexadecatrienoic acid (HTA) | Larodan | Cat#: 10–1603 | |
| Chemical compound, drug | Linoleic acid (LA) | Sigma-Aldrich | Cat#: L1012 | |
| Chemical compound, drug | Arachidonic acid (AA) | Sigma-Aldrich | Cat#: A3611 | |
| Chemical compound, drug | Eicosapentaenoic acid (EPA) | Sigma-Aldrich | Cat#: E2011 | |
| Chemical compound, drug | Docosahexaenoic acid (DHA) | Sigma-Aldrich | Cat#: D2534 | |
| Chemical compound, drug | Docosahexaenoic acid methyl ester (DHA-me) | Sigma-Aldrich | Cat#: D2659 | |
| Chemical compound, drug | Indomethacin | Sigma-Aldrich | Cat#: I7378 |
Additional files
Download links
A two-part list of links to download the article, or parts of the article, in various formats.
Downloads (link to download the article as PDF)
Open citations (links to open the citations from this article in various online reference manager services)
Cite this article (links to download the citations from this article in formats compatible with various reference manager tools)
Subtype-specific responses of hKv7.4 and hKv7.5 channels to polyunsaturated fatty acids reveal an unconventional modulatory site and mechanism
eLife 11:e77672.
https://doi.org/10.7554/eLife.77672


