Selective inhibition reveals the regulatory function of DYRK2 in protein synthesis and calcium entry
- The State Key Laboratory of Protein and Plant Gene Research, School of Life Sciences, Peking University, China
- Peking-Tsinghua Center for Life Sciences, Peking University, China
- Academy for Advanced Interdisciplinary Studies, Peking University, China
- Beijing National Laboratory for Molecular Sciences, Key Laboratory of Bioorganic Chemistry and Molecular Engineering of Ministry of Education, College of Chemistry and Molecular Engineering, Peking University, China
- SUSTech Academy for Advanced Interdisciplinary Studies, Southern University of Science and Technology, China
- Beijing Key Laboratory of Gene Resource and Molecular Development, Key Laboratory of Cell Proliferation and Regulation Biology, Ministry of Education, College of Life Sciences, Beijing Normal University, China
- Department of Chemistry, Southern University of Science and Technology, China
- Institute of Molecular Medicine, Peking University, China
- Peking University Institute of Hematology, People’s Hospital, China
- Collaborative Innovation Center of Hematology, China
- Life Sciences Institute, Zhejiang University, China
- Beijing Advanced Innovation Center for Genomics (ICG), Peking University, China
- Institute for Cancer Research, Shenzhen Bay Laboratory, China
Figures
Figure 1 with 3 supplements
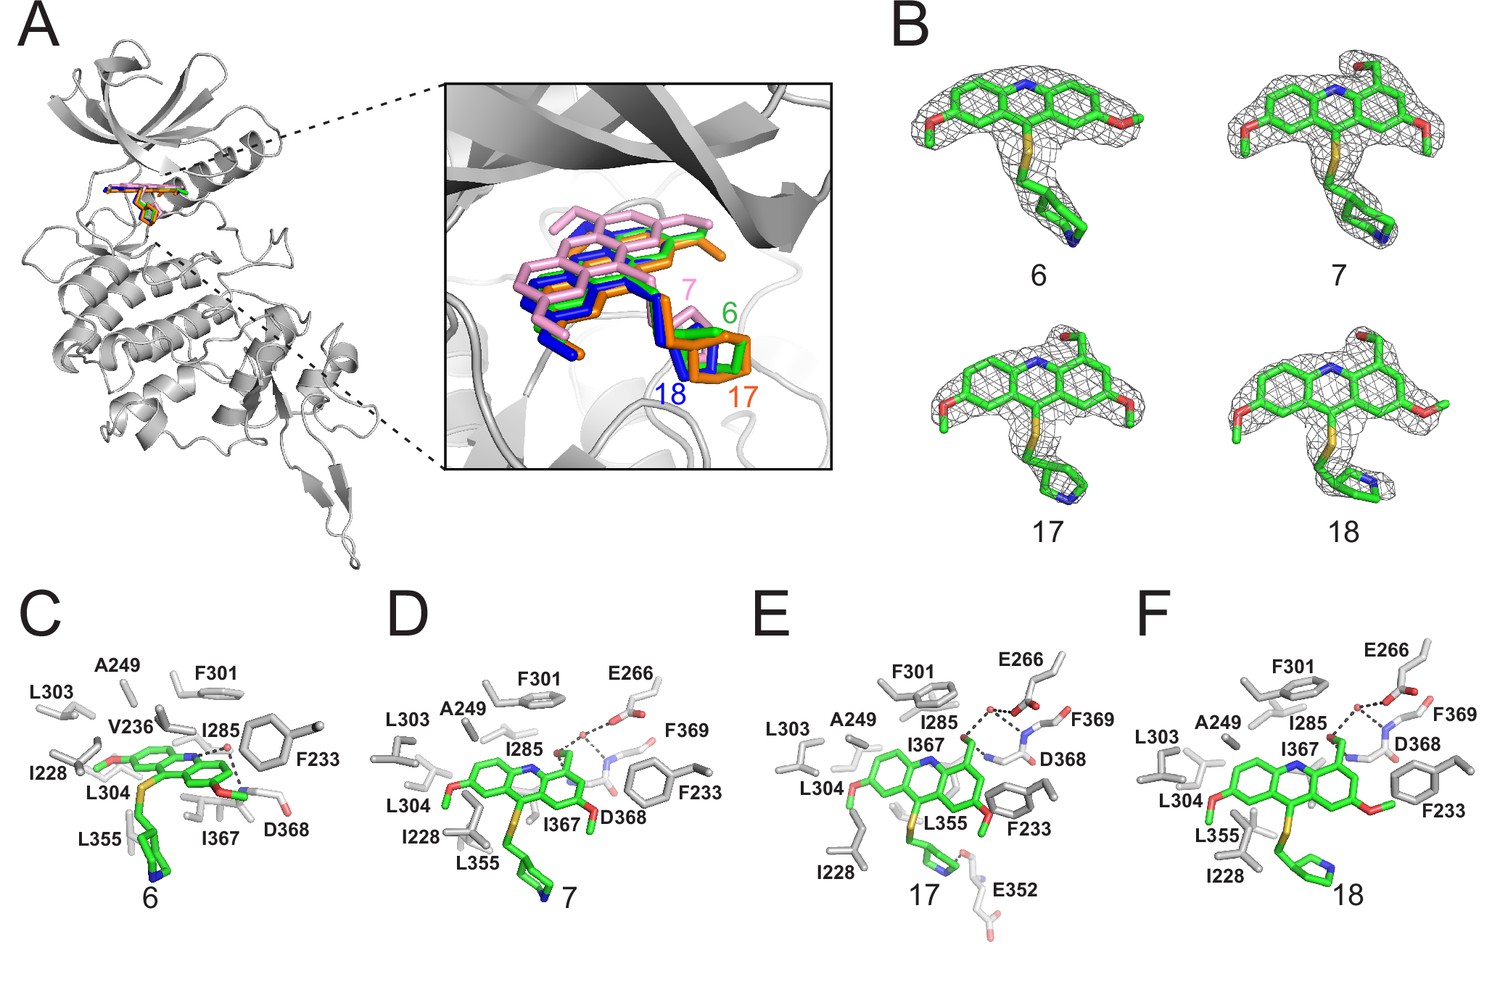
Crystal structures of DYRK2 bound to novel inhibitors.
(A) Overall structure of DYRK2 (grey) bound to 6 (green), 7 (pink), C17 (orange), and 18 (blue). (B) Composite omit maps are contoured at 1.5σand shown as gray meshes to reveal the presence of compounds 6, 7, 17, and 18 in the respective crystal structures. (C–F) Close-up view of the DYRK2 binding pocket with compounds 6, 7, 17, and 18. Hydrogen bonds are shown as dashed lines. Water molecules are indicated with red spheres.
-
Figure 1—source data 1
Data collection and refinement statistics of crystal structures of DYRK2 with different inhibitors.
- https://cdn.elifesciences.org/articles/77696/elife-77696-fig1-data1-v3.zip
Figure 1—figure supplement 1
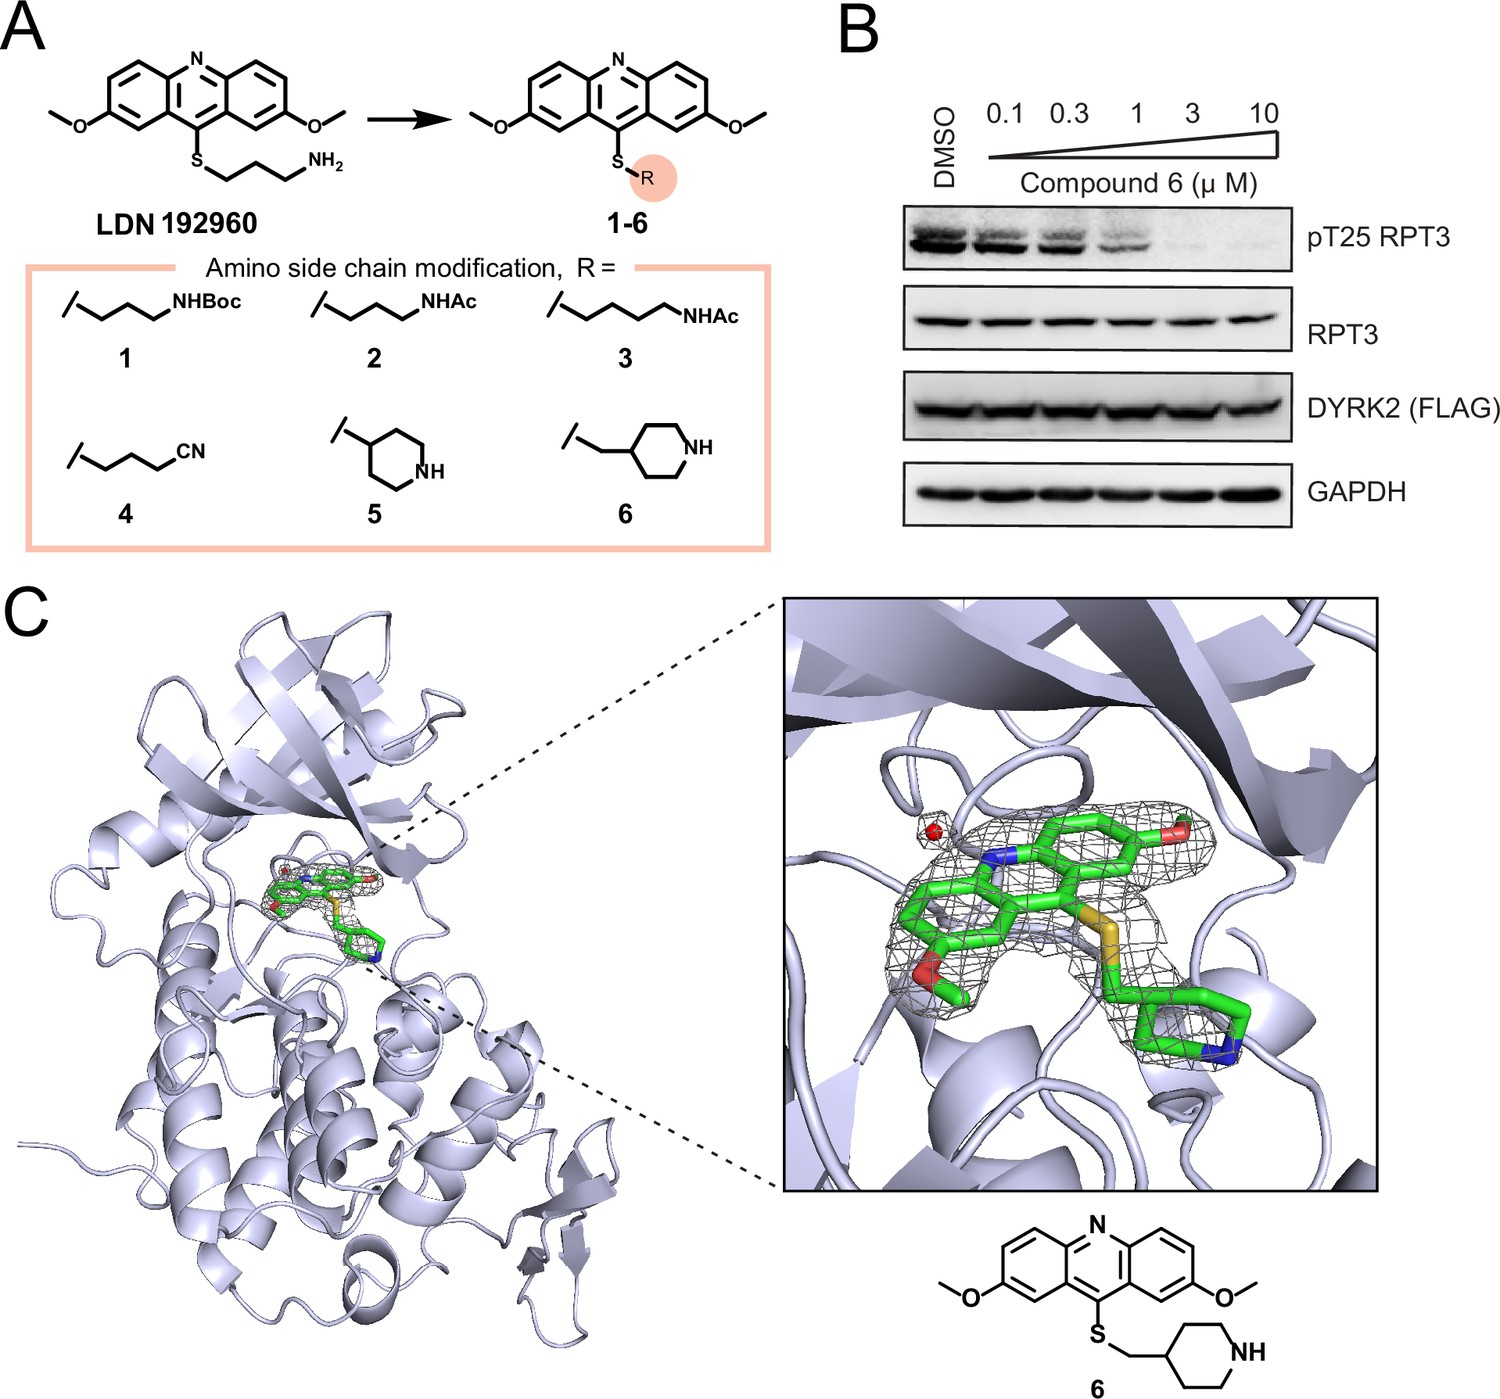
Chemical compounds derived from LDN192960.
(A) Structure of amino side chain change analogues 1–6 based on LDN192960. (B) HEK293T cells stably expressing FLAG-DYRK2 were treated with the indicated concentrations of compound 6 in 1 hr. Cells were lysed and immunoblotting was carried out with the indicated antibodies. (C) Structure of DYRK2 in complex with compound 6. DYRK2 is shown as ribbons and colored in blue white. The 2Fo-Fc difference electron density map (1.5 σwhich reveals the presence of 6 and water is shown as a gray mesh. The 6 and water are omitted to calculate the map).
-
Figure 1—figure supplement 1—source data 1
Raw data of western blot for Figure 1—figure supplement 1B.
- https://cdn.elifesciences.org/articles/77696/elife-77696-fig1-figsupp1-data1-v3.zip
Figure 1—figure supplement 2
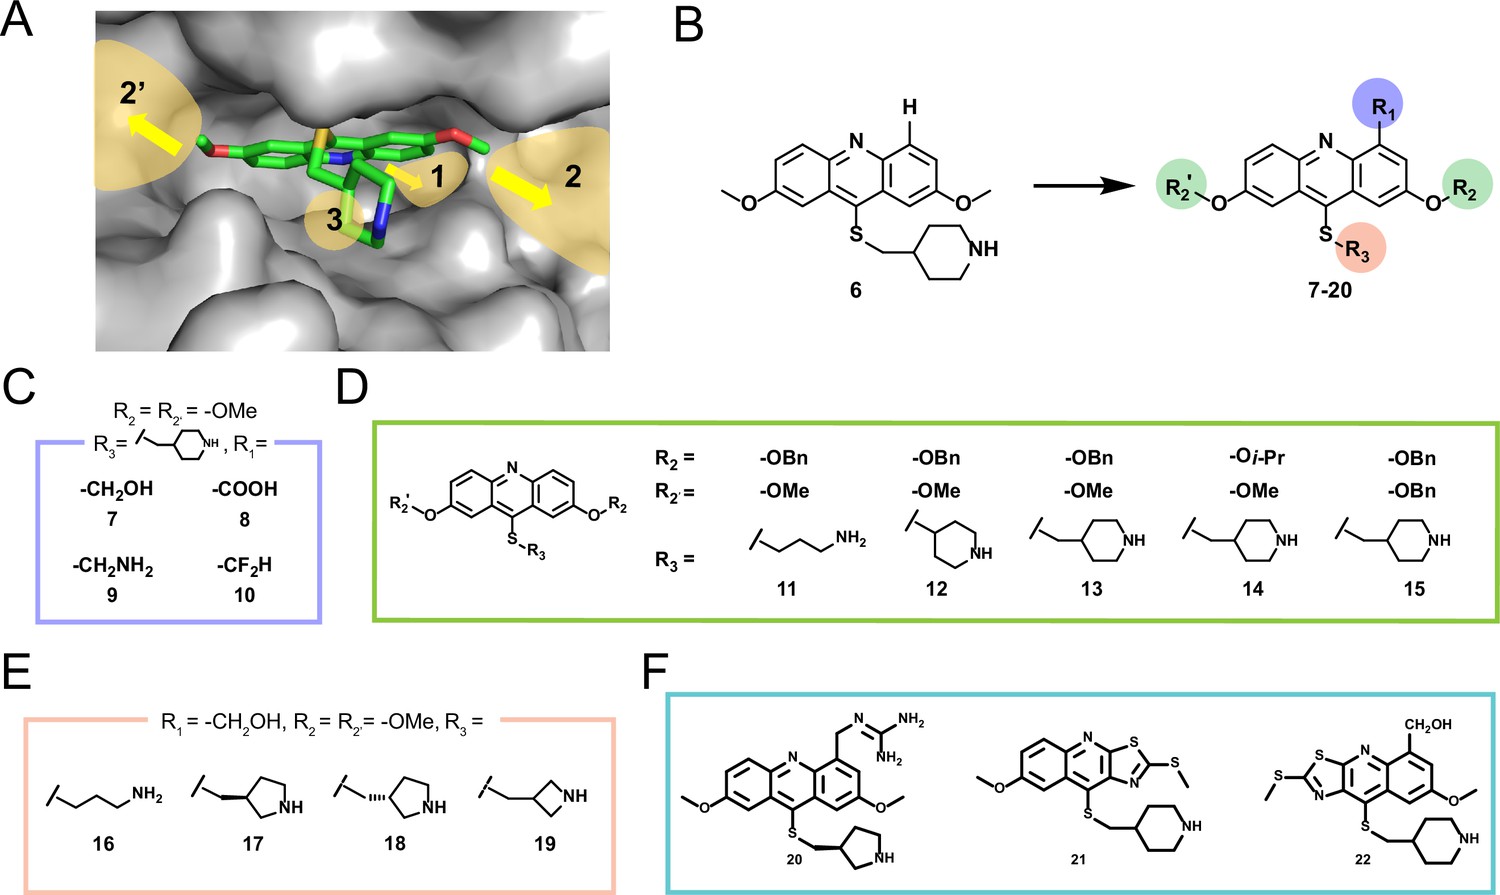
Structure-guided engineering of DYRK2 inhibitors based on compound 6.
(A) The possible sites for further expansion based on the co-crystal structure of 6 and DYRK2. (B) Overview of modification of compound 6. (C) Modifications for inner space 1. (D) Modifications for cavity around ATP-binding pocket. (E) Modifications of amine side chain based on compound 7. (F) Modifications based on compound 17.
Figure 1—figure supplement 3
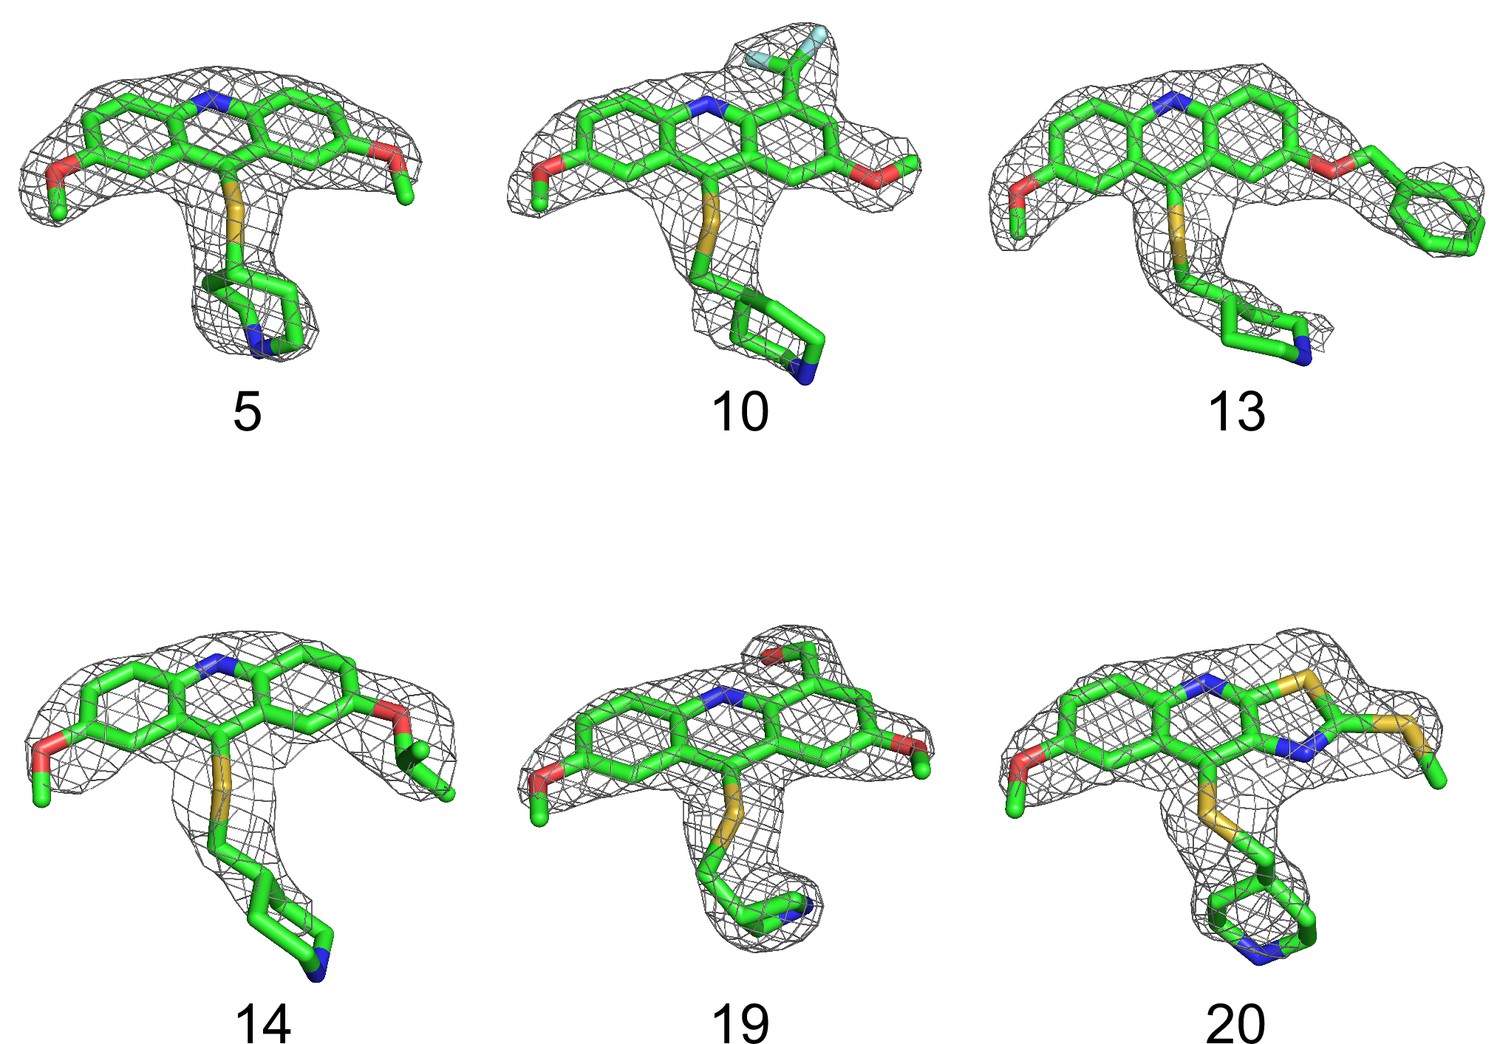
The 2Fo-Fc composite omit maps (1.5 σsurrounding compounds 5, 10, 13, 14, 19, and 20 are shown in the co-crystal structures with DRYK2, respectively).
Figure 2 with 2 supplements
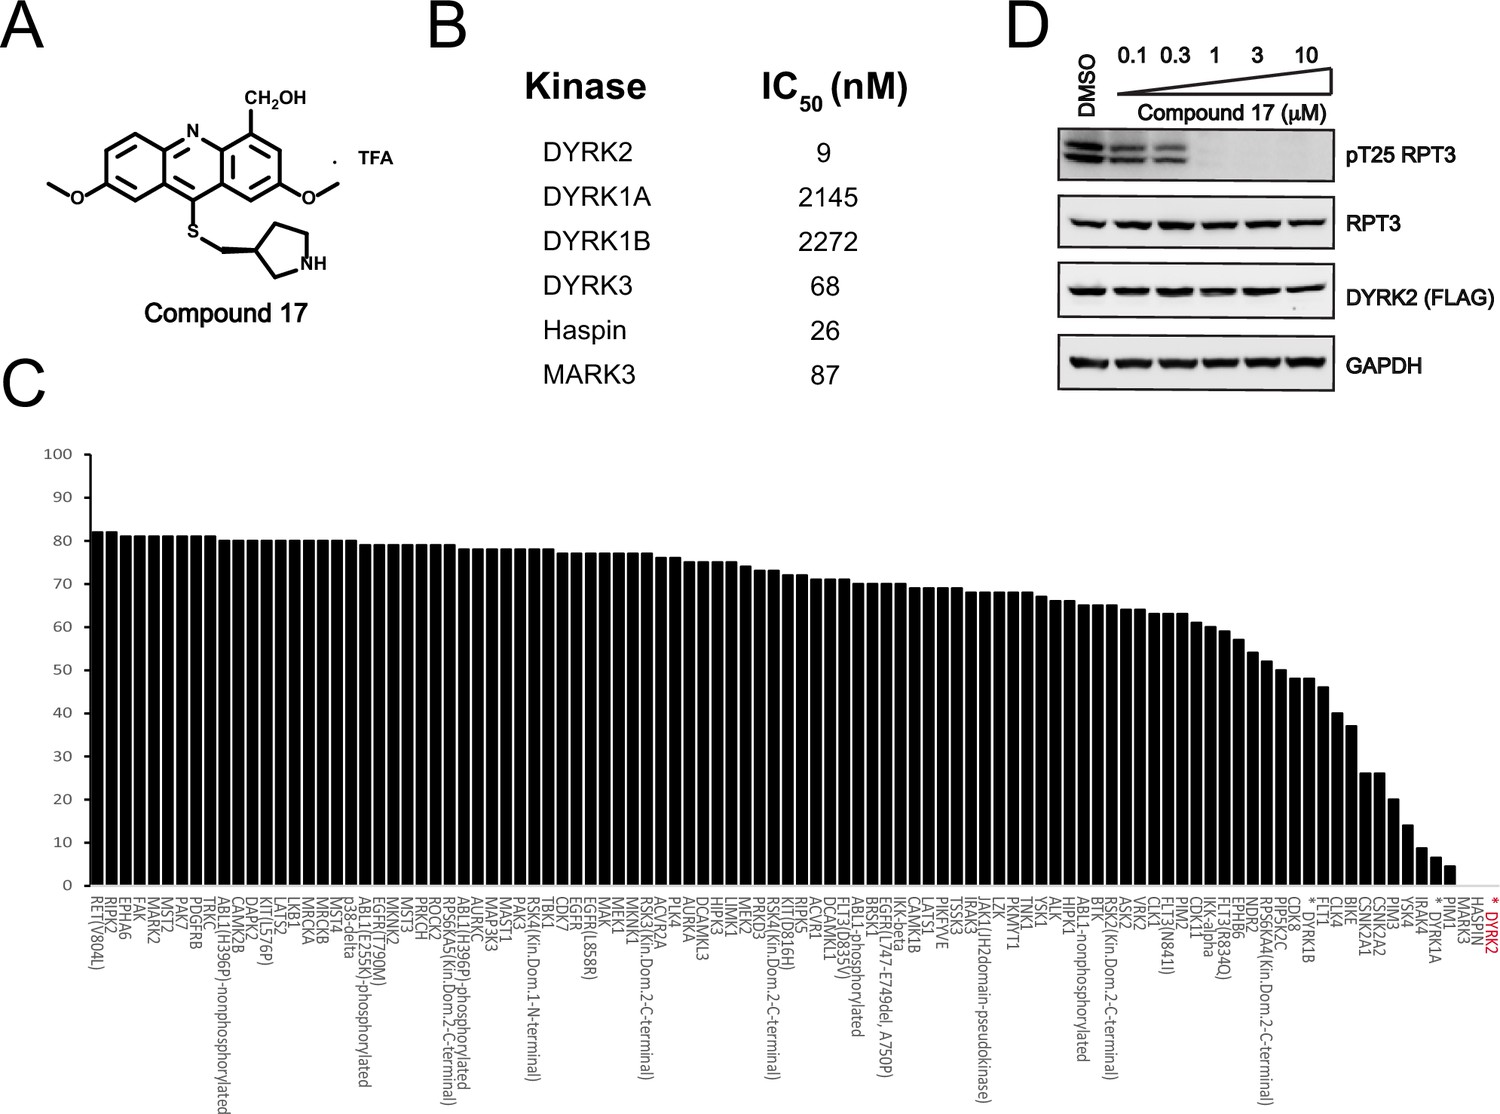
C17 is a potent and selective inhibitor of DYRK2.
(A) Chemical structure of C17. (B) IC50 values of C17 against DYRK1A, DYRKIB, DYRK3, Haspin and MARK3. (C) Kinome profiling of C17 at 500 nM was carried out using 468 human kinases (https://www.discoverx.com/). (D) C17 inhibits Rpt3-Thr25 phosphorylation. HEK293T cells stably expressing FLAG-DYRK2 were treated with the indicated concentrations of C17 for 1 hr. The cells were lysed, and immunoblotting was carried out with the indicated antibodies.
-
Figure 2—source data 1
Raw data of C17 Kinome profiling list for Figure 2C.
- https://cdn.elifesciences.org/articles/77696/elife-77696-fig2-data1-v3.zip
-
Figure 2—source data 2
Raw data of western blot for Figure 2D.
- https://cdn.elifesciences.org/articles/77696/elife-77696-fig2-data2-v3.zip
Figure 2—figure supplement 1
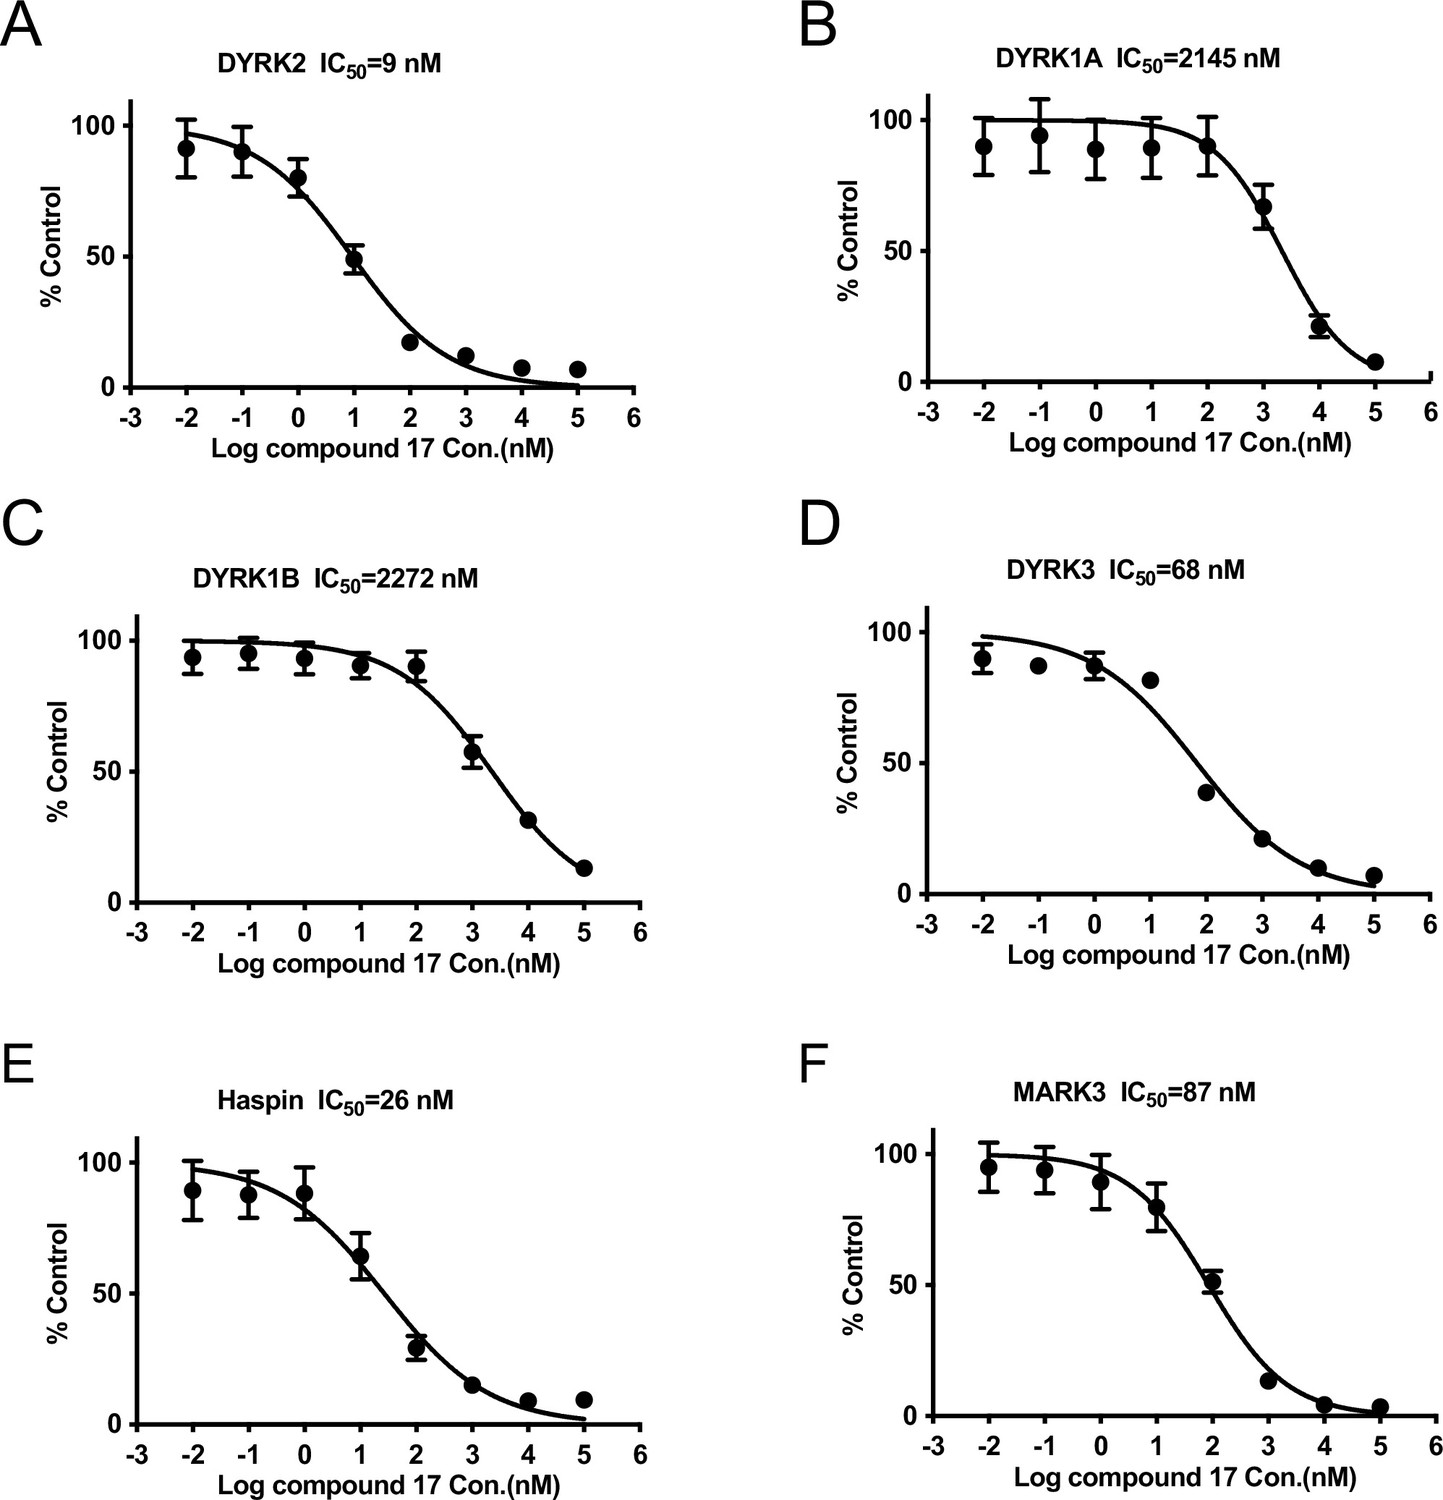
IC50 of C17 on DYRK2 and its main off targets.
(A–E) IC50 of C17 on DYRK2, DYRK1A, DYRK1B, DYRK3, Haspin and MARK3. The IC50 graph was plotted using GraphPad Prism 8.4.0 software. The results are presented as the percentage of kinase activity relative to the DMSO-treated control. Results are means ± SD for triplicate reactions with similar results obtained in at least one other experiment.
Figure 2—figure supplement 2
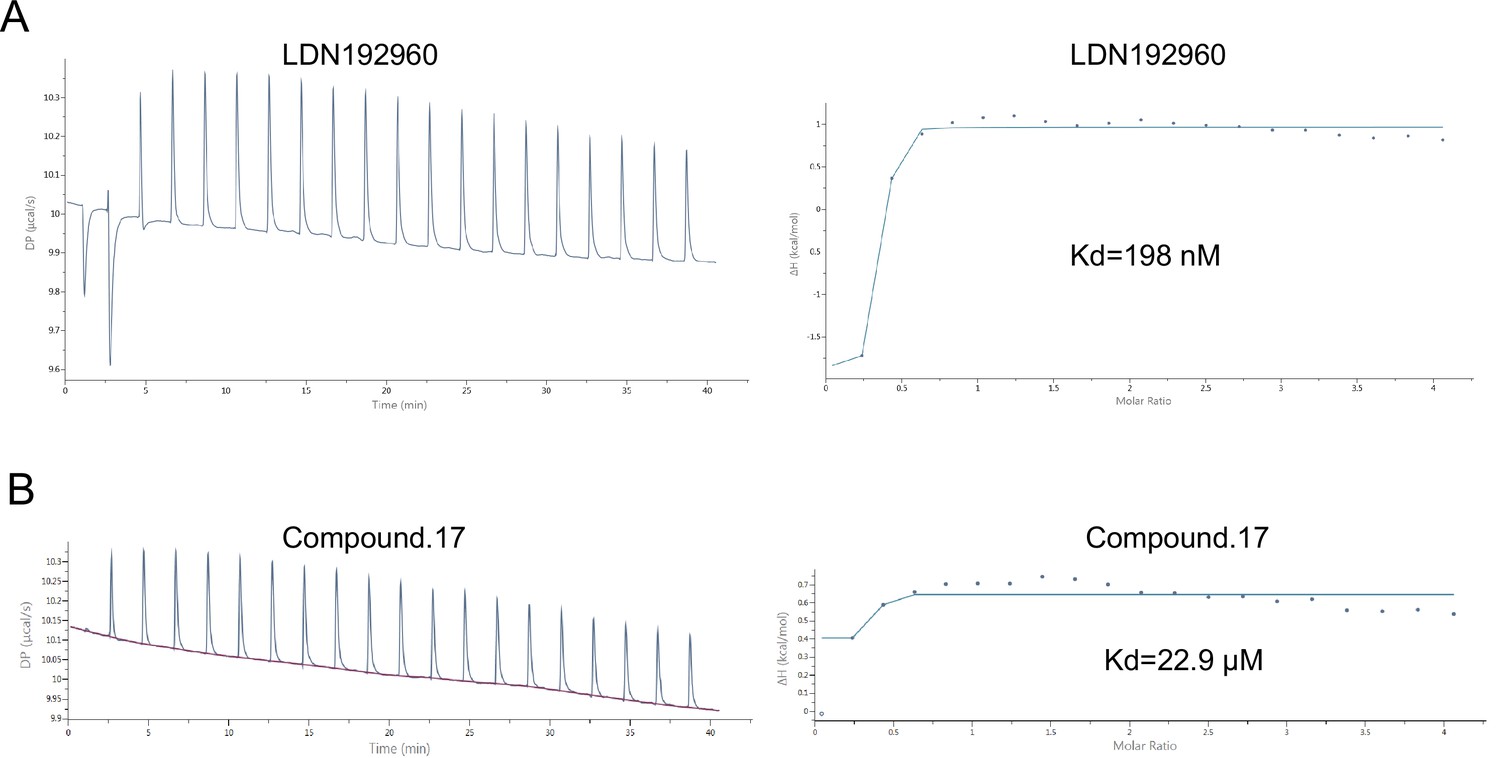
Binding strength of LDN192960 and C17 with calf thymus DNA.
(A) Binding strength of LDN192960 with calf thymus DNA tested by Isothermal titration calorimetry. (B) Binding strength of C17 with calf thymus DNA tested by Isothermal titration calorimetry.
Figure 3 with 3 supplements

Quantitative phosphoproteomic analysis of U266 cells treated with C17.
(A) Workflow of the phosphoproteomic approach. Triplicate samples treated with/without 10 μM C17 for 1 hr were separately lysed and digested, and the phosphorylated peptides were enriched by the Ti4+-IMAC tip and analyzed by LC-MS/MS. (B) Distribution of the assigned amino acid residues and their localization probabilities (Class I > 0.75, Class II > 0.5 and ≤ 0.75, Class III > 0.25 and ≤ 0.5) for all identified phosphorylation sites. (C) Volcano plot (FDR < 0.05 and S0 = 2) shows the significantly up-and downregulated phosphosites after C17 treatment. (D) MS/MS spectra of the phosphosites of two potential DYRK2 substrates, pT37 of 4E-BP1 and pS519 and pS521 of STIM1. (E) Global canonical pathway analysis of the significantly up-and downregulated phosphoproteins. –Log10 adjusted p-values associated with a pathway are presented.
-
Figure 3—source data 1
Raw data of the significantly up- and down-regulated phosphosites after U266 cells treated with C17 for Figure 3C.
- https://cdn.elifesciences.org/articles/77696/elife-77696-fig3-data1-v3.zip
Figure 3—figure supplement 1

Correlation of the intensities of phosphosites between any two samples in phosphoproteomic analysis of U266 cells treated with/without C17.
-
Figure 3—figure supplement 1—source data 1
Raw data of the intensities of phosphosites in phosphoproteomic analysis of U266 cells treated with/without C17.
- https://cdn.elifesciences.org/articles/77696/elife-77696-fig3-figsupp1-data1-v3.zip
Figure 3—figure supplement 2
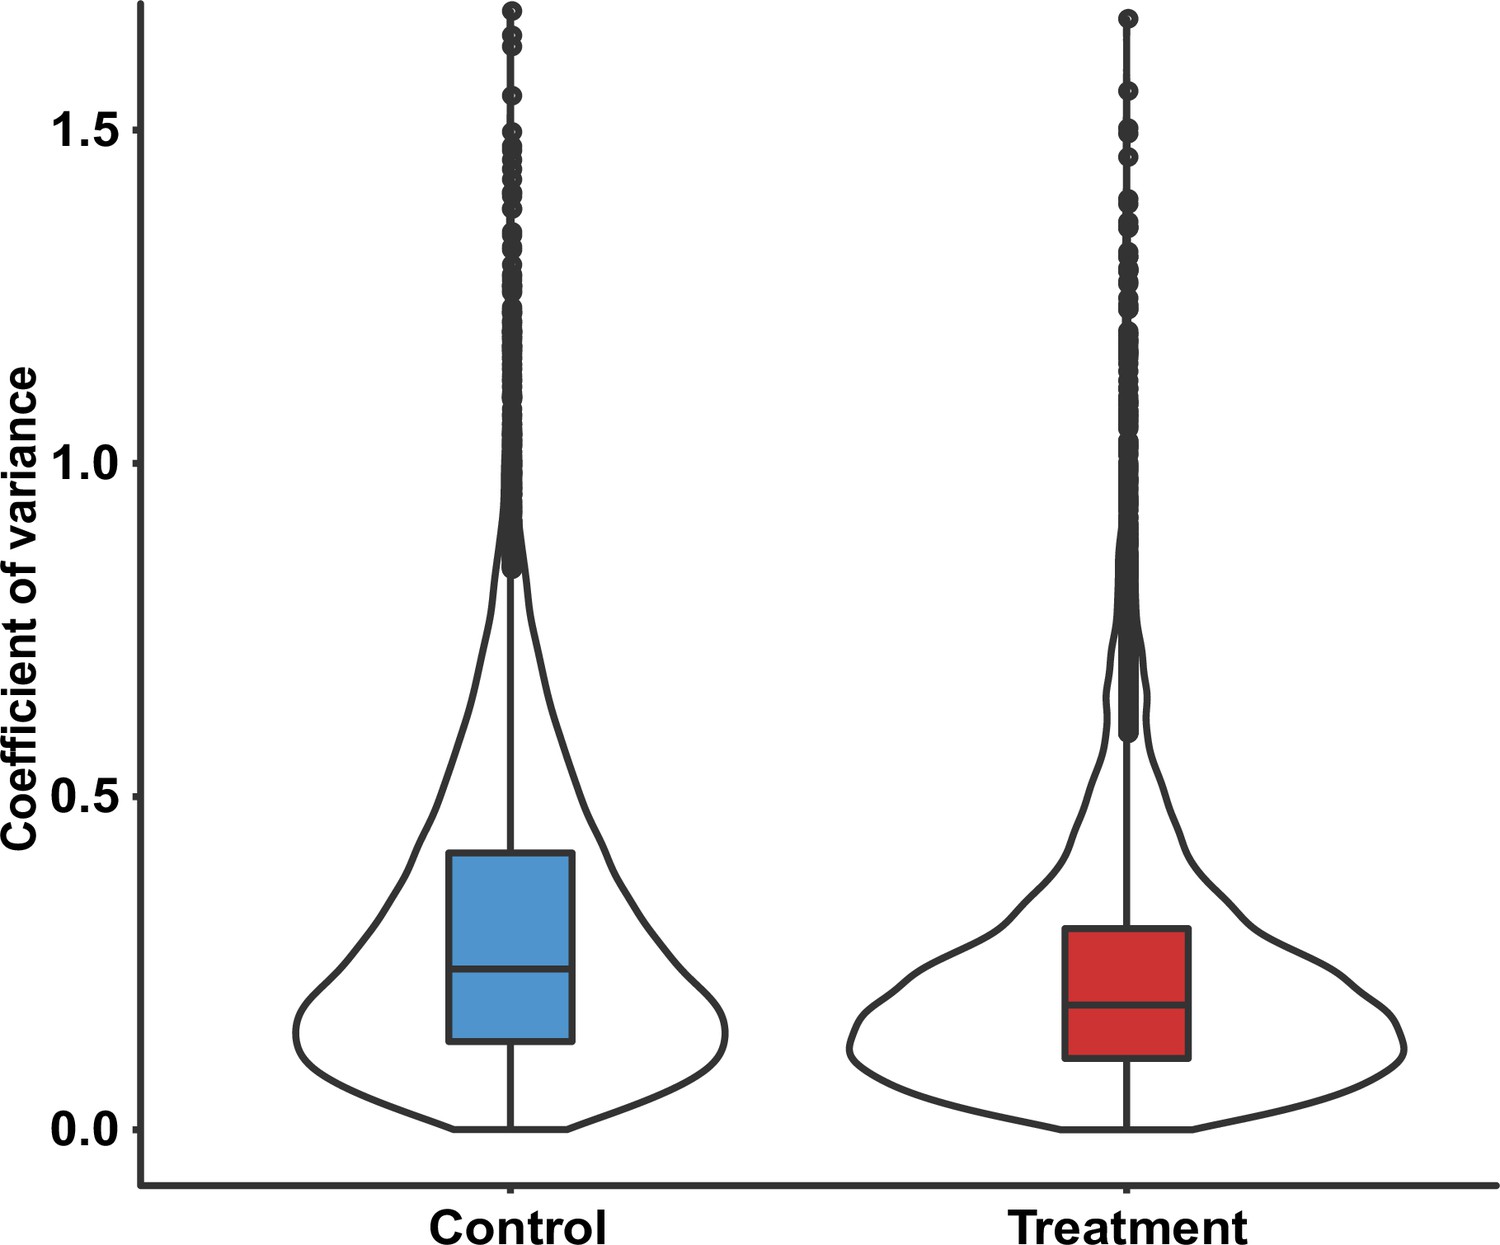
Coefficient of variance of the intensities of phosphosites in phosphoproteomic analysis of U266 cells treated with/without C17.
-
Figure 3—figure supplement 2—source data 1
Raw data of the intensities of phosphosites in phosphoproteomic analysis of U266 cells treated with/without C17.
- https://cdn.elifesciences.org/articles/77696/elife-77696-fig3-figsupp2-data1-v3.zip
Figure 3—figure supplement 3
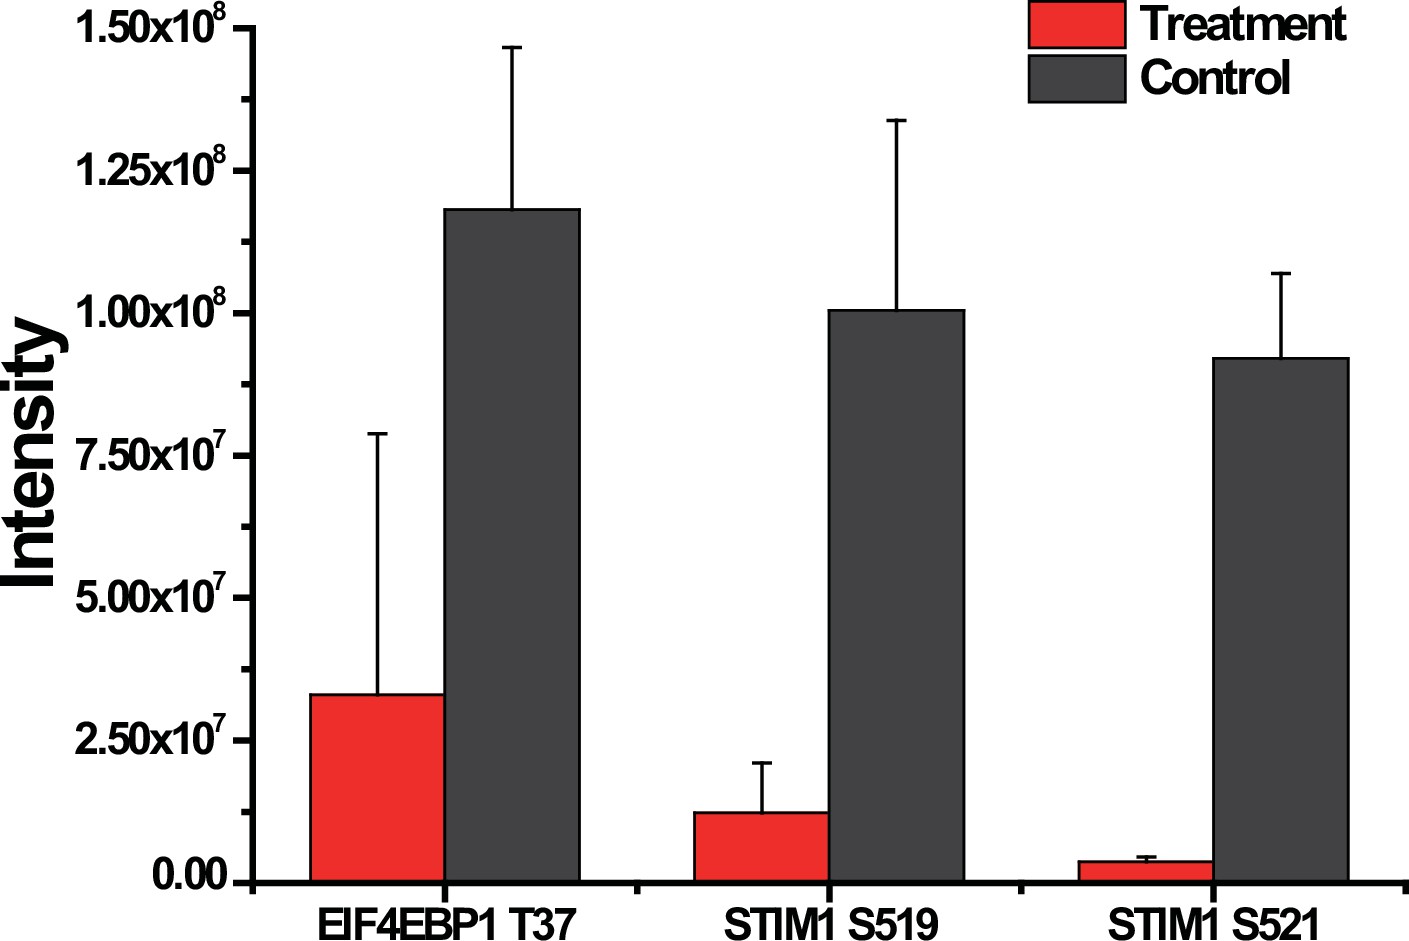
The intensities for pT37 phosphosite of EIF4E-BP1 and pS519, pS521 phosphosites of STIM1.
Data was presented as mean values ± SD (error bars).
-
Figure 3—figure supplement 3—source data 1
Raw data of the intensities for pT37 phosphosite of 4E-BP1 and pS519, pS521 phosphosites of STIM1 for Figure 3—figure supplement 3.
- https://cdn.elifesciences.org/articles/77696/elife-77696-fig3-figsupp3-data1-v3.zip
Figure 4 with 2 supplements
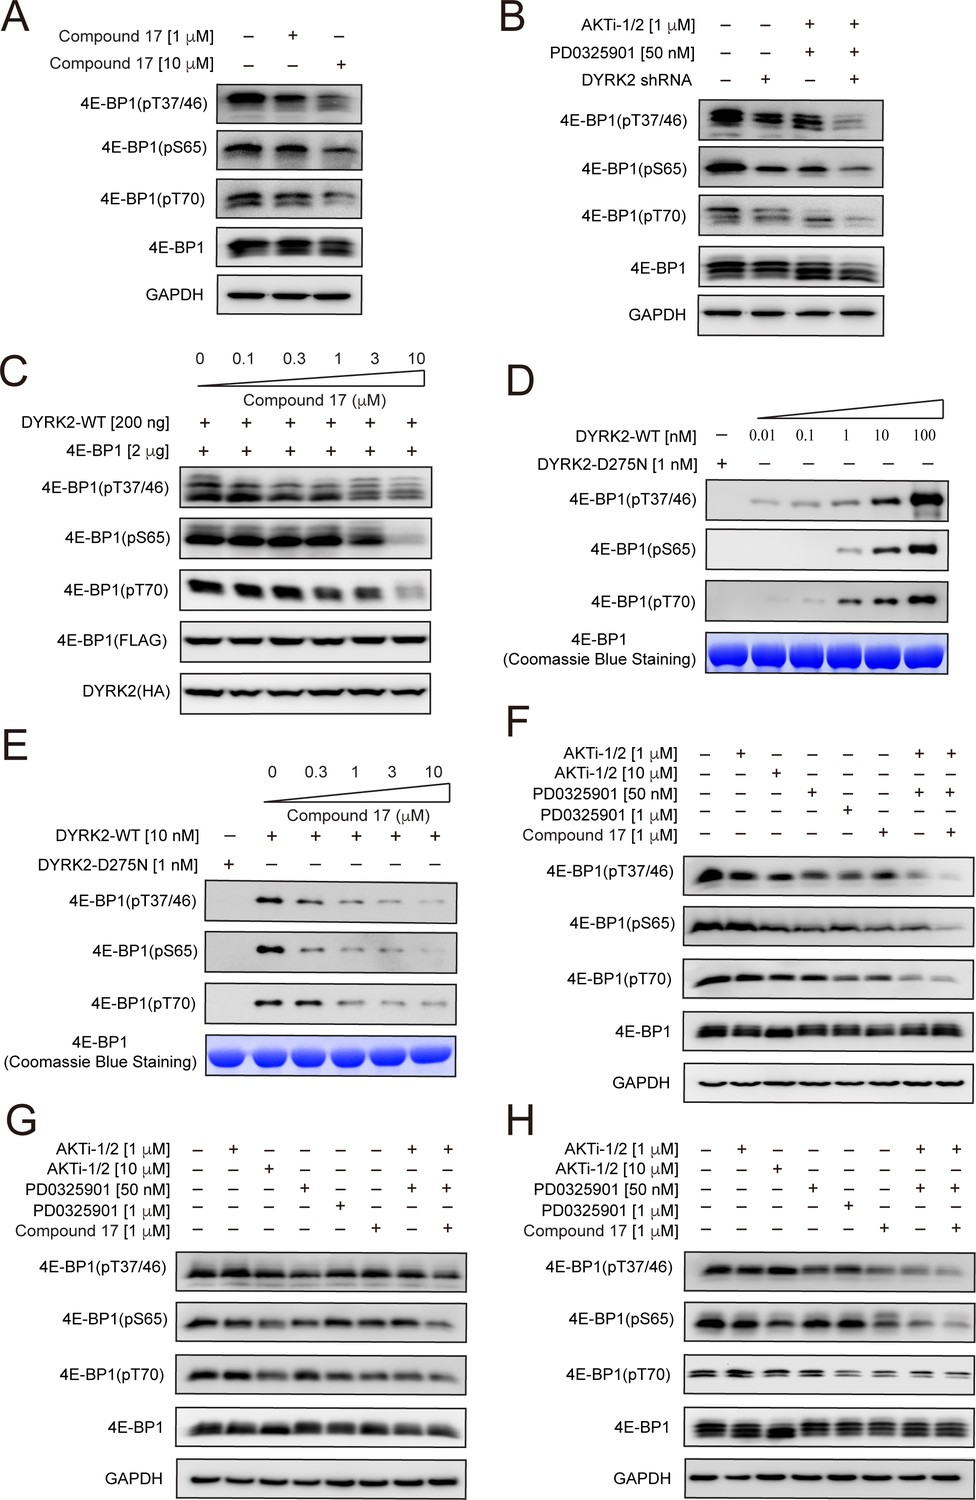
4E-BP1 is a substrate of DYRK2.
(A) C17 treatment for 1 hr reduced the phosphorylation of endogenous 4E-BP1 in HEK293T cells. The phosphorylation status of 4E-BP1 was analyzed by immunoblotting cell lysates using indicated antibodies. (B) DYRK2 knockdown decreases the phosphorylation of endogenous 4E-BP1 in HEK293T cells. (C) HEK293A cells stably expressing HA-DYRK2 and FLAG-4E-BP1 were treated with indicated concentrations of C17 for 1 hr. The cells were lysed, and immunoblotting was carried out with indicated antibodies. (D) DYRK2 directly phosphorylated 4E-BP1 at multiple sites. (E) C17 inhibited DYRK2-mediated 4E-BP1 phosphorylation in a concentration-dependent manner. (F–H) C17 displayed a synergistic effect with AKT and MEK inhibitors to suppress 4E-BP1 phosphorylation in HEK293A (F), HCT116 (G), and U266 cells. (H) The cells were treated with indicated concentrations of PD032590, AKTi-1/2, and C17 alone or in combination for 1 hr. Cell lysates were immunoblotted with indicated antibodies.
-
Figure 4—source data 1
Raw data of Western blot for Figure 4A, B.
- https://cdn.elifesciences.org/articles/77696/elife-77696-fig4-data1-v3.zip
-
Figure 4—source data 2
Raw data of western blot for Figure 4C, D.
- https://cdn.elifesciences.org/articles/77696/elife-77696-fig4-data2-v3.zip
-
Figure 4—source data 3
Raw data of western blot for Figure 4E, F.
- https://cdn.elifesciences.org/articles/77696/elife-77696-fig4-data3-v3.zip
-
Figure 4—source data 4
Raw data of western blot for Figure 4G, H.
- https://cdn.elifesciences.org/articles/77696/elife-77696-fig4-data4-v3.zip
Figure 4—figure supplement 1

Knockdown efficiency of DYRK2-expression in wild-type HEK293T stably expressed DYRK2 shRNA was measured by qPCR.
GAPDH was used as an internal standard, and fold change was calculated by comparing expression levels relative to those of pLL3.7-shRNA-scramble (negative control). Data are presented as the means ± SD (n = 3 biological replicates per condition, ***, p = 0.0001, unpaired Student’s t-test).
-
Figure 4—figure supplement 1—source data 1
Raw qPCR data of knockdown efficiency of DYRK2-expression in wild-type HEK293T for Figure 4—figure supplement 1.
- https://cdn.elifesciences.org/articles/77696/elife-77696-fig4-figsupp1-data1-v3.zip
Figure 4—figure supplement 2

All primer sequences for qRT-PCR, shRNA targeting sequences are listed.
Figure 5 with 1 supplement
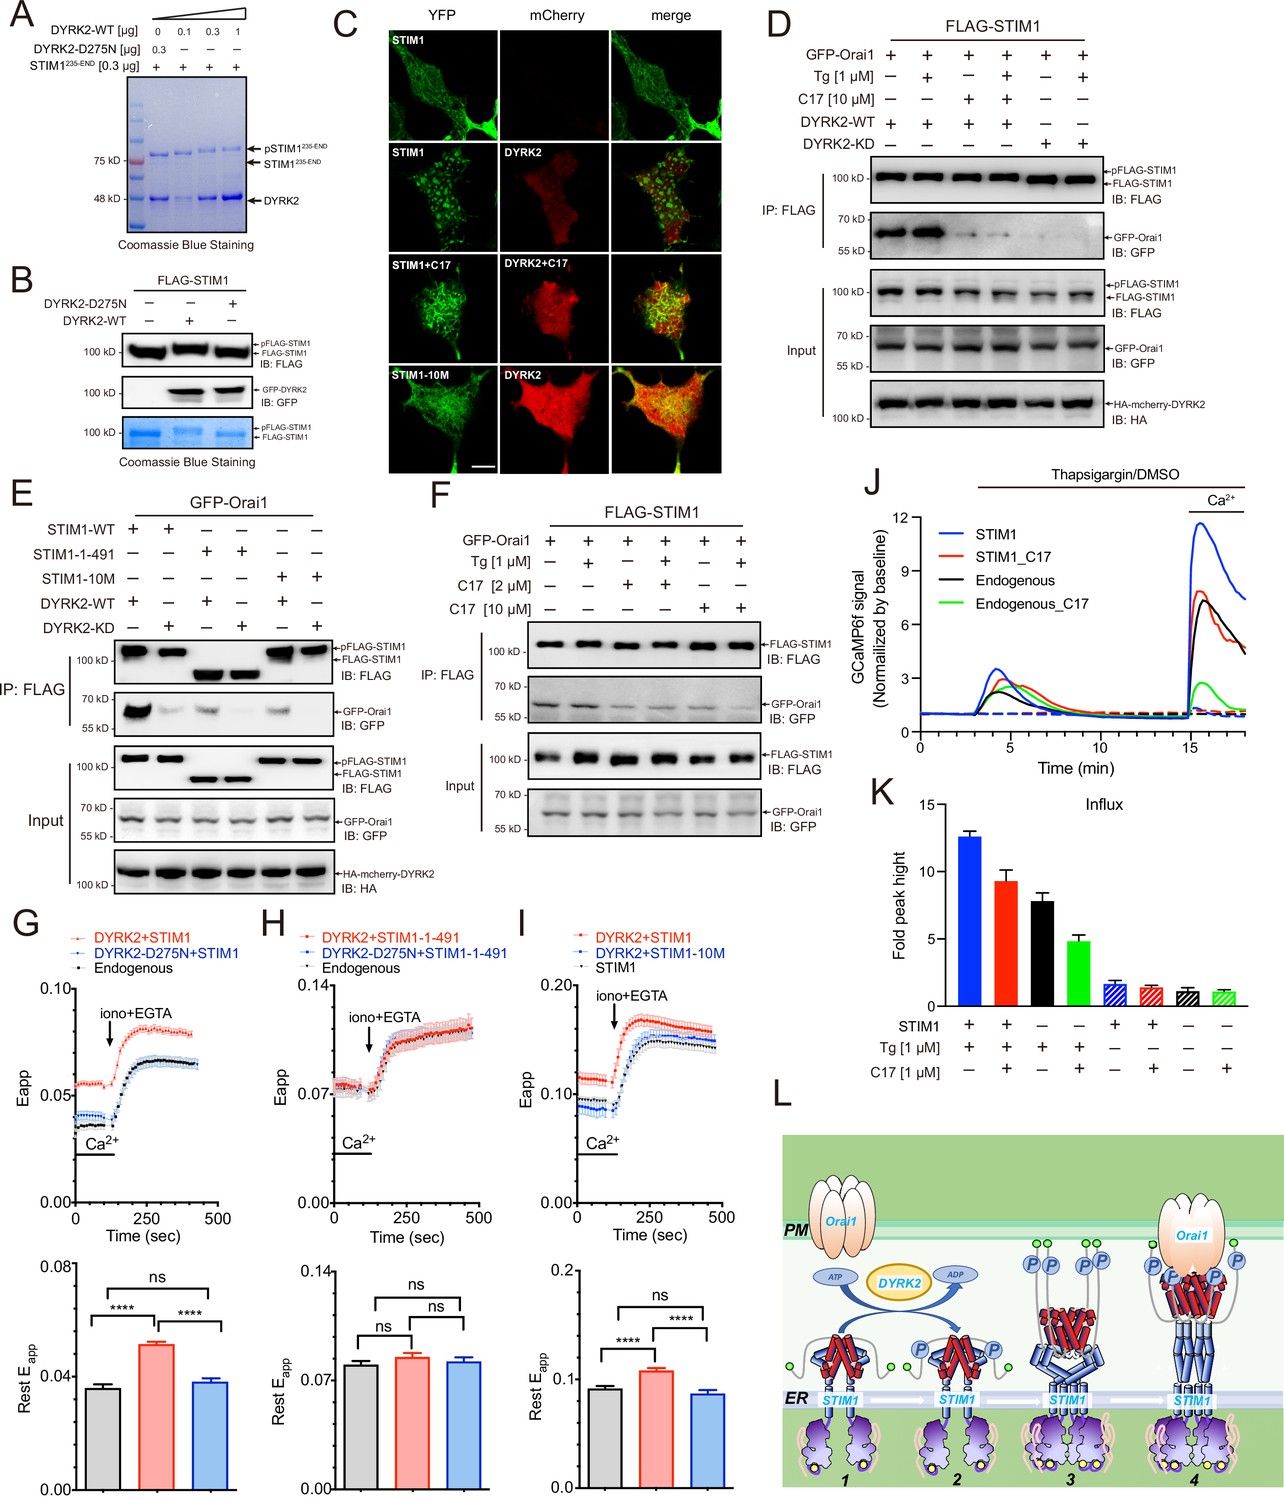
Phosphorylation of STIM1 by DYRK2 modulates SOCE.
(A) DYRK2 directly phosphorylated STIM1. GST-STIM1235-END was incubated with wild-type or kinase-deficient DYRK2 in the presence of Mn-ATP for 30 min. Phosphorylation of GST-STIM1235-END was indicated by the mobility change of STIM1 in SDS-PAGE gel. (B) DYRK2 phosphorylated STIM1 in vivo. HEK293A cells were co-transfected with FLAG-STIM1 and DYRK2 for 36 h, then states immunoblotted with the indicated antibodies. (C) Typical confocal microscopy images showing the effects of mCherry-DYRK2 and/or C17 (1 μM) on the puncta formation of STIM1 in the HEK293 Orai1/Orai2/Orai3-TKO cells. The scale bar is 10 μm. The experiments were repeated, six cells were examined each time. (D) DYRK2 promoted the interaction between STIM1 and OraiI1. HEK293A cells were co-transfected with FLAG-STIM1, GFP-Orai1, and DYRK2 for 36 hr. STIM1 was immunoprecipitated with FLAG agarose, and the associated proteins were analysed using the indicated antibodies. (E) Phosphosites mutations in STIM1 disrupt the interaction with Orai1. (F) C17 inhibits the interaction between FLAG-STIM1 and GFP-Orai1 without exogenously expressing DYRK2. (G–I) Effects of DYRK2 on the FRET signals between STIM1-YFP and CFP-Orai1. Upper panel, typical traces; lower panel, statistics. (G) HEK293 cells stably expressing STIM1-YFP and CFP-Orai1. (n = 3, ****, p < 0.0001. unpaired Student’s t-test). (H) HEK293 STIM1-STIM2 DKO cells stably expressing Orai1-CFP cells transiently expressing STIM1-1-491-YFP (n = 3, unpaired Student’s t-test). (I) HEK STIM1-STIM2 DKO cells transiently expressing STIM1-YFP (red) or STIM1-10M (blue). (n = 3, ****, p < 0.0001, unpaired Student’s t-test). (J) C17 inhibited SOCE in HEK293A cells. HEK293A cells were transfected with GCAMP6f or GCAMP6f plus STIM1 for 24 hr and then treated with 1 μM C17 for 1 hr. Before thapsigargin treatment, the cell culture medium was switched to a Ca2+-free medium containing thapsigargin (1 μM, solid lines) or DMSO (dashed lines) was added to the cells, and 2 mM Ca2+ was added 12 min later. The red and green lines correspond to C17-treated cells. Blue and black lines represent untreated cells. GCAMP6f fluorescence was monitored by a Zeiss LSM 700 laser scanning confocal microscope. (K) Quantification of (J). The following number of cells were monitored: STIM1, 45 cells on 3 coverslips (blue solid line); STIM1 +C17 (1 μM), 48 cells on 3 coverslips (red solid line); endogenous, 47 cells on 3 coverslips (black solid line); endogenous +C17 (1 μM), 42 cells on 3 coverslips (green solid line). STIM1(-Tg), 43 cells on 3 coverslips (blue dashed line). STIM1 +C17 (1 μM) (-Tg), 43 cells on 3 coverslips (red dashed line); endogenous (-Tg), 43 cells on 3 coverslips (black dashed line); and endogenous +C17 (1 μM) (-Tg), 43 cells on 3 coverslips (green dashed line). Error bars represent the means ± SEM. (L) A hypothetic model depicts DYRK2-mediated STIM1 activation.
-
Figure 5—source data 1
Raw data of Coomassie Blue Staining for Figure 5A.
- https://cdn.elifesciences.org/articles/77696/elife-77696-fig5-data1-v3.zip
-
Figure 5—source data 2
Raw data of western blot and Coomassie Blue Staining for Figure 5B.
- https://cdn.elifesciences.org/articles/77696/elife-77696-fig5-data2-v3.zip
-
Figure 5—source data 3
Raw data of western blot for Figure 5D,E.
- https://cdn.elifesciences.org/articles/77696/elife-77696-fig5-data3-v3.zip
-
Figure 5—source data 4
Raw data of Western blot for Figure 5F.
- https://cdn.elifesciences.org/articles/77696/elife-77696-fig5-data4-v3.zip
-
Figure 5—source data 5
Raw data of FRET responses between STIM1-YFP and CFP-Orai1 for Figure 5G, FRET responses between STIM1-1-491-YFP and CFP-Orai1 for Figure 5H, FRET responses between STIM1-YFP, STIM1-10M-YFP and CFP-Orai1 for Figure 5I.
- https://cdn.elifesciences.org/articles/77696/elife-77696-fig5-data5-v3.zip
-
Figure 5—source data 6
Raw data of Store-operated Ca2+ entry (SOCE) analyses for Figure 5J.
- https://cdn.elifesciences.org/articles/77696/elife-77696-fig5-data6-v3.zip
Figure 5—figure supplement 1

Quantitative analysis of phosphorylation sites on STIM1.
(A)Workflow for the identification of phosphosites influenced by C17 on STIM1. Triplicate HEK293A cells co-transfected with FLAG-STIM1 were treated with 10 μM C17 for 1 hr, enriched by FLAG-beads, digested by FASP (Filter-Aided Sample Preparation) and quantified by label-free proteomics. (B) The changed phosphorylation levels on peptides of STIM1. The phosphorylation of eight phosphosites (shown in red) on four peptides of STIM1 was significantly reduced upon treatment with C17 compared with the control group. (C) STIM1 constructs used.
-
Figure 5—figure supplement 1—source data 1
Raw data of quantitative analysis of phosphorylation sites on STIM1 by DYRK2 upon C17 treatment for Figure 5—figure supplement 1.
- https://cdn.elifesciences.org/articles/77696/elife-77696-fig5-figsupp1-data1-v3.zip
Appendix 1—scheme 1

Synthesis route of C1-C4.
Appendix 1—scheme 2

Synthesis route of C5-C6.
Appendix 1—scheme 3

General procedure of C7, C16-C19 synthesis.
Appendix 1—scheme 4

Synthesis route of C7.
Appendix 1—scheme 5

Synthesis route of C8.
Appendix 1—scheme 6

Synthesis route of C9.
Appendix 1—scheme 7

Synthesis route of C10.
Appendix 1—scheme 8

General procedure of C11-C14 synthesis.
Appendix 1—scheme 9

Synthesis route of C15.
Appendix 1—scheme 10

Synthesis route of C20.
Appendix 1—scheme 11

Synthesis route of C21.
Appendix 1—scheme 12

Synthesis route of C22.
Tables
Table 1
The Inhibitory activity and selectivity of acridine analogs of DYRK2.
| Cmpd. | 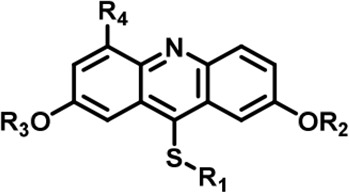 | IC50 at molecular level (nM) | Selectivity | ||||||||||||
|---|---|---|---|---|---|---|---|---|---|---|---|---|---|---|---|
| R1 | R2 | R3 | R4 | DYRK2 | DYRK1A | DYRK1B | DYRK3 | Haspin | MARK3 | DYRK2&DYRK1A | DYRK2&DYRK1B | DYRK2&DYRK3 | DYRK2&Haspin | DYRK2&MARK3 | |
| LDN192960 |  | -CH3 | -CH3 | -H | 53 ± 2 | 1859 ± 30 | 2900 ± 39 | 22 ± 4 | 18 ± 2 | 611 ± 19 | 35 | 55 | ~ | ~ | 12 |
| 1 |  | -CH3 | -CH3 | -H | 38 ± 2 | 651 ± 29 | 1401 ± 91 | 115 ± 4 | 34 ± 3 | 36 ± 2 | 17 | 17 | 3 | ~ | ~ |
| 2 |  | -CH3 | -CH3 | -H | 31 ± 1 | 731 ± 36 | 1477 ± 128 | 94 ± 9 | 27 ± 3 | 27 ± 5 | 24 | 48 | 3 | ~ | ~ |
| 3 |  | -CH3 | -CH3 | -H | 41 ± 2 | 1018 ± 78 | 2495 ± 88 | 157 ± 18 | 24 ± 1 | 33 ± 7 | 25 | 61 | 4 | ~ | ~ |
| 4 |  | -CH3 | -CH3 | -H | 53 ± 2 | 964 ± 14 | 1386 ± 21 | 234 ± 10 | 30 ± 1 | 96 ± 3 | 18 | 26 | 4 | ~ | 2 |
| 5 |  | -CH3 | -CH3 | -H | 89 ± 2 | 1026 ± 96 | 3488 ± 86 | 311 ± 22 | 53 ± 4 | 91 ± 5 | 12 | 39 | 3 | ~ | 1 |
| 6 |  | -CH3 | -CH3 | -H | 20 ± 3 | 889 ± 131 | 697 ± 67 | 110 ± 11 | 45 ± 3 | 100 ± 4 | 44 | 35 | 6 | 2 | 5 |
| 7 |  | -CH3 | -CH3 | -CH2OH | 13 ± 1 | 2844 ± 49 | 2049 ± 116 | 26 ± 2 | 65 ± 5 | 107 ± 4 | 219 | 158 | 2 | 5 | 8 |
| 8 |  | -CH3 | -CH3 | -COOH | 342 ± 77 | 7713 ± 1,249 | 6311 ± 1,380 | 8009 ± 130 | 308 ± 26 | 1613 ± 24 | 23 | 18 | 23 | ~ | 5 |
| 9 |  | -CH3 | -CH3 | -CH2NH2 | 797 ± 26 | 8774 ± 508 | 7799 ± 81 | 665 ± 28 | 716 ± 48 | 3390 ± 301 | 11 | 10 | ~ | ~ | 4 |
| 10 |  | -CH3 | -CH3 | -CF2H | 522 ± 210 | 53206 ± 16,384 | 47964 ± 3,582 | 402 ± 13 | 163 ± 21 | 460 ± 25 | 102 | 92 | ~ | ~ | ~ |
| 11 |  | -Bn | -CH3 | -H | 646 ± 164 | 139908 ± 677 | 4975 ± 328 | 2026 ± 600 | 1608 ± 52 | 555 ± 36 | 217 | 8 | 3 | 3 | ~ |
| 12 |  | -Bn | -CH3 | -H | 427 ± 109 | 12504 ± 3,260 | 8203 ± 674 | 539 ± 353 | 1085 ± 139 | 1062 ± 54 | 29 | 19 | 1 | 3 | 2 |
| 13 |  | -Bn | -CH3 | -H | 124 ± 27 | 21608 ± 3,431 | 2812 ± 543 | 1142 ± 129 | 1588 ± 40 | 359 ± 17 | 174 | 23 | 9 | 13 | 3 |
| 14 |  | -iPr | -CH3 | -H | 85 ± 17 | 984 ± 127 | 3787 ± 234 | 93 ± 28 | 300 ± 21 | 215 ± 12 | 12 | 45 | 1 | 4 | 3 |
| 15 |  | -Bn | -Bn | -H | 623 ± 18 | 19244 ± 1,551 | 21110 ± 1,388 | 496 ± 36 | 18643 ± 1,365 | 1183 ± 127 | 31 | 34 | ~ | 30 | 2 |
| 16 |  | -CH3 | -CH3 | -CH2OH | 25 ± 9 | 2243 ± 74 | 2257 ± 279 | 33 ± 6 | 90 ± 9 | 134 ± 8 | 90 | 90 | 1 | 4 | 5 |
| 17 |  | -CH3 | -CH3 | -CH2OH | 9 ± 2 | 2145 + 100 | 2272 + 134 | 68 + 5 | 26 + 5 | 87 + 7 | 240 | 252 | 8 | 3 | 10 |
| 18 |  | -CH3 | -CH3 | -CH2OH | 18 ± 2 | 1250 ± 95 | 1222 ± 168 | 73 ± 13 | 16 ± 3 | 116 ± 13 | 69 | 68 | 4 | ~ | 6 |
| 19 |  | -CH3 | -CH3 | -CH2OH | 23 ± 3 | 1531 ± 52 | 3443 ± 294 | 108 ± 17 | 50 ± 1 | 210 ± 4 | 67 | 150 | 5 | 2 | 9 |
| 20 |  | -CH3 | -CH3 | -CH2NC(NH2)2 | 1498 ± 104 | 21535 ± 1910 | 25850 ± 1,571 | 8477 ± 655 | 26509 ± 733 | 25535 ± 1,385 | 14 | 16 | 6 | 18 | 17 |
| 21 | 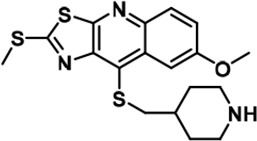 | 159 ± 7 | 3014 ± 137 | 3514 ± 511 | 69 ± 6 | 1564 ± 252 | 1315 ± 87 | 19 | 22 | ~ | 10 | 8 | |||
| 22 | 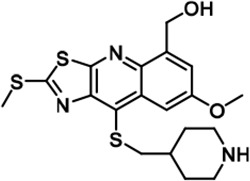 | 3761 ± 202 | 24733 ± 1,669 | 25948 ± 540 | 2426 ± 257 | 9750 ± 127 | 16770 ± 1,788 | 7 | 7 | ~ | 3 | 4 | |||
-
Table 1—source data 1
Raw data of inhibitors against kinases for Table 1.
- https://cdn.elifesciences.org/articles/77696/elife-77696-table1-data1-v3.zip
Appendix 2—key resources table
| Reagent type (species) or resource | Designation | Source or reference | Identifiers | Additional information |
|---|---|---|---|---|
| cell line (Homo-sapiens) | HEK293T | American Type Culture Collection | Cat#: CRL-3216, RRID: CVCL_0063 | |
| cell line (Homo-sapiens) | HEK293A | Thermo Fisher | Cat#: R70507 | |
| cell line (Homo-sapiens) | HEK293 | American Type Culture Collection | Cat#: CRL-1573, RRID: CVCL_0045 | |
| cell line (Homo-sapiens) | U266 | American Type Culture Collection | Cat#: TIB-196, RRID: CVCL_0566 | |
| cell line (Homo-sapiens) | HCT116 | China Infrastructure of Cell Line Resources | Cat#: 1101HUM-PUMC000158 | |
| antibody | anti-4EPB1(Rabbit polyclonal) | Cell Signaling Technology | Cat#: 9644, RRID: AB_2097841 | WB (1:1000) |
| antibody | anti-phosphorylated 4E-BP1 (Thr37/46) (Rabbit monoclonal) | Cell Signaling Technology | Cat#: 2855, RRID: AB_560835 | WB (1:1000) |
| antibody | anti-phosphorylated 4E-BP1 (Ser65) (Rabbit monoclonal) | Cell Signaling Technology | Cat#: 9451, RRID: AB_330947 | WB (1:1000) |
| antibody | anti-phosphorylated 4E-BP1 (Thr70) (Rabbit monoclonal) | Cell Signaling Technology | Cat#: 13396, RRID: AB_2798206 | WB (1:1000) |
| antibody | anti-HA (Rabbit monoclonal) | Cell Signaling Technology | Cat#: 3724, RRID: AB_1549585 | WB (1:1000) |
| antibody | anti-FLAG (Mouse monoclonal) | Sigma-Aldrich | Cat#: F3165, RRID: AB_259529 | WB (1:5000) |
| antibody | anti-FLAG (Rabbit monoclonal) | Abcam | Cat#: ab205606 | WB (1:5000) |
| antibody | anti-GFP (Rabbit monoclonal) | Abcam | Cat#: ab183734 | WB (1:5000) |
| antibody | anti-GFP (Mouse monoclonal) | Proteintech | Cat#: 66002–1-Ig, RRID: AB_11182611 | WB (1:5000) |
| antibody | anti-RPT3 (Rabbit polyclonal) | Thermo Fisher Scientific | Cat#: A303-849A-M, RRID: AB_2781512 | WB (1:1000) |
| antibody | anti-pThr25 (Rabbit polyclonal) | Guo et al., 2016 | N/A | WB (1:500) |
| antibody | anti-GAPDH (Mouse monoclonal) | Transgene Biotechnology | Cat#: HC301-01 | WB (1:5000) |
| antibody | anti-mouse-IgG-HRP (Goat monoclonal) | Transgene Biotechnology | Cat#: HS201-01 | WB (1:5000) |
| antibody | anti-rabbit-IgG-HRP (Goat monoclonal) | Transgene Biotechnology | Cat#: HS101-01 | WB (1:5000) |
| recombinant DNA reagent | GCaMP6f (plasmid) | Xiaowei Chen Lab (Peking University, China) | N/A | |
| recombinant DNA reagent | pEGFP-Orai1 (plasmid) | Xiaowei Chen Lab (Peking University, China) | N/A | |
| recombinant DNA reagent | mCherry-STIM1 (plasmid) | Xiaowei Chen Lab (Peking University, China) | N/A | |
| recombinant DNA reagent | pLL3.7-DYRK2-shRNA (plasmid) | Xing Guo Lab (Zhejiang University, China) | Guo et al., 2016 | |
| recombinant DNA reagent | Flag-STIM1 (plasmid) | This paper | N/A | This plasmid was generated by modification of mCherry-STIM1 plasmid. |
| recombinant DNA reagent | pQlinkHx- DYRK2208-552 (plasmid) | This paper | N/A | This plasmid was generated by modification of pEGFP-DYRK2 plasmid. |
| recombinant DNA reagent | pQlinkGx- STIM1235-END (plasmid) | This paper | N/A | This plasmid was generated by modification of mCherry-STIM1 plasmid. |
| recombinant DNA reagent | HA-mcherry-DYRK2 (plasmid) | This paper | N/A | This plasmid was generated by modification of pEGFP-DYRK2 plasmid. |
| recombinant DNA reagent | HA-mcherry-DYRK2-D275N (plasmid) | This paper | N/A | This plasmid was generated by modification of pEGFP-DYRK2-D275N plasmid. |
| peptide, recombinant protein | Flag peptide: DYKDDDDK | Smart Lifesciences | Cat#: SLR01002 | |
| peptide, recombinant protein | GST-MARK3 protein | Carna Biosciences | Cat#: 02–122 | |
| peptide, recombinant protein | GST-Haspin protein | Carna Biosciences | Cat#: 05–111 | |
| strain, strain background (Escherichia coli) | BL21(DE3) | Sigma-Aldrich | Cat#: CMC0016 | Electrocompetent cells |
| chemical compound, drug | AKTi-1/2 | Selleck | Cat#: S80837 | |
| chemical compound, drug | PD0325901 | Aladdin | Cat#: P125494 | |
| chemical compound, drug | Thapsigargin | Aladdin | Cat#: T135258 | |
| chemical compound, drug | X-tremeGENE 9 DNA Transfection Reagent | Roche | Cat#: 19129300 | |
| chemical compound, drug | Lipofectamine 2000 | Thermo Fisher Scientific | Cat#: 11668019 | |
| chemical compound, drug | protease inhibitor mixture | Roche | Cat#: 11697498001 | |
| chemical compound, drug | phosphatase inhibitor mixtures | Roche | Cat#: 04906837001 | |
| chemical compound, drug | Ionomycin | Sigma-Aldrich | CAS: 56092-81-0 | |
| chemical compound, drug | 2-Bromo-5-methoxybenzoic acid | J&K Scientific | CAS: 22921-68-2 | |
| chemical compound, drug | 2-Amino-5-Methoxybenzoic acid | Energy Chemicals | CAS: 6705-03-9 | |
| chemical compound, drug | p-Anisidine | J&K Scientific | CAS: 104-94-9 | |
| chemical compound, drug | 1-Boc-4-Bromomethylpiperidine | Bide Pharmatech | CAS: 158407-04-6 | |
| chemical compound, drug | (S)–1-Boc-3-(Bromomethyl)pyrrolidine | Bide Pharmatech | CAS: 1067230-64-1 | |
| chemical compound, drug | (R)–1-Boc-3-(Bromomethyl)pyrrolidine | Bide Pharmatech Ltd | CAS: 1067230-65-2 | |
| chemical compound, drug | 4-Methoxyphenyl isothiocyanate | Energy Chemicals | CAS: 2284-20-0 | |
| chemical compound, drug | tert-butyl 4-bromopiperidine-1-carboxylate | J&K Scientific | CAS: 180695-79-8 | |
| chemical compound, drug | DIBAL-H | Alfa Aesar Chemicals | CAS: 1191-15-7 | |
| chemical compound, drug | Dess-Martin | Alfa Aesar Chemicals | CAS: 87413-09-0 | |
| chemical compound, drug | Boron Tribromide | Sigma-Aldrich | CAS: 10294-33-4 | |
| chemical compound, drug | Urea | Sigma-Aldrich | CAS: 57-13-6 | |
| chemical compound, drug | 2-Amino-2-(hydroxymethyl)–1,3-propanediol | Sigma-Aldrich | CAS: 77-86-1 | |
| chemical compound, drug | Sodium orthovanadate | NEW ENGLAND BioLabs | Cat#: P0758S | |
| commercial assay or kit | Ni Sepharose 6 Fast Flow | GE healthcare | Cat#: 17531803 | |
| commercial assay or kit | Glutathione Sepharose 4B beads | GE healthcare | Cat#: 17-0756-05 | |
| commercial assay or kit | ANTI-FLAG M2 Affinity Gel | Sigma-Aldrich | Cat#: A2220 | |
| commercial assay or kit | Superdex 200 Increase 10/300 GL | GE healthcare | Cat#: 28990944 | |
| commercial assay or kit | BCA Protein Assay Kit Pierce | Thermo-Pierce | Cat#: 23,227 | |
| commercial assay or kit | ADP-Glo kinase assay | Promega | Cat#: V9102 | |
| software, algorithm | Chembiodraw | http://www.perkinelmer.co.uk/category/chemdraw | RRID:SCR_016768 | v13 |
| software, algorithm | GraphPad Prism | GraphPad Software | RRID:SCR_002798 | v8.4.0 |
| software, algorithm | ImageJ (Fiji) | Schindelin et al., 2012 | RRID:SCR_003070 | |
| software, algorithm | Matlab | https://ww2.mathworks.cn/products/matlab.html | N/A | v2014a |
| software, algorithm | HKL-2000 | HKL Research | RRID:SCR_015547 | |
| software, algorithm | Phenix | https://www.phenix-online.org/ | RRID:SCR_014224 | v1.19.2 |
| software, algorithm | Coot | http://www2.mrc-lmb.cam.ac.uk/personal/pemsley/coot/ | RRID:SCR_014222 | v0.9 |
| software, algorithm | Maxquant | http://www.biochem.mpg.de/5111795/maxquant | RRID: SCR_014485 | v1.5.5.1 |
| software, algorithm | Perseus | http://coxdocs.org/doku.php?id=perseus:start | RRID: SCR_015753 | v1.5.5.3 |
| software, algorithm | Thermo Xcalibur | https://www.thermofisher.cn/order/catalog/product/OPTON-30965 | RRID: SCR_014593 | v4.1.50 |
Author response table 1
| Gene names | phosphosites | Significant | -Log 10 p-valueTreat/Control | log2 fold change (Treat/Control) |
|---|---|---|---|---|
| EIF4EBP1 | T37 | + | 1.07391 | -2.93 |
| EIF4EBP1 | S112 | 0.06947 | -0.25 | |
| EIF4EBP1 | S65 | 0.07381 | -0.04 | |
| EIF4EBP1 | T70 | 1.08312 | -1.24 | |
| EIF4EBP2 | T46 | 0.39658 | 2.16 |
Author response table 2
| Gene names | phosphosites | Significant | -Log Student's T-test pvalue Treat_Control | log2 fold change (Treat/Control) |
|---|---|---|---|---|
| STIM1 | S519 | + | 1.8471 | -3.32 |
| STIM1 | S521 | + | 4.45808 | -4.63 |
| STIM1 | S621 | + | 1.77212 | 2.58 |
| STIM1 | S628 | + | 3.32645 | 1.84 |
| STIM1 | S668 | 0.11102 | -0.12 | |
| STIM1 | S575 | 2.20548 | -1.14 | |
| STIM1 | S512 | 0.6069 | 0.52 | |
| STIM1 | S618 | 0.78188 | 2.17 | |
| STIM1 | T626 | 1.61538 | 1.27 |
Additional files
-
Transparent reporting form
- https://cdn.elifesciences.org/articles/77696/elife-77696-transrepform1-v3.docx
-
Supplementary file 1
NMR figures.
- https://cdn.elifesciences.org/articles/77696/elife-77696-supp1-v3.docx
Download links
A two-part list of links to download the article, or parts of the article, in various formats.
Downloads (link to download the article as PDF)
Open citations (links to open the citations from this article in various online reference manager services)
Cite this article (links to download the citations from this article in formats compatible with various reference manager tools)
Selective inhibition reveals the regulatory function of DYRK2 in protein synthesis and calcium entry
eLife 11:e77696.
https://doi.org/10.7554/eLife.77696


