Prolonged β-adrenergic stimulation disperses ryanodine receptor clusters in cardiomyocytes and has implications for heart failure
- Institute for Experimental Medical Research, Oslo University Hospital and University of Oslo, Norway
- K.G. Jebsen Centre for Cardiac Research, University of Oslo, Norway
- Simula Research Laboratory, Norway
- Section of Cardiology, Departments of Medicine and Pediatrics, Baylor College of Medicine, United States
- Department of Molecular Physiology & Biophysics, Cardiovascular Research Institute, Baylor College of Medicine, United States
- Department of Pharmacology, UC Davis, United States
- Department of Physiology, University of Bern, Switzerland
Figures
Figure 1 with 3 supplements
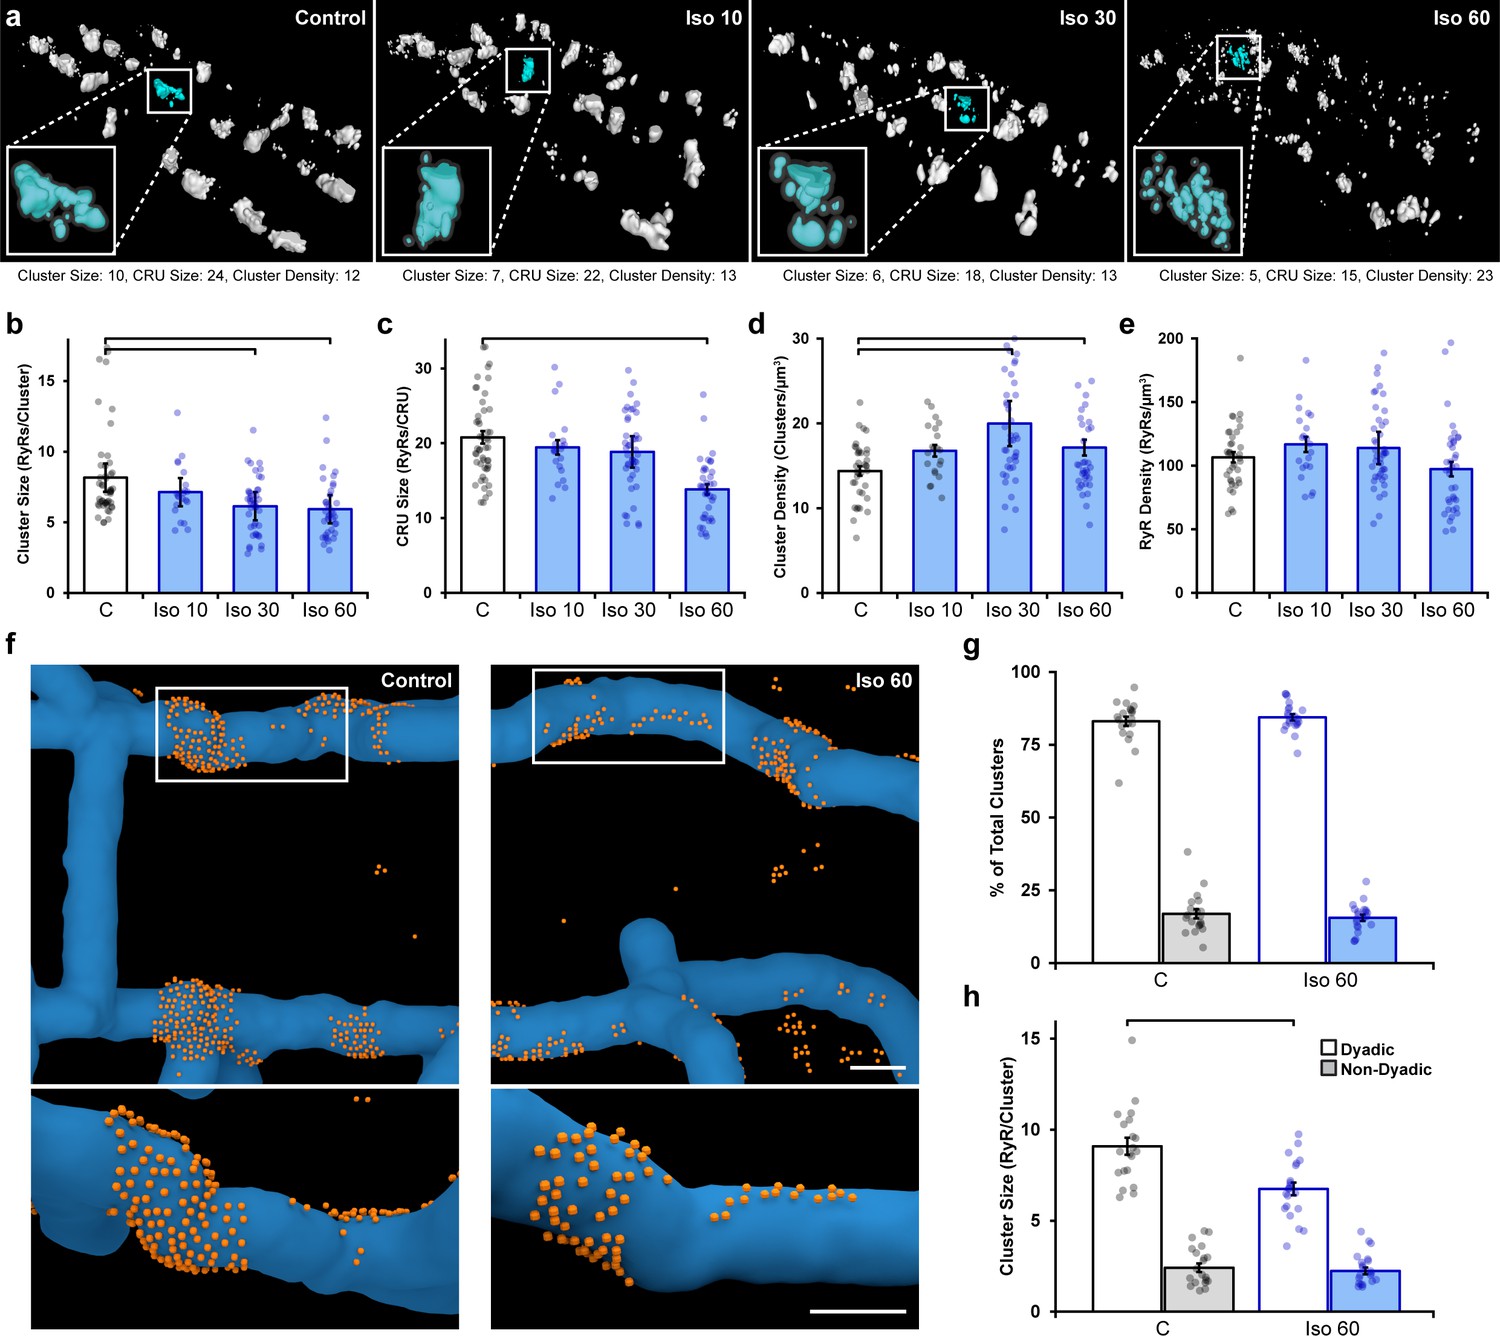
Prolonged β-adrenergic receptor (β-AR) activation disperses ryanodine receptor (RyR) clusters.
(a) Representative reconstructions of interior RyR clusters based on 3D dSTORM in isolated rat cardiomyocytes (clusters were cropped from a region measuring 5 x 8 x 0.6 μm). Control conditions are compared with isoproterenol treatment (100 nM) of varying duration (10, 30, and 60 min). The insets depict single Ca2+ release units (CRUs), which encompass RyR clusters with edge-to-edge distances ≤ 100 nm. (b–d) Quantification of the dSTORM data revealed progressive dispersion of RyR clusters during isoproterenol treatment, as indicated by measurements of RyR cluster size, CRU size, and cluster density. (e) RyR density was unchanged (control: ncells = 50, nhearts = 6; Iso 10: ncells = 21, nhearts = 3; Iso 30: ncells = 43, nhearts = 4; Iso 60: ncells = 37, nhearts = 5). (f) Correlative imaging of the t-tubular network (confocal microscopy) and RyRs (dSTORM) was employed to create 3D reconstructions of dyadic and non-dyadic CRUs (t-tubules: blue; RyRs: orange). Scale bars: 250 nm. (g) Similar proportions of clusters were characterized as dyadic under control conditions and following 60 min isoproterenol. (h) Cluster size measurements indicated that dispersion during isoproterenol occurred exclusively within dyads (control: ncells = 20, nhearts = 3; Iso 60: ncells = 21, nhearts = 3). The bar charts present mean measurements ± SEM, with superimposed data points representing averaged values from each cardiomyocyte. Statistical significance (p<0.05) between groups is indicated by a comparison bar.
Figure 1—figure supplement 1
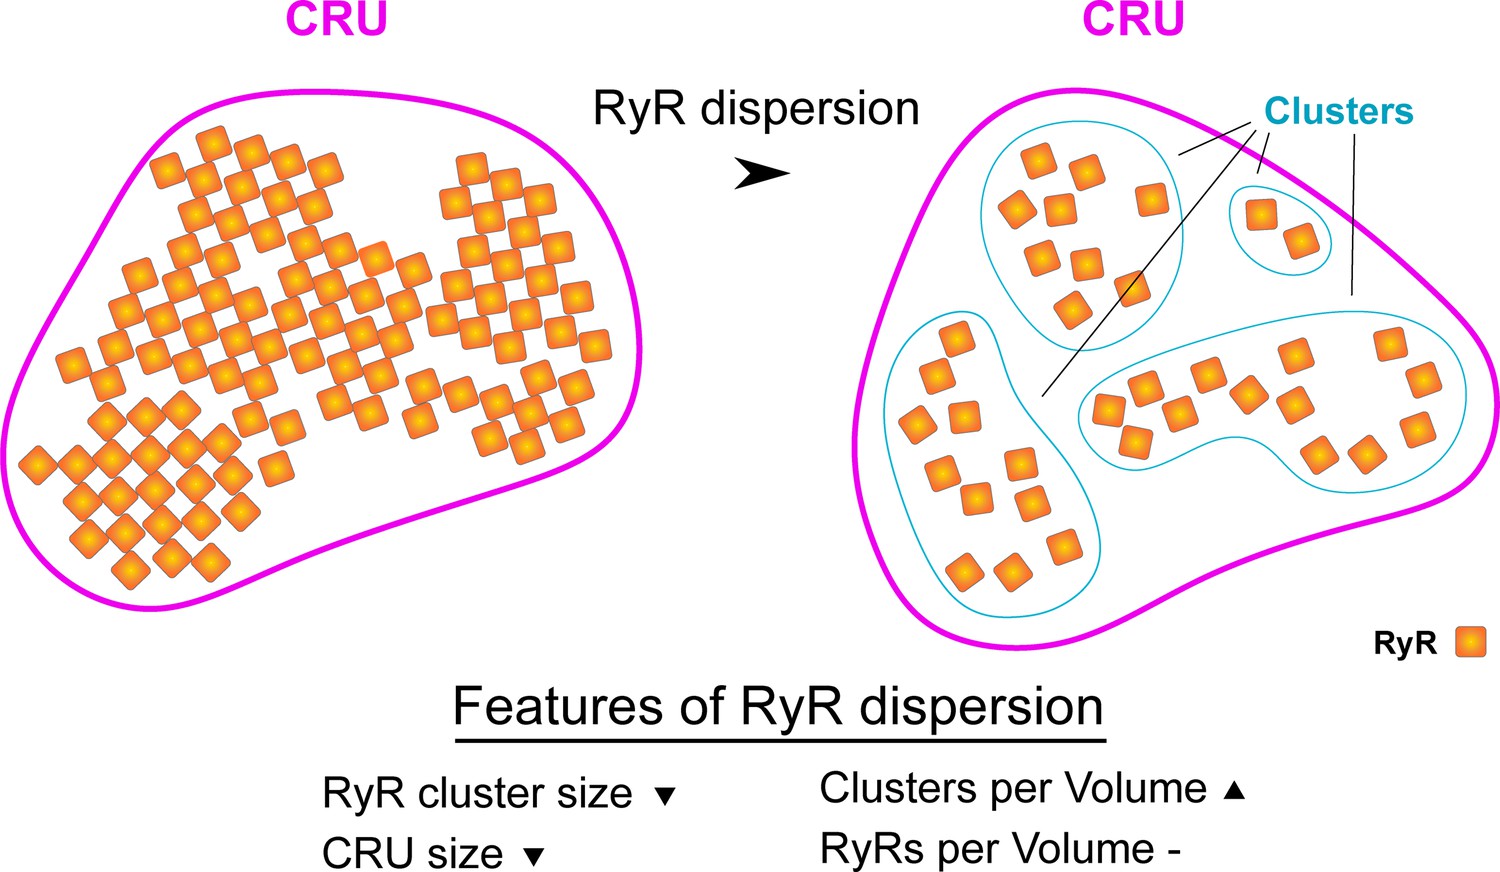
Schematic illustrating hallmarks of ryanodine receptor (RyR) cluster dispersion.
Dispersion of RyR groups results in a reduction in the average number of RyRs contained in each cluster. This change occurs in parallel with an increase in the total number of clusters as there are now more numerous, smaller clusters in a given 3D space. If marked RyR cluster dispersion occurs, the total number of RyRs contained in a Ca2+ release unit (CRU) may also be reduced as clusters are no longer located in close enough proximity to be grouped in functional release units (edge-to-edge distances ≤ 100 nm).
Figure 1—figure supplement 2
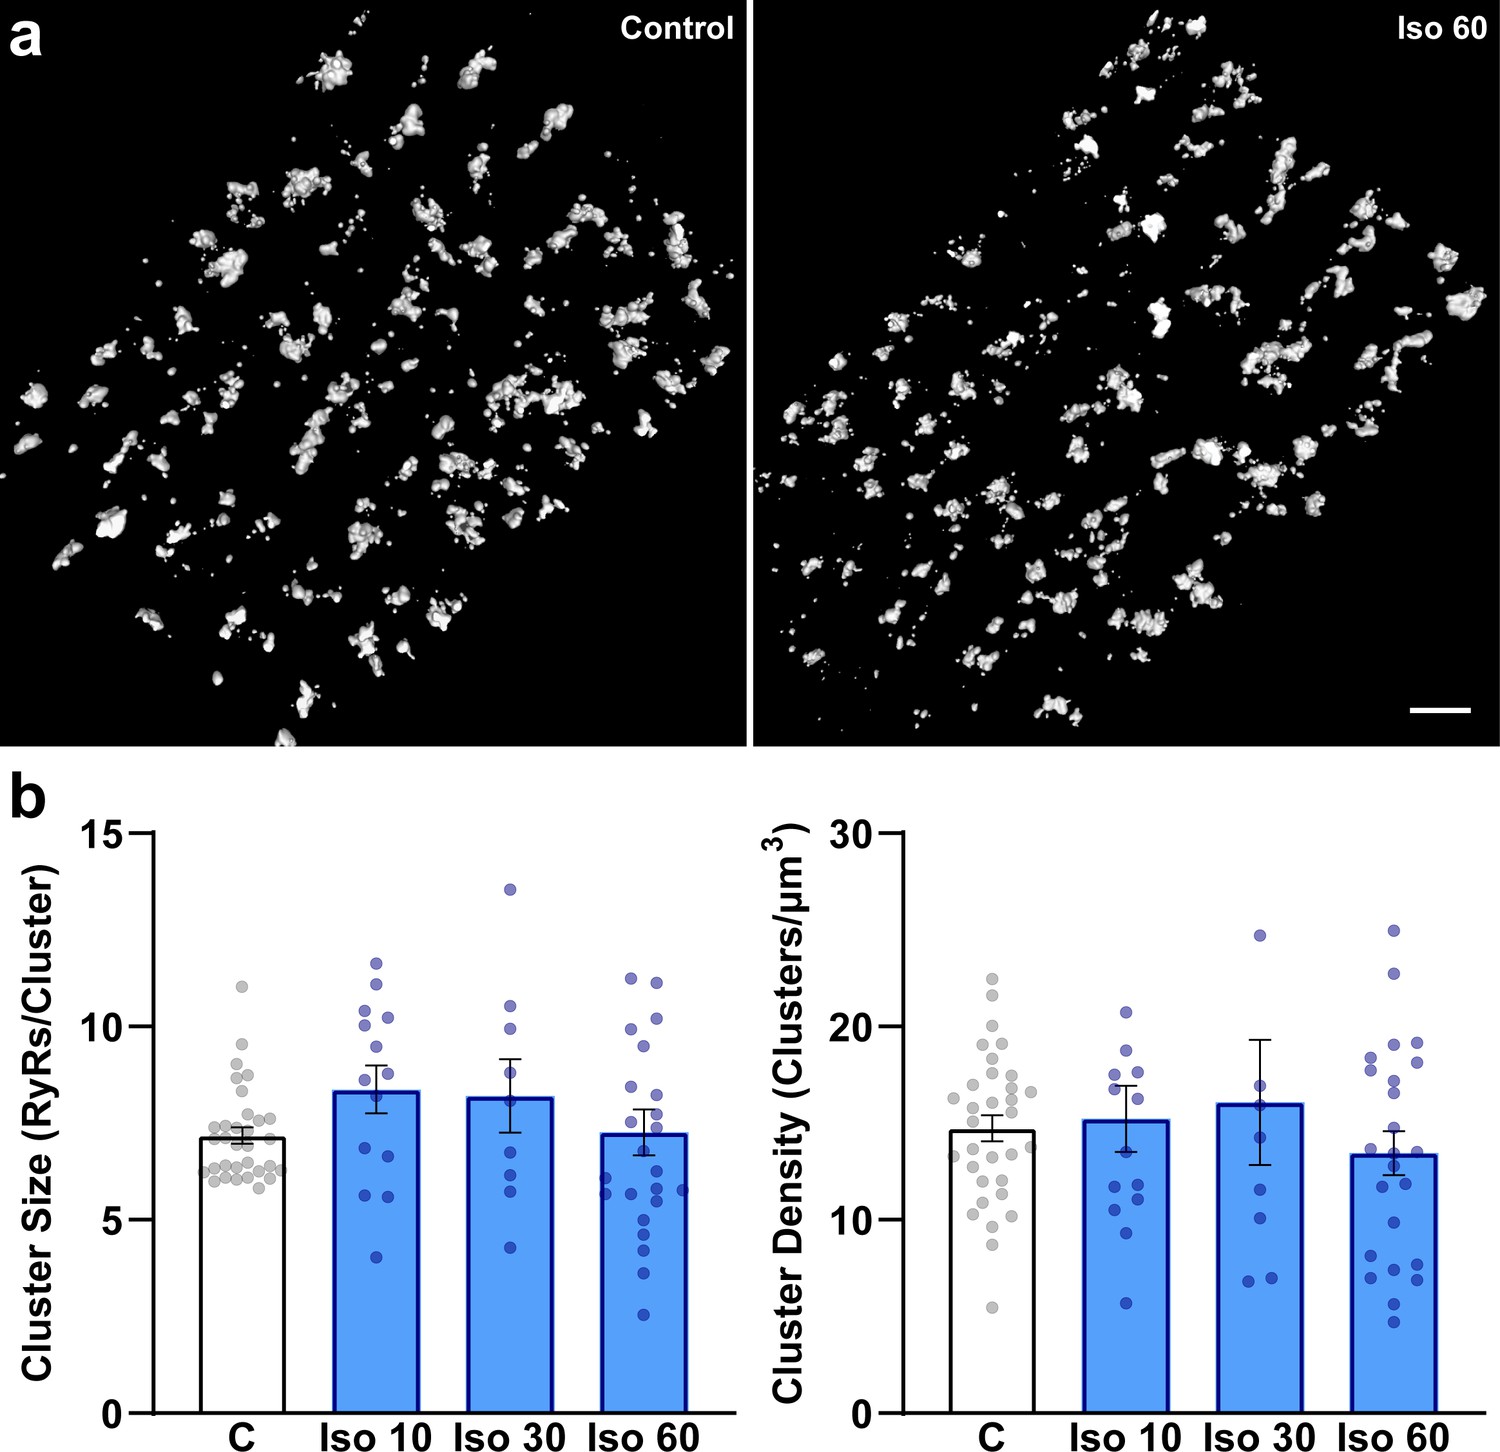
β-Adrenergic receptor (β-AR) stimulation does not significantly influence ryanodine receptor (RyR) organization on the cell surface.
Representative images (a) and data (b) indicate that, in contrast to interior RyRs (Figure 1), RyR clusters remain intact during prolonged β-AR stimulation. Scale bar: 1 μm. (control: ncells = 32, nhearts = 3; Iso 10: ncells = 14, nhearts = 4; Iso 30: ncells = 12, nhearts = 4; Iso 60: ncells = 24, nhearts = 4).
Figure 1—figure supplement 3
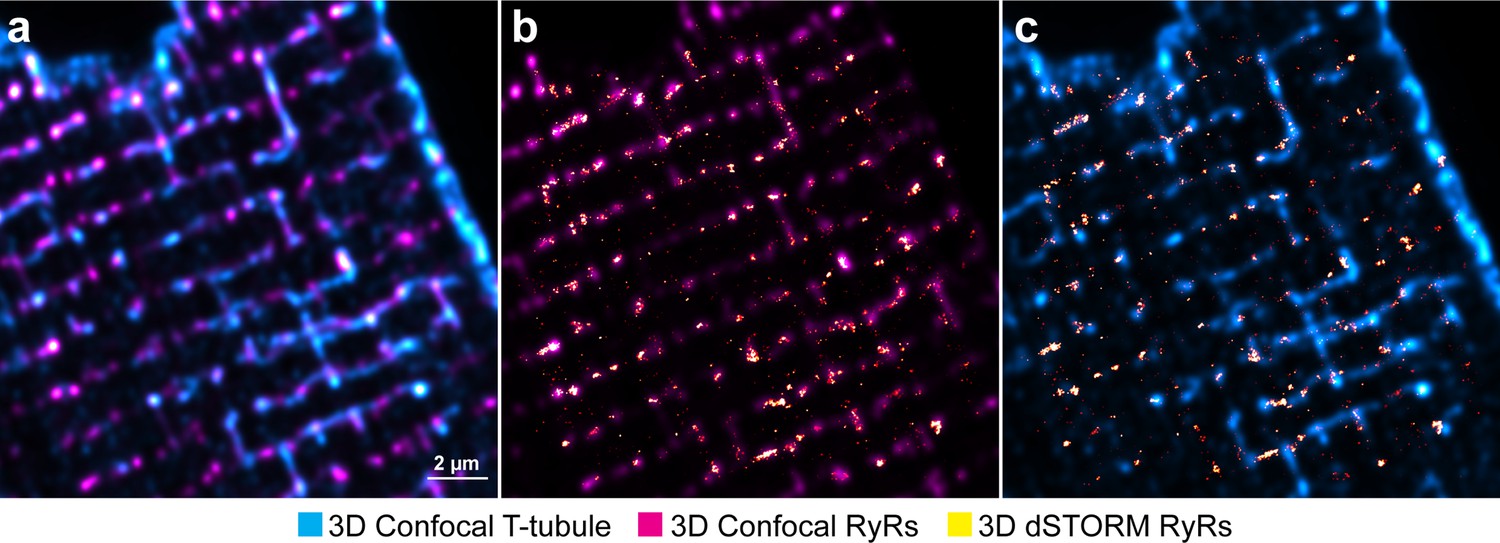
Method for correlative imaging of ryanodine receptors (RyRs) and t-tubules for dyad reconstruction.
(a) A 3 µm-thick confocal stack of RyRs and t-tubules is acquired, immediately followed by 3D dSTORM imaging of RyRs in the same region. After deconvolution, confocal images are rescaled to the same voxel size as the dSTORM image. (b) Using a custom-written Python script to correct for lateral, axial, translational, and rotational differences, confocal and dSTORM imaged RyRs are aligned. (c) Using the derived transformational differences, confocal t-tubules are finally aligned with dSTORM RyRs in 3D space.
Figure 2 with 2 supplements
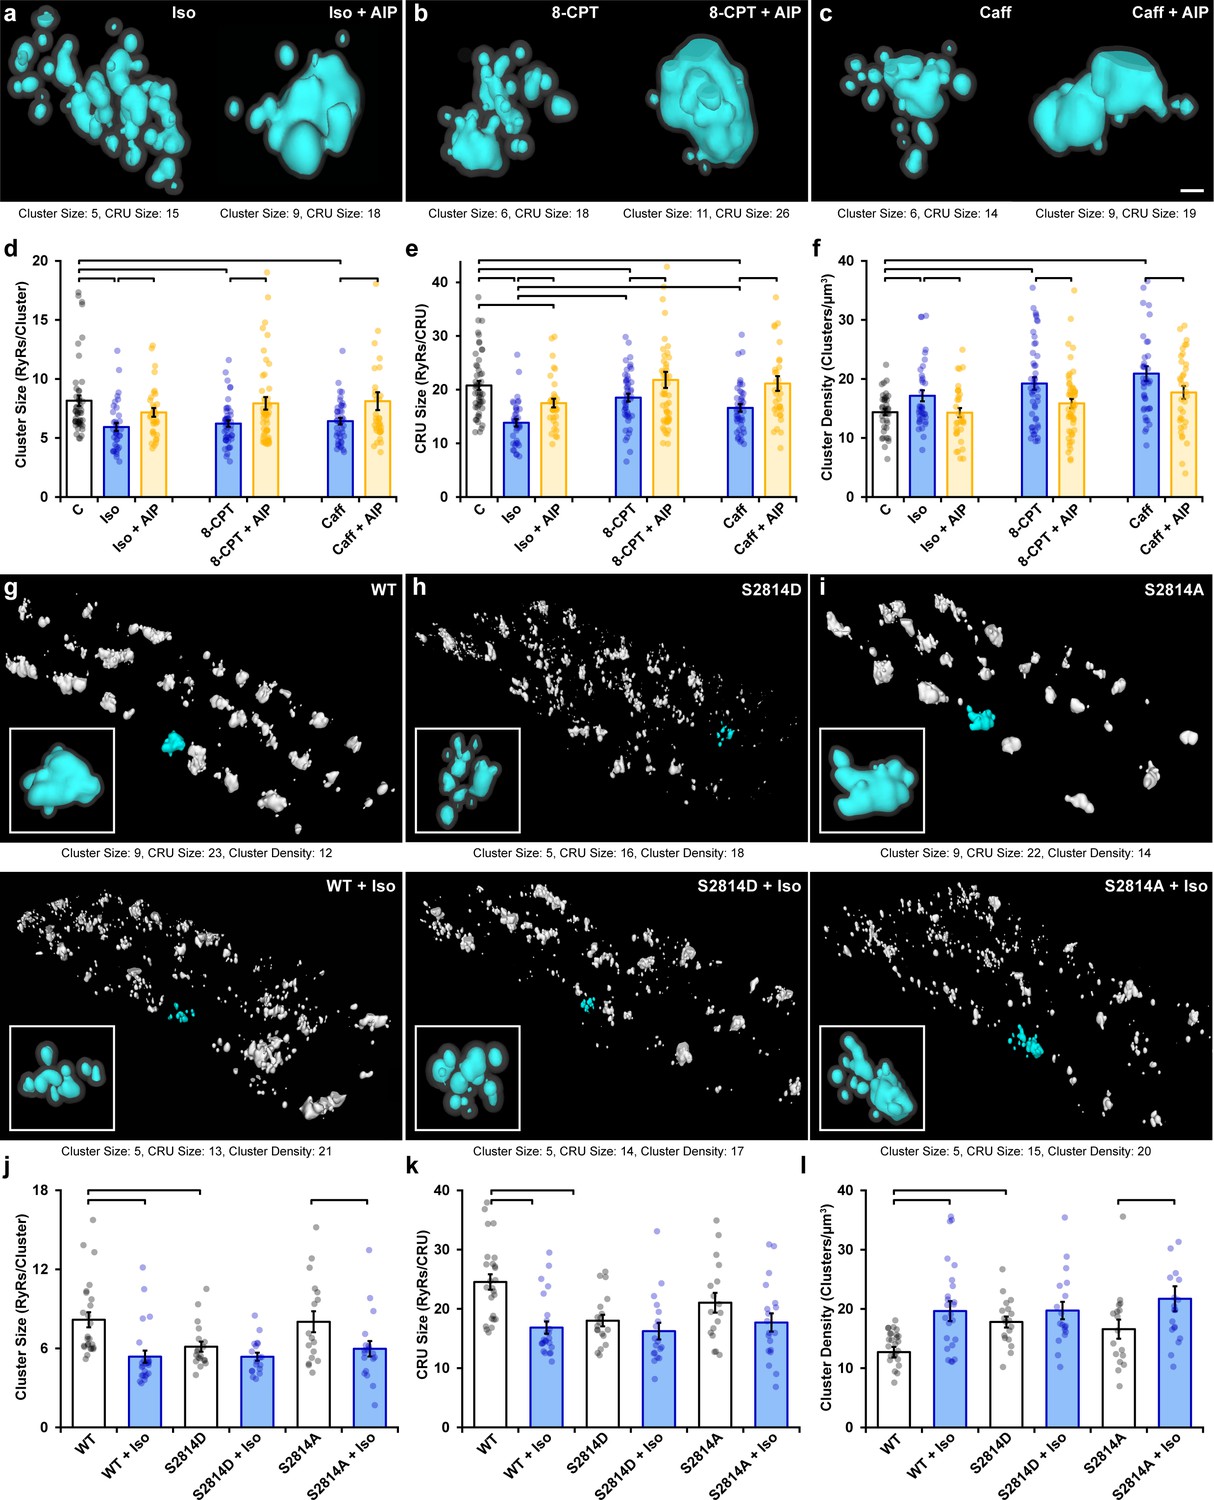
Ca2+/calmodulin-dependent protein kinase II (CaMKII) activation promotes ryanodine receptor (RyR) cluster dispersion.
(a–c) Representative Ca2+ release units (CRUs) imaged in cardiomyocytes treated with isoproterenol (100 nM), 8-CPT (10 µM), or caffeine (0.5 mM) for 1 hr (left panels) or with inclusion of the CaMKII inhibitor AIP (2 µM) for an additional hour (right panels). Scale bar: 100 nm. (d– f) Induced RyR cluster dispersion was reversed by CaMKII inhibition, as indicated by measurements of RyR cluster size, CRU size, and cluster density (control: ncells = 50, nhearts = 6; Iso: ncells = 37, nhearts = 5; Iso + AIP: ncells = 37, nhearts = 5; 8-CPT: ncells = 48, nhearts = 5; 8-CPT + AIP: ncells = 52, nhearts = 5; caffeine: ncells = 42, nhearts = 4; caffeine + AIP: ncells = 35, nhearts = 3). (g–i) Representative images of RyR organization in cardiomyocytes from wildtype (WT) mice and transgenic mice with constitutively activated (S2814D) or genetically ablated (S2814A) phosphorylation at S2814. Clusters were cropped from a region measuring 5 x 9 x 0.6 μm. Images and quantified experimental data (j–l) are presented under baseline conditions and following 60 min isoproterenol stimulation (WT: ncells = 25, nhearts = 2; WT + Iso: ncells = 24, nhearts = 2; S2814D: ncells = 19, nhearts = 2; S2814D + Iso: ncells = 18, nhearts = 2; S2814A: ncells = 17, nhearts = 2; S2814A + Iso: ncells = 19, nhearts = 2). The bar charts present mean measurements ± SEM, with superimposed data points representing averaged values from each cardiomyocyte. Statistical significance (p<0.05) between groups is indicated by a comparison bar.
Figure 2—figure supplement 1
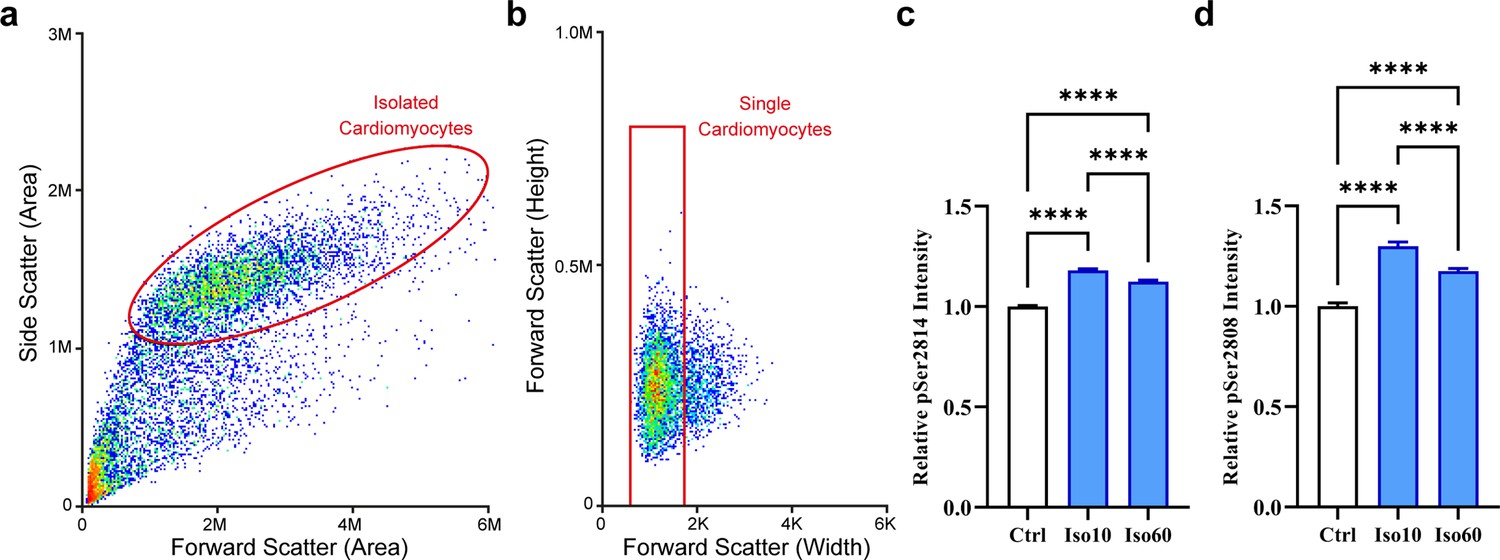
Quantification of ryanodine receptor (RyR) phosphorylation by flow cytometry.
Cardiomyocytes were separated from other cell types and debris using a dual-parameter dot plot for side and forward scatter (a), and the single cardiomyocyte fraction was identified using a plot of forward scatter height and pulse width (b). (c) Fluorescent detection of RyR phosphorylation at ser-2814 revealed increased phosphorylation during 1 hr isoproterenol treatment period, which was most prominent at the early time point examined (control: ncells = 7140; Iso 10: ncells = 6251; Iso 60: ncells = 5253; nhearts = 2). (d) RyR phosphorylation at ser-2808 also exhibited a bell-shaped response to isoproterenol treatment, but remained increased after 1 hr of treatment (control: ncells = 742; Iso 10: ncells = 803; Iso 60: ncells = 1630; nhearts = 1).
Figure 2—figure supplement 2
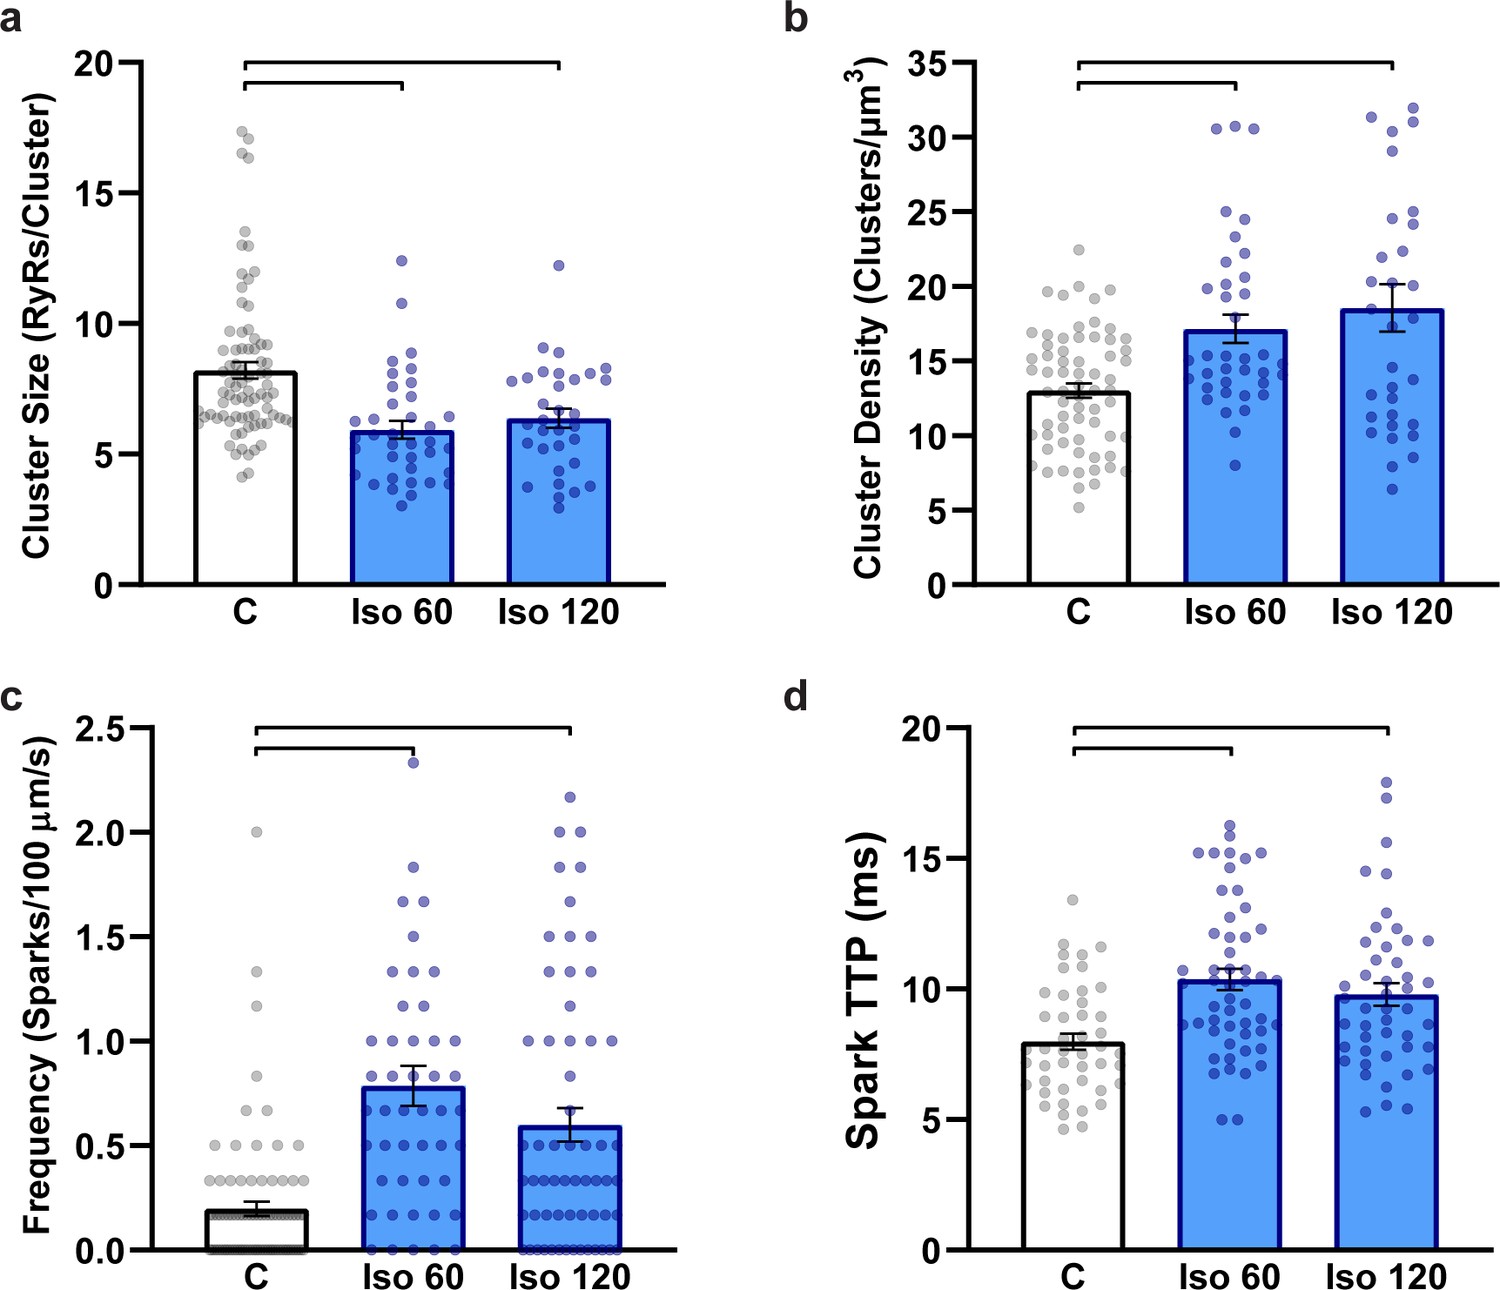
Ryanodine receptor (RyR) localization and Ca2+ spark characteristics do not differ between 1 hr and 2 hr isoproterenol treatment.
(a) RyR cluster size, (b) RyR cluster density (control: ncells = 66, nhearts = 7; Iso 60: ncells = 37, nhearts = 5; Iso 120: ncells = 32, nhearts = 3). (c) Ca2+ spark frequency and (d) Ca2+ spark time to peak (control: ncells = 80, nhearts = 7; Iso 60: ncells = 47, nhearts = 3; Iso 120: ncells = 60, nhearts = 3). The control group combines data from 1 hr and 2 hr cardiomyocytes as these groups did not significantly differ from one another. Statistical significance (p<0.05) between groups is indicated by the presence of a comparison bar.
Figure 3 with 1 supplement
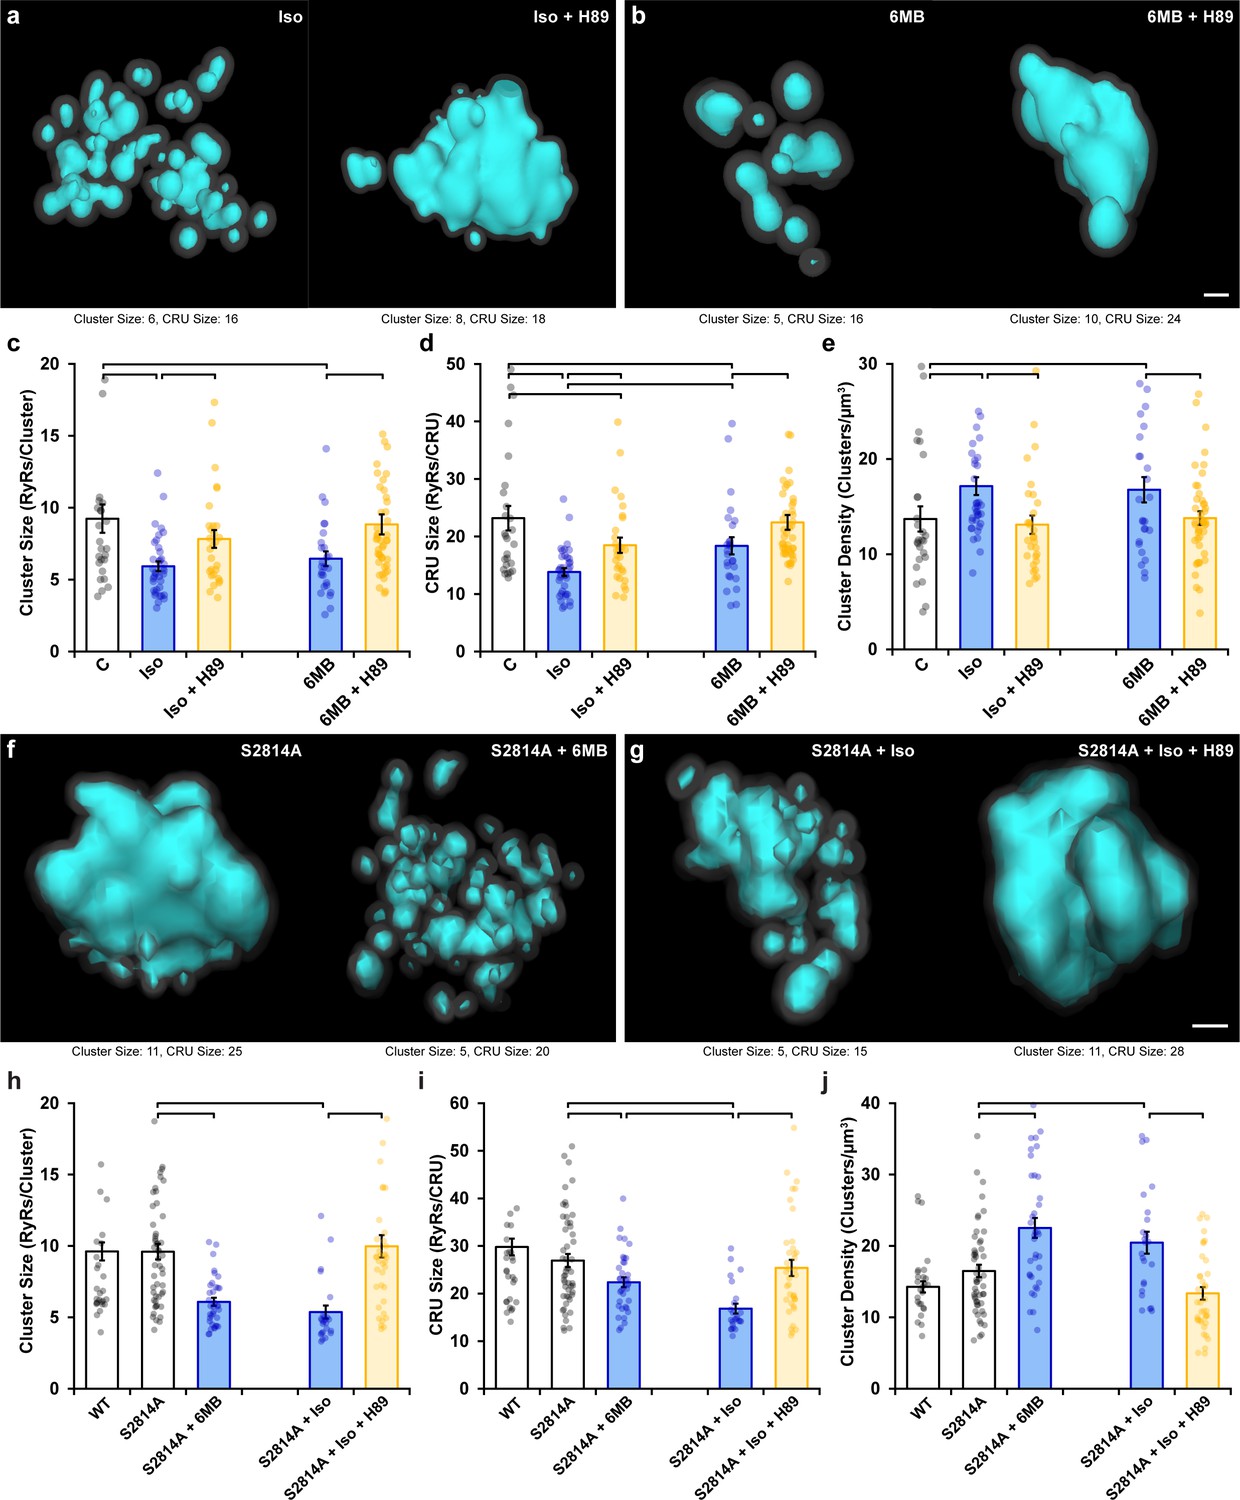
Protein kinase A (PKA)-dependent phosphorylation also promotes ryanodine receptor (RyR) cluster fragmentation during β-adrenergic receptor (β-AR) activation.
(a) Representative Ca2+ release units (CRUs) indicate that PKA inhibition (H89, 10 µM) reverses isoproterenol-induced cluster dispersion. (b) Direct activation of PKA using 6MB-cAMP (100 µM) can also induce cluster dispersion and is similarly reversed when followed by H89 application. (c–e) Data comparing cluster size, CRU size, and cluster density between groups (control: ncells = 26, nhearts = 3; Iso: ncells = 37, nhearts = 5; Iso + H89: ncells = 30, nhearts = 4; 6MB: ncells = 26, nhearts = 3; 6MB + H89: ncells = 44, nhearts = 4). (f) Representative CRUs indicate that 6MB-cAMP treatment effectively disperses RyR clusters in S2814A cardiomyocytes. (g) PKA inhibition also reverses isoproterenol-induced RyR dispersion in S2814A cells. Quantified experimental data are shown in (h–j). (WT: ncells = 49, nhearts = 5; S2814A: ncells = 51, nhearts = 5; S2814A + 6MB: ncells = 36, nhearts = 3; S2814A + Iso: ncells = 17, nhearts = 2; S2814A + Iso + H89: ncells = 38, nhearts = 3). The bar charts present mean measurements ± SEM, with superimposed data points representing averaged values from each cardiomyocyte. Statistical significance (p<0.05) between groups is indicated by a comparison bar. Scale bars: 100 nm.
Figure 3—figure supplement 1
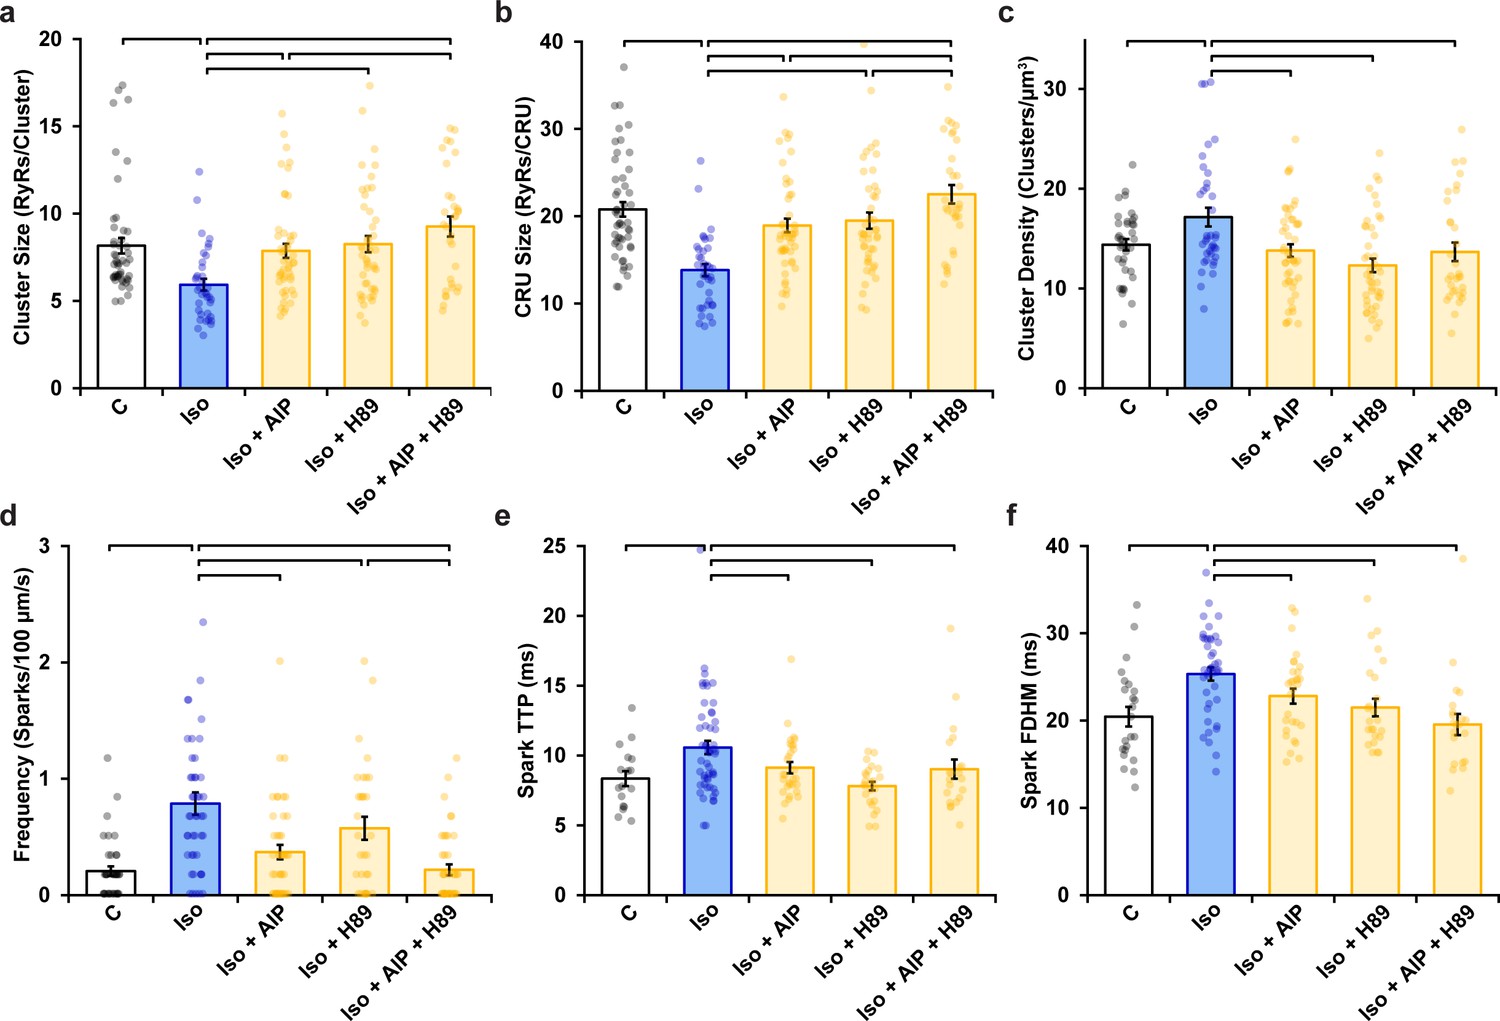
Ryanodine receptor (RyR) cluster organization and Ca2+ spark characteristics following AIP, H89, or dual kinase inhibition in normal rat cardiomyocytes.
(a) RyR cluster size, (b) RyR Ca2+ release unit (CRU) size, (c) RyR cluster density, (d) Ca2+ spark frequency, (e) Ca2+ spark time to peak, and (f) Ca2+ spark duration (control: ncells = 50, nhearts = 6; Iso: ncells = 37, nhearts = 5; Iso + AIP: ncells = 48 nhearts = 6; Iso + H89: ncells = 45, nhearts = 5; Iso + AIP + H89: ncells = 32, nhearts = 3). Statistical significance (p<0.05) between groups is indicated by the presence of a comparison bar.
Figure 4 with 1 supplement

Effects of ryanodine receptor (RyR) dispersion on intracellular Ca2+ homeostasis are reversed by Ca2+/calmodulin-dependent protein kinase II (CaMKII) or protein kinase A (PKA) inhibition.
(a, b) Representative examples of Ca2+ sparks of control and isoproterenol (60 min)-treated cardiomyocytes obtained by confocal line-scan imaging. The time course for each spark is shown on right, with indicated time to peak (TTP) and full duration at half maximum (FDHM) measurements. (c–h) Experimental data indicate that increasing spark frequency, geometry, and slowing of kinetics during isoproterenol were all reversed by CaMKII or PKA inhibition (control: nsparks = 47, ncells = 38, nhearts = 3; Iso 10: nsparks = 166, ncells = 44, nhearts = 3; Iso 30: nsparks = 194, ncells = 44, nhearts = 3; Iso 60: nsparks = 222, ncells = 47, nhearts = 3; Iso 60 + AIP: nsparks = 147, ncells = 69, nhearts = 5; Iso 60 + H89: nsparks = 135, ncells = 55, nhearts = 4). (i) Representative line-scan images illustrating the last in a series of electrically paced Ca2+ transients, followed by a pause to examine Ca2+ wave generation. Enlargements of the Ca2+ transients are shown on right to highlight differences in Ca2+ release synchrony. (j–l) Data showing initial increases in Ca2+ transient amplitude and synchrony were reversed with continued exposure to isoproterenol, while overall release kinetics slowed (control: ncells = 38, nhearts = 3; Iso 10: ncells = 35, nhearts = 3; Iso 30: ncells = 36, nhearts = 3; Iso 60: ncells = 41, nhearts = 3). (m) Ca2+ wave incidence increased during early time points following isoproterenol treatment, but then reversed (control: ncells = 43, nhearts = 3; Iso 10: ncells = 44, nhearts = 3; Iso 30: ncells = 46, nhearts = 3; Iso 60: ncells = 44, nhearts = 3). The bar charts present mean measurements ± SEM, with superimposed data points representing averaged values from each cardiomyocyte. Statistical significance (p<0.05) between groups is indicated by a comparison bar.
Figure 4—figure supplement 1
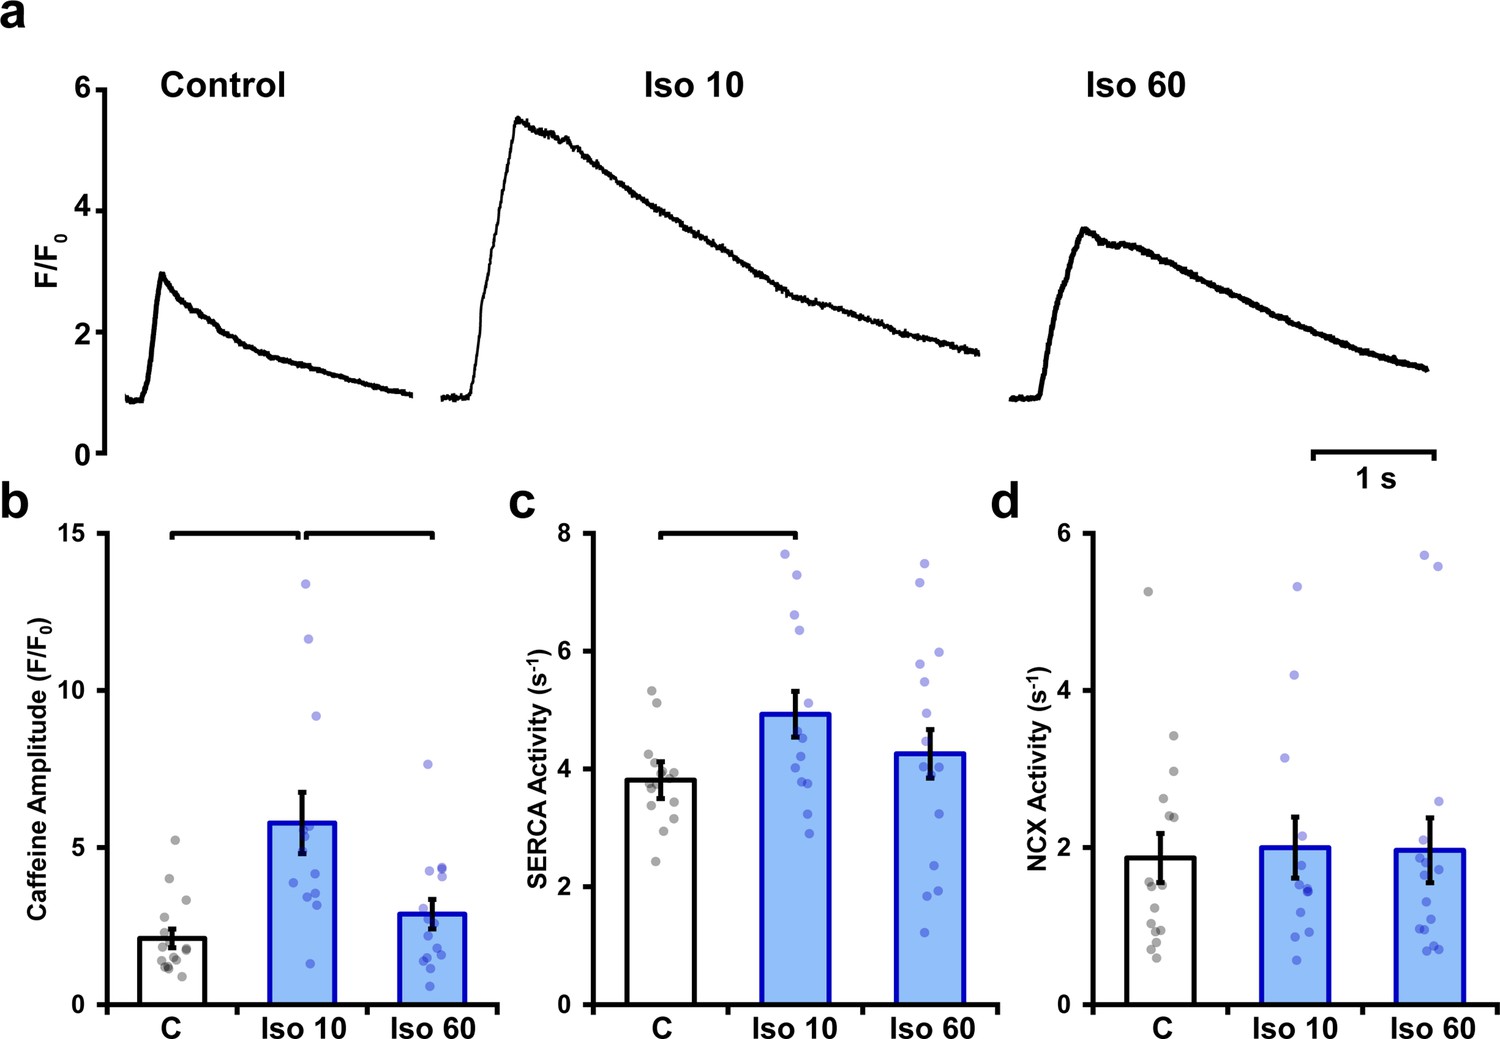
Isoproterenol elicits a biphasic increase in sarcoplasmic reticulum (SR) Ca2+ content.
SR Ca2+ content was estimated by rapidly changing the superfusate to one containing 10 mmol/L caffeine, and measuring the amplitude of the elicited Ca2+ release. Representative recordings (a) and mean data (b) show that a marked increase in SR content during early isoproterenol treatment was reversed with continued exposure. SERCA and NCX activity (c and d, respectively) were estimated based on fits of the decays of caffeine- and electrically elicited Ca2+ transients (see ‘Materials and methods’) (control: ncells = 16, nhearts = 4; Iso 10: ncells = 13, nhearts = 4; Iso 60: ncells = 15, nhearts = 4).
Figure 5 with 2 supplements
Mathematical modeling linking changes in ryanodine receptor (RyR) configuration and function during β-adrenergic stimulation.
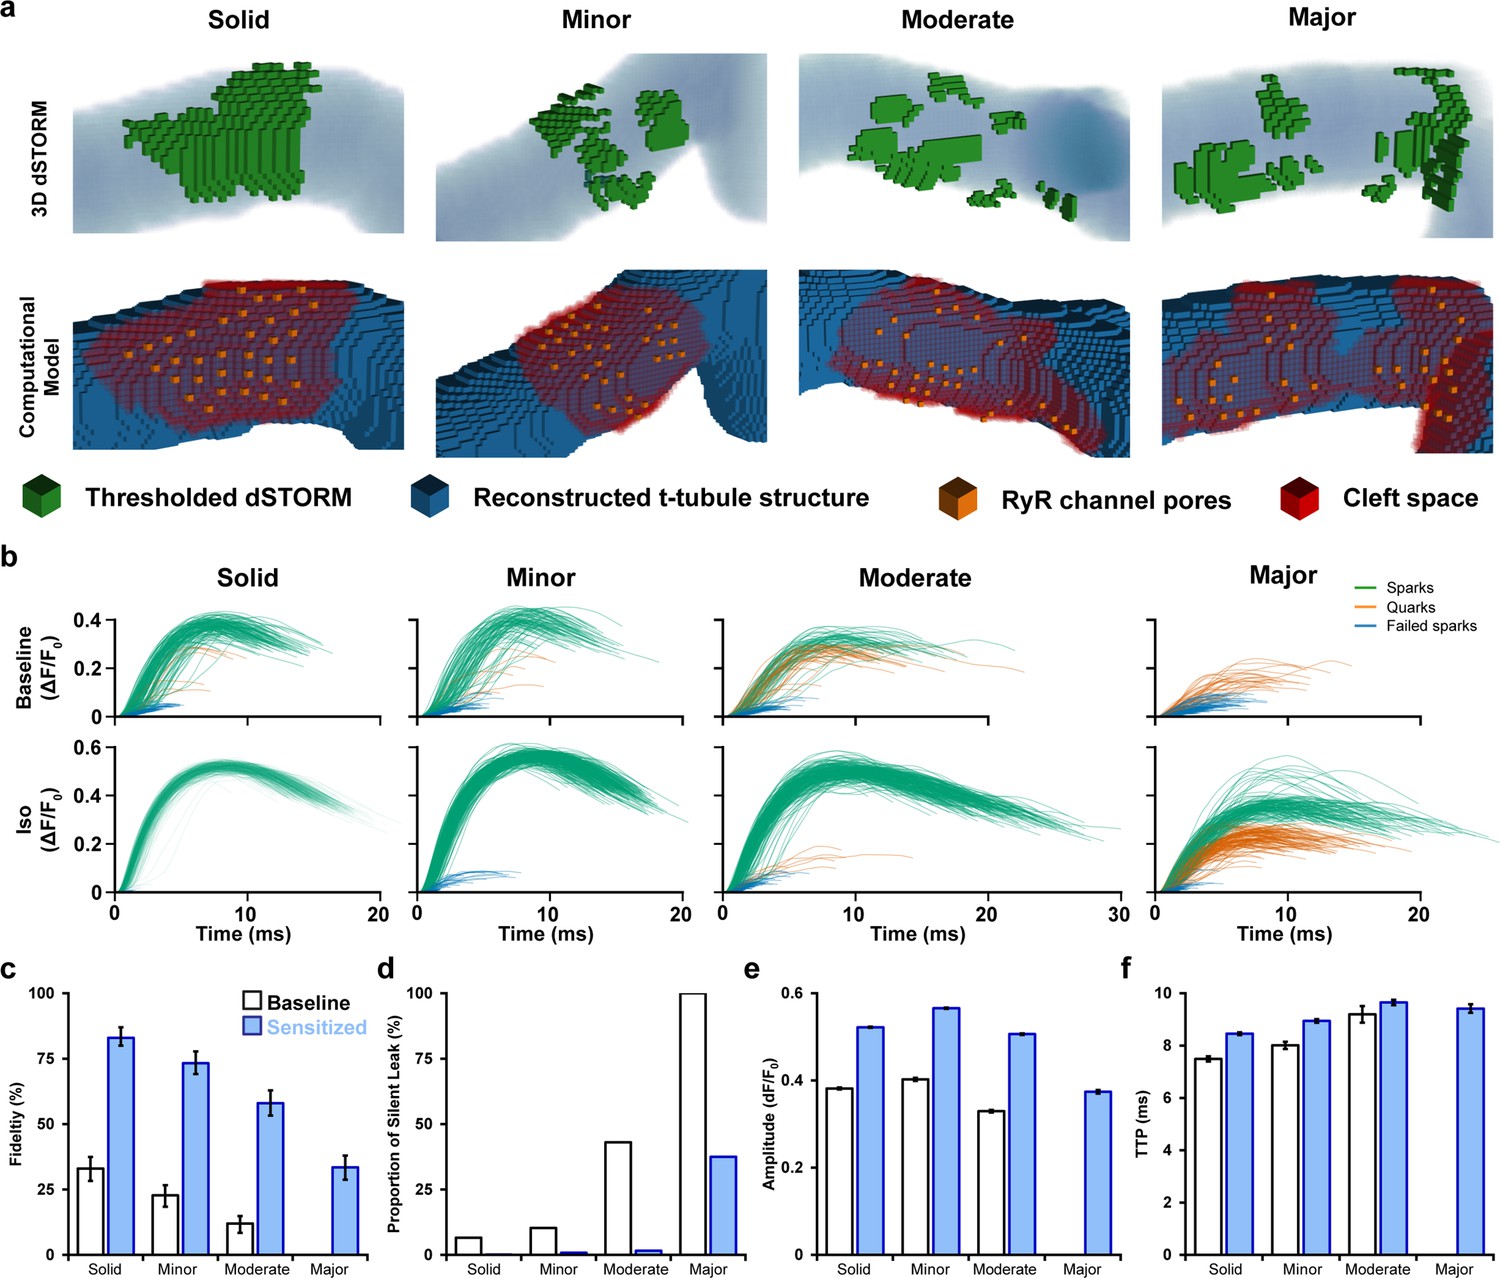
(a) 3D computational volumetric meshes built from correlative imaging of the t-tubular network (confocal microscopy) and RyRs (3D dSTORM). Constructed geometries consisted of 10 × 10 × 10 nm voxels and a 1 × 1 × 1 µm volume. The four geometries were chosen to represent the range of cluster dispersion seen in imaging (see Supplementary file 1 for details). (Top row) Reconstructed t-tubular structures (blue) are illustrated with superimposed thresholded RyR signals (green). (Bottom row) Corresponding computational geometries, with indicated RyR channel pores (orange) and cleft space (red) defined by morphological dilation around the RyRs. The four geometries were selected to represent the range of RyR dispersion observed in experiments, ranging from solid to majorly fragmented Ca2+ release units (CRUs) (see ‘Materials and methods’). (b) In total, 400 stochastic spark simulations were performed in each geometry with baseline model parameters, and another 400 were conducted with the regulatory effects of β-adrenergic receptor (β-AR) stimulation added (RyR sensitization and increased sarcoplasmic reticulum [SR] content). The ΔF/F0 time course is shown for each spark. The maximal amplitude used to define the release as an experimentally observable spark event (ΔF/F0 ≥ 0.3), a sub-spark quark event (ΔF/F0 ≥ 0.1), or a failed spark (ΔF/F0 < 0.1). (c, d) The classification of release into spark and non-spark events was used to estimate spark fidelity and the ratio of leak that is ‘silent’ (i.e., sub-spark release) in each simulation case. (e, f) Average amplitude and time to peak (TTP) measurements for observable sparks. Unshaded and shaded bars in (c–f) denote baseline and sensitized (simulated β-AR activation) RyR conditions, respectively. Error bars in (e) and (f) show SEM, while the bars in (c) indicate the 95% Agresti–Coull confidence interval.
Figure 5—figure supplement 1
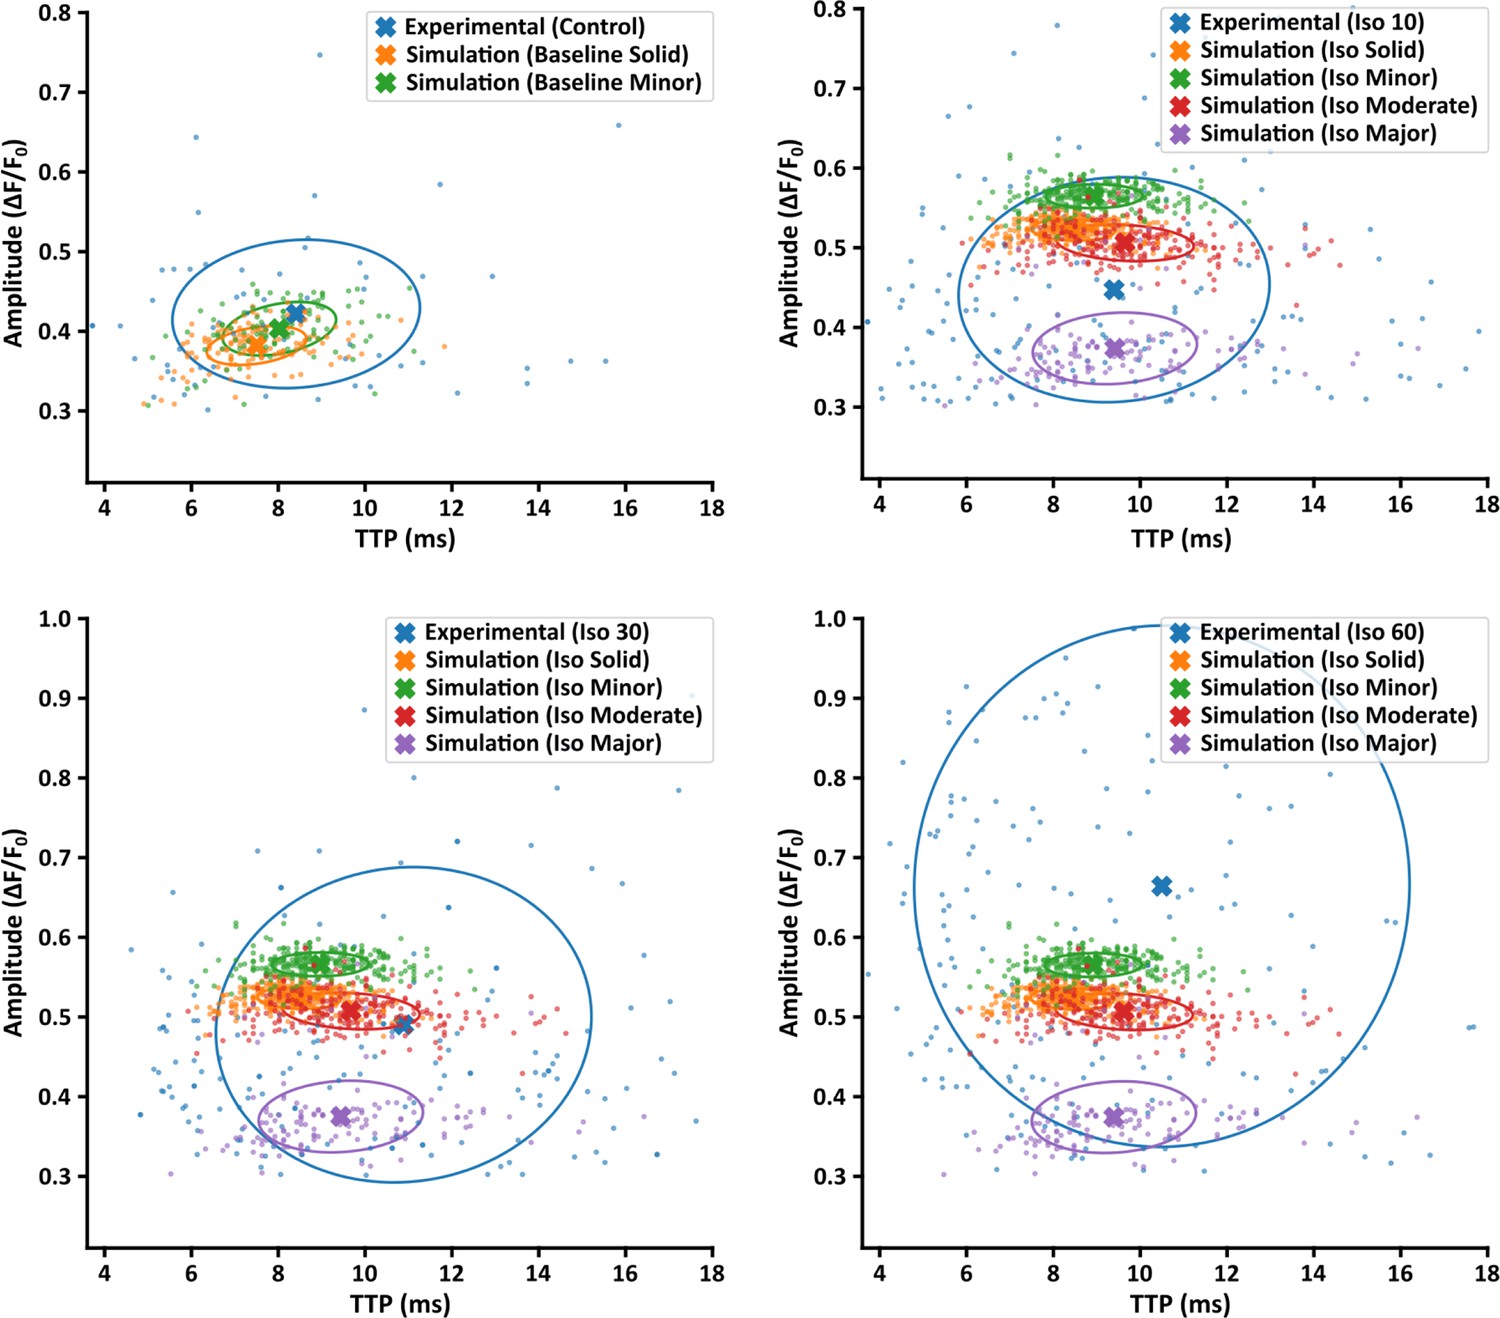
Comparison of experimentally measured and simulated Ca2+ sparks.
Amplitude and time to peak (TTP) values for experimentally measured Ca2+ sparks are plotted under control conditions and the three time points of isoproterenol stimulation (10, 30, and 60 min). Comparison is made with simulated sparks generated by the four modeled Ca2+ release unit (CRU) geometries under baseline conditions, and under simulated isoproterenol conditions including increased ryanodine receptor (RyR) release flux and Ca2+ sensitivity. Note that the simulated sparks shown are identical in the three latter plots. Crosses indicate population means, and circles show the covariance ellipse at 1 SD.
Figure 5—figure supplement 2
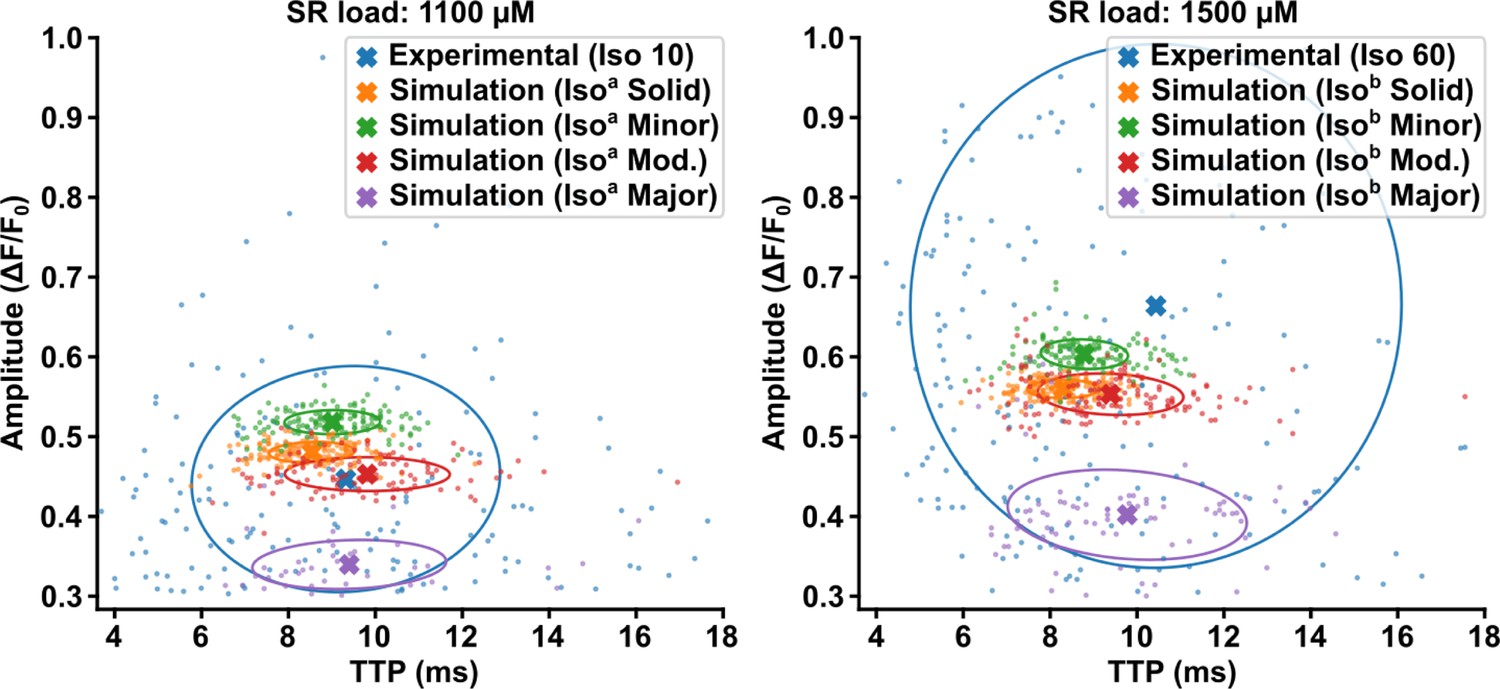
Model behavior at different sarcoplasmic reticulum (SR) loads.
To test model behavior, we perturbed the SR load parameter in the isoproterenol model while maintaining ryanodine receptor (RyR) Ca2+ sensitivity. We compared the standard isoproterenol model (i.e., SR load = 1300 µM, see Figure 4—figure supplement 1) with SR content reduced to 1100 µM (left panel, ‘Isoa’), or increased to 1500 µM (right panel, ‘Isob’). These perturbations had little effect on spark time to peak (TTP), with similar trends observed across the modeled Ca2+ release unit (CRU) geometries. Spark amplitude, on the other hand, was observed to be markedly sensitive to SR load perturbation. Results are plotted alongside experimental data recorded at 10 min or 60 min following isoproterenol treatment (left and right panels, respectively).
Figure 6 with 1 supplement
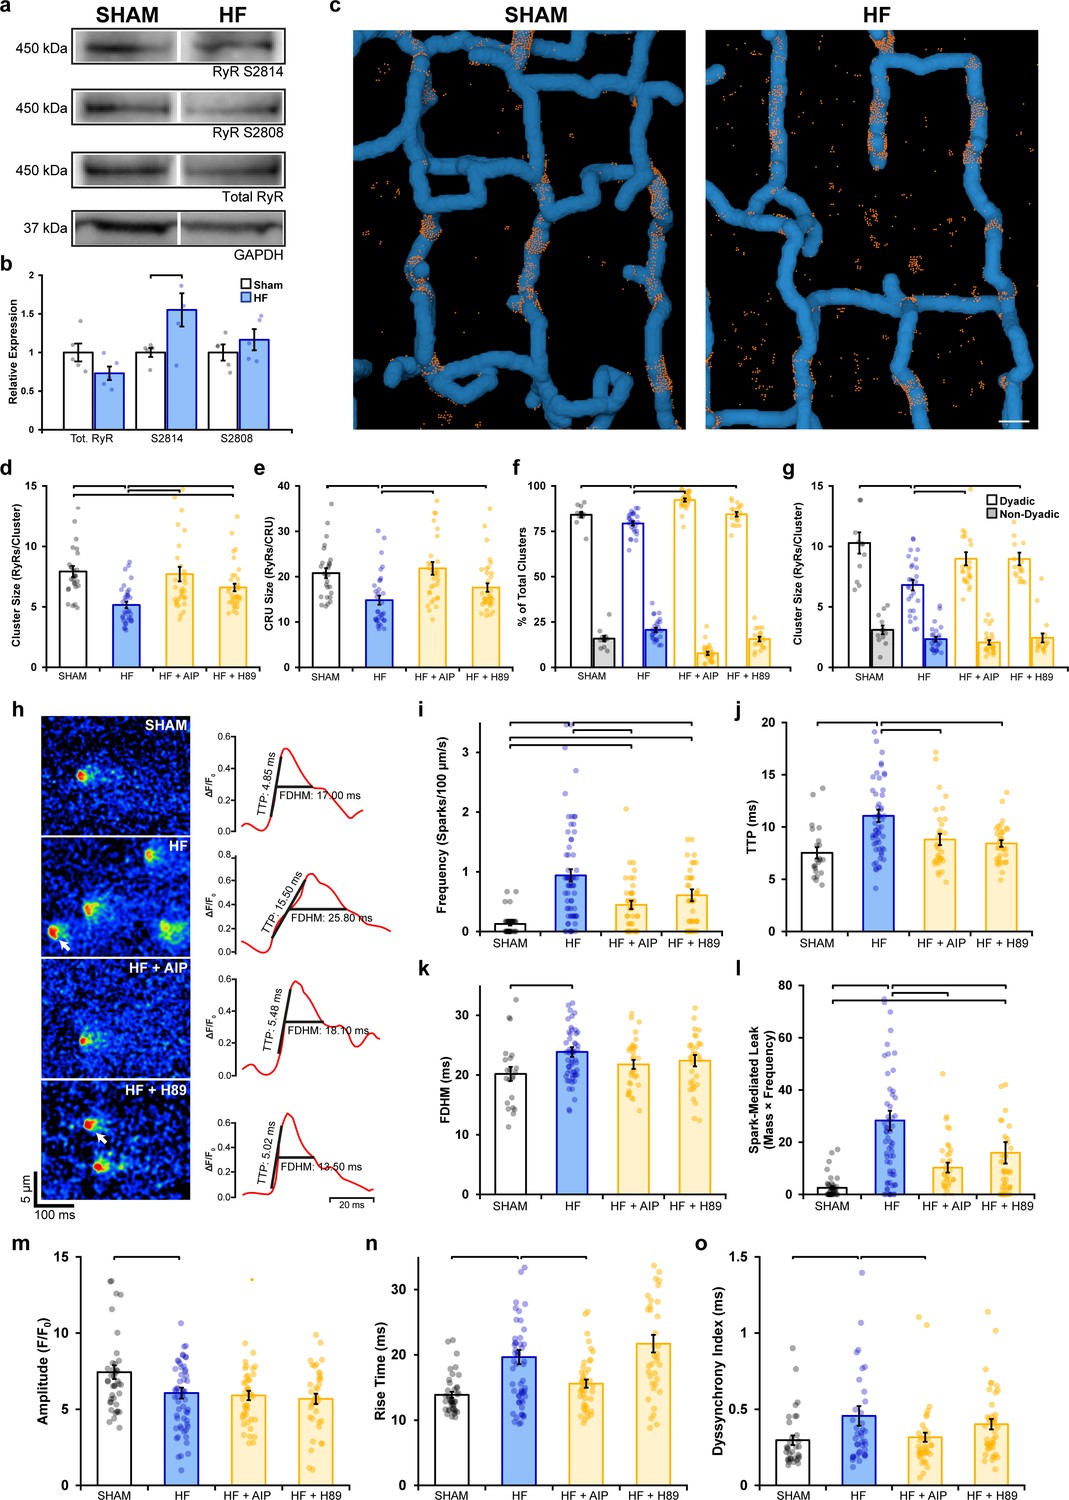
Remodeling of ryanodine receptor (RyR) organization and function during heart failure (HF) are reversed by inhibiting phosphorylation.
(a, b) Representative Western blots and quantification of the relative expression of Ca2+/calmodulin-dependent protein kinase II (CaMKII)-phosphorylated RyR (S2814), protein kinase A (PKA)-phosphorylated RyR (S2808), and total RyR in sham and HF cardiomyocytes (sham: nhearts = 5; HF: nhearts = 5). (c) 3D reconstruction of dyads in sham and failing cells based on correlative imaging of t-tubules (blue, confocal microscopy) and RyRs (orange, 3D dSTORM). Scale bar: 500 nm. (d, e) RyR cluster and Ca2+ release unit (CRU) size measurements in cardiomyocytes from sham and HF cells, at baseline and following inhibition of CaMKII (AIP) or PKA (H89) (sham: ncells = 27, nhearts = 4; HF: ncells = 33, nhearts = 4; HF + AIP: ncells = 33, nhearts = 4; HF + H89: ncells = 35, nhearts = 4). Dyadic/non-dyadic cluster proportion (f) and sizes (g) in sham and HF cells, at baseline and following CaMKII or PKA blockade. (h) Representative Ca2+ spark examples from sham and HF cardiomyocytes with or without CaMKII inhibition (AIP) or PKA inhibition (H89). The time course of each spark is shown on right. (i–l) Measurements of spark frequency, time to peak (TTP), duration, and spark-mediated leak in sham and HF cells at baseline and following treatment with AIP or PKA (sham: nsparks = 32, ncells = 42, nhearts = 3; HF: nsparks = 476, ncells = 65, nhearts = 5; HF + AIP: nsparks = 163, ncells = 63, nhearts = 5; HF + H89: nsparks = 196, ncells = 43, nhearts = 3). (m–o) Measurements of cell-wide Ca2+ transient magnitude, TTP (rise time), and dyssynchrony in sham and HF cells in the presence and absence of AIP or PKA (sham: ncells = 41, nhearts = 4; HF: ncells = 59, nhearts = 4; HF + AIP: ncells = 43, nhearts = 4; HF + H89: ncells = 38, nhearts = 3). The bar charts present mean measurements ± SEM. For Western blotting data, superimposed data points represent measurements from individual hearts (b). For all graphs, data points represent averaged values from each cardiomyocyte. Statistical significance (p<0.05) between groups is indicated by a comparison bar.
-
Figure 6—source data 1
Raw Western blots of total RyR, Ser2814 and Ser2808 expression.
- https://cdn.elifesciences.org/articles/77725/elife-77725-fig6-data1-v2.zip
Figure 6—figure supplement 1
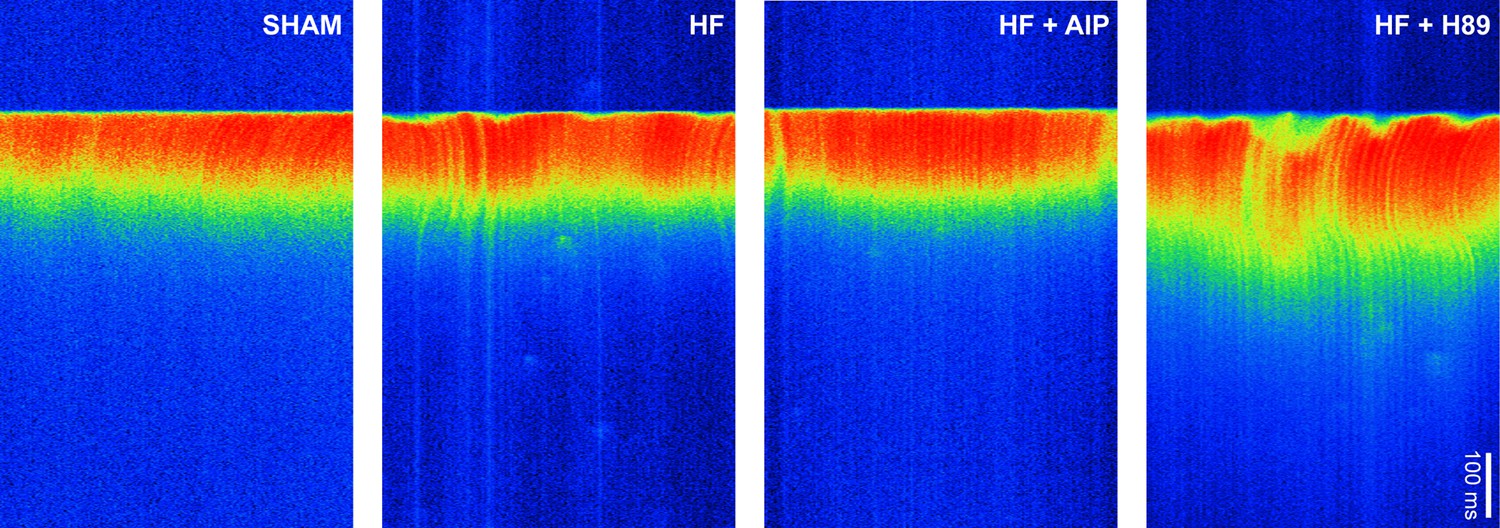
Ca2+ transients in sham and heart failure (HF) myocytes.
Representative line-scan images illustrating the last in a series of electrically paced Ca2+ transients. Dyssynchronous and slowed Ca2+ release observed in HF myocytes was reversed by treatment with AIP but not with H89. See Figure 6m–o for mean measurements.
Additional files
-
Supplementary file 1
Definition of modeled ryanodine receptor (RyR) cluster geometries.
From a large number of automatically generated 3D Ca2+ release unit (CRU) geometries, four were selected to be used in mathematical modeling of Ca2+ release. These were chosen to represent the range of fragmentation observed experimentally, while ensuring that each CRU contained roughly the same number of RyRs. Characteristics for each CRU are listed. Spatial spread among the RyRs within each geometric configuration was summarized with calculation of the root mean square distance of RyRs to the CRU center.
- https://cdn.elifesciences.org/articles/77725/elife-77725-supp1-v2.docx
-
Supplementary file 2
Model parameters for Ca2+ buffering.
Ca2+ diffusion is subject to mobile and immobile buffers in the cytosolic and sarcoplasmic reticulum (SR) compartments and was modeled for five buffer species (left) in kinetic detail. Only calsequestrin was modeled inside the SR domain, while the remaining buffers were cytosolic. Troponin and calsequestrin were modeled as immobile (σ = 0). The buffering capacity of each buffer species is defined by Btot, and the binding on- and off-rates are given by kon and koff, respectively.
- https://cdn.elifesciences.org/articles/77725/elife-77725-supp2-v2.docx
-
Supplementary file 3
Ryanodine receptor (RyR) model parameters.
Parameters of the two-state RyR model. The on-rate (+) and off-rate (-) for Ca2+ activation are given in the two rows of the table. For each rate, kmin and kmax represent the upper and lower bounds at very low and high cytosolic calcium ([Ca2+]i). These rate bounds apply when the corresponding value for ([Ca2+]i/Kd)n is outside of the bounds they set. Otherwise, both rates are calculated via the corresponding ([Ca2+]i/Kd)n. The on-rate was modified to simulate sensitization to cytosolic Ca2+ accompanying β-adrenergic receptor (β-AR) stimulation by shifting the half-maximal concentration from 45 µM to 25 µM, as denoted by *.
- https://cdn.elifesciences.org/articles/77725/elife-77725-supp3-v2.docx
-
Supplementary file 4
Cardiac parameters from post-myocardial infarction (MI) rats with heart failure (HF) and sham-operated controls.
HF development was examined by CINE MRI assessment based on established criteria; Sjaastad et al., 2000. Infarct size is percentage of left ventricular free wall (sham: nheart = 14; HF: nheart = 12; *p<0.05).
- https://cdn.elifesciences.org/articles/77725/elife-77725-supp4-v2.docx
-
Transparent reporting form
- https://cdn.elifesciences.org/articles/77725/elife-77725-transrepform1-v2.pdf
Download links
A two-part list of links to download the article, or parts of the article, in various formats.
Downloads (link to download the article as PDF)
Open citations (links to open the citations from this article in various online reference manager services)
Cite this article (links to download the citations from this article in formats compatible with various reference manager tools)
Prolonged β-adrenergic stimulation disperses ryanodine receptor clusters in cardiomyocytes and has implications for heart failure
eLife 11:e77725.
https://doi.org/10.7554/eLife.77725


