Actin-related protein 5 functions as a novel modulator of MyoD and MyoG in skeletal muscle and in rhabdomyosarcoma
- Department of Biology, Wakayama Medical University, Japan
- Department of RNA Biology and Neuroscience, Osaka University Graduate School of Medicine, Japan
Figures
Figure 1 with 1 supplement
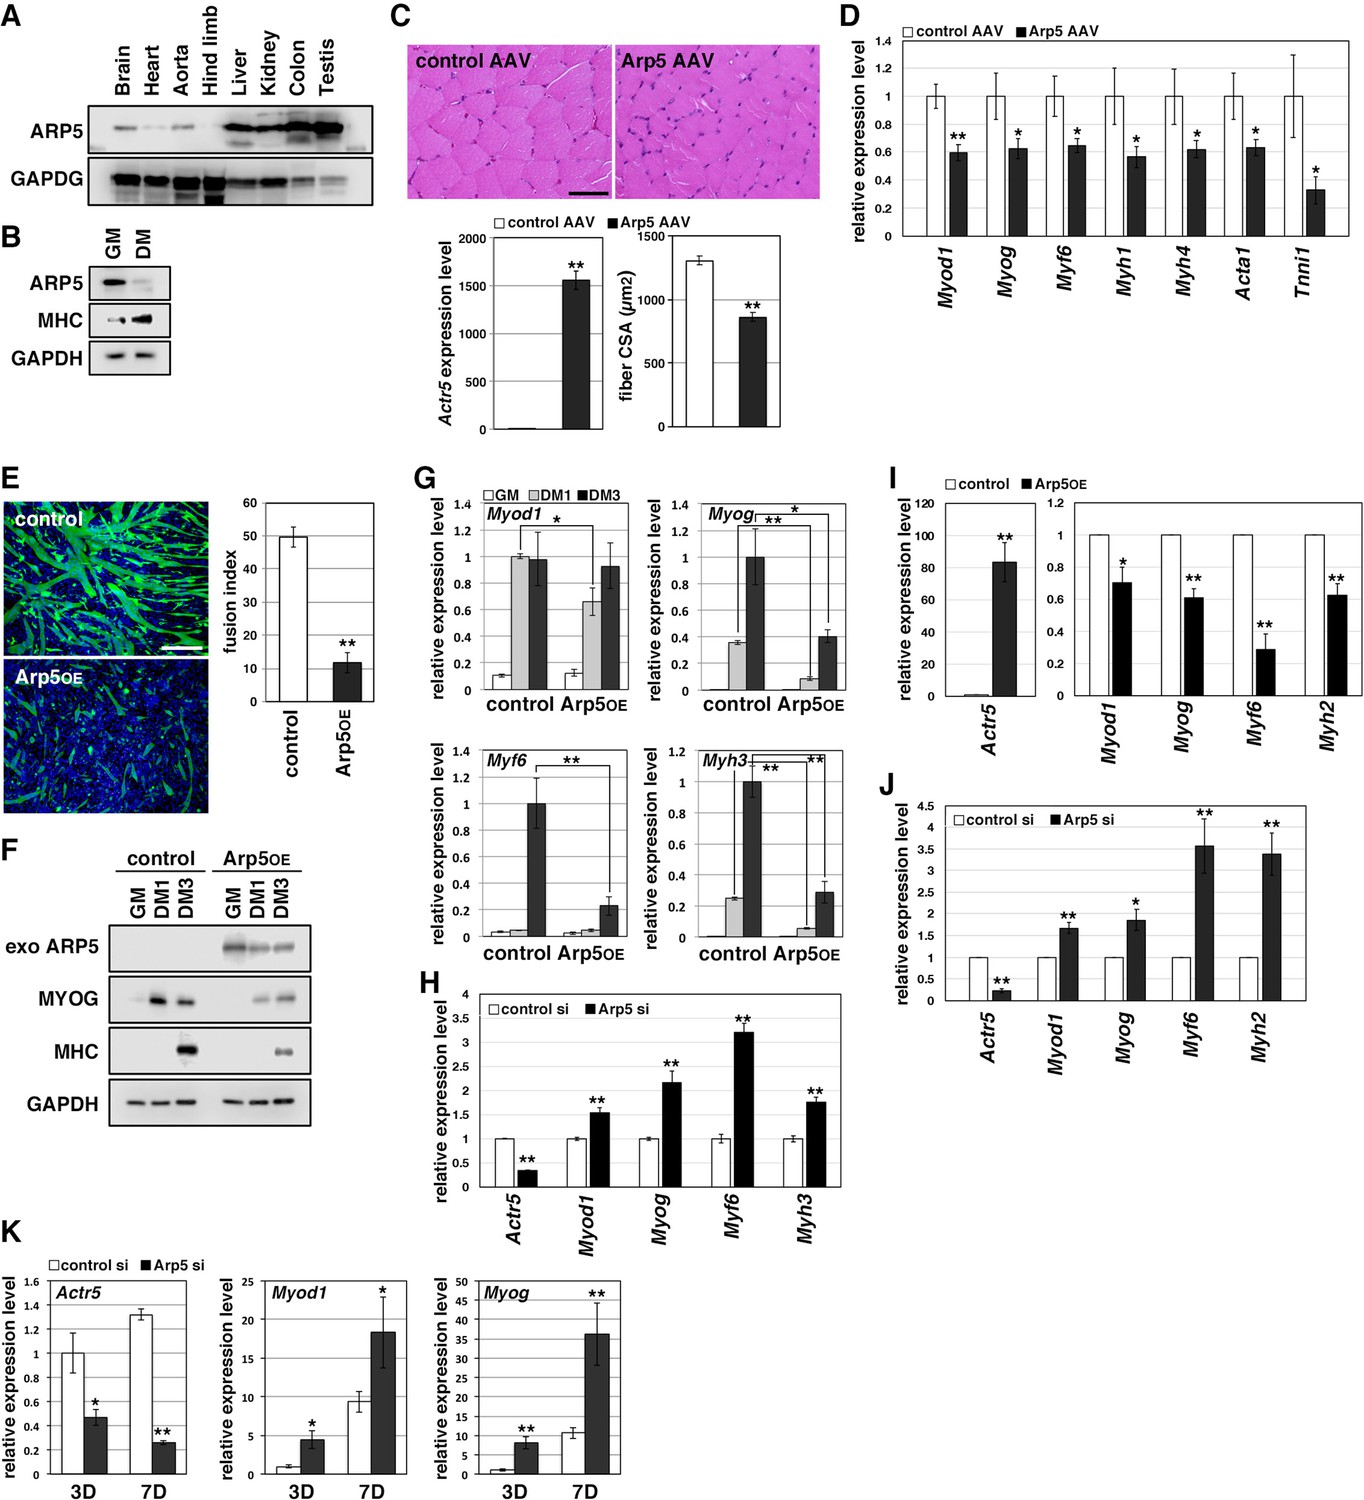
Actin-related protein 5 (Arp5) inhibits skeletal muscle differentiation.
(A) Arp5 expression in mouse tissues. (B) Arp5 and myosin heavy chain (MHC) expression in C2C12 cells cultured in growth medium (GM) or differentiation medium (DM). (C) Representative images of hematoxylin and eosin (H&E)-stained section of the hind limb muscle from mice injected with control or Arp5-AAV6 vector (upper). Scale bar = 50 µm. Arp5 overexpression was validated by real-time reverse transcription polymerase chain reaction (RT-PCR) (lower left). Muscle fiber cross-sectional area (CSA) were measured in 190 fibers and statistically analyzed (lower right). (D) Myogenic gene expression in AAV6-vector-injected hind limb muscles. (E) Representative fluorescence images of differentiated C2C12 cells transfected with green fluorescent protein (GFP) alone (control) or together with Arp5 (Arp5OE) (left). Nuclei were visualized by Hoechst 33342. Scale bar = 100 µm. The fusion index was measured on 22 images and statistically analyzed (right). (F) Myogenic protein expression in C2C12 cells transfected with control or Arp5 expression vector. The cells were cultured in GM or DM for 1 day (DM1) or 3 days (DM3) after transfection. (G) Myogenic gene expression in Arp5-transfected C2C12 cells. (H) Myogenic gene expression in C2C12 cells transfected with control or Arp5 short interfering RNA (siRNA). (I) Myogenic gene expression in Arp5-transfected mouse primary myoblasts. (J) Myogenic gene expression in mouse primary myoblasts transfected with control or Arp5 siRNA. (K) Myogenic gene expression in 10T1/2 cells treated with 5-azacytidine. The cells were transfected with control or Arp5 siRNA prior to 5-azacytidine treatment. All statistical data are presented as the mean ± standard error of the mean (SEM). *p < 0.05, **p < 0.01 (Student’s t-test).
-
Figure 1—source data 1
Raw data used for the statistical analyses presented in Figure 1.
- https://cdn.elifesciences.org/articles/77746/elife-77746-fig1-data1-v2.xlsx
-
Figure 1—source data 2
Original western blot data for Figure 1A, B and F.
- https://cdn.elifesciences.org/articles/77746/elife-77746-fig1-data2-v2.zip
Figure 1—figure supplement 1
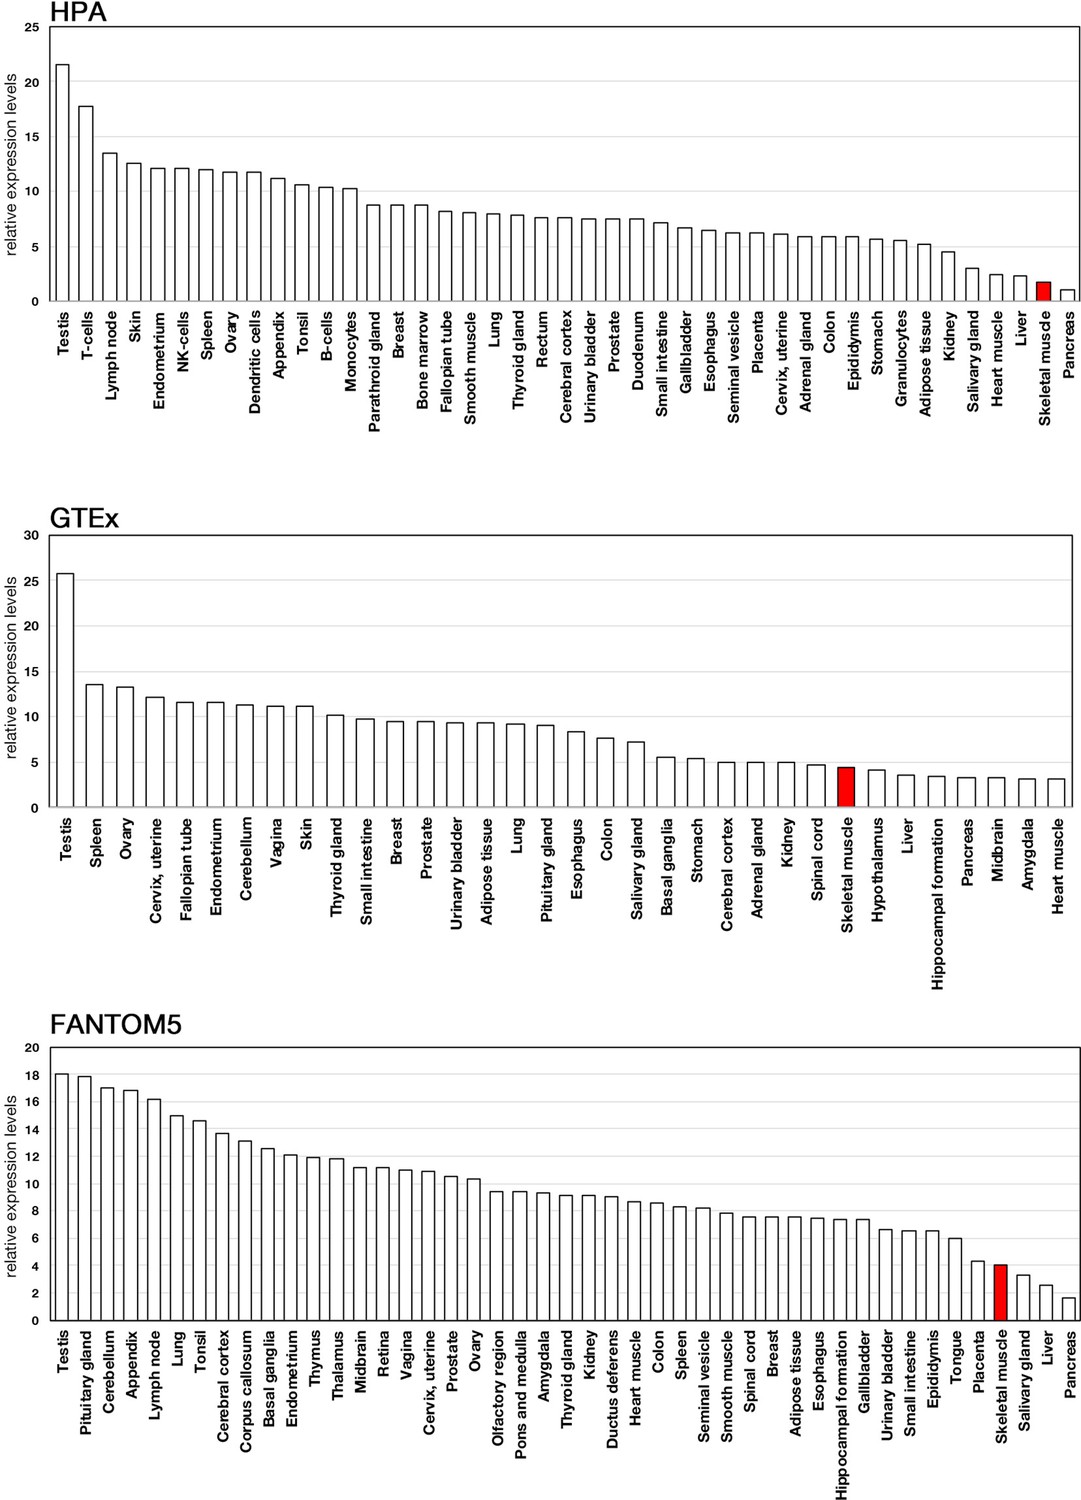
Expression profiles of actin-related protein 5 (ACTR5) in human tissues.
Expression data of ACTR5 were acquired from three public databases: Human Protein Atlas (HPA), Genotype-Tissue Expression (GTEx), and Functional Annotation of the Mouse/Mammalian Genome 5 (FANTOM5).
Figure 2 with 1 supplement
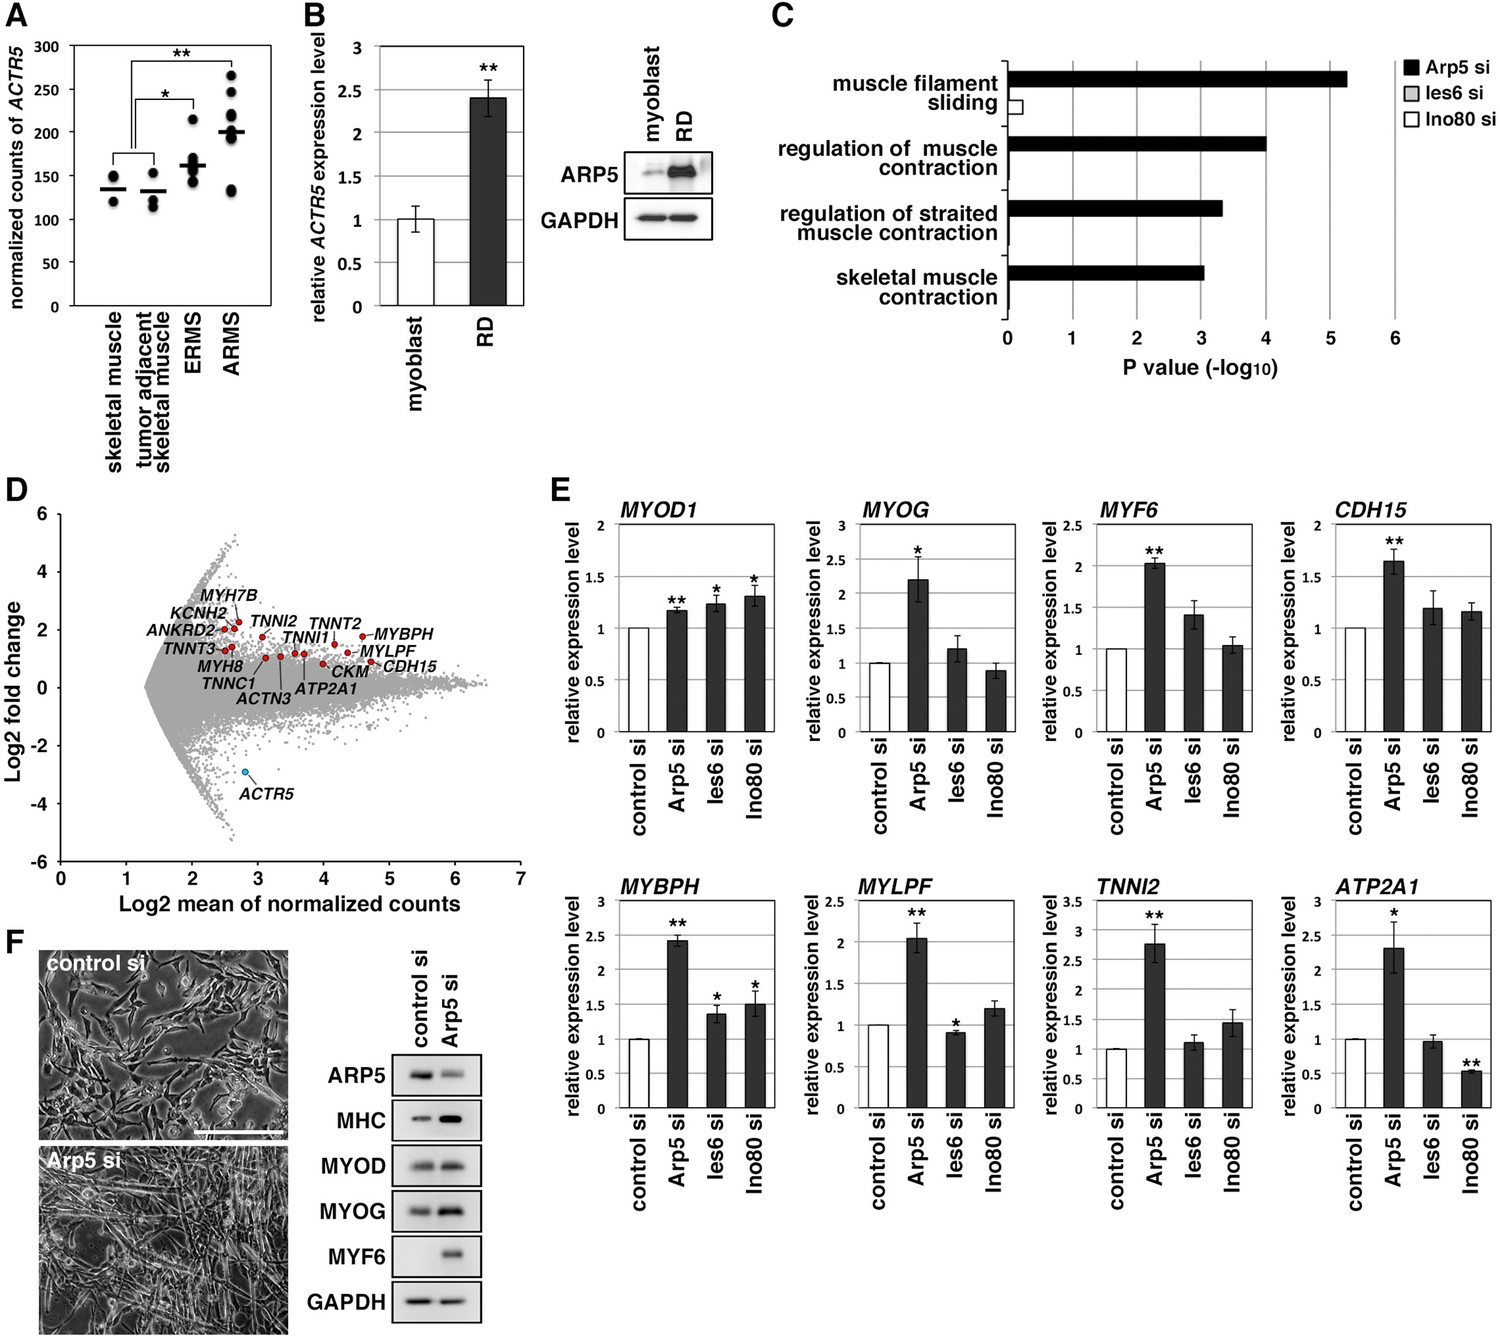
Actin-related protein 5 (Arp5) knockdown increases myogenic gene expression in rhabdomyosarcoma (RMS) cells.
(A) Comparison of ACTR5 expression in normal skeletal muscle, tumor-adjacent skeletal muscle, embryonal RMS (ERMS), and alveolar RMS (ARMS) from published RNA-Seq data (GSE28511). Bars indicate average expression levels. (B) Gene (left) and protein (right) expression of Arp5 in human primary myoblasts and RD cells. (C) Enrichment analysis of muscle-related Gene Ontology terms from DNA microarray data on comparison between control-si and Arp5-, Ies6-, or Ino80-si samples. (D) MA plot of gene expression level in control-si and Arp5-si RD cells. The positions of Arp5 (blue) and myogenic genes (red) are shown. (E) Myogenic gene expression in control-, Arp5-, Ies6-, and Ino80-si RD cells. (F) Representative phase-contrast images of control-si and Arp5-si RD cells (left). Scale bar = 100 µm. Myogenic protein expression in these cells (right). All statistical data are presented as the mean ± standard error of the mean (SEM). *p < 0.05, **p < 0.01 (Student’s t-test).
-
Figure 2—source data 1
Raw data used for the statistical analyses presented in Figure 2.
- https://cdn.elifesciences.org/articles/77746/elife-77746-fig2-data1-v2.xlsx
-
Figure 2—source data 2
Original western blot data for Figure 2B and F.
- https://cdn.elifesciences.org/articles/77746/elife-77746-fig2-data2-v2.zip
-
Figure 2—source data 3
List of the myogenic genes whose expression level is upregulated by actin-related protein 5 (Arp5) knockdown in RD cells.
- https://cdn.elifesciences.org/articles/77746/elife-77746-fig2-data3-v2.xlsx
Figure 2—figure supplement 1
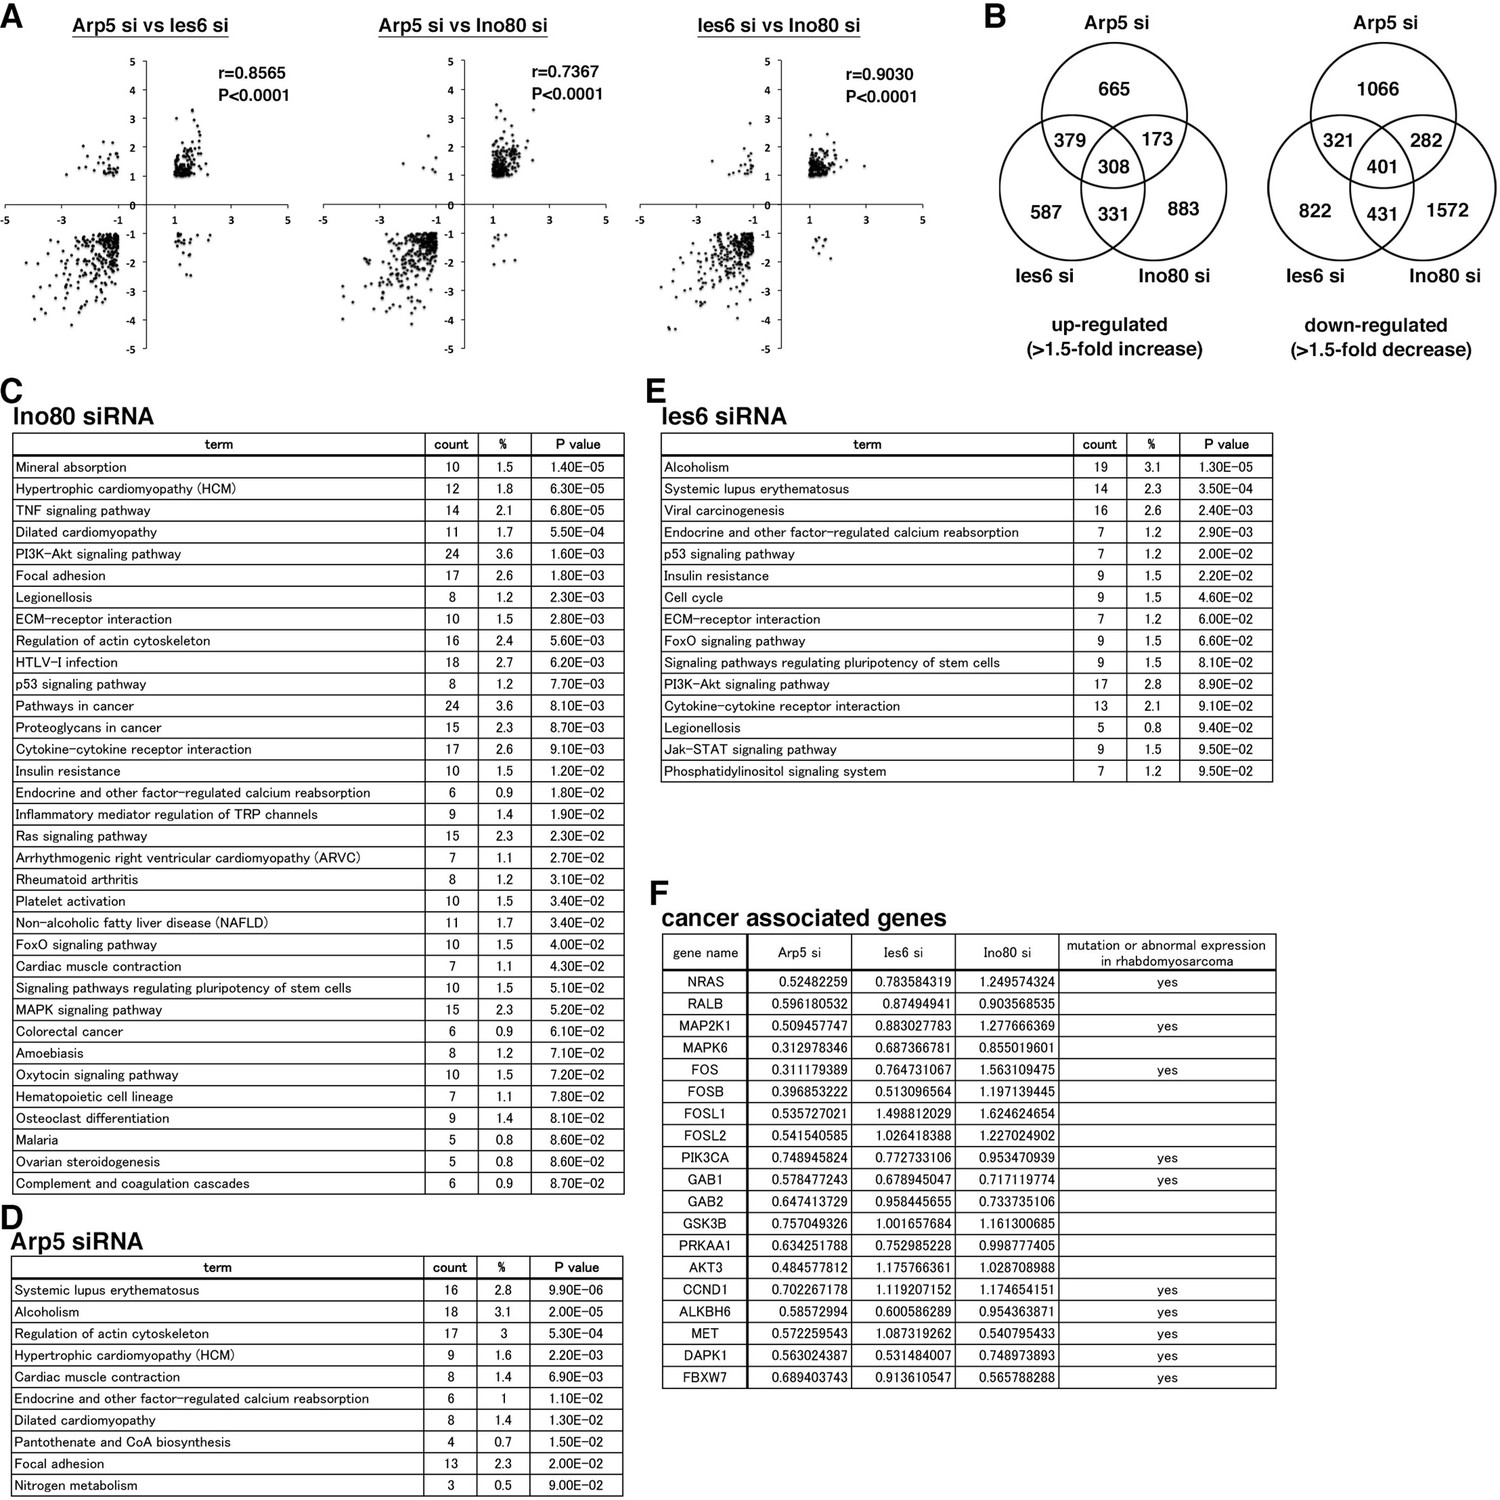
Expression profiles of genes altered by actin-related protein 5 (ACTR5), IES6, and INO80 knockdown.
(A) Scatter plot of fold changes (log2) in the expression level of genes altered by ACTR5, IES6, and INO80 knockdown. The dataset was filtered for genes with more than twofold increase or decrease. The Pearson’s correlation coefficient (r) was calculated. (B) Venn diagrams of the number of genes whose expression level increased (left) or decreased (right) by more than 1.5-fold by ACTR5, IES6, and INO80 knockdown. (C) Enrichment analysis of the Kyoto Encyclopedia of Genes and Genomes (KEGG) pathway from the DNA microarray data on Ino80 knockdown in RD cells. (D) Enrichment analysis of the KEGG pathway from the DNA microarray data on Arp5 knockdown in RD cells. (E) Enrichment analysis of the KEGG pathway from the DNA microarray data on Ies6 knockdown in RD cells. (F) List of cancer-associated genes whose expression level was downregulated by Arp5 knockdown in RD cells.
Figure 3

Actin-related protein 5-knockout (Arp5-KO) RD clones show increased expression of myogenic genes and decreased tumorigenicity.
(A) Arp5 expression in three individual clones of Arp5-KO cells (C39, C45, and C67) and their parental RD cells (wild-type [WT]). (B) Myogenic gene expression in WT and Arp5-KO cells. (C) Growth curve of WT and Arp5-KO cells. (D) Xenograft model of WT and Arp5-KO cells in nude mice (left). Tumor volumes measured every week after inoculation and statistically analyzed (right). (E) Myogenic gene expression in xenograft tumors. All statistical data are presented as the mean ± standard error of the mean (SEM). *p < 0.05, **p < 0.01 (Student’s t-test).
-
Figure 3—source data 1
Raw data used for the statistical analyses presented in Figure 3.
- https://cdn.elifesciences.org/articles/77746/elife-77746-fig3-data1-v2.xlsx
-
Figure 3—source data 2
Original western blot data for Figure 3A.
- https://cdn.elifesciences.org/articles/77746/elife-77746-fig3-data2-v2.zip
Figure 4 with 1 supplement
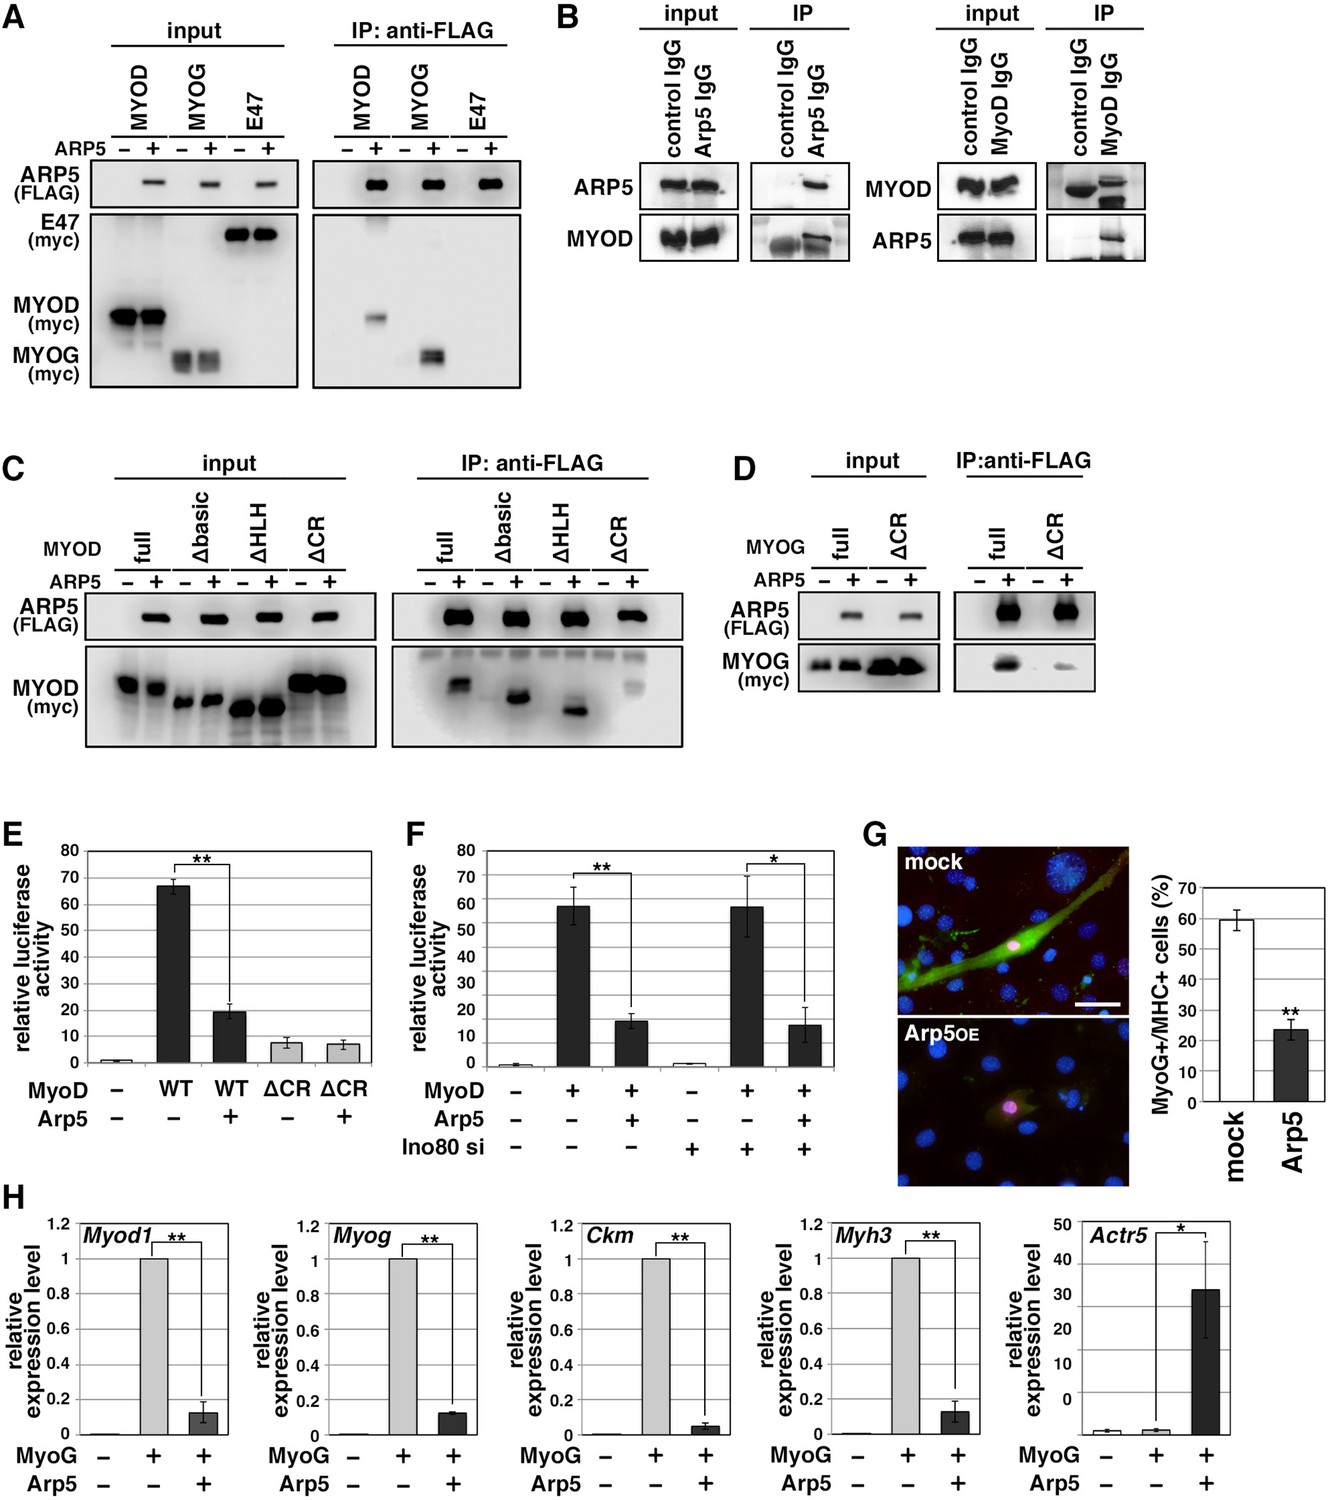
Actin-related protein 5 (Arp5) inhibits the activity of MyoD and MyoG through direct interaction.
(A) Co-immunoprecipitation assay between exogenous Arp5 and basic helix–loop–helix (bHLH) transcription factors MyoD, MyoG, and E47. (B) Co-immunoprecipitation assay between endogenous Arp5 and MyoD in RD cells. (C) Co-immunoprecipitation assay between exogenous Arp5 and truncated series of MyoD. (D) Co-immunoprecipitation assay between exogenous Arp5 and the cysteine-rich (CR)-region-deleted MyoG. (E) Myog promoter-controlled luciferase reporter assay in C2C12 cells. (F) MYOG promoter-controlled luciferase reporter assay under the Ino80-depleted condition. (G) Representative fluorescence images of 10T1/2 cells transfected with MyoG and Arp5 (left). The cells were immunostained with anti-MyoG (red) and anti-myosin heavy chain (MHC, green) antibodies. Nuclei were visualized by Hoechst 33342 (blue). Scale bar = 50 µm. The percentage of MyoG+ MHC+ double-positive cells in MyoG+-positive cells was calculated in 786 cells and statistically analyzed (right). (H) Endogenous myogenic gene expression in 10T1/2 cells transfected with MyoG and Arp5. All statistical data are presented as the mean ± standard error of the mean (SEM). *p < 0.05, **p < 0.01 (Student’s t-test).
-
Figure 4—source data 1
Raw data used for the statistical analyses presented in Figure 4.
- https://cdn.elifesciences.org/articles/77746/elife-77746-fig4-data1-v2.xlsx
-
Figure 4—source data 2
Original western blot data for Figure 3A, B, C and D.
- https://cdn.elifesciences.org/articles/77746/elife-77746-fig4-data2-v2.zip
Figure 4—figure supplement 1
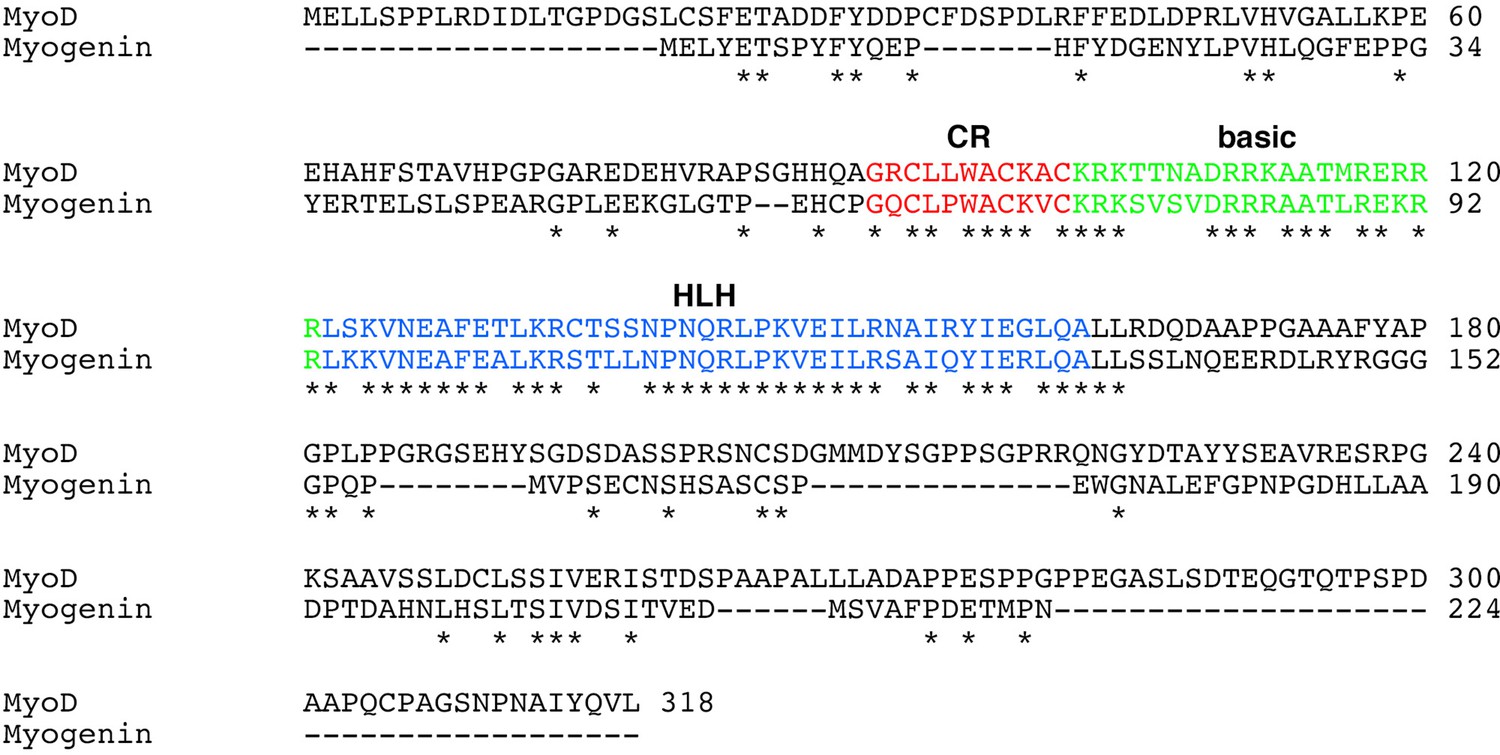
Sequence alignment between human MyoD and MyoG proteins.
The cysteine-rich (CR) (red), basic (green), and helix–loop–helix (HLH) regions are highlighted. Asterisks indicate conserved amino acid residues between them.
Figure 5
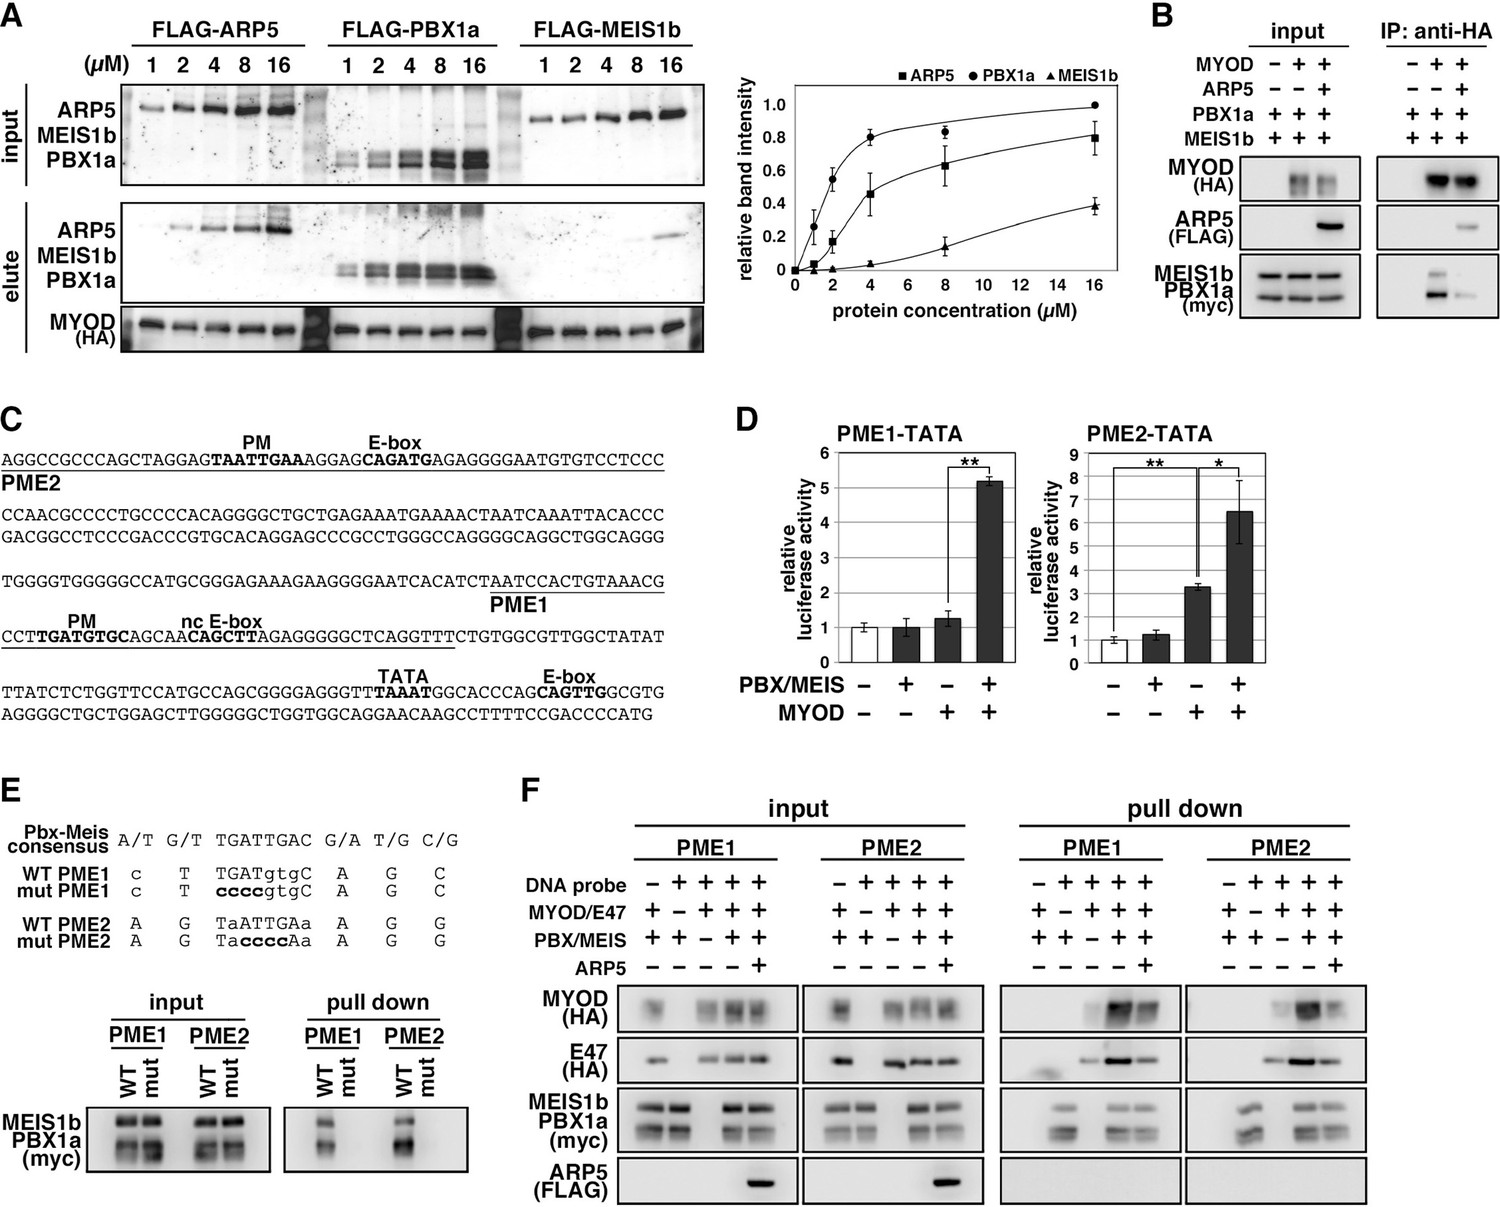
Actin-related protein 5 (Arp5) disturbs the interaction between MyoD and the Pbx1–Meis1 heterodimer.
(A) Pull-down assay of MyoD-conjugated beads with purified Arp5, Pbx1a, and Meis1b proteins (left). Band intensities of eluted proteins were measured and plotted on a graph (right). (B) Co-immunoprecipitation assay between exogenous MyoD and Pbx1a–Meis1b. Co-incubation with Arp5 protein (lanes 3 and 6) diminished their interaction. (C) Sequence of the proximal promoter region of human MYOG. The core sequences of the indicated cis-regulatory elements are highlighted in bold. Pbx1–Meis1 heterodimer-binding motif/noncanonical E-box (PM/ncE)-containing regions (PME1 and PME2) are underlined. (D) PME1/2-TATA-controlled luciferase reporter assay in C2C12 cells. All statistical data are presented as the mean ± standard error of the mean (SEM). *p < 0.05, **p < 0.01 (Student’s t-test). (E) Pull-down assay of PME1/2 DNA probes with Pbx1a–Meis1b protein. The consensus sequence of the PM motif is presented. The mutated nucleotides in the mut PME1/2 probes are highlighted in bold. (F) Pull-down assay of PME1/2 DNA probes with MyoD, E47, Pbx1a–Meis1b, and Arp5 proteins.
-
Figure 5—source data 1
Raw data used for the statistical analyses presented in Figure 5.
- https://cdn.elifesciences.org/articles/77746/elife-77746-fig5-data1-v2.xlsx
-
Figure 5—source data 2
Original western blot data for Figure 5A, B, E and F.
- https://cdn.elifesciences.org/articles/77746/elife-77746-fig5-data2-v2.zip
Figure 6
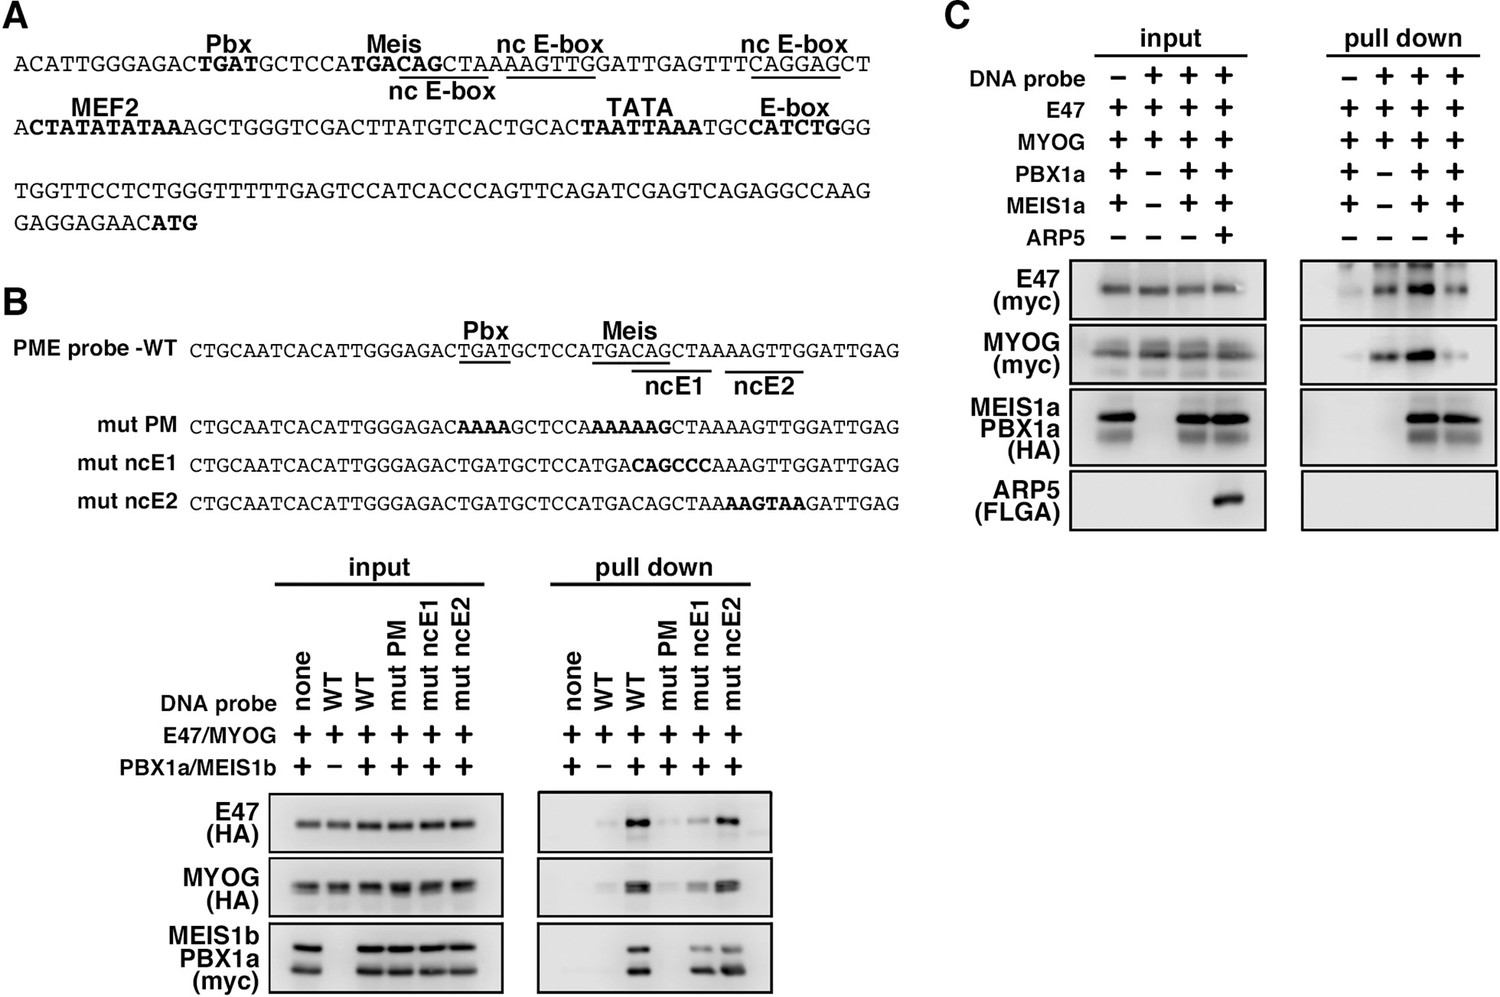
MyoG and the Pbx1–Meis1 heterodimer recognize the proximal promoter region of human myogenic regulatory factor 6 (MRF6).
(A) Sequence of the proximal promoter region of human MRF6. The core sequences of the indicated cis-regulatory elements are highlighted in bold. The core sequences of putative noncanonical E-box motif (nc E-box) are underlined. (B) Pull-down assay of Mrf6 Pbx1–Meis1 heterodimer-binding motif/noncanonical E-box (PM/ncE)-containing region (PME) probes with MyoG, E47, and Pbx1a–Meis1b proteins. The mutated nucleotides in the mut PME probes (mut PM, mut ncE1, and mut ncE2) are highlighted in bold (top). The Pbx1–Meis1 heterodimer recognized the gapped Pbx–Meis-binding motif, while MyoG–E47 bound to the ncE1 site with the Pbx–Meis complex (bottom). (C) Pull-down assay of Mrf6 PME probes with MyoG, E47, Pbx1a–Meis1b, and Arp5 proteins.
-
Figure 6—source data 1
Original western blot data for Figure 6B and C.
- https://cdn.elifesciences.org/articles/77746/elife-77746-fig6-data1-v2.zip
Figure 7 with 2 supplements
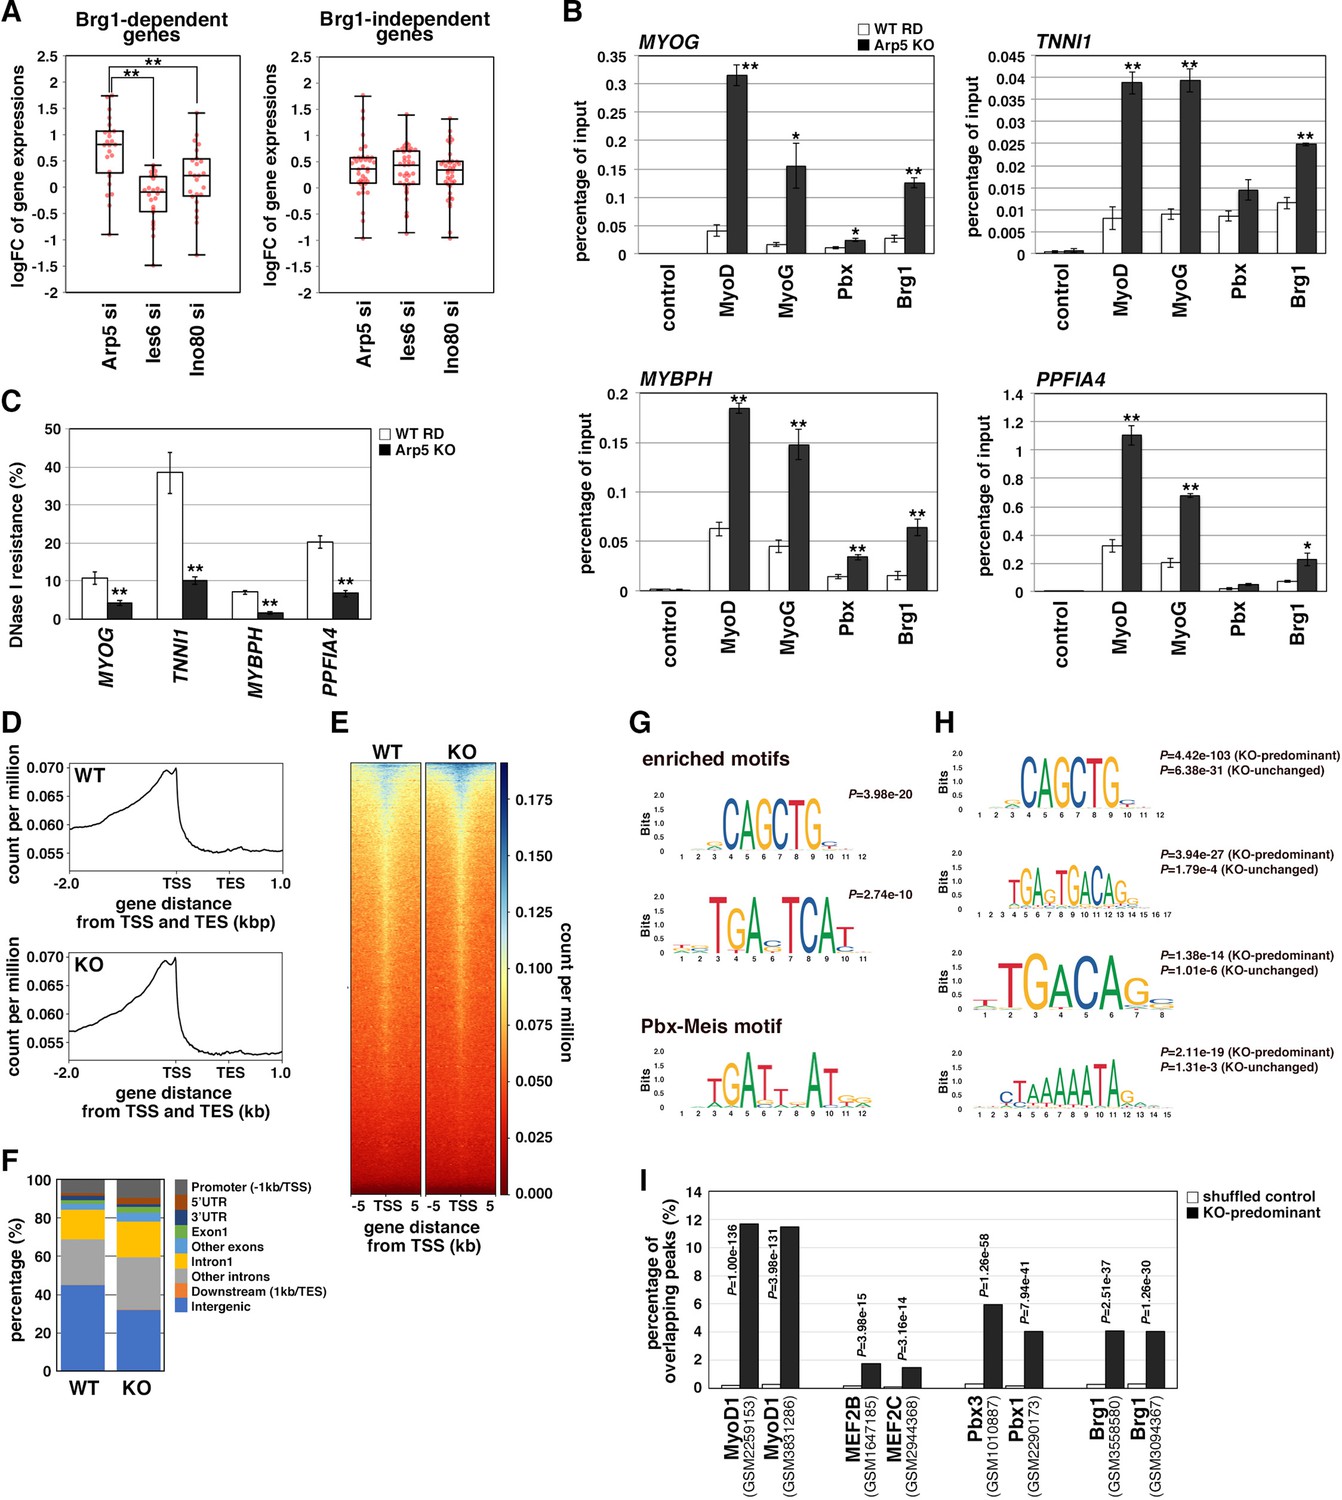
Actin-related protein 5 (Arp5) inhibits the recruitment of MyoD, MyoG, and Brg1-based switch/sucrose nonfermentable (SWI/SNF) to the enhancer region of myogenic genes.
(A) Box-and-whisker plot of fold changes (log2) in the expression level of Brg1-dependent and Brg1-independent myogenic genes by ACTR5, IES6, and INO80 knockdown. (B) Chromatin immunoprecipitation (ChIP) analysis using antibodies against MyoD, MyoG, Pbx, and Brg1 in wild-type (WT) and Arp5-knockout (KO) cells. Nonimmune IgG was used as a control. Enrichment efficiency of DNA fragments of MYOG, TNNI1, MYBPH, and PPFIA4 enhancer loci was quantified by real-time polymerase chain reaction (PCR). (C) DNase I sensitivity assay of the enhancer loci in WT and Arp5-KO RD cells. Statistical data in (A), (B), and (C) are presented as the mean ± standard error of the mean (SEM). *p < 0.05, **p < 0.01 (Student’s t-test). (D) Meta-gene profiles of MyoD ChIP-Seq in WT and Arp5-KO RD cells. TSS = transcription start site, TES = transcription end site. (E) Density heatmaps of MyoD ChIP-Seq reads around the TSS in WT and Arp5-KO RD cells. (F) Genomic distributions of MyoD-binding peaks in WT and Arp5-KO RD cells. (G) Enriched motifs in the Arp5-KO peaks compared to the WT peaks. Statistical analyses were performed by Fisher’s exact test. The motif previously reported as a Pbx–Meis-binding site is shown in a lower panel. (H) Enriched motifs in the KO-predominant and KO-unchanged peaks. Statistical analyses were performed by Fisher’s exact test. (I) Enrichment analysis of the KO-predominant peaks. Percent overlap between the KO-predominant peaks and MyoD, MEF2, Pbx, and Brg1 ChIP-Seq peaks from published database was calculated, respectively. Accession numbers of the used database were indicated. Statistical analyses were performed by Fisher’s exact test using mononucleotide-shuffled sequences of the KO-predominant peaks as a control.
-
Figure 7—source data 1
Raw data used for the statistical analyses presented in Figure 7.
- https://cdn.elifesciences.org/articles/77746/elife-77746-fig7-data1-v2.xlsx
Figure 7—figure supplement 1
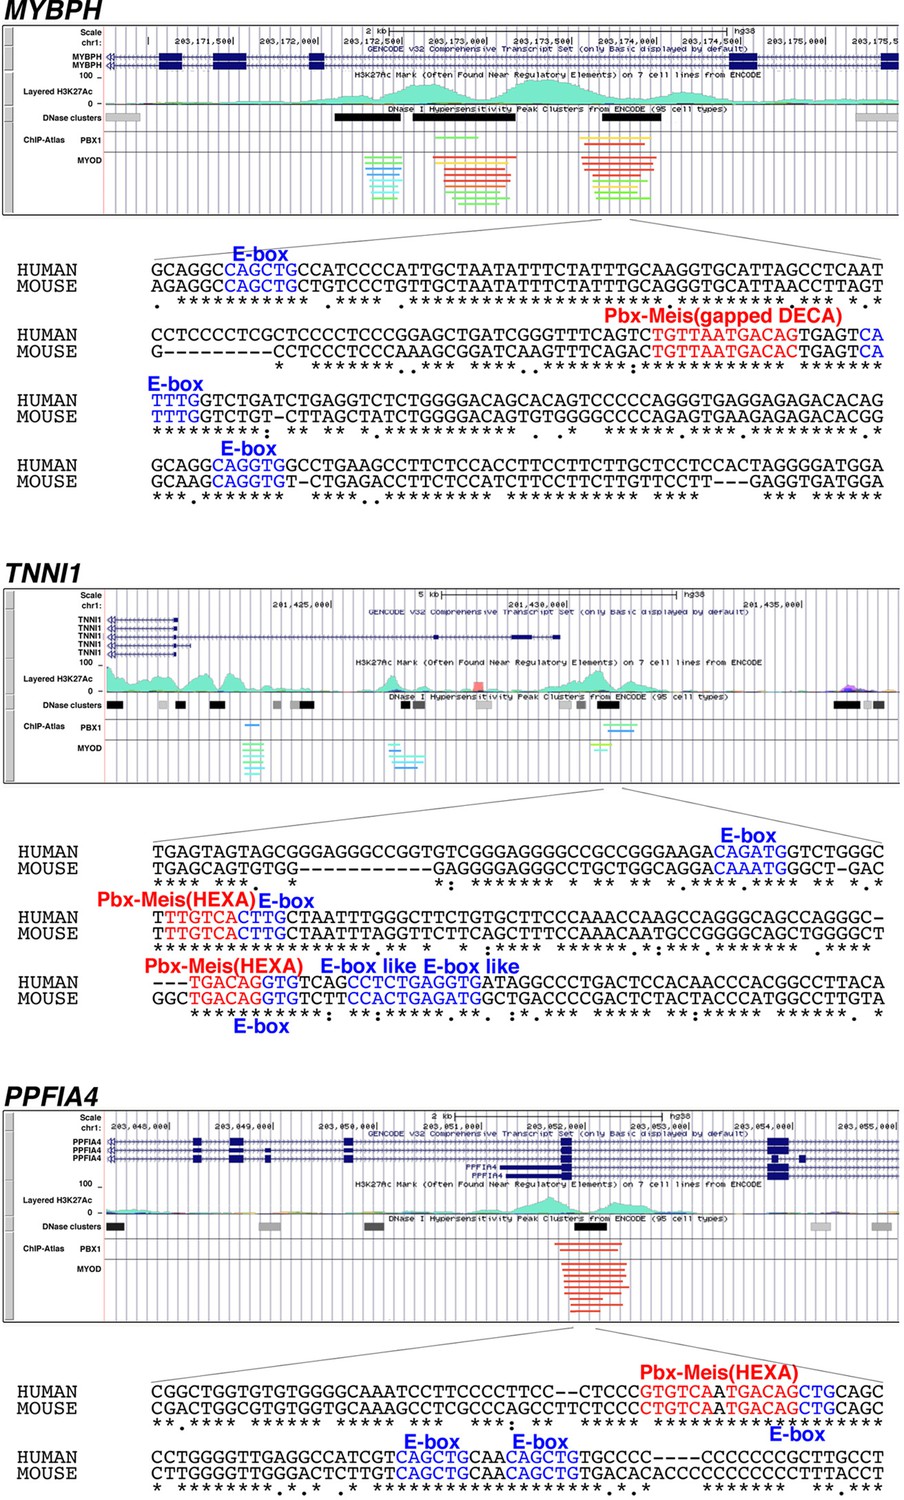
Putative enhancer regions recognized by Pbx1 and MyoD/MyoG in human MYBPH, TNNI1, and PPFIA4.
Data on the enrichment of H3K27Ac histone markers and DNase I hypersensitivity clusters were acquired from the Encyclopedia of DNA Elements (ENCODE) public database, version 3 (https://www.encodeproject.org). Data on the chromatin immunoprecipitation (ChIP) sequence were acquired from the ChIP-Atlas public database (https://chip-atlas.org). Nucleotide sequences of putative enhancer regions are presented with highlighted Pbx–Meis-binding motif (red) and E-box motif (blue). Decameric (DECA, TGATTGACAG) and hexameric (HEXA, TGACAG) motifs are reported as a consensus sequence of the Pbx–Meis-binding site.
Figure 7—figure supplement 2
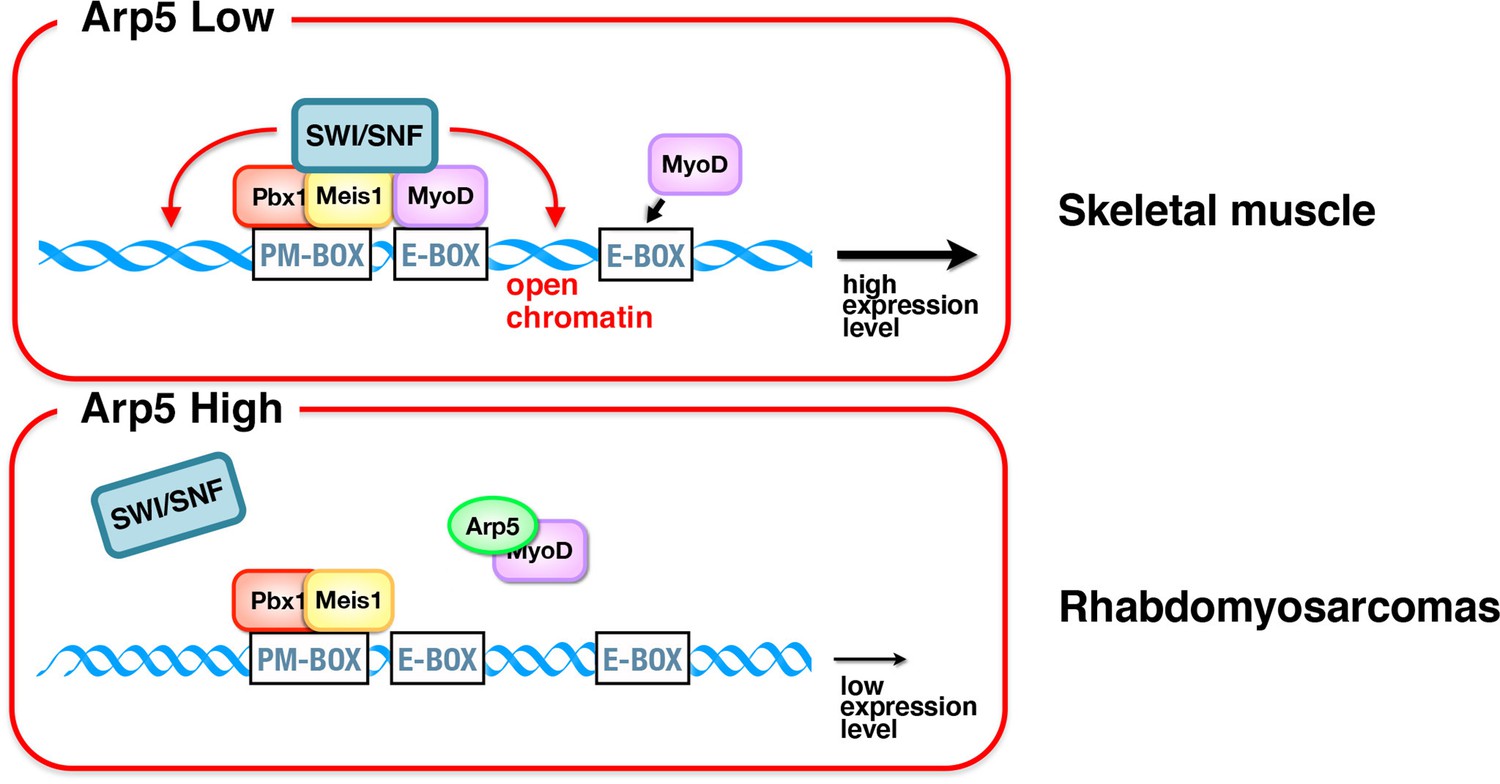
Schematic representation of the role of Arp5 in myogenic gene expression.
In skeletal muscle cells, Pbx1–Meis1 complex binds to PM motif in the enhancer regions of several myogenic genes and recruits MyoD to nearby canonical/noncanonical E-box. Consequently, chromatin remodelers such as Brg1–switch/sucrose nonfermentable (SWI/SNF) were recruited to the Pbx1–Meis1-marked locus, leading to increased chromatin accessibility and further accumulation of MyoD and MyoG in the locus. In rhabdomyosarcomas, abundant Arp5 competitively inhibits the interaction between MyoD and Pbx1–Meis1, reducing the recruitment of chromatin remodelers and the chromatin accessibility, which in turn reduces the transcriptional activity of myogenic genes.
Tables
Table 1
List of PCR primer sequences and short interfering RNA (siRNA) sequences used in this study.
| Real-time RT-PCR | |||
|---|---|---|---|
| Gene name | Species | Forward primer sequence (5'→3') | Anti-sense primer sequence (5'→3') |
| 18srRNA | mouse/human | gtaacccgttgaaccccatt | cccatccaatcggtagtagcg |
| 28srRNA | mouse/human | gcgacctcagatcagacgtg | gggtcttccgtacgccacat |
| rpl13a | mouse/human | tgccgaagatggcggagg | cacagcgtacgaccaccacct |
| actr5 | mouse/human | agcaagccagagacccctga | agcctttgggtacctgtccag |
| myod1 | mouse | ggatggtgtccctggttcttc | cctctggaagaacggcttcg |
| myog | mouse | ggcaatggcactggagttcg | gcacacccagcctgacagac |
| myf6 | mouse | ccagtggccaagtgtttcg | cgctgaagactgctggagg |
| myh1 | mouse | gtcaacaagctgcgggtgaa | ggtcactttcctgcacttggatc |
| myh2 | mouse | ggctgtcccgatgctgtg | cacacaggcgcatgaccaa |
| myh3 | mouse | ctccagcagcgtagagagcg | ctagttgacgactcagctcaccc |
| myh4 | mouse | gtgaagagccgagaggttcacac | ctcctgtcacctctcaacagaaagatg |
| acta1 | mouse | gcactcgcgtctgcgttc | cctgcaaccacagcacgatt |
| tnni1 | mouse | cgacctcccagtagaggttggc | gaaagataggtgagtggggctgg |
| myod1 | human | cccgcgctccaactgctc | cggtggagatgcgctccac |
| myog | human | ggcagtggcactggagttcag | gtgatgctgtccacgatgga |
| myf6 | human | gatttcctgcgcacctgca | cgaaggctactcgaggctgacg |
| cdh15 | human | ctggacatcgccgacttcatc | gagggctgtgtcgtaaggcg |
| mybph | human | aggcatctgtggactgccg | cctcatcacagcctcctccc |
| mylpf | human | gaggatgtgatcaccggagcc | tggtcagcagctcctccagg |
| tnni1 | human | ccatgtctggcatggaaggc | aggagctcagagcgcagcac |
| tnni2 | human | ggacacagagaaggagcggg | cgagtggcctaggactcggactc |
| tnnt2 | human | gcaggagaagttcaagcagcaga | ccggtgactttagccttcccg |
| tnnt3 | human | agaccctgcaccagctggag | cggctcctgagcgtggtgat |
| tnnc2 | human | gacggcgacaagaacaacga | ggtagaggcgactgtccactcc |
| myh3 | human | cgagacttcacctccagcagg | ctgtcctgctccagaagggc |
| myl1 | human | acatcatgtctatctgaatggagctctc | ctggagagtttgtcatgggtgtg |
| myl4 | human | catcatgtcagggtgaagcagagtc | catctcagctcacccagccg |
| hrc | human | cggtctgcgctccaggaag | ccagcatgtctgccagggc |
| atp2a1 | human | tgcaagtcsttgggctcga | ctgtgacacgggctcagagatg |
| ppfia4 | human | gccaaagaagatcatgcctgaag | gccatggctagtcccggaag |
| cdkn1a | human | gctctgctgcaggggacag | gaaatctgtcatgctggtctgcc |
| ChIP assay and DNase I sensitivity assay | |||
| Gene name | Species | Forward primer sequence (5'→3') | Anti-sense primer sequence (5'→3') |
| myog | human | ggccatgcgggagaaagaag | cgctggcatggaaccagag |
| tnni1 | human | gggaagacagatggtctgggc | ggcctatcacctcagaggctg |
| mybph | human | cggagctgatcgggtttcag | gcttcaggccacctgcct |
| ppfia4 | human | gcgtgcctggctccagttac | cagggctgcagctgtcattg |
| Knockdown assay | |||
| Gene name | Species | Target sequence (5'→3') | |
| control | – | MISSION siRNA Universal Negative control (Sigma) | |
| actr5 | mouse | acagatggaccagtttcac | |
| actr5 | human | cctggcatgaaagccagaa | |
| ino80c (ies6) | human | actgcggttcagcaccatt | |
| ino80 | human | agcagctgccctacgggca | |
Additional files
Download links
A two-part list of links to download the article, or parts of the article, in various formats.
Downloads (link to download the article as PDF)
Open citations (links to open the citations from this article in various online reference manager services)
Cite this article (links to download the citations from this article in formats compatible with various reference manager tools)
Actin-related protein 5 functions as a novel modulator of MyoD and MyoG in skeletal muscle and in rhabdomyosarcoma
eLife 11:e77746.
https://doi.org/10.7554/eLife.77746


