Comprehensive analysis of the human ESCRT-III-MIT domain interactome reveals new cofactors for cytokinetic abscission
- Department of Biochemistry, University of Utah School of Medicine, United States
- Department of Oncological Sciences, Huntsman Cancer Institute, University of Utah, United States
Figures
Figure 1
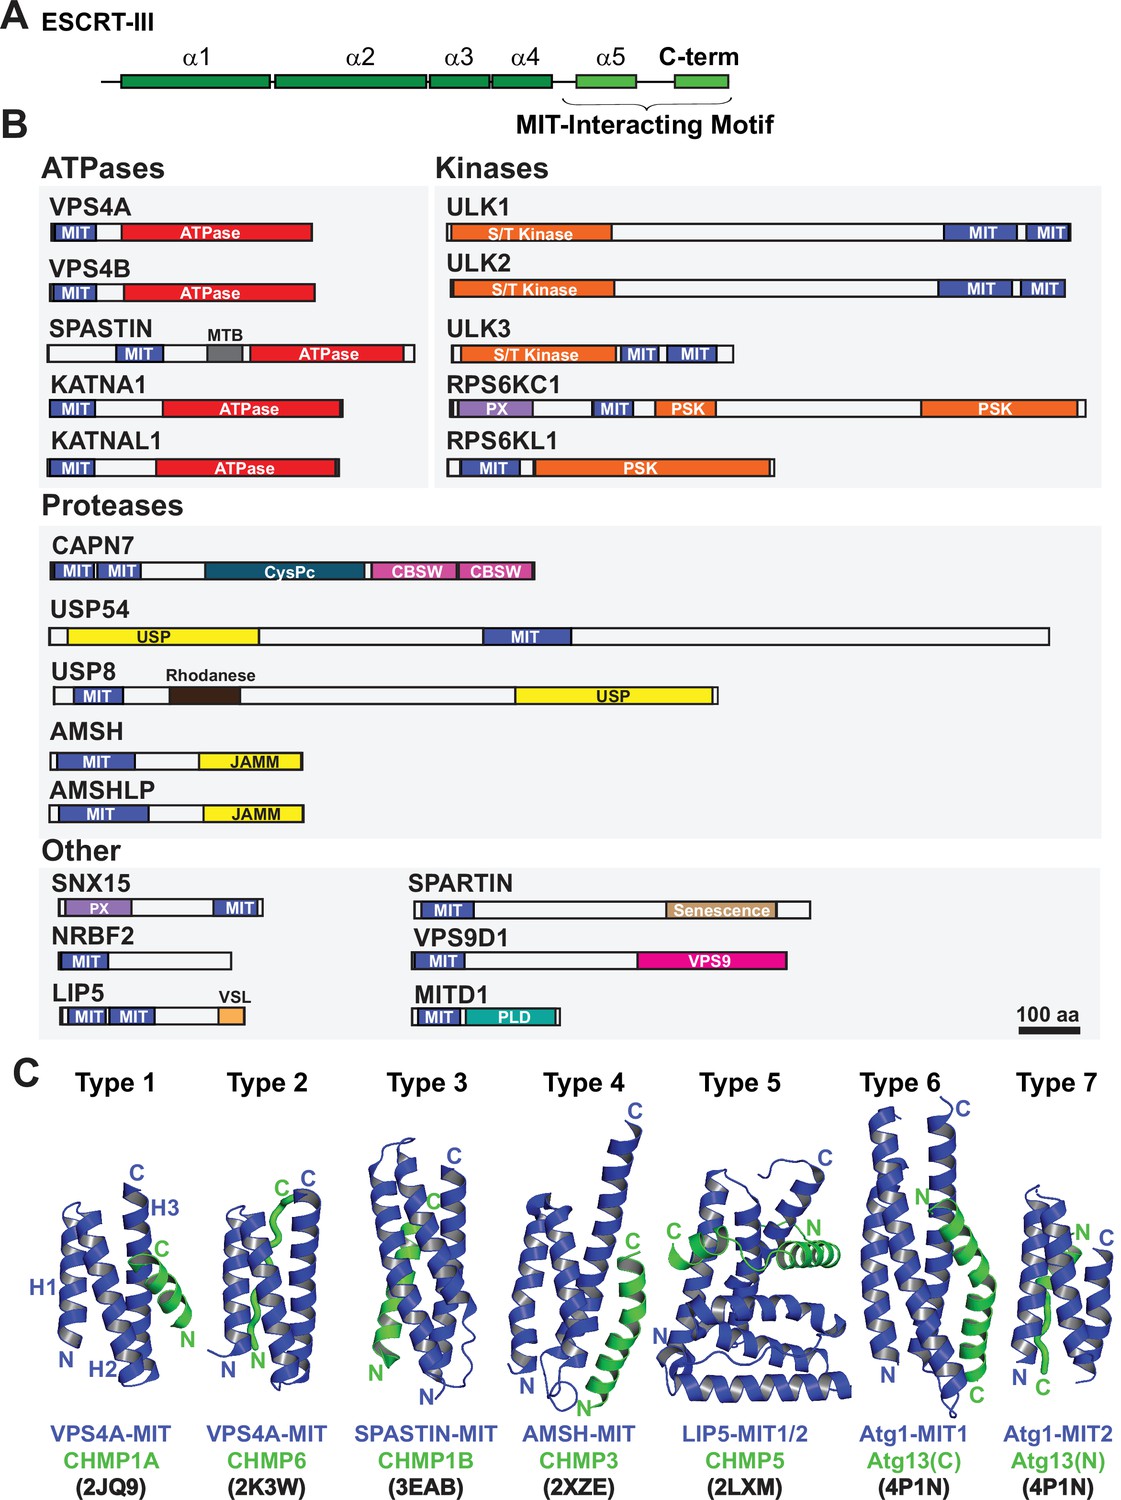
Domain organization of ESCRT-III and MIT domain-containing proteins.
(A) Generalized ESCRT-III schematic, depicting the conserved helical core domain and the variable C-terminal tail that contains MIT-interacting Motif (MIM) elements. (B) Human proteins with MIT domains, grouped by enzymatic categories. Three dimensional structures (PDB IDs in parenthesis) are available for the MIT domains from human VPS4A (1YXR, 2JQ9, 2K3W), VPS4B (2JQH, 2JQK, 4U7Y, 1WRO, 2CPT), SPASTIN (3EAB), USP8 (2A9U), AMSH (2XZE), NRBF2 (4ZEY), LIP5 (2LXL, 2LXM, 4TXP, 4TXQ, 4TXR, 4U7E), SPARTIN (4U7I), MITD1 (4A5X), and ULK3 MIT2 (4WZX). Abbreviations: MIT, Microtubule Interacting and Trafficking; MTB, Microtubule Binding Domain; S/T Kinase, Serine/Threonine Kinase domain; PSK, Pseudokinase domain; PX, Phosphoinositide binding domain; CysPc, Calpain protease domain; USP, Ubiquitin Specific Protease Domain; PLD, Phospholipase D-like domain; VSL, Vta1-SBP1-LIP5 domain; JAMM, JAB1/MPN/Mov34 metalloenzyme domain; CBSW, calpain-type beta-sandwich domain. (C) Gallery showing the different types of binding interactions formed between MIT domains (blue) and MIM elements (green). For clarity, the three helix bundles of the different MIT domains are shown in approximately equivalent orientations. Type 1 interaction: a helical MIM binds in the groove between MIT helices 2 and 3 (H2/H3 groove), and is oriented parallel to MIT helix 3. Type 2 interaction: the MIM forms an extended strand that binds in the MIT H1/H3 groove, parallel to MIT helix 3. Type 3 interaction: a helical MIM binds in the MIT H1/3 groove, parallel to MIT helix 3. Type 4 interaction: Similar to Type 1, except that the longer MIM helix binds lower in the H2/H3 groove and interacts with the H2/H3 loop. Type 5 interaction: Two MIM helices and adjacent linkers wrap nearly completely around the MIT domain. Type 6 interaction: a mixed helix/strand MIM element binds in the MIT H1/3 groove, antiparallel to MIT helix 3. Type 7 interaction: a helical MIM element binds in the MIT 2/3 groove, antiparallel to helix 3. The specific complexes shown in the figure are labeled below, together with their PDB accession codes.
Figure 2 with 6 supplements
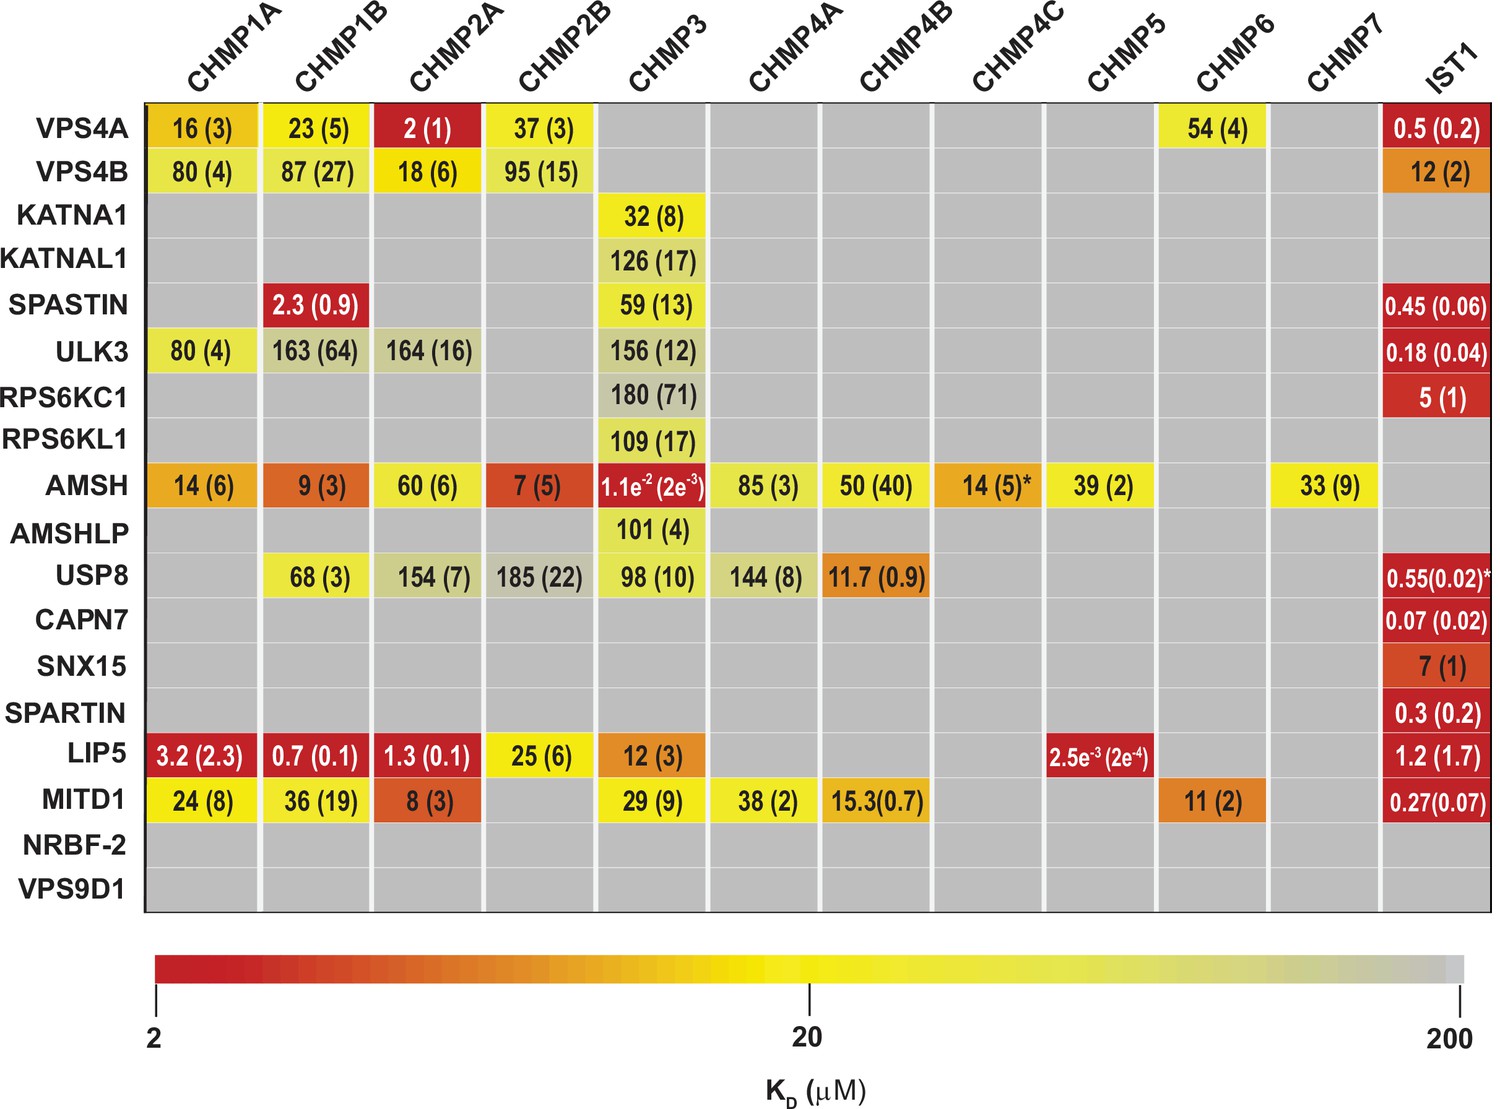
ESCRT-III-MIT domain interaction network.
Equilibrium dissociation constants (μM) for pairwise binding interactions are displayed for each ESCRT-III-MIT pair and are reported as averages of at least three independent measurements. Values in parenthesis denote ± standard deviation. Interactions are color-coded based on strength of measured binding affinity (see key bar). Asterisks denote KI values that were determined from competition experiments (see Materials and methods and Figure 2—figure supplement 5B-E). Binding constants for ULK3(MIT)2 and IST1 are from Caballe et al., 2015, but were measured in the same fashion as the other interactions and are reproduced here for comparison.
Figure 2—figure supplement 1
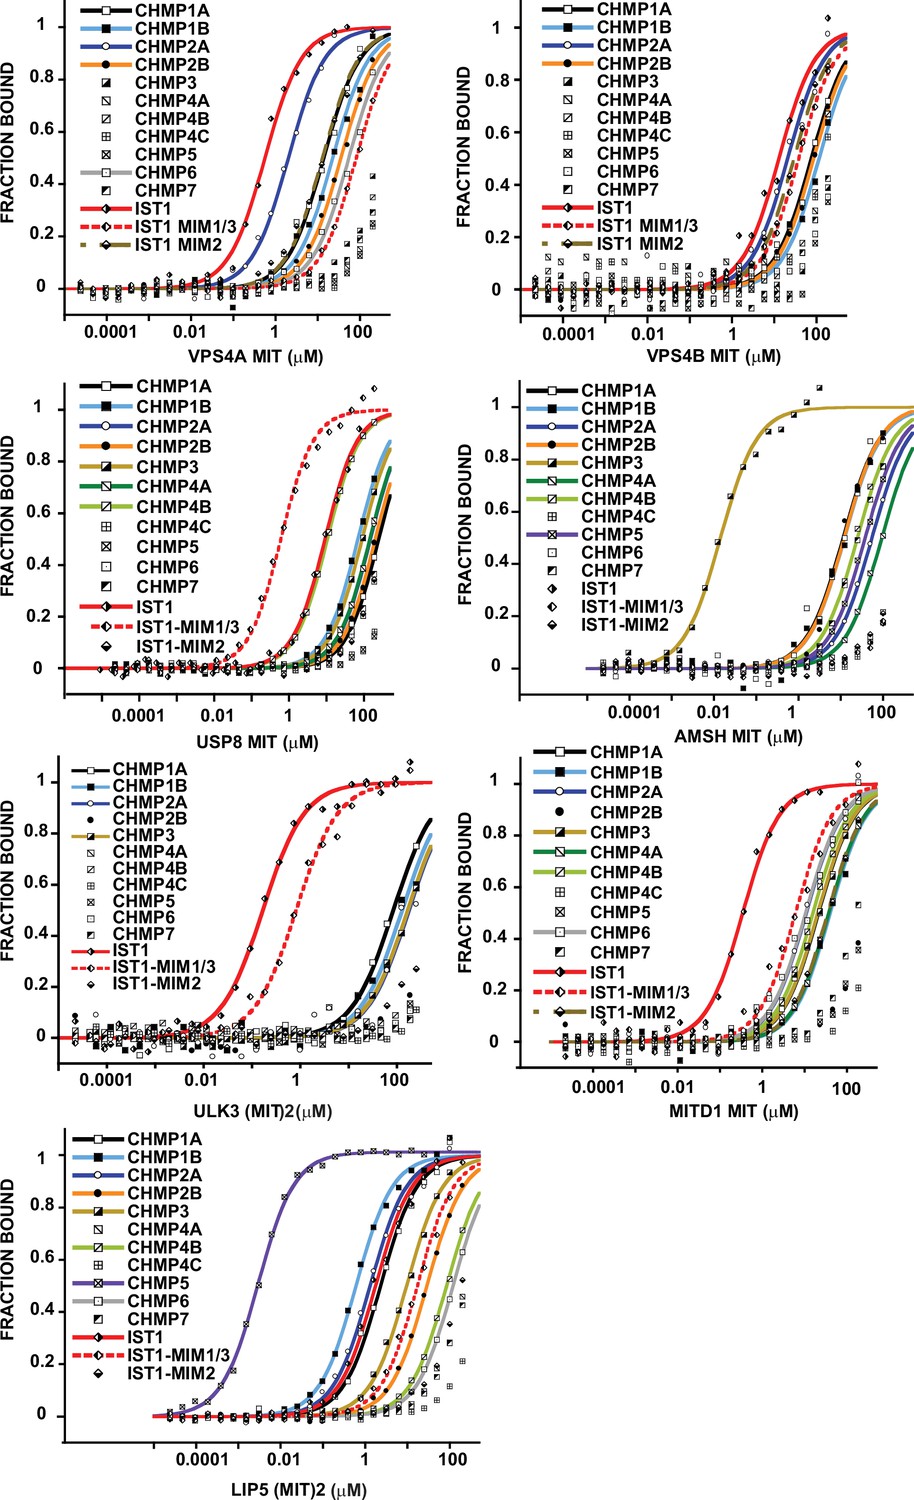
Binding isotherms for MIT domains that bind promiscuously to ESCRT-III protein tails.
Representative binding curves for pairwise interactions between MIT domains and ESCRT-III C-terminal tails. Binding isotherms with KD <200 μM are fit with colored curves. Data points for weak and non-binders (KD >200 μM) are plotted in black and white but not fit. Data for ULK3(MIT)2 and IST1, IST1344-366, IST1-MIM316-343 are from Caballe et al., 2015, but are reproduced here for comparison.
Figure 2—figure supplement 2
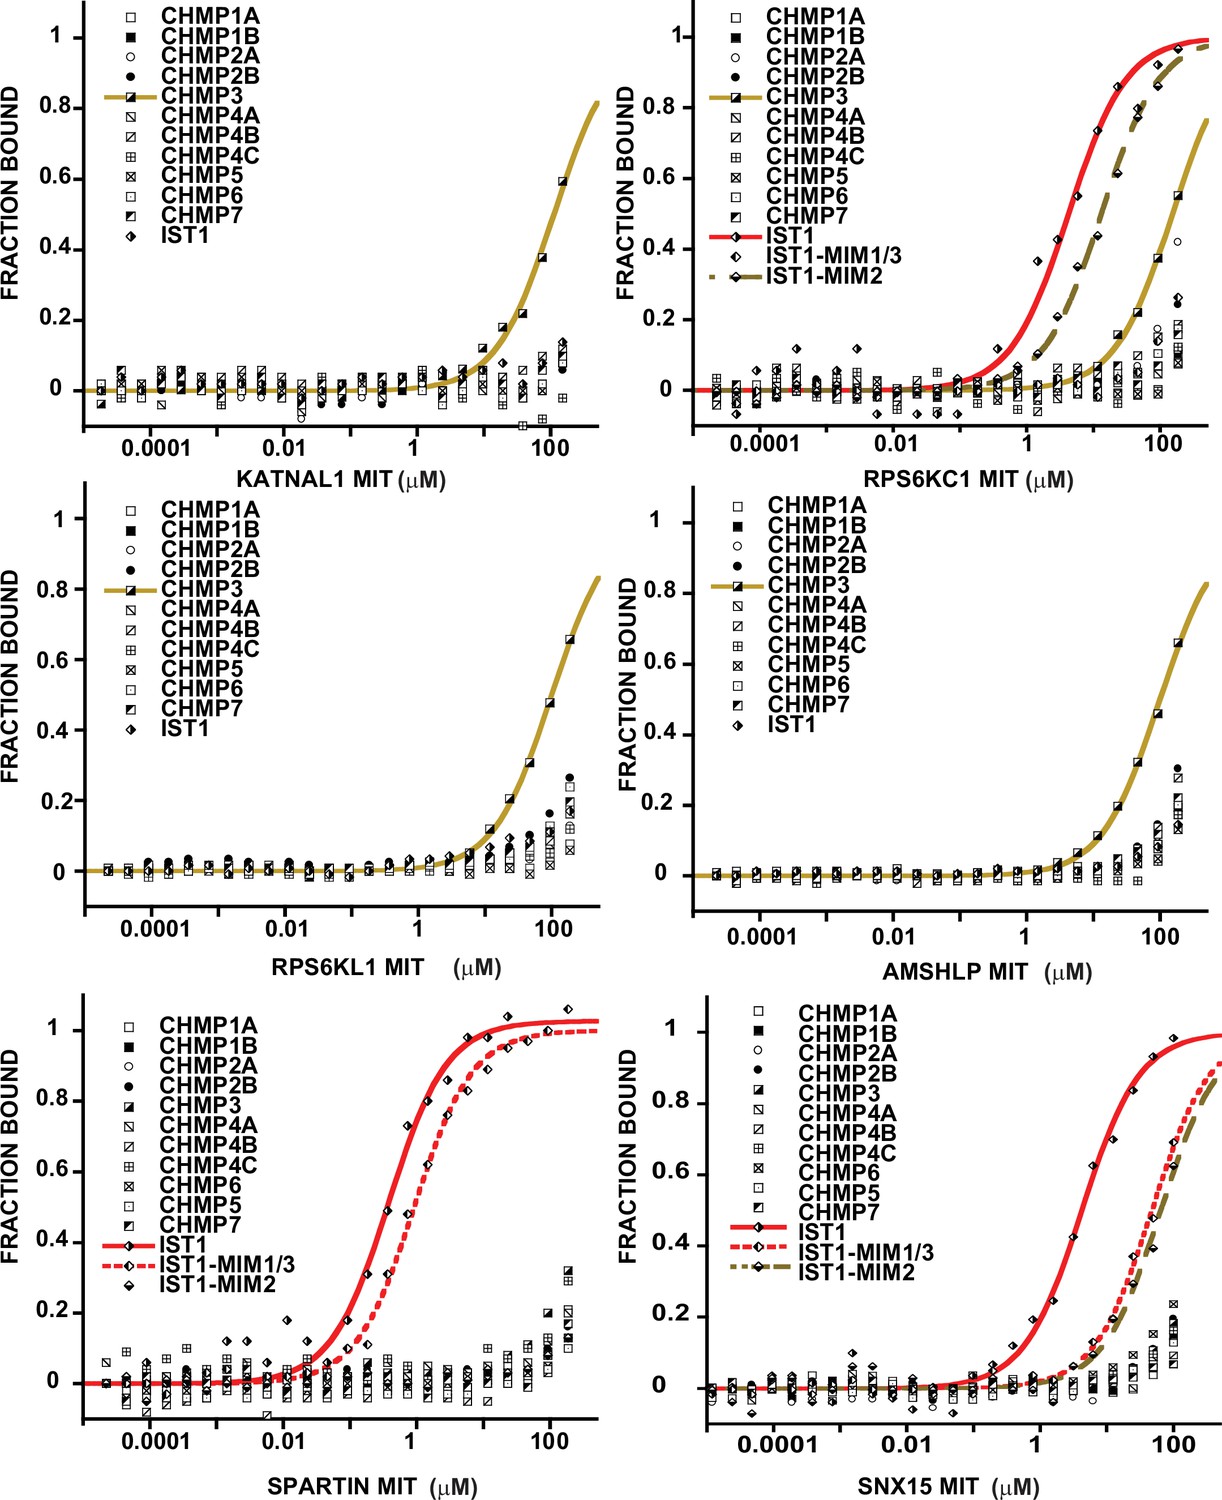
Binding isotherms for MIT domains that bind specifically to ≤3 different ESCRT-III tails.
Representative binding curves for pairwise interactions between MIT domains and ESCRT-III C-terminal tails. Binding isotherms with KD <200 μM are fit with colored curves. Data points for weak and non-binders (KD >200 μM) are plotted in black and white but not fit. Binding curves for SPASTIN, KATNA1, and CAPN7 are shown in Figure 3A.
Figure 2—figure supplement 3
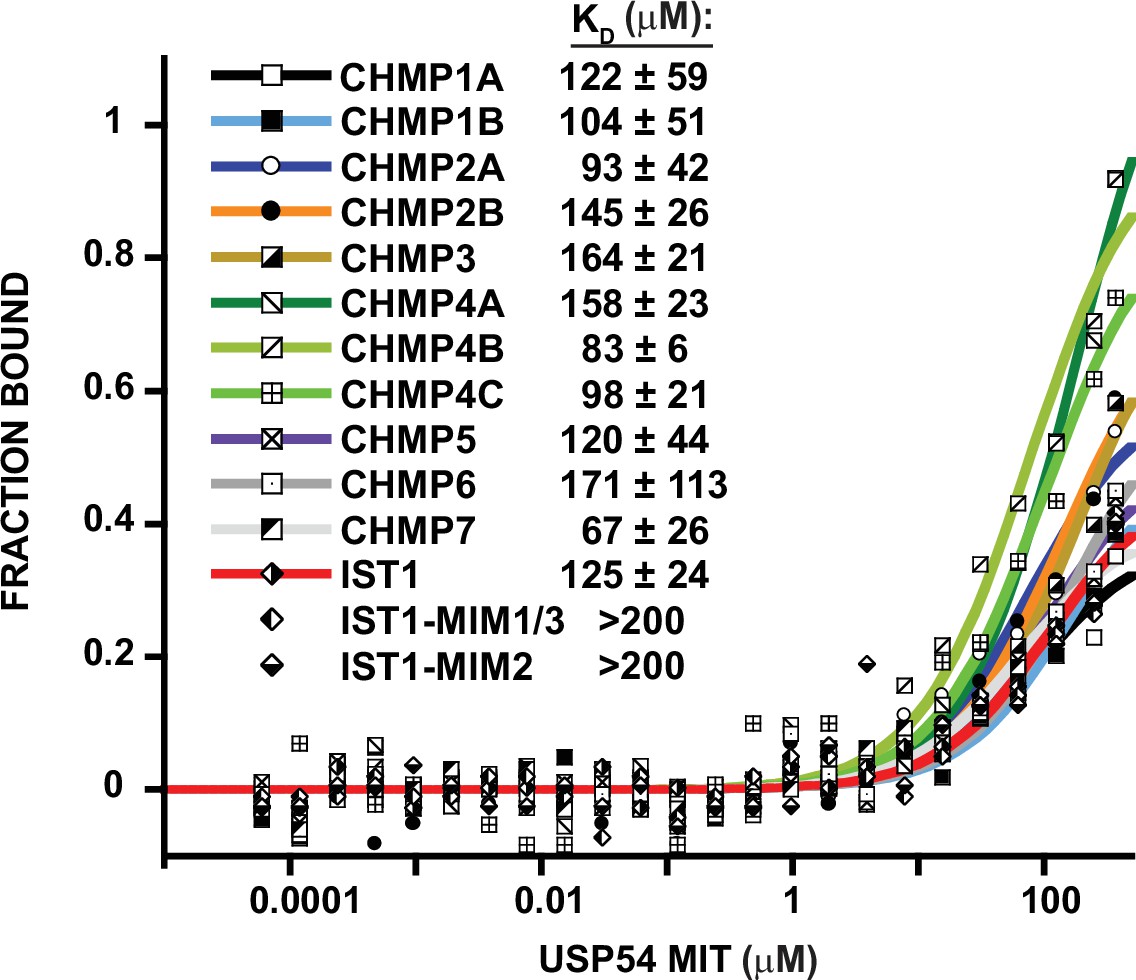
USP54 MIT binds weakly to all ESCRT-III C-terminal tails.
Representative binding curves for pairwise interactions between USP54 MIT and ESCRT-III C-terminal tails. Binding isotherms with KD <200 μM are fit with colored curves, whereas non and weak binders (KD >200 μM) are plotted as black and white points but not fit. Dissociation constants shown are averages calculated from three independent experiments ± standard deviation.
Figure 2—figure supplement 4
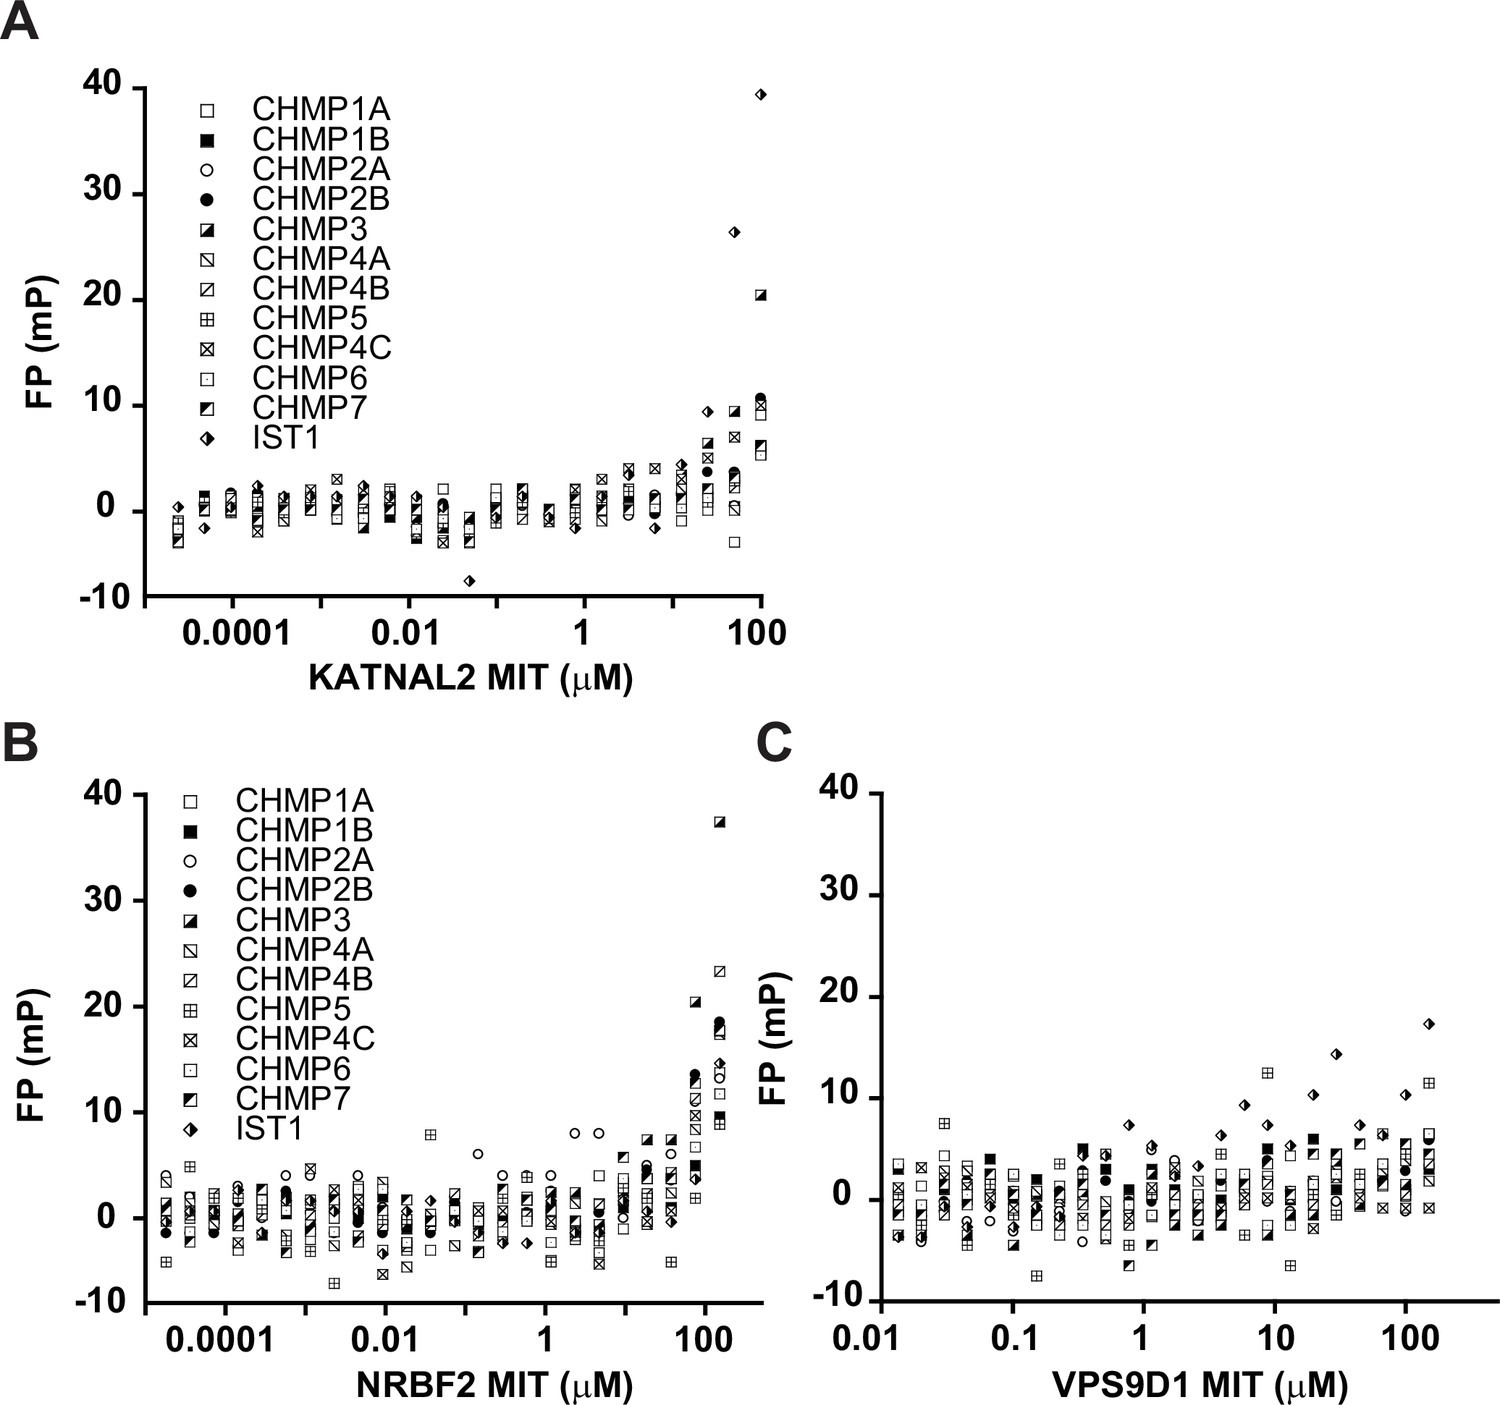
Raw binding data for MIT domains that do not bind any ESCRT-III tails.
Representative raw FP values for pairwise interactions between ESCRT-III C-terminal tails and MIT domains are shown for KATNAL2 (A), NRBF2 (B), and VPS9D1 (C).
Figure 2—figure supplement 5
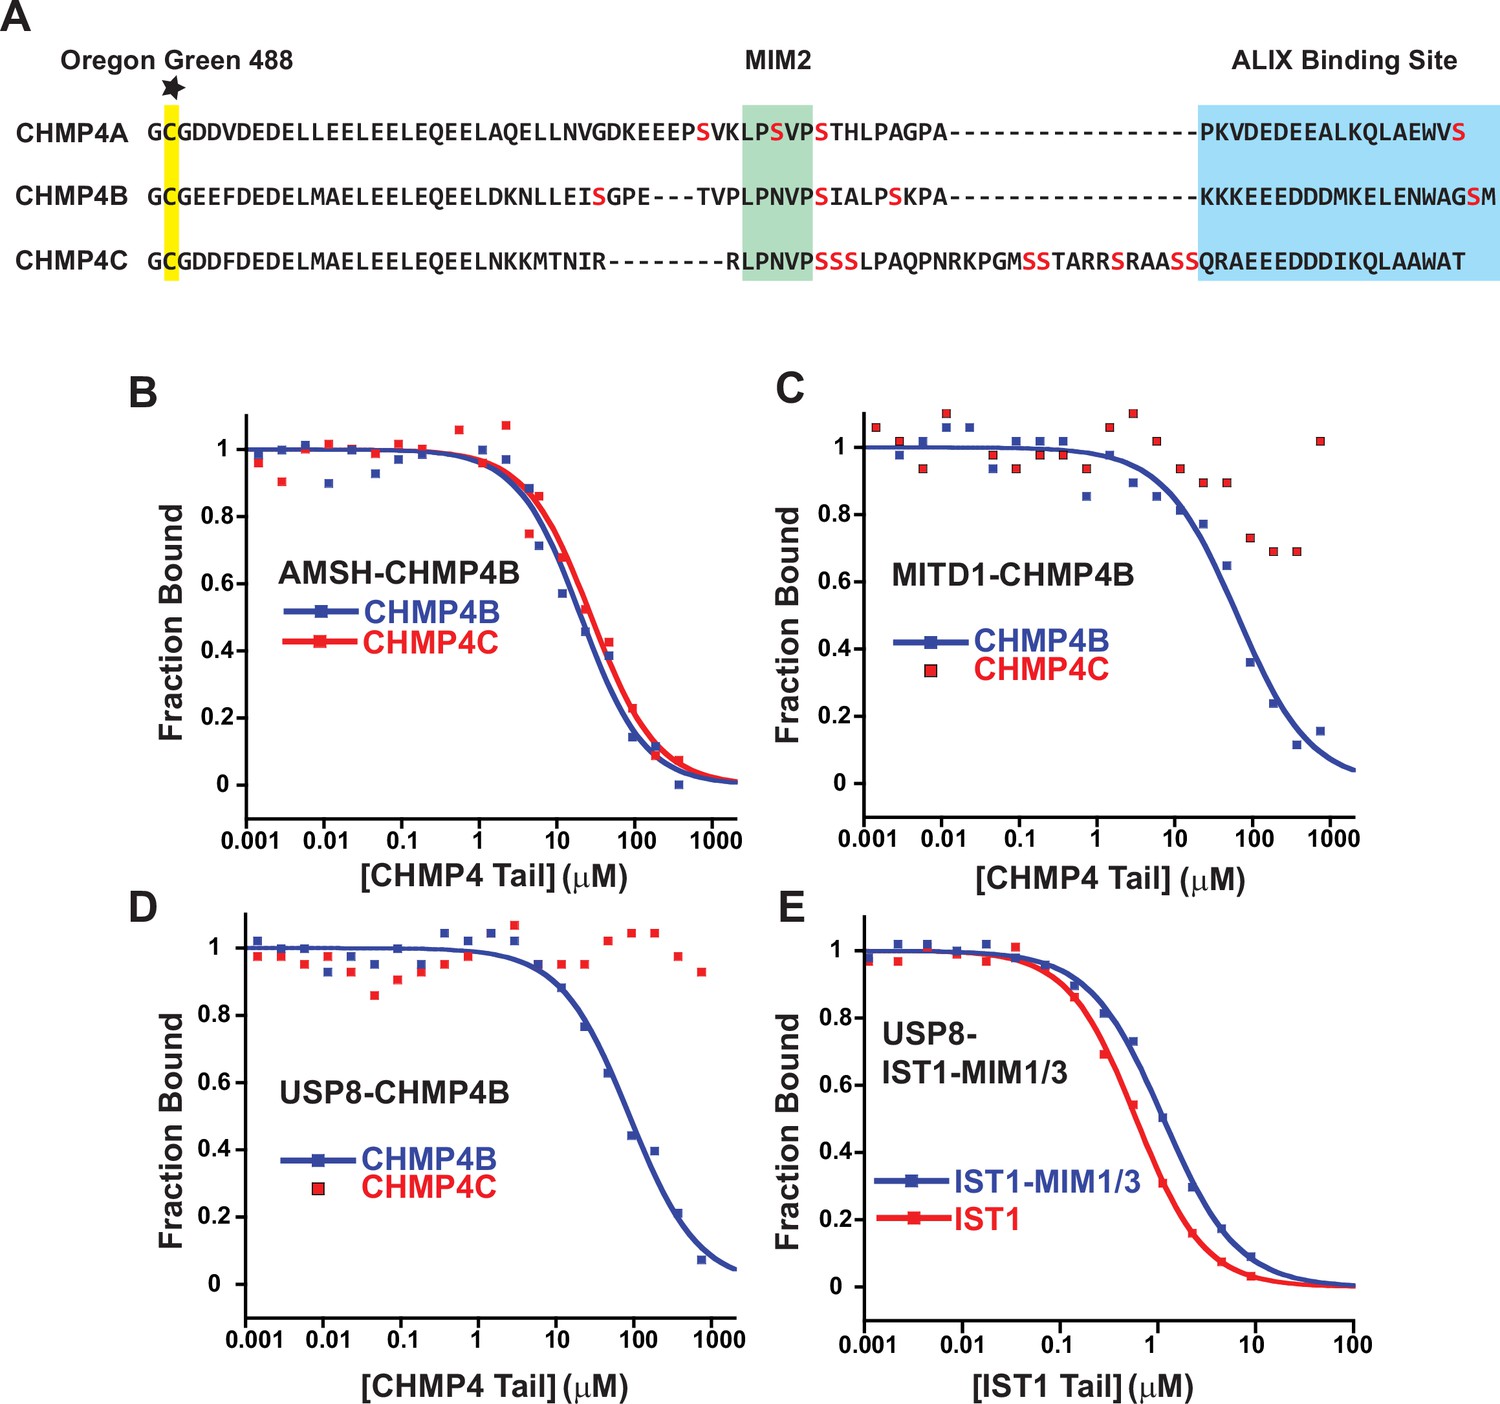
Competitive binding analyses of CHMP4C tails binding to MIT domains.
(A) Comparison of the C-terminal peptides from different CHMP4 paralogs. Serines are colored red to highlight the unique CHMP4C insert residing between the MIM2 sequence and the ALIX binding site, suggesting that this tail might be unusually flexible and reduce fluorescence polarization anisotropy in CHMP4C-bound complexes, leading to false negative results. The cysteine attachment for the Oregon Green 488 maleimide is highlighted yellow. (B) Fluorescence polarization anisotropy competition assay. Fluorescently labeled CHMP4B peptide in complex with the MIT domain from AMSH was titrated with unlabeled CHMP4B or CHMP4C peptides. Representative curves are shown here and throughout. (C) Same experiment as in B, except with the MITD1 MIT domain. (D) Same experiment as in B, except with the USP8 MIT domain. (E) Same experiment as in B except that the labeled peptide is IST1-MIM344-366 and the unlabeled peptides are IST1 (both MIM elements) and IST1-MIM344-366 (positive control).
Figure 2—figure supplement 6
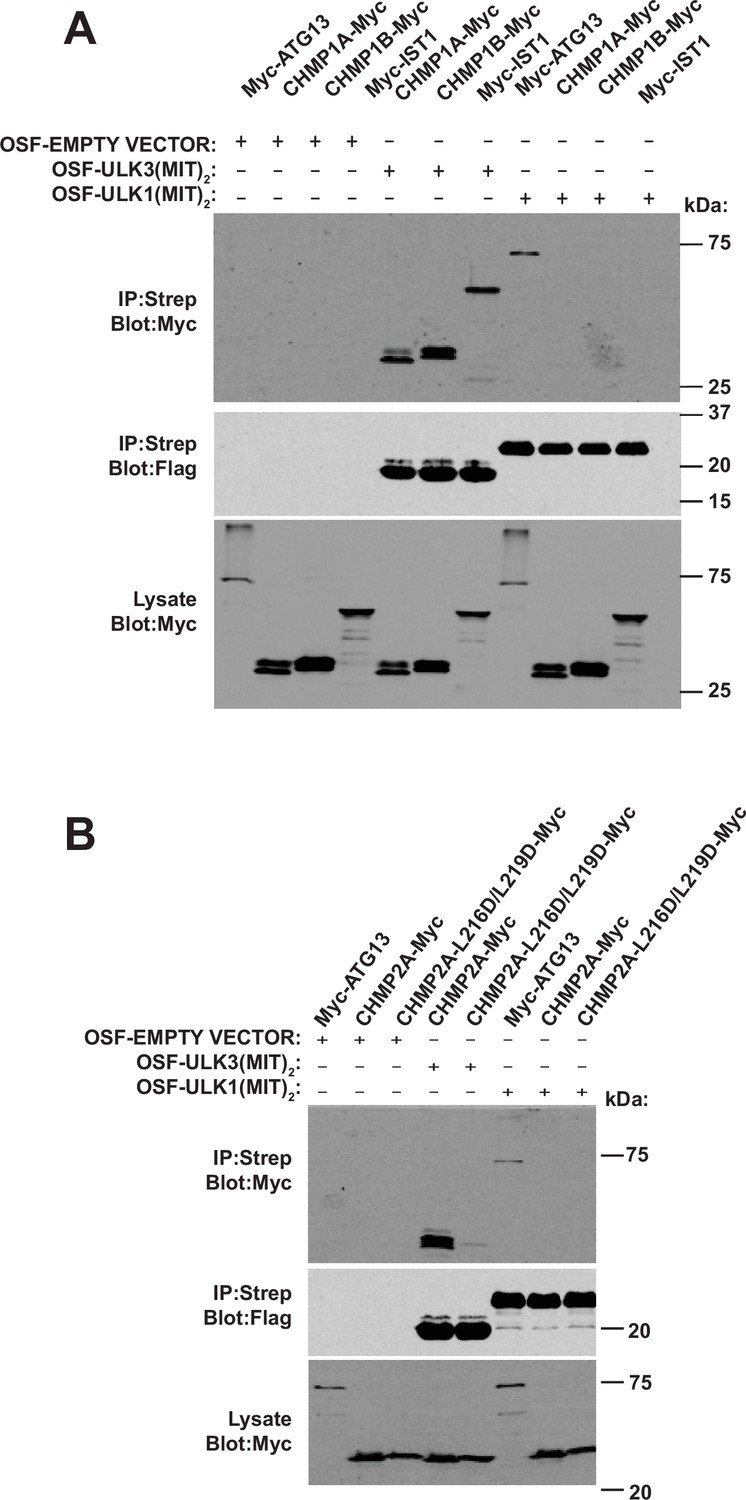
ESCRT-III binding is not conserved across ULK family members.
(A) HEK 293T cells were co-transfected with constructs encoding One-Strep-Flag (OSF) ULK3(MIT)2 or ULK1(MIT)2 and the indicated Myc-tagged proteins. OSF-tagged proteins were bound to Strep-Tactin resin, and co-precipitating Myc-tagged proteins were detected by probing with α-Myc antibody. (B) Lysates from 293T cells overexpressing Myc-CHMP2A constructs were mixed with lysates from cells overexpressing OSF-ULK3(MIT)2 or OSF-ULK1(MIT)2. OSF-ULK proteins were bound to Strep-Tactin resin, and co-precipitating Myc-tagged proteins were detected with α-Myc antibody.
-
Figure 2—figure supplement 6—source data 1
Annotated uncropped western blots and raw images for Figure 2—figure supplement 6A and B.
- https://cdn.elifesciences.org/articles/77779/elife-77779-fig2-figsupp6-data1-v1.zip
Figure 3
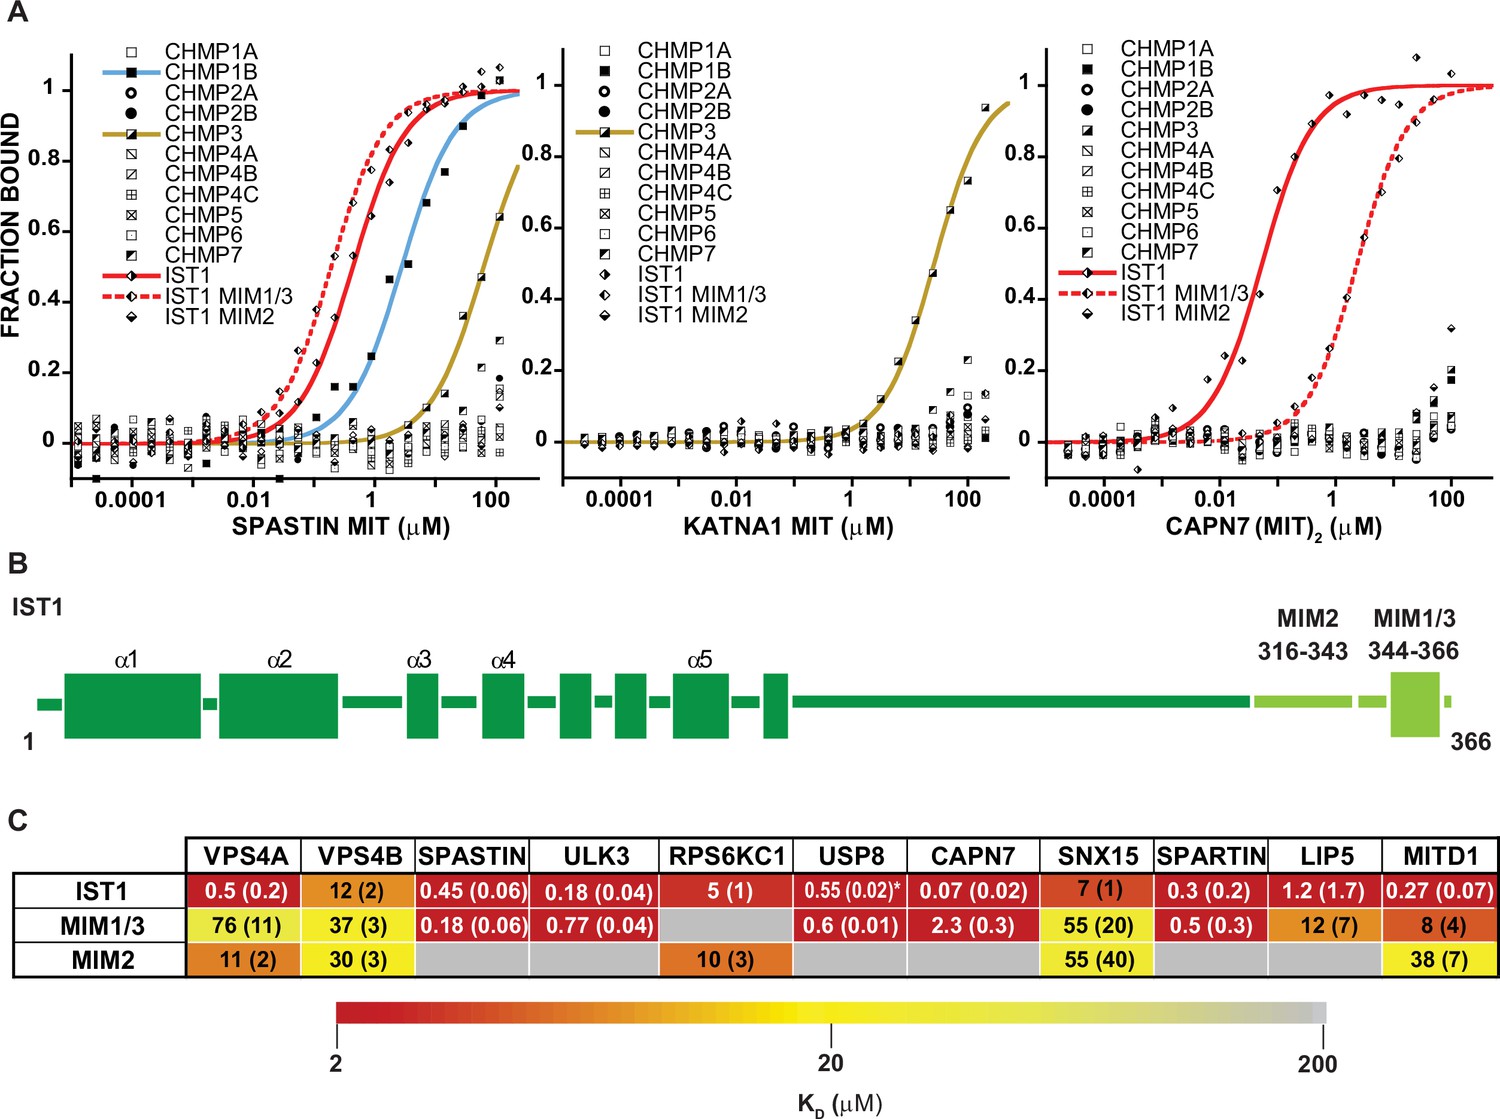
MIT-MIM Binding Interactions of SPASTIN, KATNA1 and CAPN7 and IST1.
(A) Binding isotherms from human ESCRT-III C-terminal tails and the MIT domains from SPASTIN (left), KATNA1 (middle), and CAPN7 (right). Representative binding data are shown for each ESCRT-III-MIT pairwise binding interaction. Binding isotherms with KD <200 µM are fit with colored curves. Weak and non-binders (KD >200 µM) are plotted as black and white points. (B) Domain schematic of the ESCRT-III protein IST1 showing the position of the Type 2, MIM316-343 and Type 1/3, MIM344-366 elements within the full-length protein. Data for the ‘IST1’ peptide encompasses residues 316–366. (C) Dissociation constants for MIM344-366 and MIM316-343 peptides with IST1-binding MIT domains. Dissociation constants shown are averages calculated from at least three independent experiments with standard deviation reported in parentheses. Interactions are color-coded based on strength of measured binding affinity (see key bar). Asterisk denotes KI values determined from competition experiments (see Materials and methods and Figure 2—figure supplement 5E). Binding data for ULK3(MIT)2 and IST1, IST1-MIM344-366 and IST1-MIM316-366 are from Caballe et al., 2015, but are reproduced here for comparison.
Figure 4 with 2 supplements
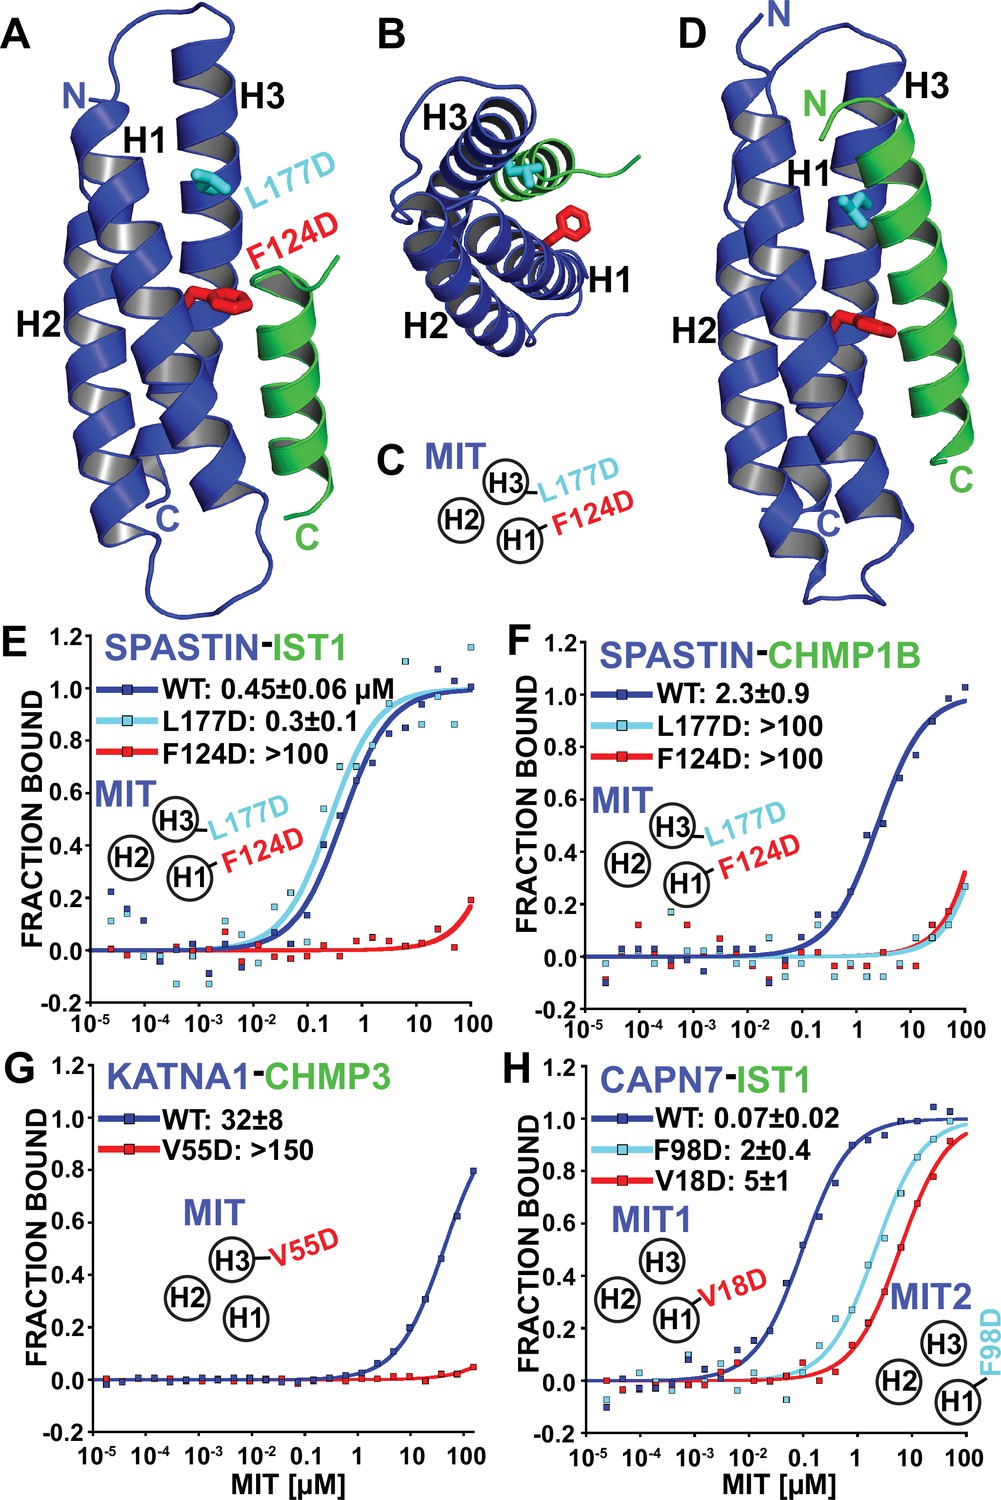
Identification of MIT-MIM binding mutants.
(A and B) Two orientations of the SPASTIN MIT-IST1 Type 3 structure (PDB 7S7J) displaying the locations of binding mutants (stick representation). See Figure 4—figure supplement 1A and B, for a detailed view of the interface and Supplementary file 3 for data collection and structure refinement statistics. (C) Cartoon depicting the positions of mutation sites in the SPASTIN MIT H1/H3 groove. (D) SPASTIN-CHMP1B structure (PDB 3EAB) showing the location of binding mutants (stick representation). See , Figure 4—figure supplement 1C for an overlay of both SPASTIN structures. (E–G) Binding isotherms for WT and mutant MIT domains with the designated MIM elements. (E) SPASTIN-IST1. (F) SPASTIN-CHMP1B. (G) KATNA1-CHMP3, and (H) CAPN7-IST1. For E and H, binding was measured using IST1 peptides composed of both MIM elements (residues 316–366). MIT groove binding cartoons within the figures show locations of mutations in the relevant MIT domain. See also Figure 4—figure supplement 2 for binding isotherms for WT and mutant SPASTIN MIT domains with the CHMP3 MIM element.
Figure 4—figure supplement 1

Analysis of SPASTIN-IST1 complex and comparisons with SPASTIN-CHMP1B and SPARTIN-IST1.
(A) Fo-Fc IST1 omit map contoured at 3σ overlaid with the SPASTIN-IST1 structure (left) and expanded view (right) highlighting the omit map quality. SPASTIN and IST1 are shown in blue and green respectively. Four hydrophobic IST1 residues, F352, L355, F359, and L362 are shown binding in the H1/H3 groove of the SPASTIN MIT domain. (B) SPASTIN-IST1 interface details. The interface buries 1400 Å2 of surface area over 32 residues from both faces and is further stabilized with four hydrogen bonds and seven salt bridges. SPASTIN side chains with significant buried surface area are colored olive for contrast. Left shows full structure and right shows an expanded view. Salt bridges and hydrogen bonds are indicated with dotted lines. The SPASTIN intramolecular salt bridge D134-R191 is shown with olive sticks. (C) Overlay of SPASTIN-CHMP1B (PDB 3EAB, SPASTIN cartoon shown gray and CHMP1B yellow) with SPASTIN-IST1 (PDB 7S7J, SPASTIN cartoon shown blue and IST1 green), highlighting similar overlay of four prominent ESCRT-III hydrophobic side chains buried in the H1/H3 binding groove, a small shift in helical register between IST1 and CHMP1B, and an expanded H1/H3 groove in CHMP1B complex (compare the N-terminal region of SPASTIN H3 demarked by residue E169). (D) Overlay of SPASTIN-IST1 complex (PDB 7S7J, SPASTIN cartoon shown dark blue and IST1 shown green) and SPARTIN-IST1 complex (PDB 4UI, SPARTIN shown gray cartoon and IST1 shown dark green) exhibit nearly identical structures.
Figure 4—figure supplement 2
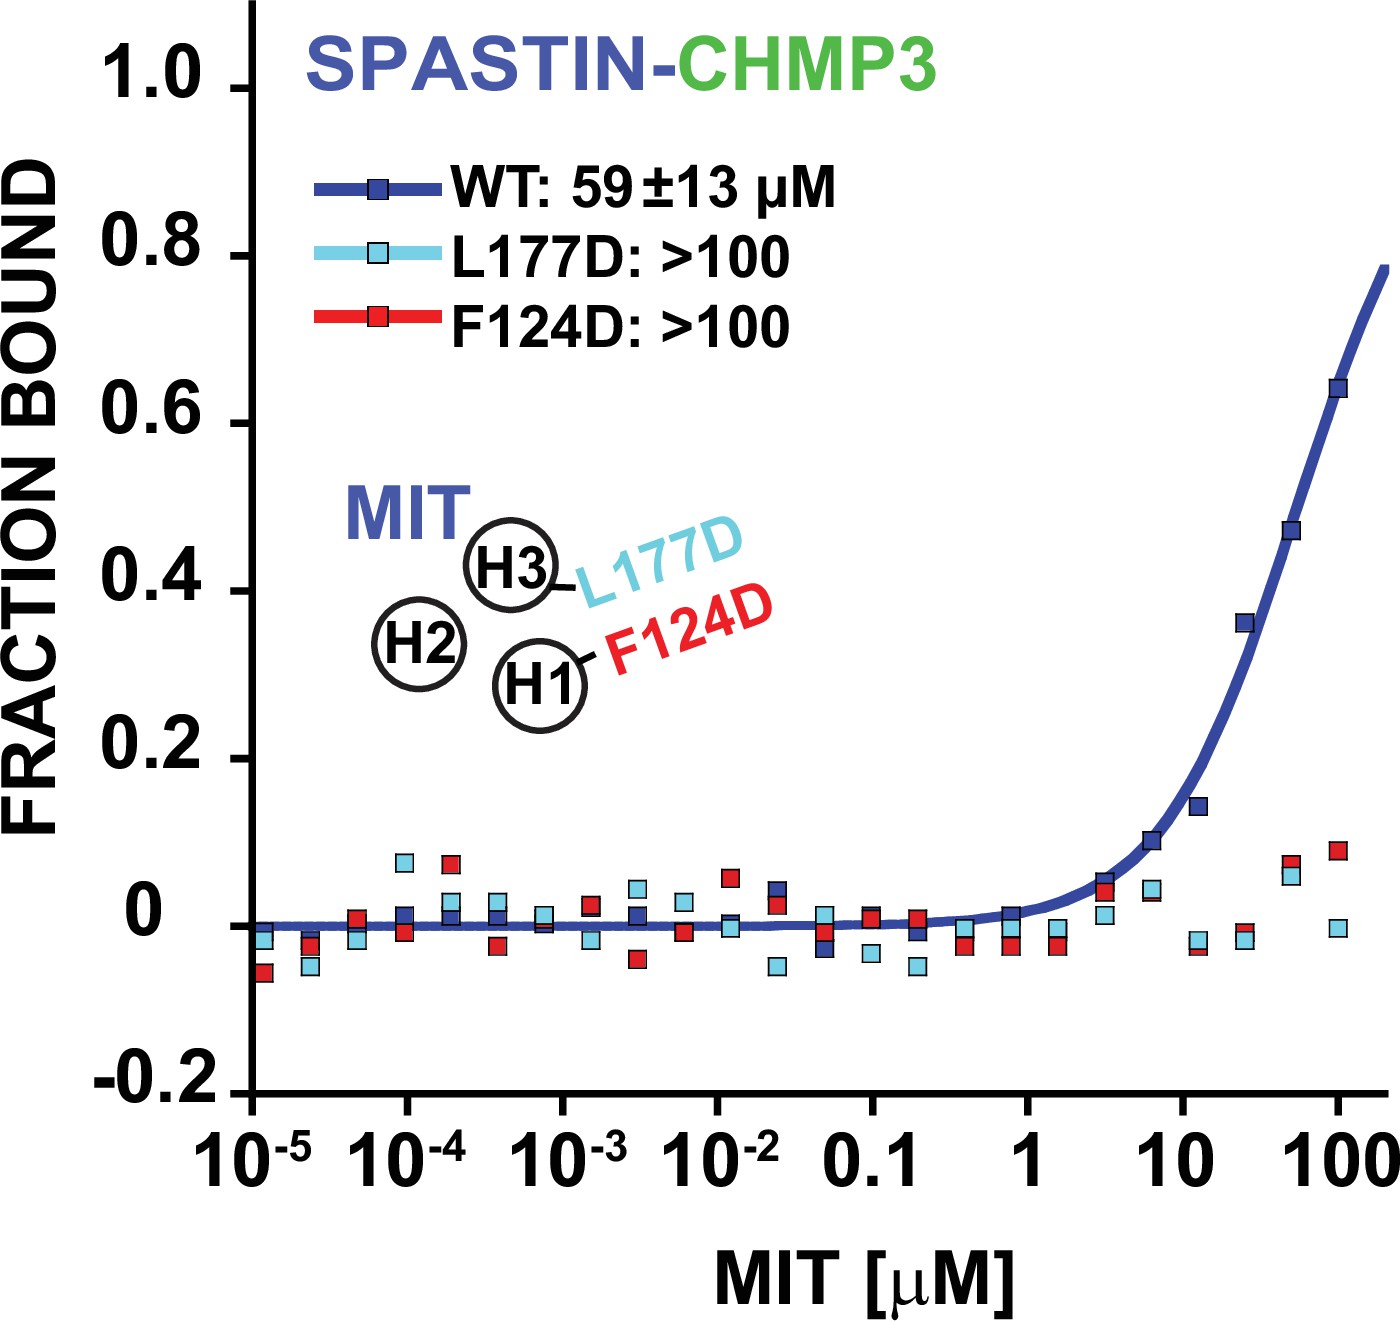
Binding isotherms for WT and mutant SPASTIN MIT domains with the CHMP3 MIM element.
Cartoon inset depicts the position of the groove mutations. Both H1-H3 groove mutations disrupt CHMP3 binding.
Figure 5 with 1 supplement
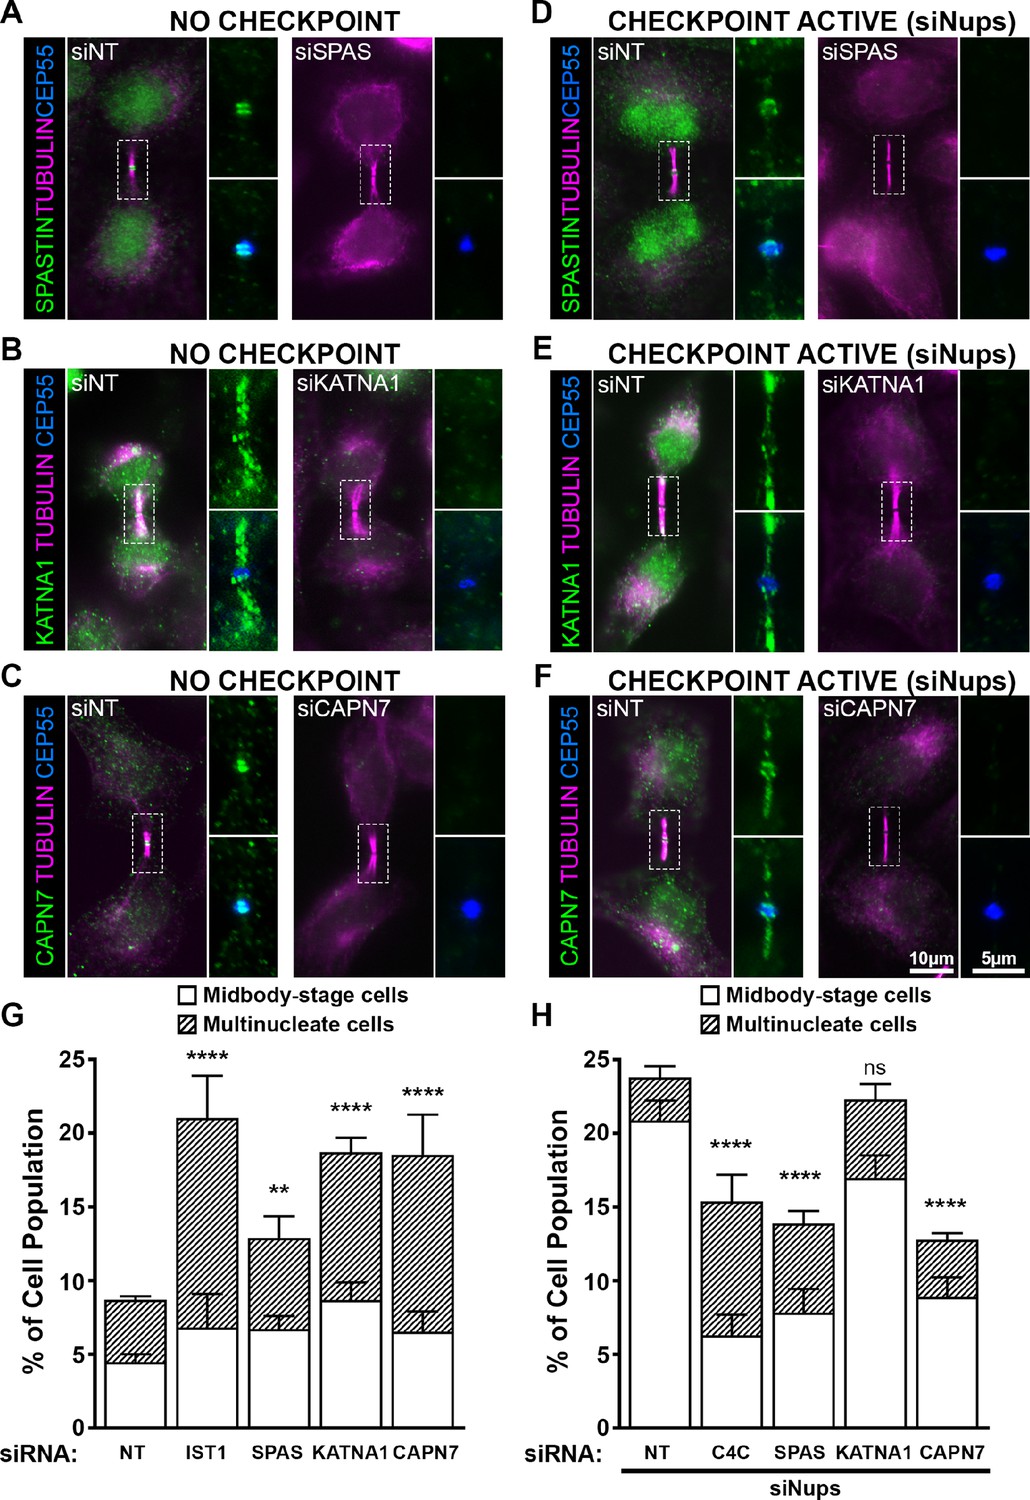
ESCRT-III-interacting proteins SPASTIN, KATNA1, and CAPN7 are recruited to the midbody and are differentially required for abscission and maintenance of the abscission checkpoint.
Immunofluorescence images of SPASTIN (A, D), KATNA1 (B, E), and CAPN7 (C, F) after treatment with the indicated siRNAs. Checkpoint Active samples (D–F) were generated by additional treatment with siNups combined with a thymidine synchronization/release. Antibodies specific for α-TUBULIN and CEP55 were used to identify midbody-stage cells and the Flemming body, respectively. Enlargements of selected regions are shown at the right of each image, with the target protein shown alone (top) or together with CEP55 (bottom). (G, H) Quantification of abscission defects (midbody-stage cells and multinucleate cells) under asynchronous conditions (G) or with a sustained abscission checkpoint (H). Bars represent the average and standard deviation from n=5 independent experiments where N>500 cells were counted per experiment. Statistical analysis was performed using ANOVA, comparing total abscission defects (Midbody-stage cells + Multinucleate cells) after each individual siRNA treatment to siNT. ****p<0.0001, ***p<0.0005, **p<0.02, ns = not significant.
Figure 5—figure supplement 1
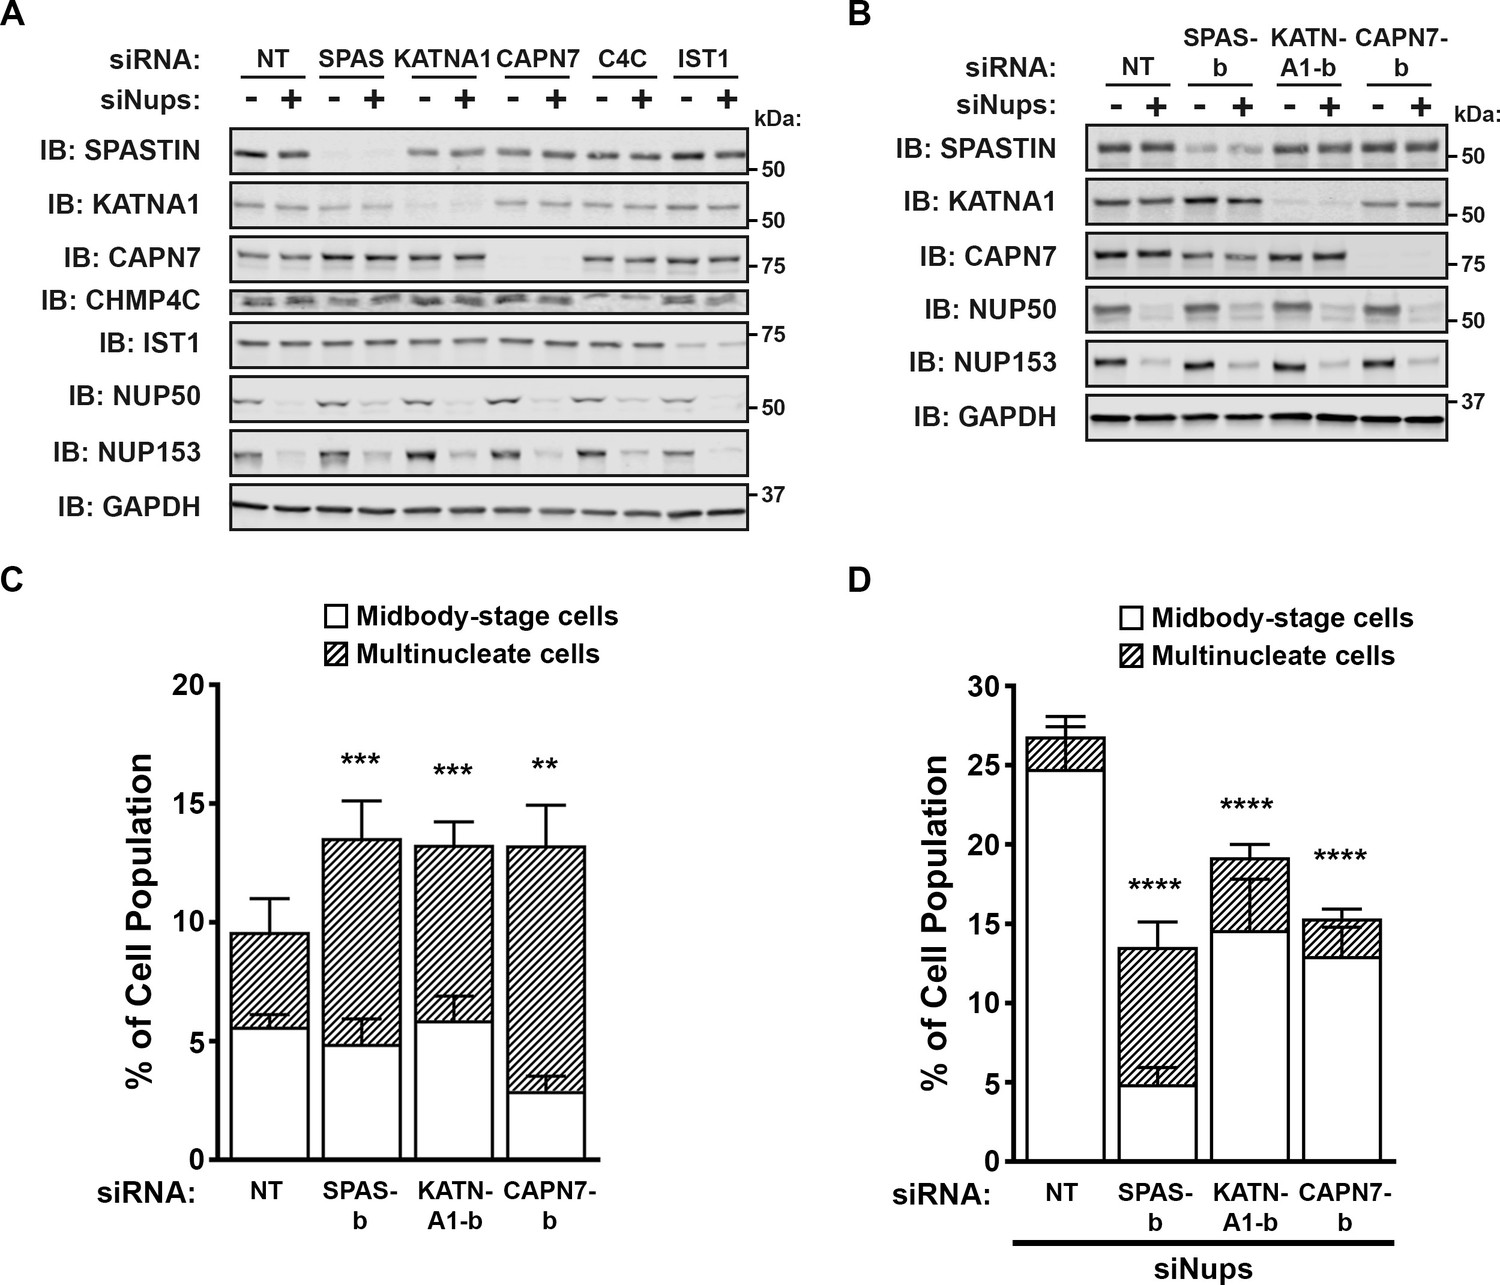
Confirmation of the efficiency and specificity of protein depletion by siRNA treatments.
(A) Western blots from experiments in Figure 5. (B) Western blots using a second, independent siRNA for SPASTIN (SPAS-b), KATNA1 (KATNA1-b), and CAPN7 (CAPN7-b). (C, D) Quantification of abscission defects (midbody-stage cells and multinucleate cells) under asynchronous conditions (C) or with a sustained abscission checkpoint (D), following treatment with the indicated siRNAs. Bars represent the average and standard deviation from five independent experiments where >500 cells were counted per experiment. Statistical analysis was performed using ANOVA, comparing total abscission defects (Midbody-stage cells + Multinucleate cells) after each individual siRNA treatment to siNT. ****p<0.0001, ***p<0.0005, **p<0.005, ns = not significant.
-
Figure 5—figure supplement 1—source data 1
Annotated uncropped western blots and raw images for Figure 5—figure supplement 1A and B.
- https://cdn.elifesciences.org/articles/77779/elife-77779-fig5-figsupp1-data1-v1.zip
Figure 6 with 2 supplements
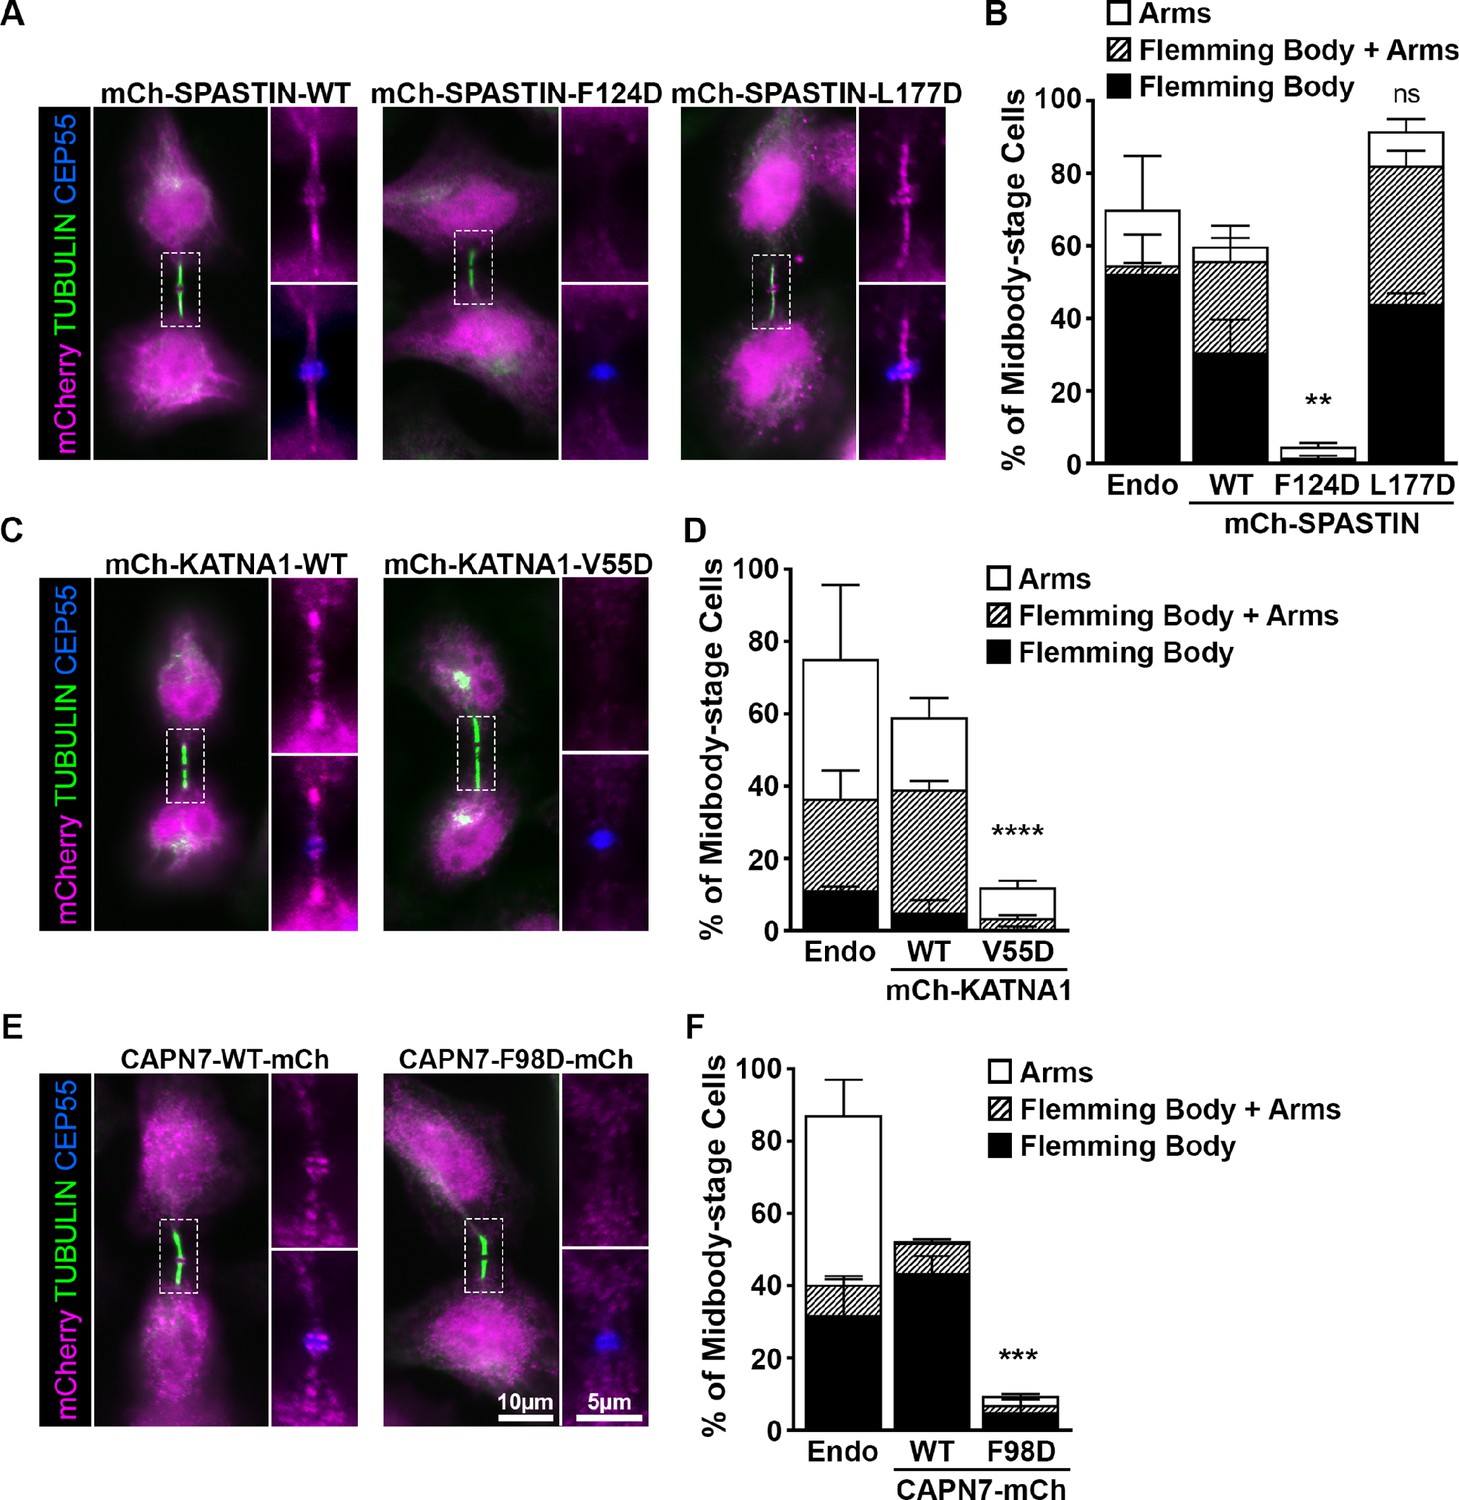
ESCRT-III binding to SPASTIN, KATNA1, and CAPN7 is required for midbody localization when the abscission checkpoint is sustained.
(A) Immunofluorescence of DOX-inducible cell lines expressing siRNA-resistant mCherry-SPASTIN-WT, mCherry-SPASTIN-F124D, and mCherry-SPASTIN-L177D constructs under sustained abscission checkpoint conditions (see Materials and methods). Endogenous SPASTIN was depleted by siRNA treatment of the DOX-inducible cell lines and induced protein expression/localization was detected using an anti-mCherry antibody. Antibodies to α-TUBULIN and CEP55 were used to identify midbody-stage cells and the Flemming Body, respectively. Enlargements of selected regions are shown at the right of each image with the target protein shown alone (top) or together with CEP55 (bottom). (B) Quantification of midbody localization for endogenous SPASTIN from Figure 5 (Endo) and the indicated DOX-inducible cell lines. Bars are the average and standard deviation from three independent experiments where >100 midbody-stage cells were counted. Statistical analysis was performed using ANOVA, comparing total midbody localization of the F124D and L177D mutants to WT. (C, D) Immunofluorescence and quantification of midbody localization for endogenous KATNA1 (Figure 5) and DOX-inducible cell lines expressing siRNA-resistant mCherry-KATNA1-WT and mCherry-KATNA1-V55D constructs as in A and B, except that endogenous KATNA1 was depleted by siRNA in the DOX- inducible cell lines. Statistical analysis was performed using an unpaired t-test, comparing the V55D mutant to WT. (E, F) Immunofluorescence and quantification of midbody localization for endogenous CAPN7 (Figure 5) and DOX-inducible cell lines expressing siRNA-resistant CAPN7-mCherry and CAPN7-F98D-mCherry constructs as in A and B, except that endogenous CAPN7 was depleted by siRNA in the DOX-inducible cell lines. Statistical analysis was performed using an unpaired t-test comparing the F98D mutant to WT. ****p<0.0001, ***p=0.0005, **p=0.0024, ns = not significant.
Figure 6—figure supplement 1
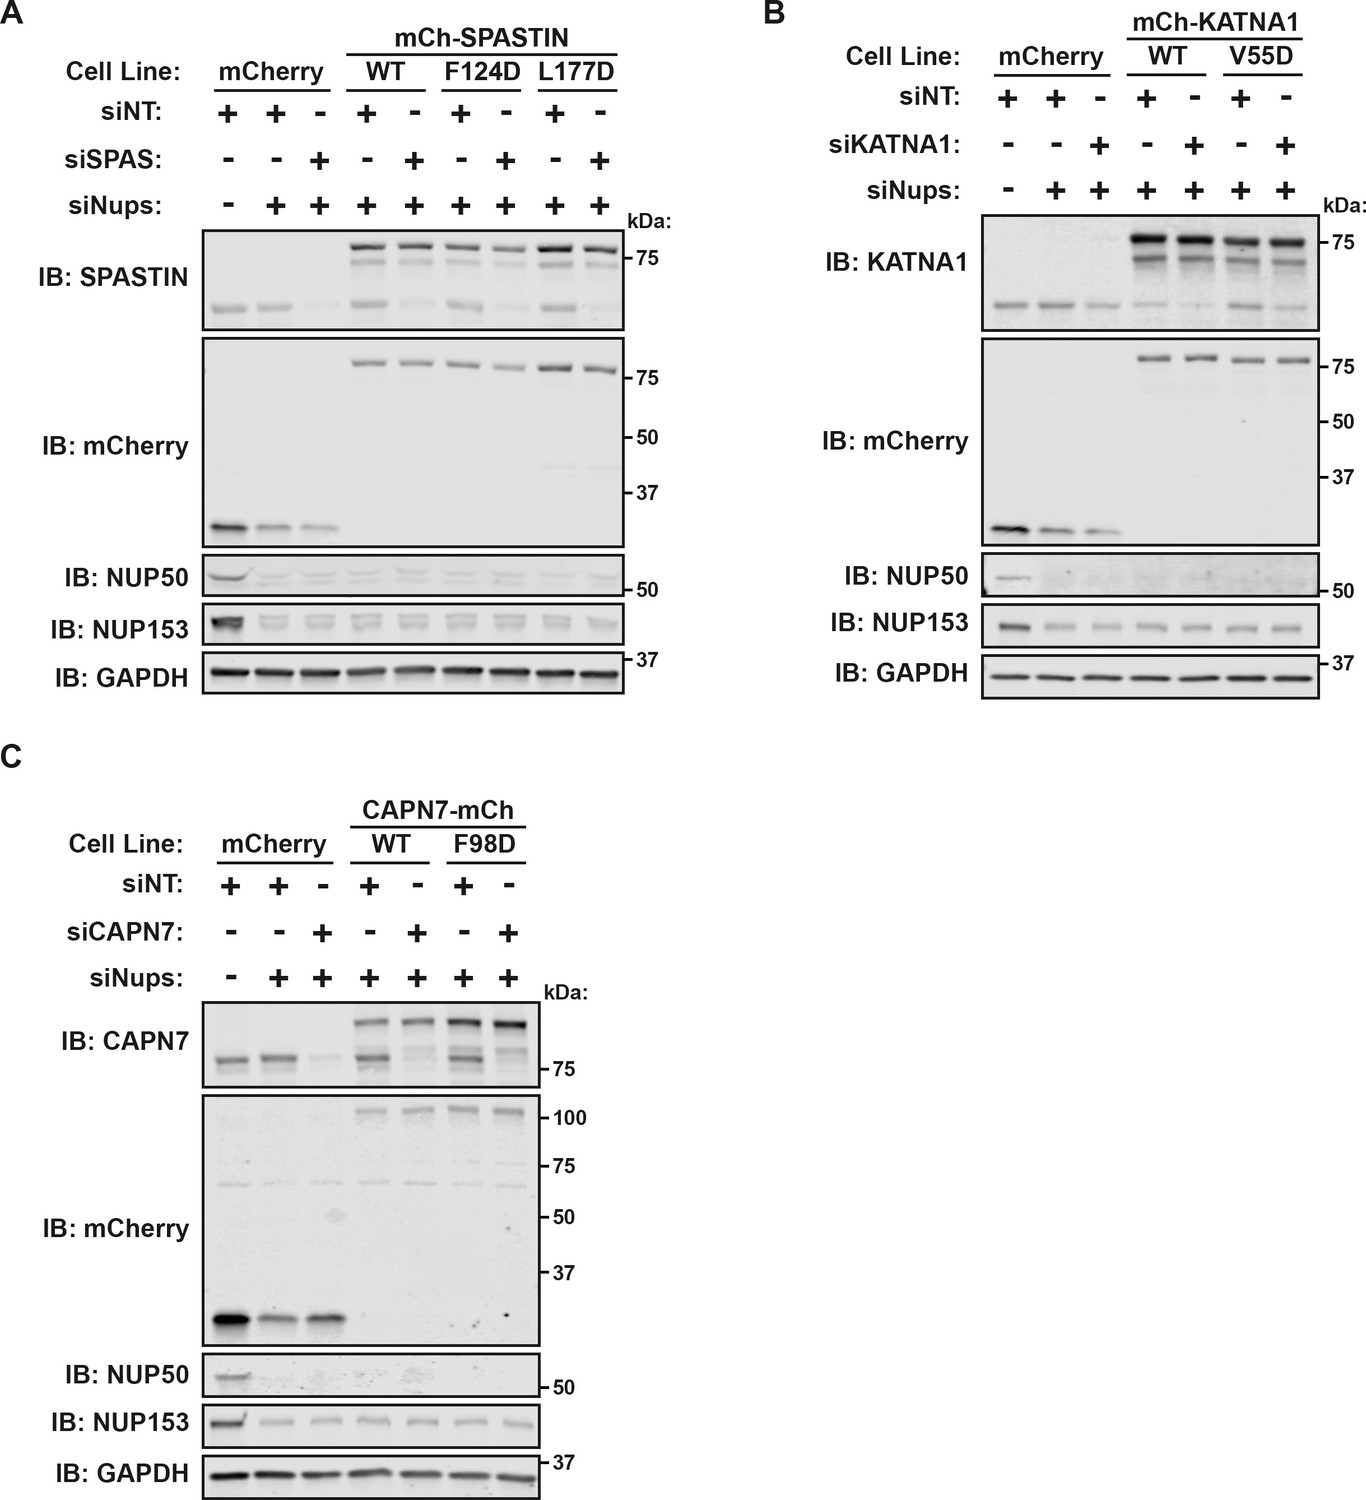
Confirmation of the efficiency and specificity of protein depletion by siRNA and DOX-inducible protein expression.
(A–C) Western blots from experiments in Figure 6.
-
Figure 6—figure supplement 1—source data 1
Annotated uncropped western blots and raw images for Figure 6—figure supplement 1 (A–C).
- https://cdn.elifesciences.org/articles/77779/elife-77779-fig6-figsupp1-data1-v1.zip
Figure 6—figure supplement 2
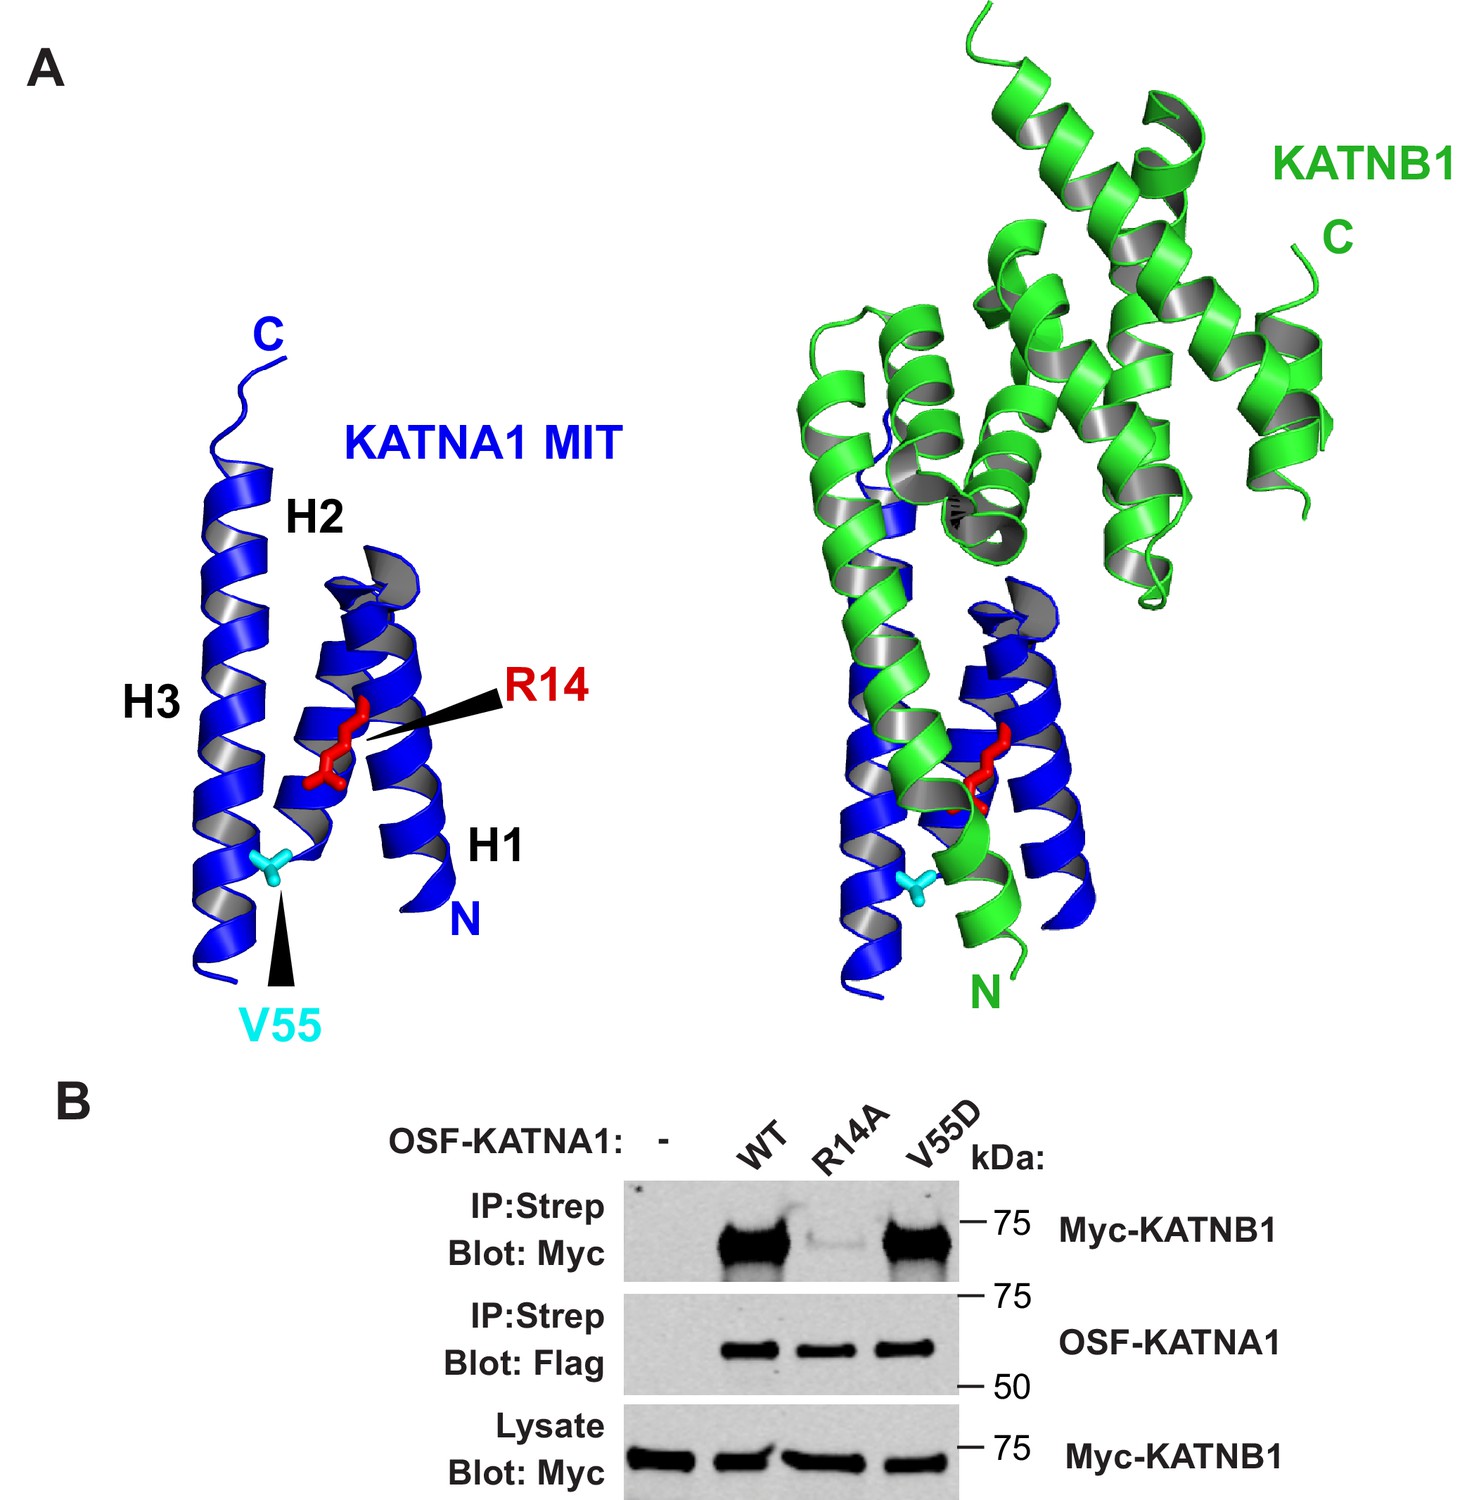
The KATNA1 V55D mutation does not disrupt KATNB1 binding.
(A) Structure of KATNA1 MIT domain showing locations of V55 (cyan, stick) and R14 (red, stick). Left image shows the MIT domain alone and right image shows the MIT domain in complex with KATNB1 (PDB 5NBT). (B) Co-precipitations from HEK293T cells co-transfected with Myc-KATNB1 and WT or mutant OSF-KATNA1 proteins. An empty vector expressing OSF alone was used as a control (-).
-
Figure 6—figure supplement 2—source data 1
Annotated and uncropped western blots and raw images for Figure 6—figure supplement 2B.
- https://cdn.elifesciences.org/articles/77779/elife-77779-fig6-figsupp2-data1-v1.zip
Author response image 1

Cells were treated as in Manuscript Figure 5D-H (active checkpoint), fixed in either PFT or Methanol and stained with KATNA1-specific antibodies from Proteintech or Abcam.
Two examples from each treatment are shown.
Tables
Key resources table
| Reagent type (species) or resource | Designation | Source or reference | Identifiers | Additional information |
|---|---|---|---|---|
| Cell line (Homo sapiens) | Hela-N | Maureen Powers Lab | HeLa cells selected for transfectability | |
| Cell line (Homo sapiens) | HEK293T | ATCC | CRL-3216 | |
| Antibody | Anti-CAPN7 (Rabbit polyclonal) | Proteintech | Cat#26985–1-AP | IF (1:1000) WB (1:5000) |
| Antibody | Anti-CEP55 (Sheep polyclonal) | Bastos and Barr, 2010 | IF (1:3500) | |
| Antibody | Anti-IST1 (Rabbit polyclonal) | Sundquist Lab/Covance | UT560 | WB (1:1000) |
| Antibody | Anti-CHMP4C (Rabbit polyclonal) | Sadler et al., 2018 | WB (1:500) | |
| Antibody | Anti-KATNA1 (Rabbit polyclonal) | Proteintech | 17560–1-AP | IF (1:1000) |
| Antibody | Anti-KATNA1 (Rabbit polyclonal) | Abcam | ab111881 | IF (1:500) WB (1:1000) |
| Antibody | Anti-SPASTIN (Mouse monoclonal) | Sigma | S7074 | IF (1:1000) WB (1:1000) |
| Antibody | Anti-NUP153 (SA1) (Mouse monoclonal) | Brian Burke | WB (1:50) | |
| Antibody | Anti-NUP50 (Rabbit polyclonal) | Mackay et al., 2010 | WB (1:2500) | |
| Sequence-based reagent | siNT | Mackay et al., 2010 | siRNA | GCAAAUCUCCGAUCGUAGA |
| Sequence-based reagent | siCHMP4C | Strohacker et al., 2021 | siRNA | CACUCAGAUUGAUGGCACA |
| Sequence-based reagent | sIST1 | Bajorek et al., 2009a | siRNA | AGAUACCUGAUUGAAAUUG |
| Sequence-based reagent | siNUP153 | Mackay et al., 2010 | siRNA | GGACUUGUUAGAUCUAGUU |
| Sequence-based reagent | siNUP50 | Mackay et al., 2010 | siRNA | GGAGGACGCUUUUCUGGAU |
| Sequence-based reagent | siCAPN7 | This Paper | siRNA | GCACCCAUACCUUUACAUU |
| Sequence-based reagent | siCAPN7-b | This Paper | siRNA | GGCCGUUACUGAUUGAGCU |
| Sequence-based reagent | siKATNA1 | This Paper | siRNA | GGACAGCACUCCCUUGAAA |
| Sequence-based reagent | siKATNA1-b | Horizon Discovery | CAT# L-005157 | ON-TARGET-PLUS siRNA- SMARTPOOL |
| Sequence-based reagent | siSPAS | This Paper | siRNA | GAACAGUGUGAAAGAGCUA |
| Sequence-based reagent | siSPAS-b | This Paper | siRNA | CGUUAUUGAUACUUGGAUA |
| Chemical compound, drug | Thymidine | CalBiochem | CAS 50-89-5 | 2 mM |
| Chemical compound | Oregon Green 488 maleimide | Life Technologies/Molecular Probes | O6034 | Fluorescent label for peptides |
| Software, algorithm | Fiji | NIH | RRID:SCR_002285 | |
| Software, algorithm | KaleidaGraph | Synergy Software |
Author response table 1
| MIT Domain | ESCRT-III Tail | KD (direct binding) (µM) | KI competition experiment (µM) |
|---|---|---|---|
| MITD1 | CHMP4B | 15 ± 1 (n≥3) | 21.7 ± 0.4 (n≥3) |
| USP8 | CHMP4B | 11.7 ± 0.9 (n≥3) | 38.9 ± 0.3 (n=2; error is the range of the measurement) |
| USP8 | IST1-MIM1/3 | 0.6 ± 0.01 (n≥3) | 1.1 ±- 0.2 (n=2; error is the range of the measurement) |
Author response table 2
| MIT Domain | ESCRT-III Tail | KD (N-terminal Fluor) (µM) | KD (C-terminal Fluor) (µM) |
|---|---|---|---|
| CAPN7 | IST1 | 0.07 ± 0.02 (n≥3) | 0.09 ± 0.01 (n=3) |
Author response table 3
| MIT Domain | ESCRT-III Tail | KD (FP) (µM) | KD (SPR) (µM) |
|---|---|---|---|
| SPASTIN | IST1 | 0.5 ± 0.1 (n≥ 3) | 0.57 ± 0.08 (n=2) |
Additional files
-
Supplementary file 1
MIT domain proteins and ESCRT-III peptides used for the fluorescence polarization screen and X-ray crystallography.
(A) MIT domain protein constructs used in our screen. (B) Fluorescently labeled ESCRT-III C-terminal tails used in the fluorescent polarization screen. (C) Unlabeled ESCRT-III C-terminal peptide tails used for competition experiments and structural biology.
- https://cdn.elifesciences.org/articles/77779/elife-77779-supp1-v1.docx
-
Supplementary file 2
Plasmids, siRNA and antibodies used in this study.
(A) Plasmids, (B), siRNA sequences, and (C) antibodies used for this study.
- https://cdn.elifesciences.org/articles/77779/elife-77779-supp2-v1.docx
-
Supplementary file 3
SPASTIN MIT-IST1 complex data collection and refinement statistics.
- https://cdn.elifesciences.org/articles/77779/elife-77779-supp3-v1.docx
-
Transparent reporting form
- https://cdn.elifesciences.org/articles/77779/elife-77779-transrepform1-v1.pdf
Download links
A two-part list of links to download the article, or parts of the article, in various formats.
Downloads (link to download the article as PDF)
Open citations (links to open the citations from this article in various online reference manager services)
Cite this article (links to download the citations from this article in formats compatible with various reference manager tools)
Comprehensive analysis of the human ESCRT-III-MIT domain interactome reveals new cofactors for cytokinetic abscission
eLife 11:e77779.
https://doi.org/10.7554/eLife.77779


