STAG2 promotes the myelination transcriptional program in oligodendrocytes
- Department of Pharmacology, University of Texas Southwestern Medical Center, United States
- Westlake Laboratory of Life Sciences and Biomedicine, China
- School of Life Sciences, Westlake University, China
- Institute of Biology, Westlake Institute for Advanced Study, China
- Eugene McDermott Center for Human Growth and Development, University of Texas Southwestern Medical Center, United States
- Division of Neuropathology, University of Texas Southwestern Medical Center, United States
- Department of Bioinformatics, Department of Population and Data Sciences, University of Texas Southwestern Medical Center, United States
Figures
Figure 1 with 2 supplements
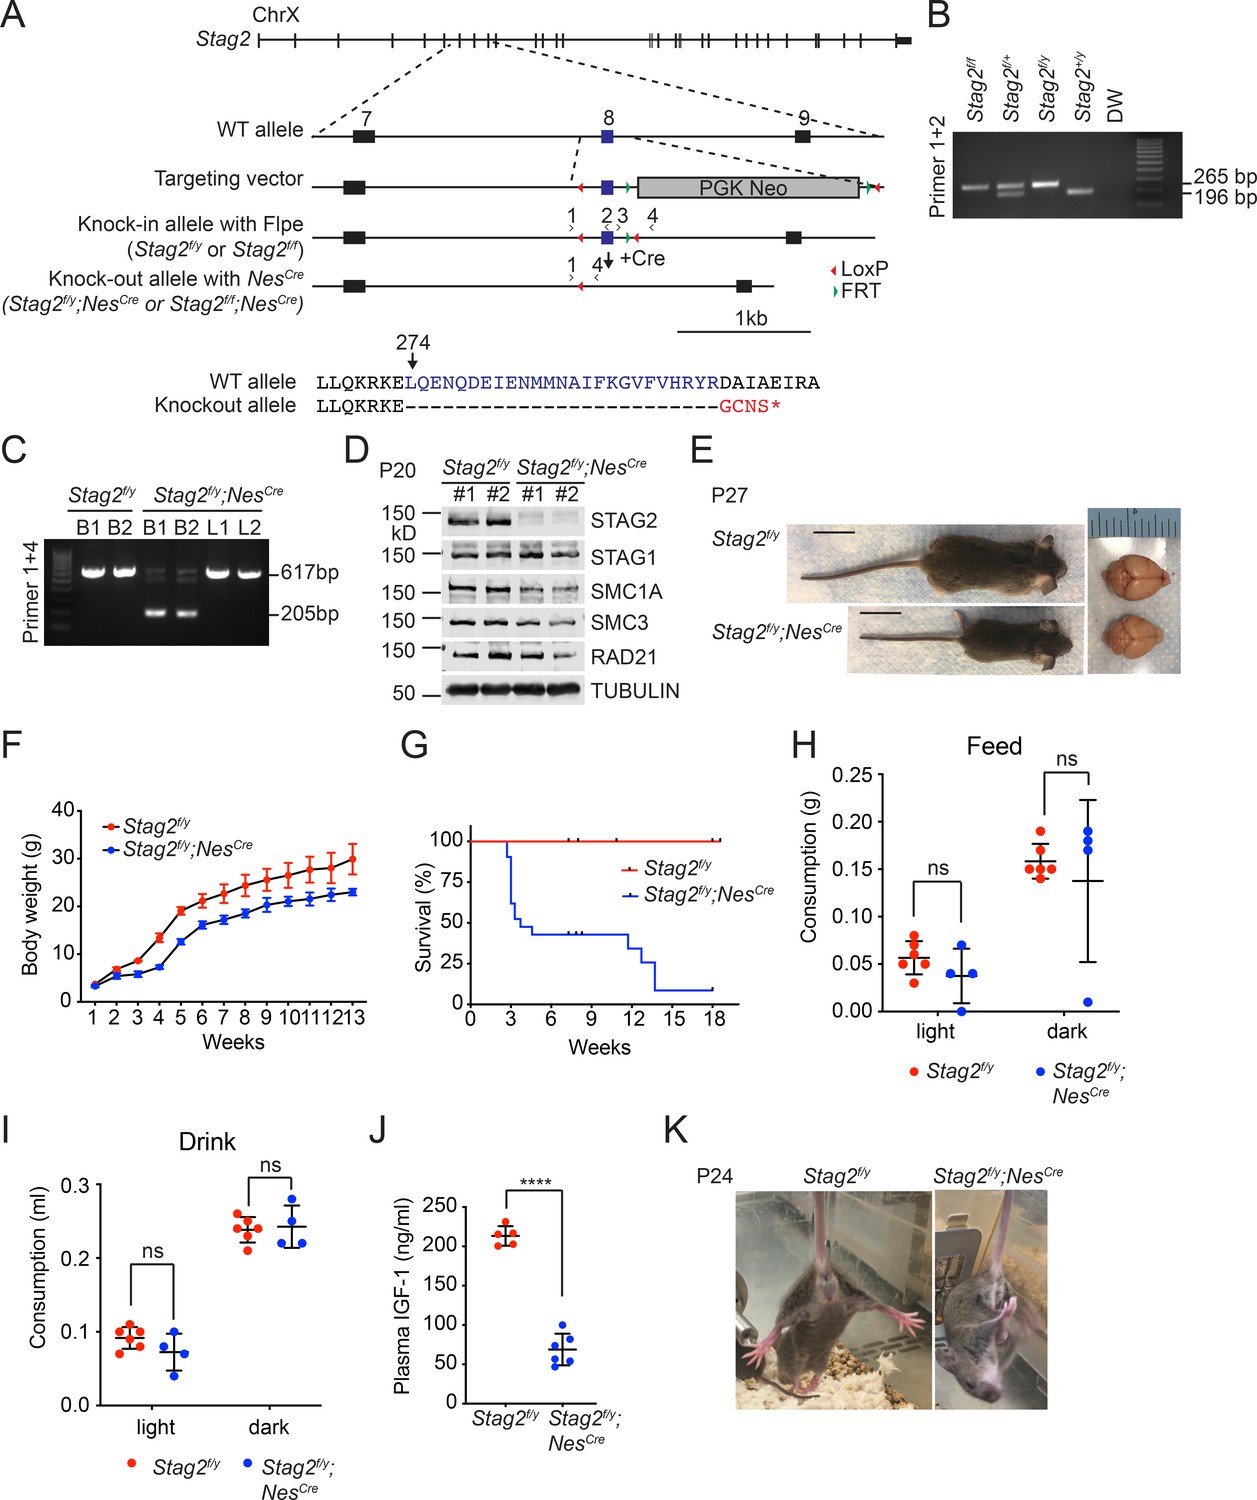
Stag2 ablation in the mouse nervous system causes growth retardation and neurological defects.
(A) Scheme for creating the ‘floxed’ Stag2 allele by gene targeting. The genomic structure of the wild-type (WT) Stag2 locus, the targeting vector, the knockin allele, the disrupted allele after Cre-mediated recombination, and the positions of the genotyping primers are shown. The amino acid sequence of the knockout allele in the targeted region is shown and aligned with that of the WT allele. (B) PCR analysis of the genomic DNA extracted from the tails of indicated mice with the primers in (A). (C) PCR analysis of genomic DNA extracted from brains (B) or livers (L) of indicated mice. (D) Immunoblots of brain lysates of Stag2f/y and Stag2f/y;NesCre mice with antibodies recognizing cohesin subunits and TUBULIN (as the loading control). (E) Representative images of Stag2f/y and Stag2f/y;NesCre mice. Scale bar = 2 cm. (F) Body weight of Stag2f/y and Stag2f/y;NesCre mice at different age. Mean ± standard deviation (SD) of at least three mice of the same age. (G) Survival curves of Stag2f/y (n = 12) and Stag2f/y;NesCre (n = 21) mice. Food (H) and water (I) consumption of 7- to 8-week-old Stag2f/y (n = 6) and Stag2f/y;NesCre (n = 4) mice. Mean ± SD; ns, not significant. (J) Plasma IGF-1 levels of 2-month-old Stag2f/y (n = 5) and Stag2f/y;NesCre (n = 6) mice. Mean ± SD; ****p < 0.0001. (K) Representative images of limb-clasping responses of Stag2f/y and Stag2f/y;NesCre mice. The uncropped images of blots in (B–D) are included in Figure 1—source data 1.
-
Figure 1—source data 1
Uncropped images of gels and blots in Figure 1.
- https://cdn.elifesciences.org/articles/77848/elife-77848-fig1-data1-v2.pdf
Figure 1—figure supplement 1
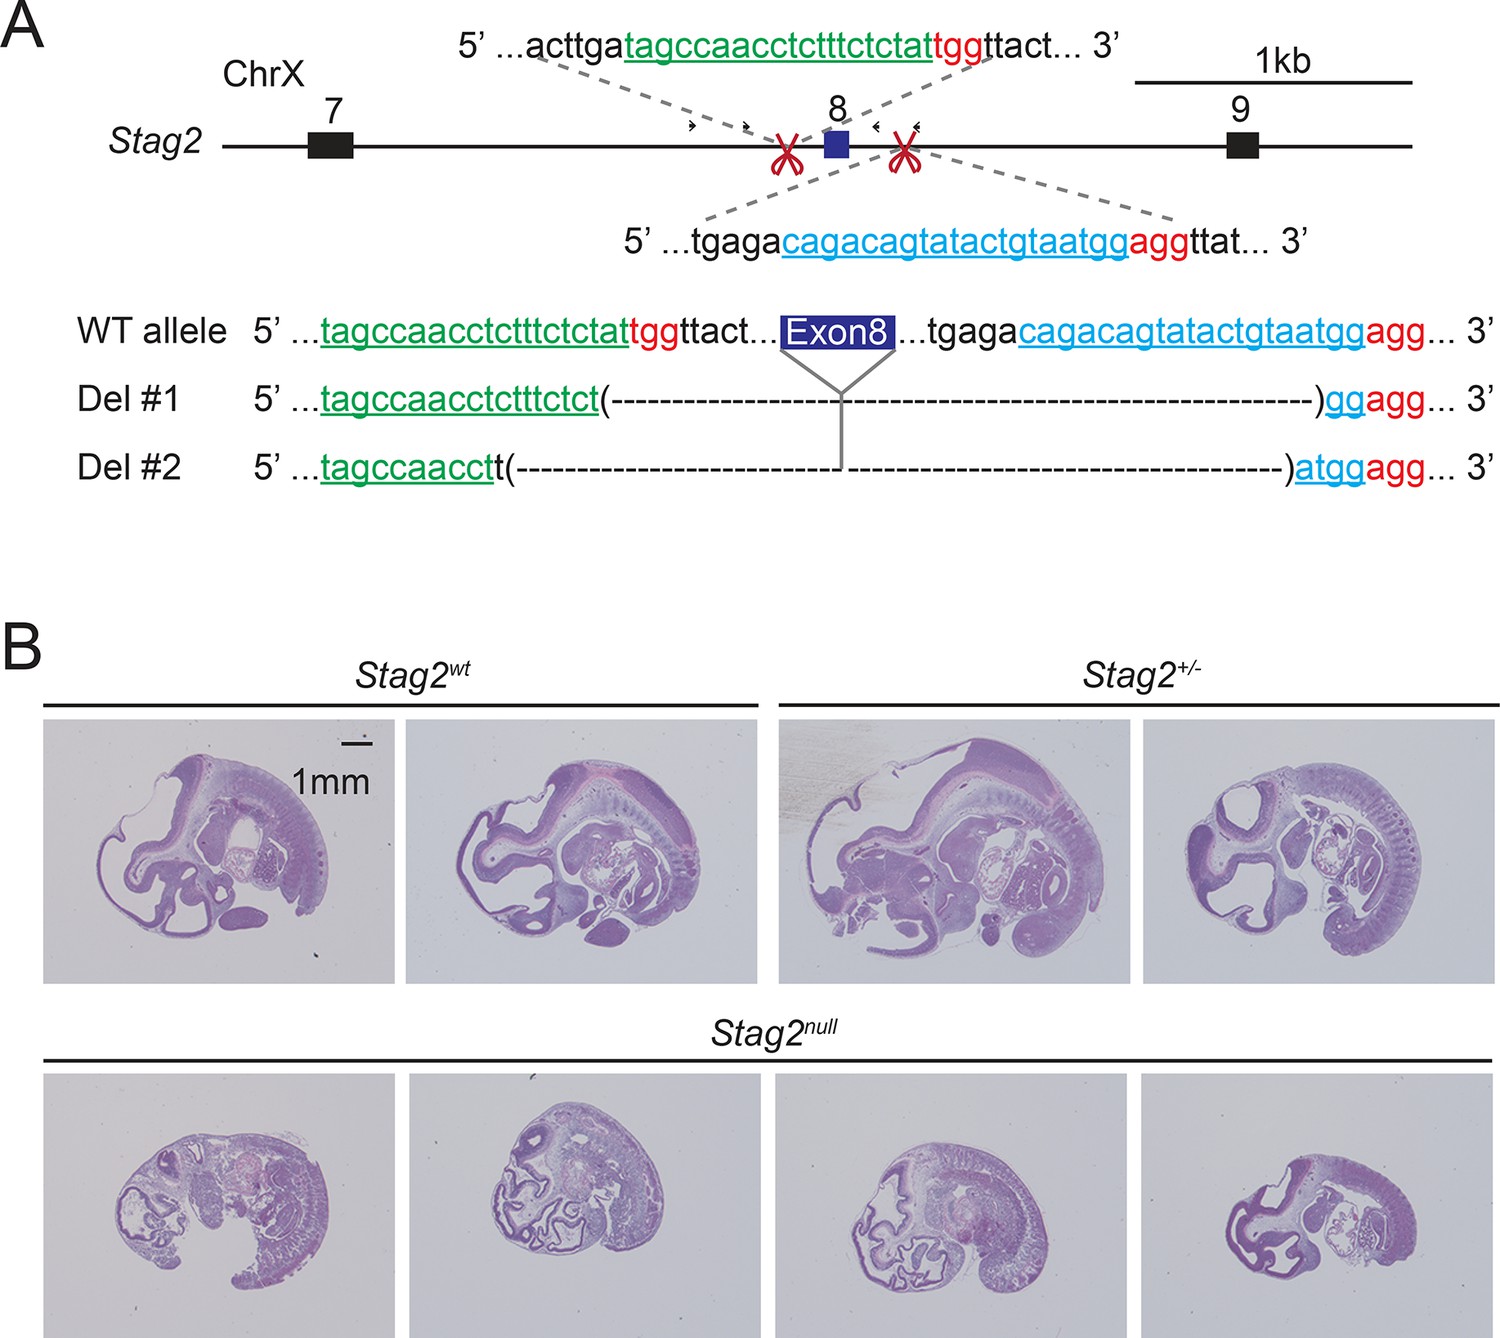
Generation of Stag2 knockout mice using the CRISPR/Cas9 method.
(A) Scheme for disrupting Stag2 in the mouse genome using CRISPR/Cas9 with guide RNAs flanking exon 8. Sequencing analysis of the genomic DNA extracted from two Stag2-disrupted founder mice is shown below. (B) Hematoxylin and eosin (H&E) staining of sagittal sections of F2 embryos derived from F1 in (A) at E11.5.
Figure 1—figure supplement 2
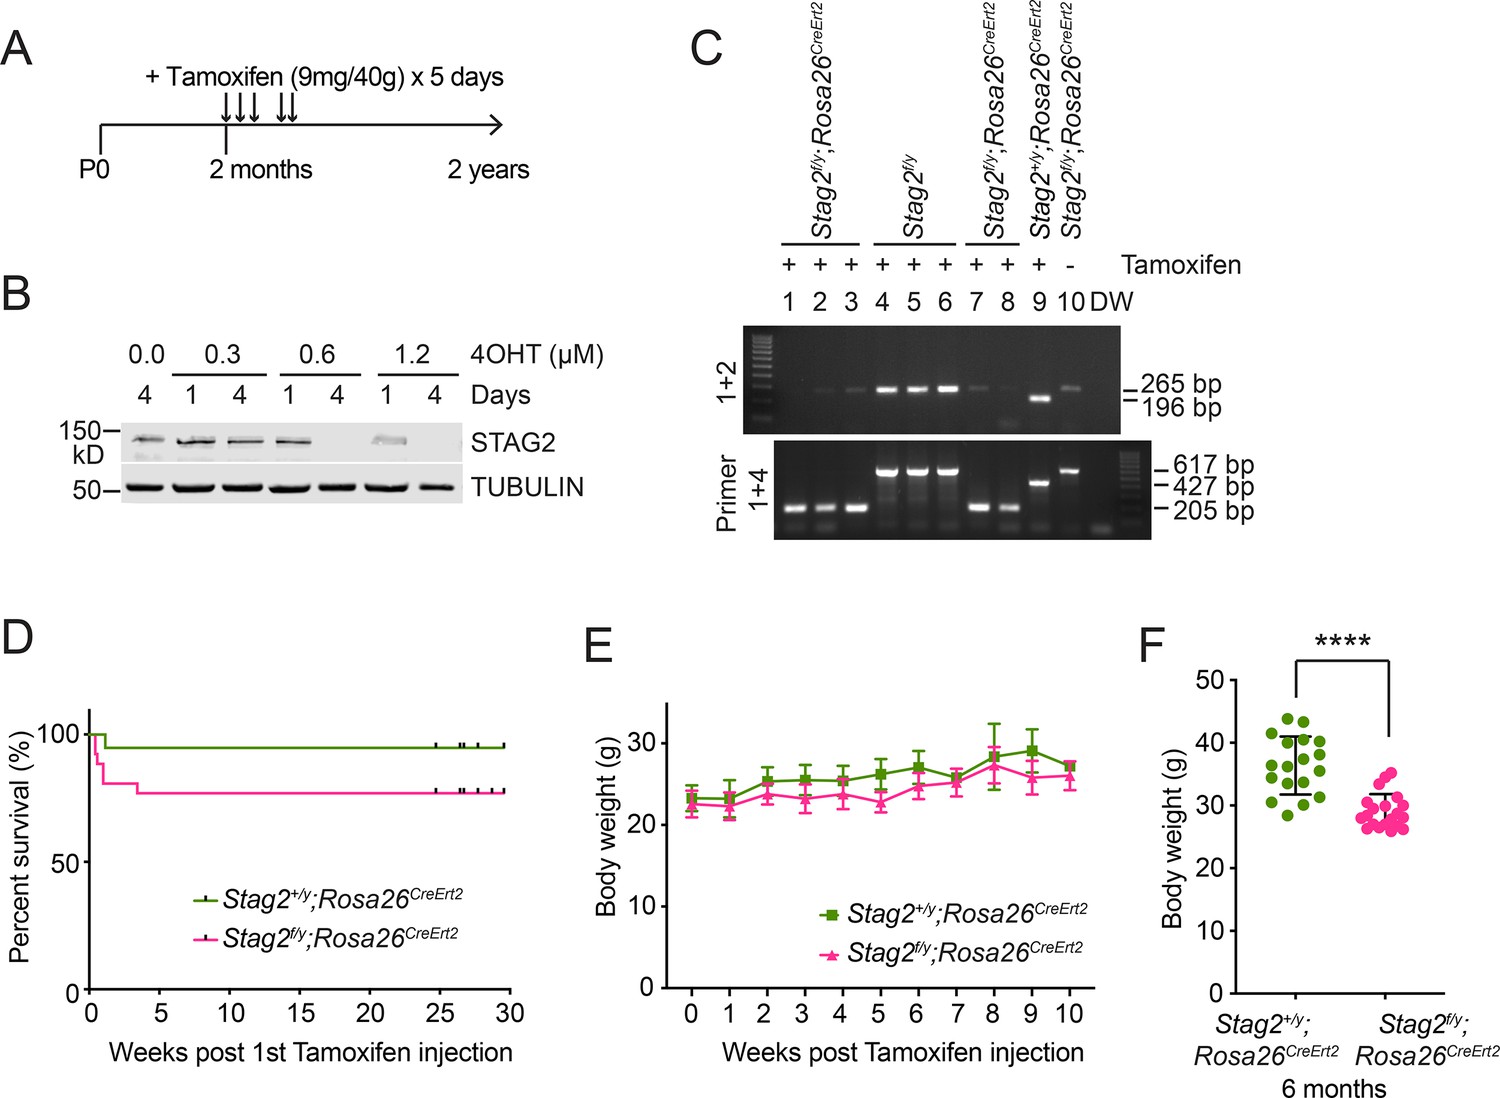
Generation of Stag2 conditional knockout mice by gene targeting.
(A) Experimental scheme of tamoxifen injection into adult Stag2f/y;Rosa26CreErt2 and Stag+/y;Rosa26CreErt2 mice. (B) Western blotting of cell extracts from Stag2f/y;Rosa26CreErt2 mouse embryonic fibroblasts (MEFs) treated with or without 4-hydroxytamoxifen (4OHT). E12.5 MEFs were prepared from Stag2f/y;Rosa26CreErt2 mouse embryos and subjected to 4OHT treatment. (C) PCR analysis of the genomic DNA extracted from the blood of indicated mice with the primers in Figure 1A. Only the floxed mice carrying Rosa26CreErt2 (1,2,3,7,8) had their exon 8 excised in the condition of tamoxifen injection. (D) Survival curves of Stag2f/y;Rosa26CreErt2 (n = 26) and Stag+/y;Rosa26CreErt2 (n = 19) mice after tamoxifen injection. (E) Body weight of mice in (D). (F) Body weight of Stag2f/y;Rosa26CreErt2 (n = 20) and Stag+/y;Rosa26CreErt2 (n = 18) mice at 6 months post tamoxifen injection. ****p < 0.0001. Uncropped images of gels and blots in this figure are included in Figure 1—figure supplement 2—source data 1.
-
Figure 1—figure supplement 2—source data 1
Uncropped images of gels and blots in Figure 1—figure supplement 2.
- https://cdn.elifesciences.org/articles/77848/elife-77848-fig1-figsupp2-data1-v2.pdf
Figure 2 with 2 supplements
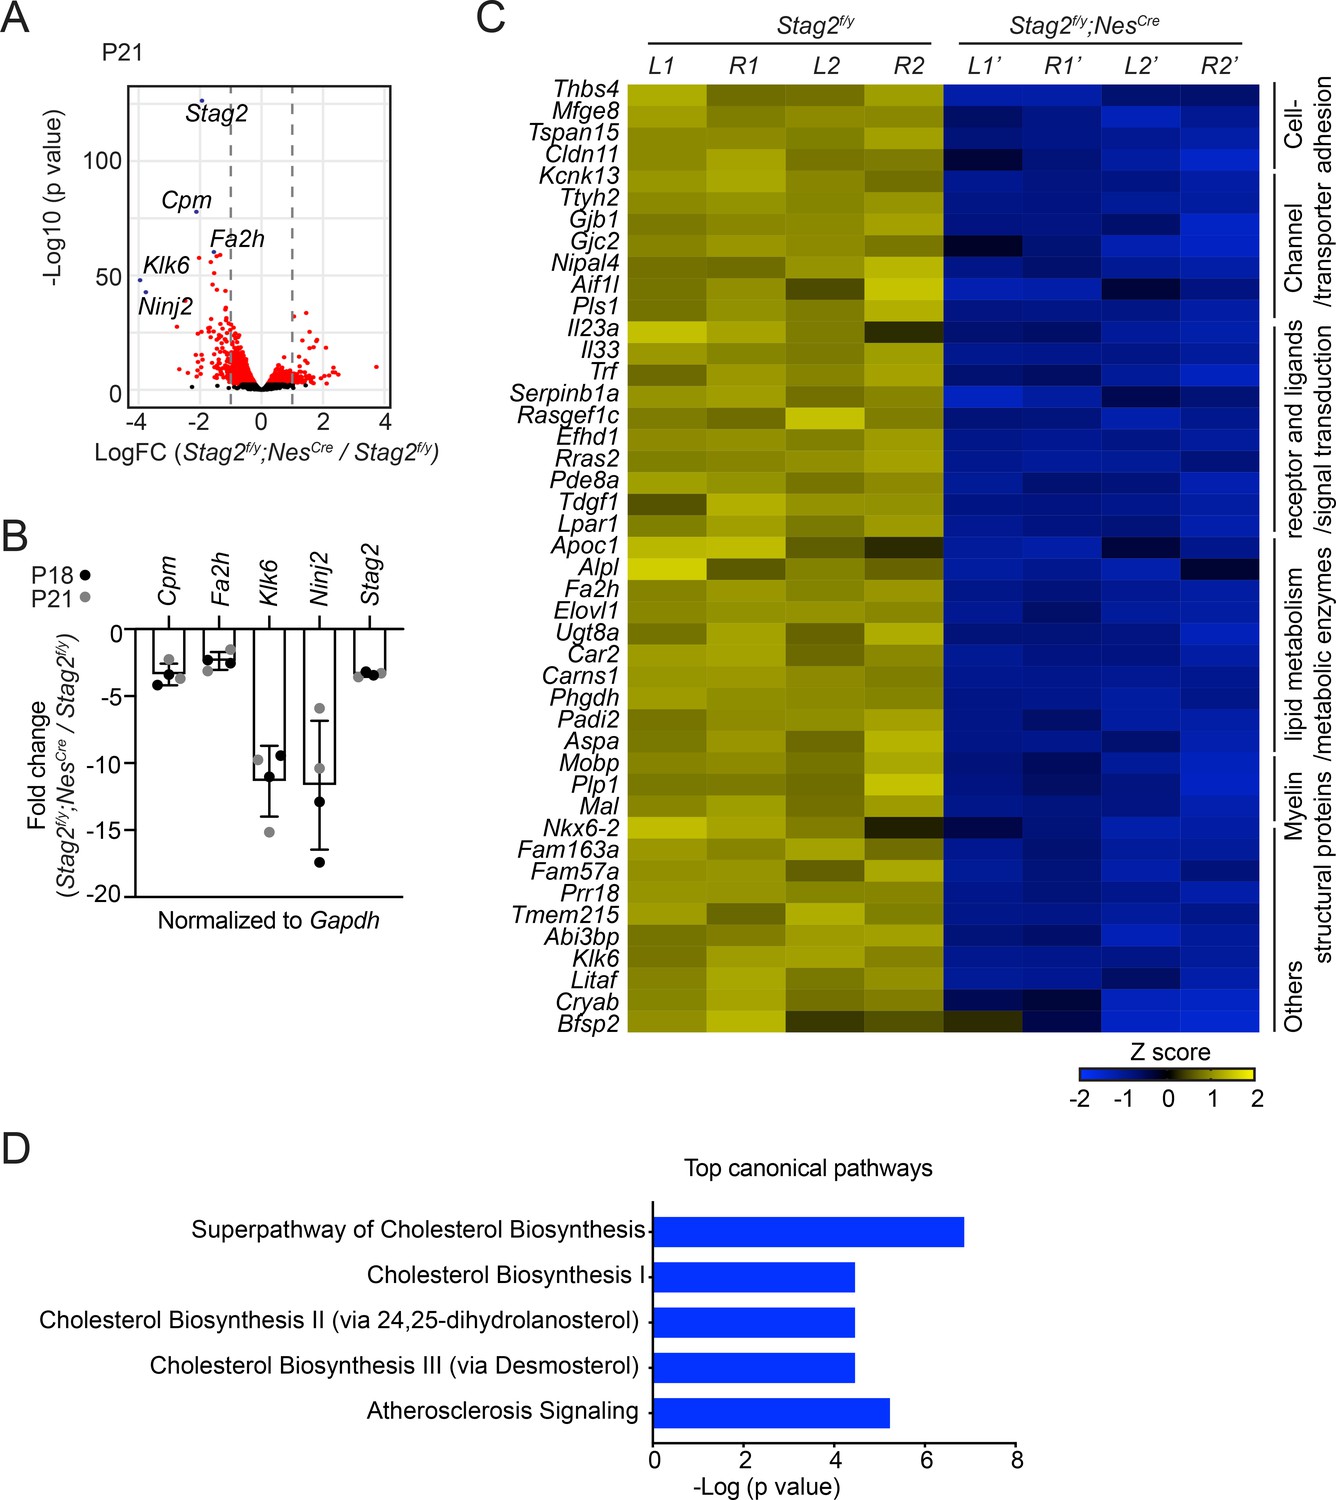
Stag2 ablation in mouse brains downregulates the expression of myelin genes.
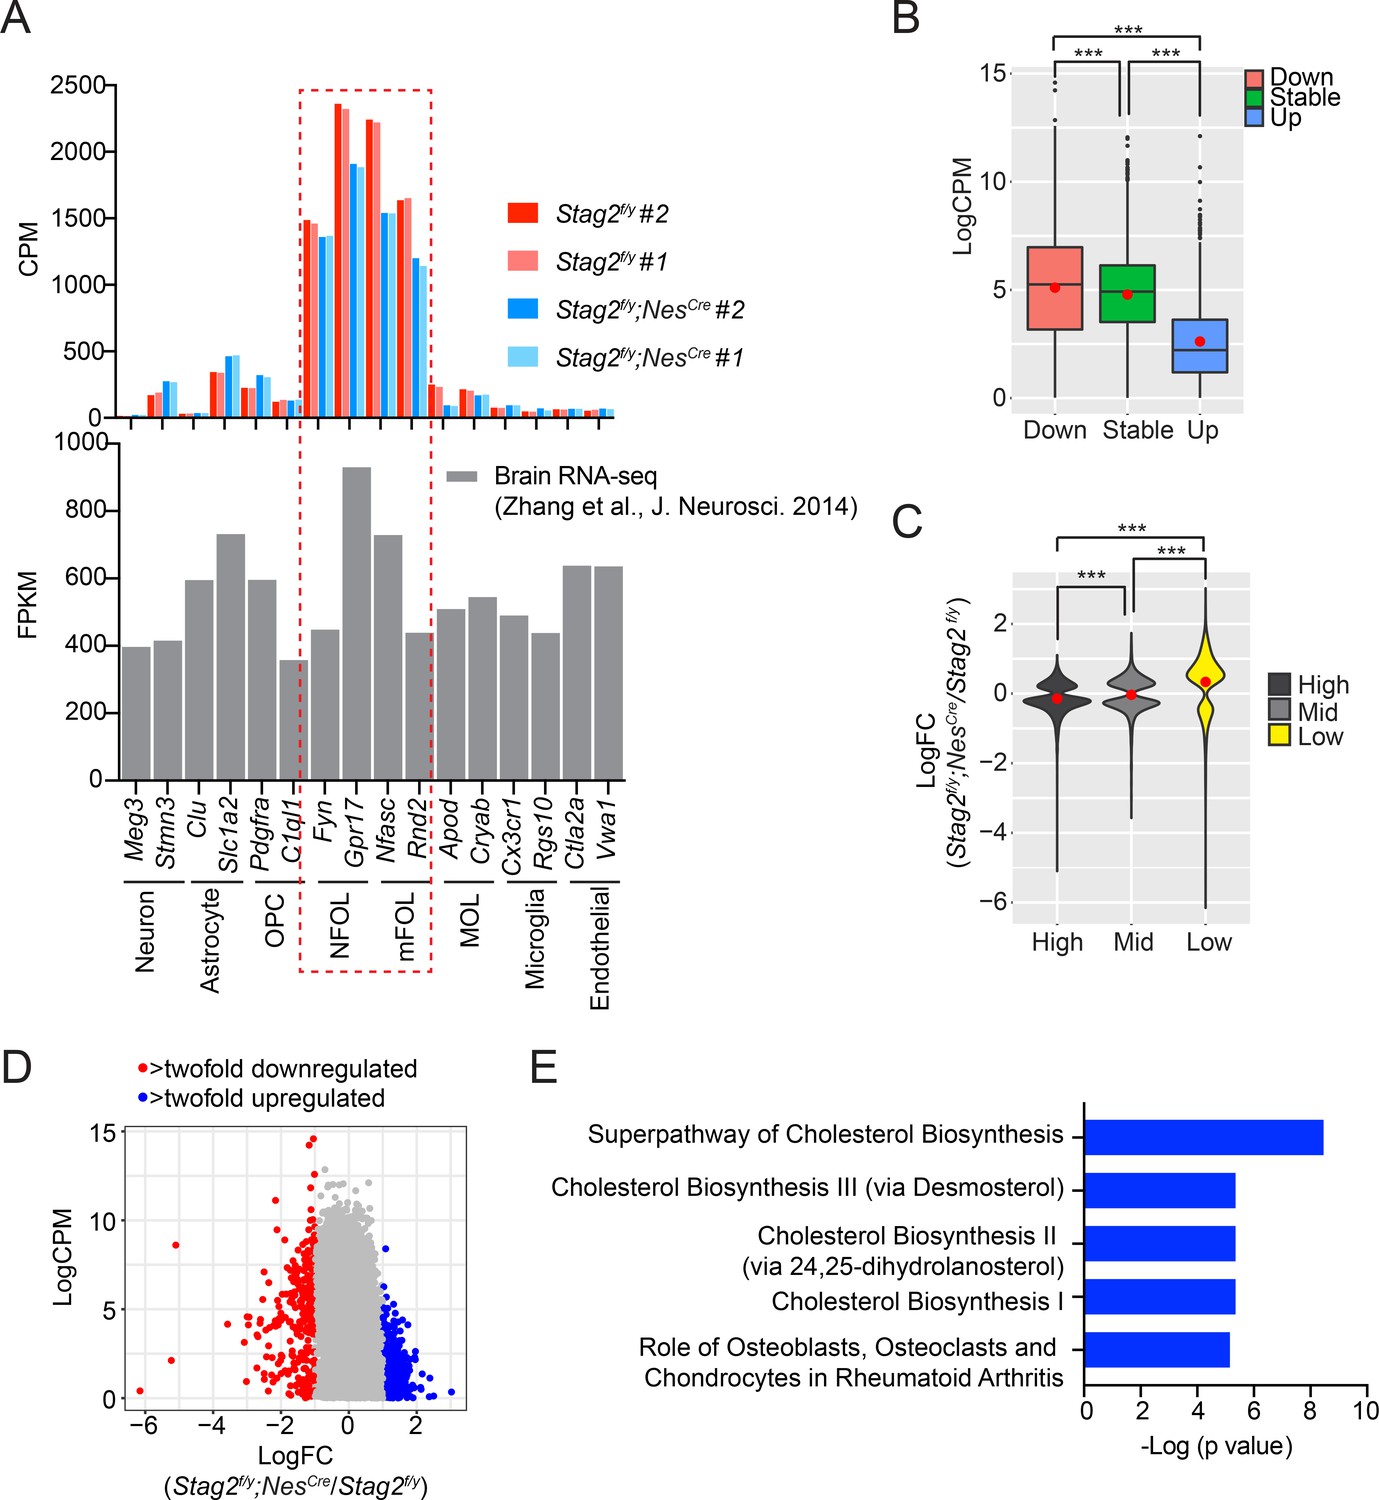
(A) Volcano plot of bulk RNA-sequencing results of Stag2f/y and Stag2f/y;NesCre brain extracts. Top differentially expressed genes (DEGs) are colored blue and labeled. n = 4 pairs of P21 Stag2f/y and Stag2f/y;NesCre brain hemispheres were used for the comparison. (B) Reverse transcription quantitative PCR (RT-qPCR) analysis of the top downregulated genes in the brain extracts. n = 4 pairs of Stag2f/y and Stag2f/y;NesCre littermates were used. Mean ± standard deviation (SD). (C) Heatmap of the expression of myelin-enriched genes that were downregulated by more than twofolds in Stag2f/y;NesCre brains. L1 and R1, left and right brain hemispheres of the Stag2f/y#1 mouse. L2 and R2, left and right brain hemispheres of the Stag2f/y#2 mouse. L1’ and R1’, left and right brain hemispheres of the Stag2f/y;NesCre #1 mouse. L2’ and R2’, left and right brain hemispheres of the Stag2f/y;NesCre#2 mouse. The biological pathways of these genes are labeled on the right. (D) The top 5 canonical pathways identified by ingenuity pathway analysis (IPA) of the DEGs. The complete gene list is used as the background.
Figure 2—figure supplement 1
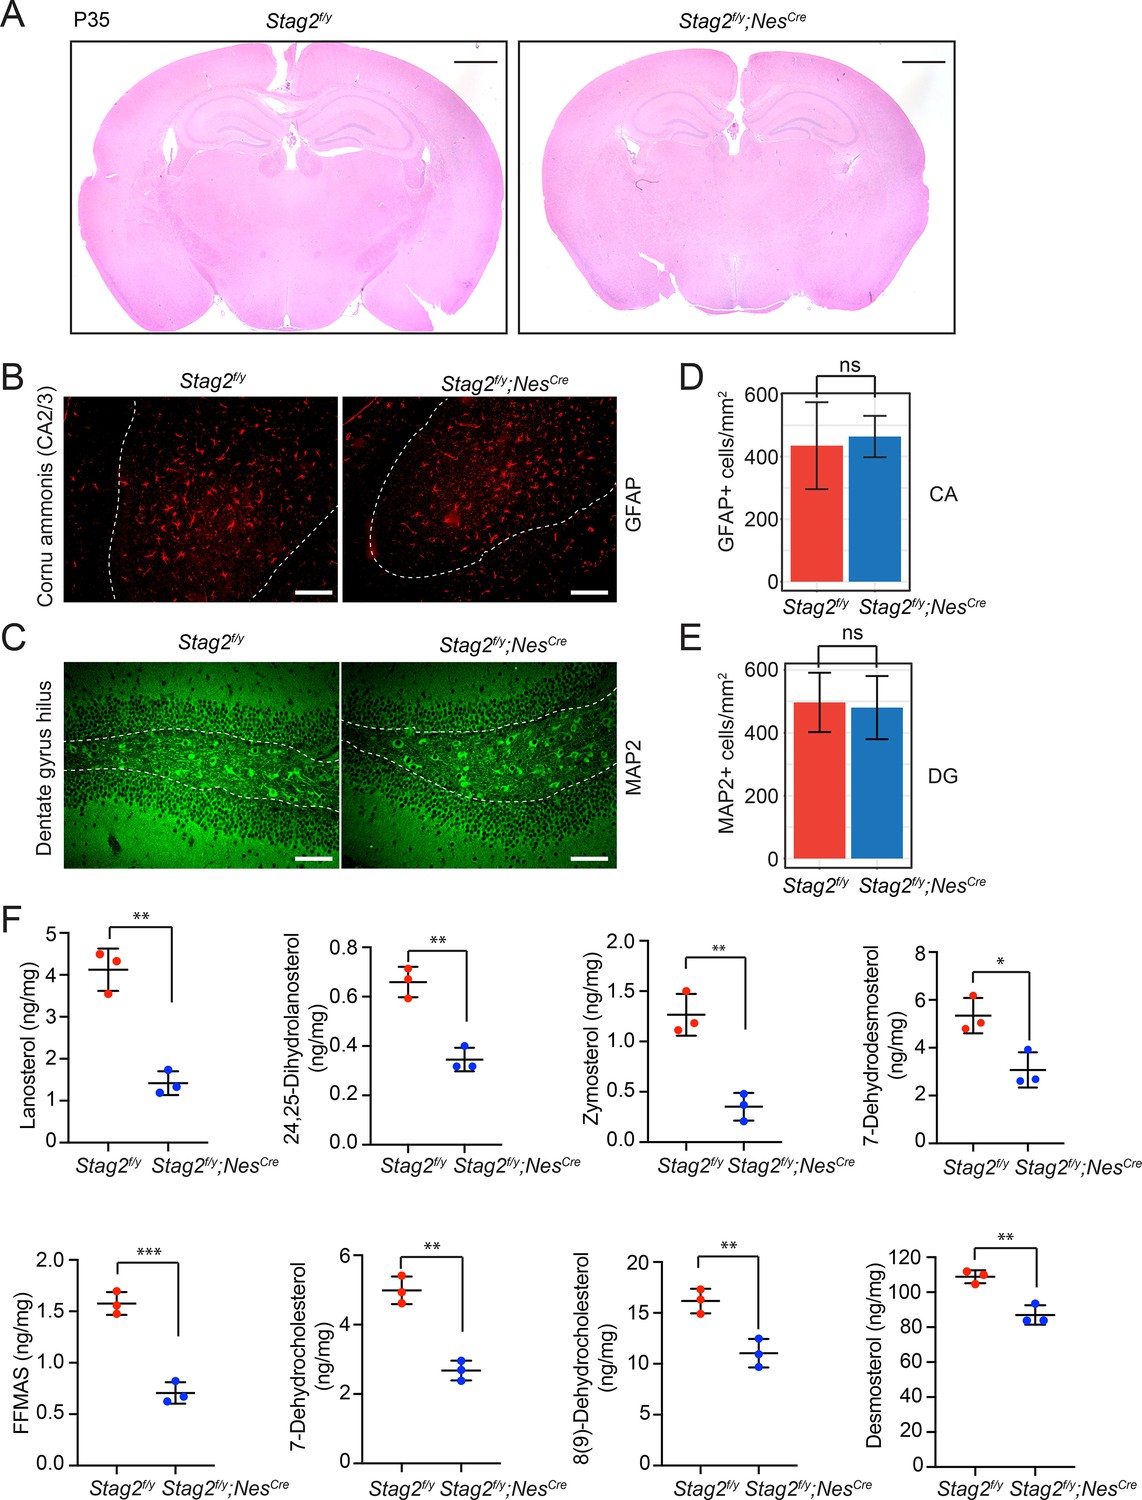
STAG2 deficiency in mouse brains attenuates cholesterol biosynthesis.
(A) Hematoxylin and eosin (H&E) staining of the coronal sections of Stag2f/y and Stag2f/y;NesCre mouse brains. Scale bar = 1 mm. Immunohistochemistry staining of signature proteins of astrocytes (B) and neurons (C) on brain coronal sections of P18 or P21 Stag2f/y and Stag2f/y;NesCre mice. Scale bar = 100 μm. (D) Density of GFAP+ astrocytes in the cornu ammonis (CA) area (outlined with white dash lines in B) of the hippocampus. n = 3 mice per genotype. Mean ± SD; ns, not significant. (E) Density of MAP2+ neurons in the dentate gyrus hilus (outlined with white dash lines in C). n = 3 mice for Stag2f/y and n = 4 mice for Stag2f/y;NesCre. Mean ± SD; ns, not significant. (F) Mass spectrometry analysis of cholesterol precursors in Stag2f/y and Stag2f/y;NesCre brains. The cholesterol precursors mass measurement was normalized to the brain weight. n = 3 mice per genotype. *p < 0.05, **p < 0.01, ***p < 0.001; mean ± standard deviation (SD).
Figure 2—figure supplement 2
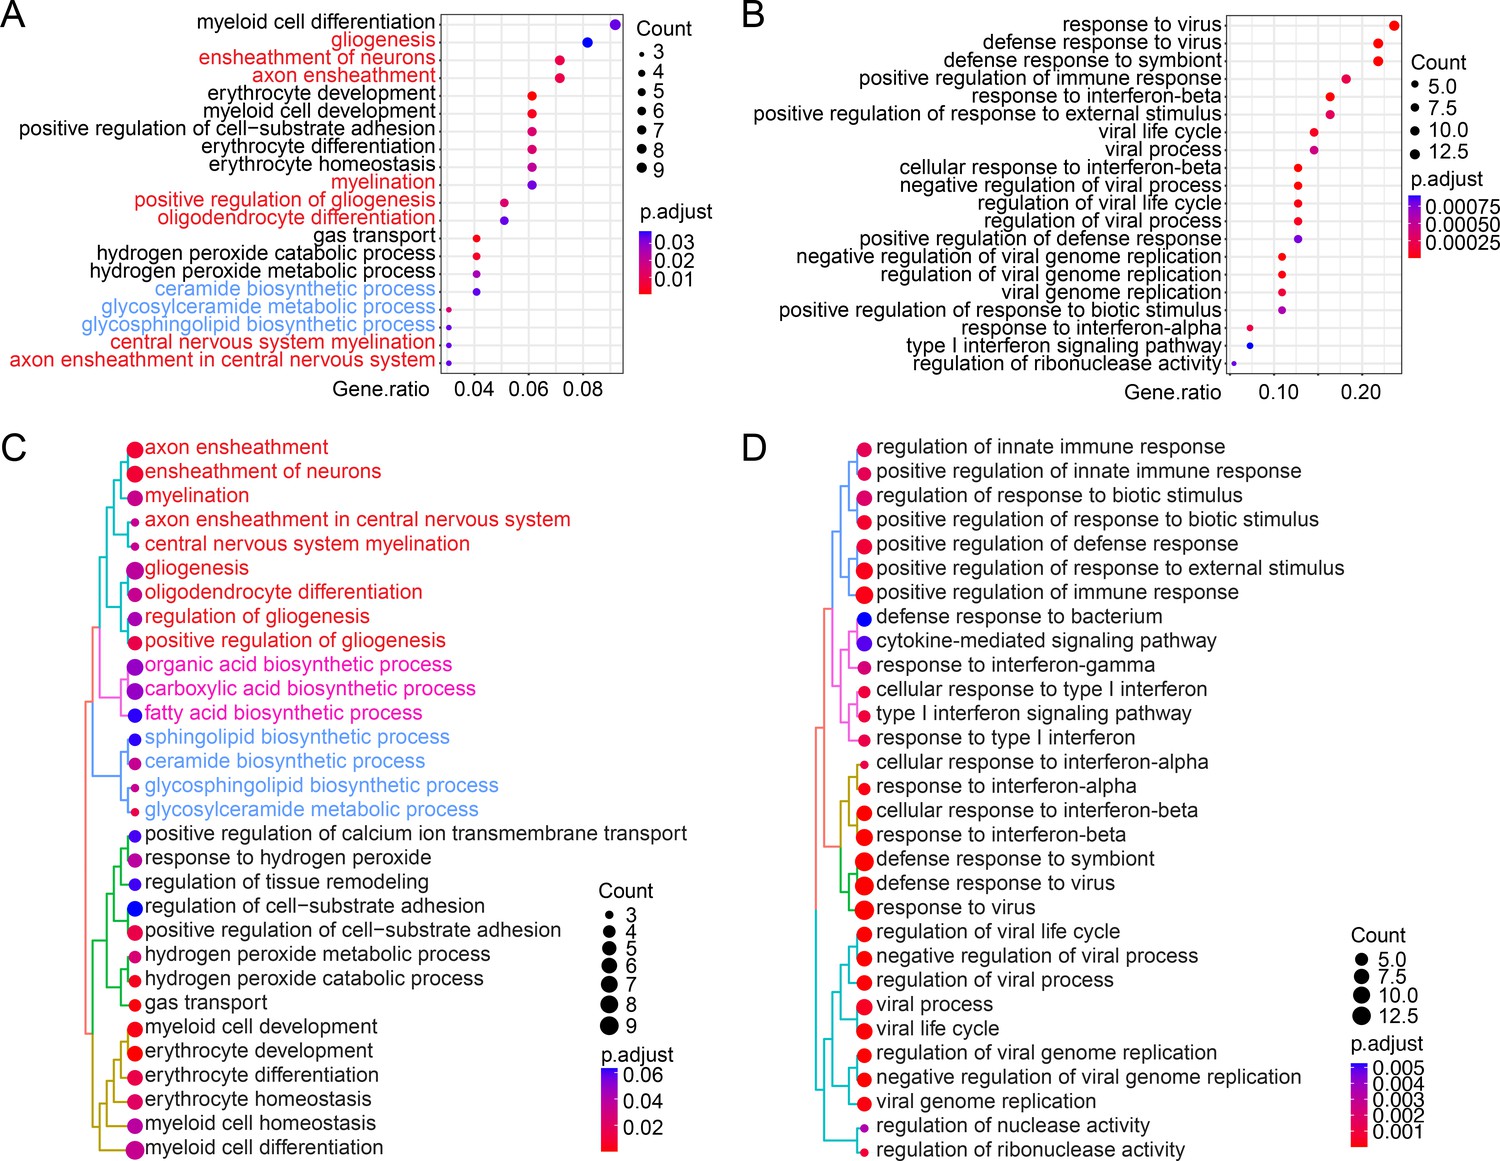
Over-representation analysis (ORA) of the RNA-sequencing (RNA-seq) results of the mouse brain samples.
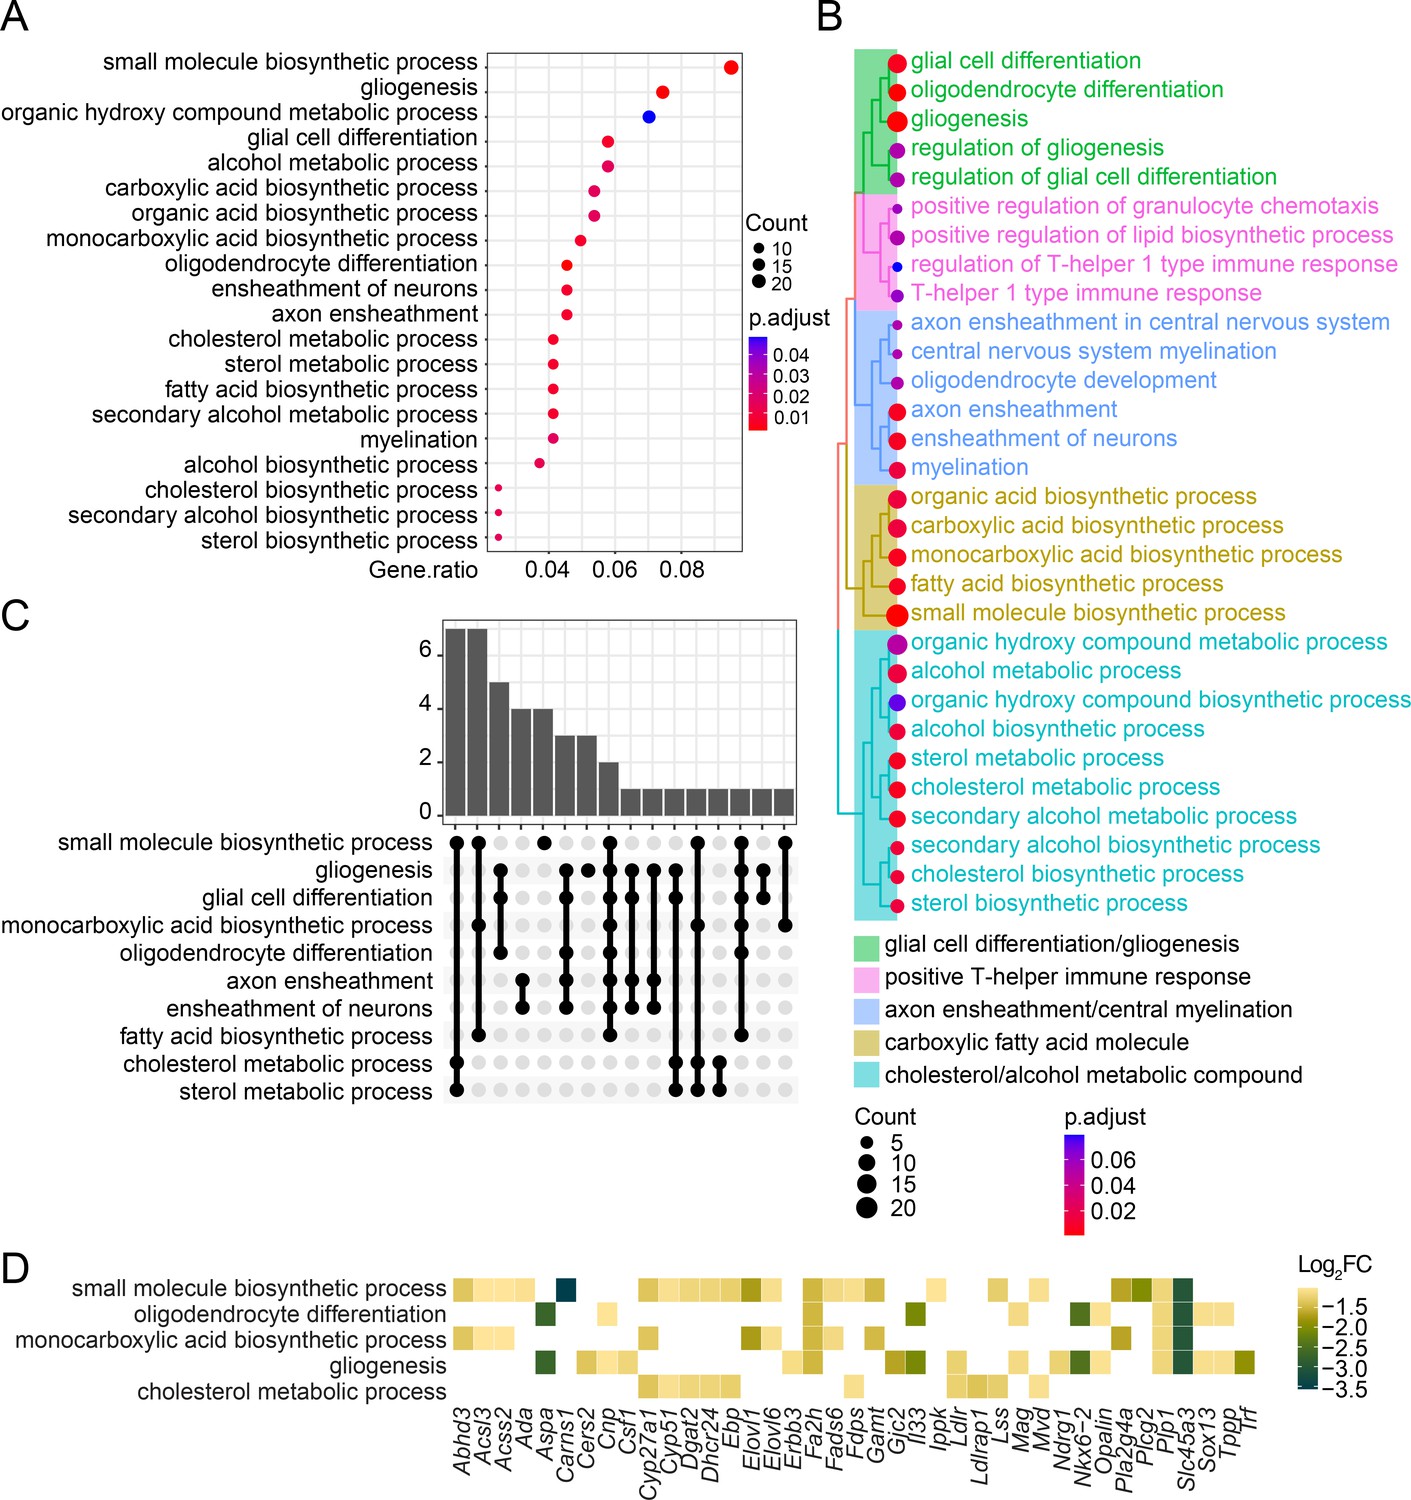
The enriched biological pathways identified by gene ontology of ClusterProfiler from the downregulated genes (A) or upregulated genes (B) with >twofold change between Stag2f/y and Stag2f/y;NesCre mice from the whole-brain RNA-seq dataset. Pathways of gliogenesis and myelination are highlighted in red. Pathways of membrane lipid biosynthesis are colored in blue. The top 20 pathways with the highest gene ratio are presented. Similarity tree plot of the top 30 enriched biological pathway as identified in A for the downregulated genes (C) or as in (B) for the upregulated genes (D). Pathways of myelination and gliogenesis are highlighted in red. Pathways of fatty acid biosynthesis and membrane lipid biosynthesis related to myelin sheath formation are colored in pink and blue, respectively.
Figure 3 with 1 supplement
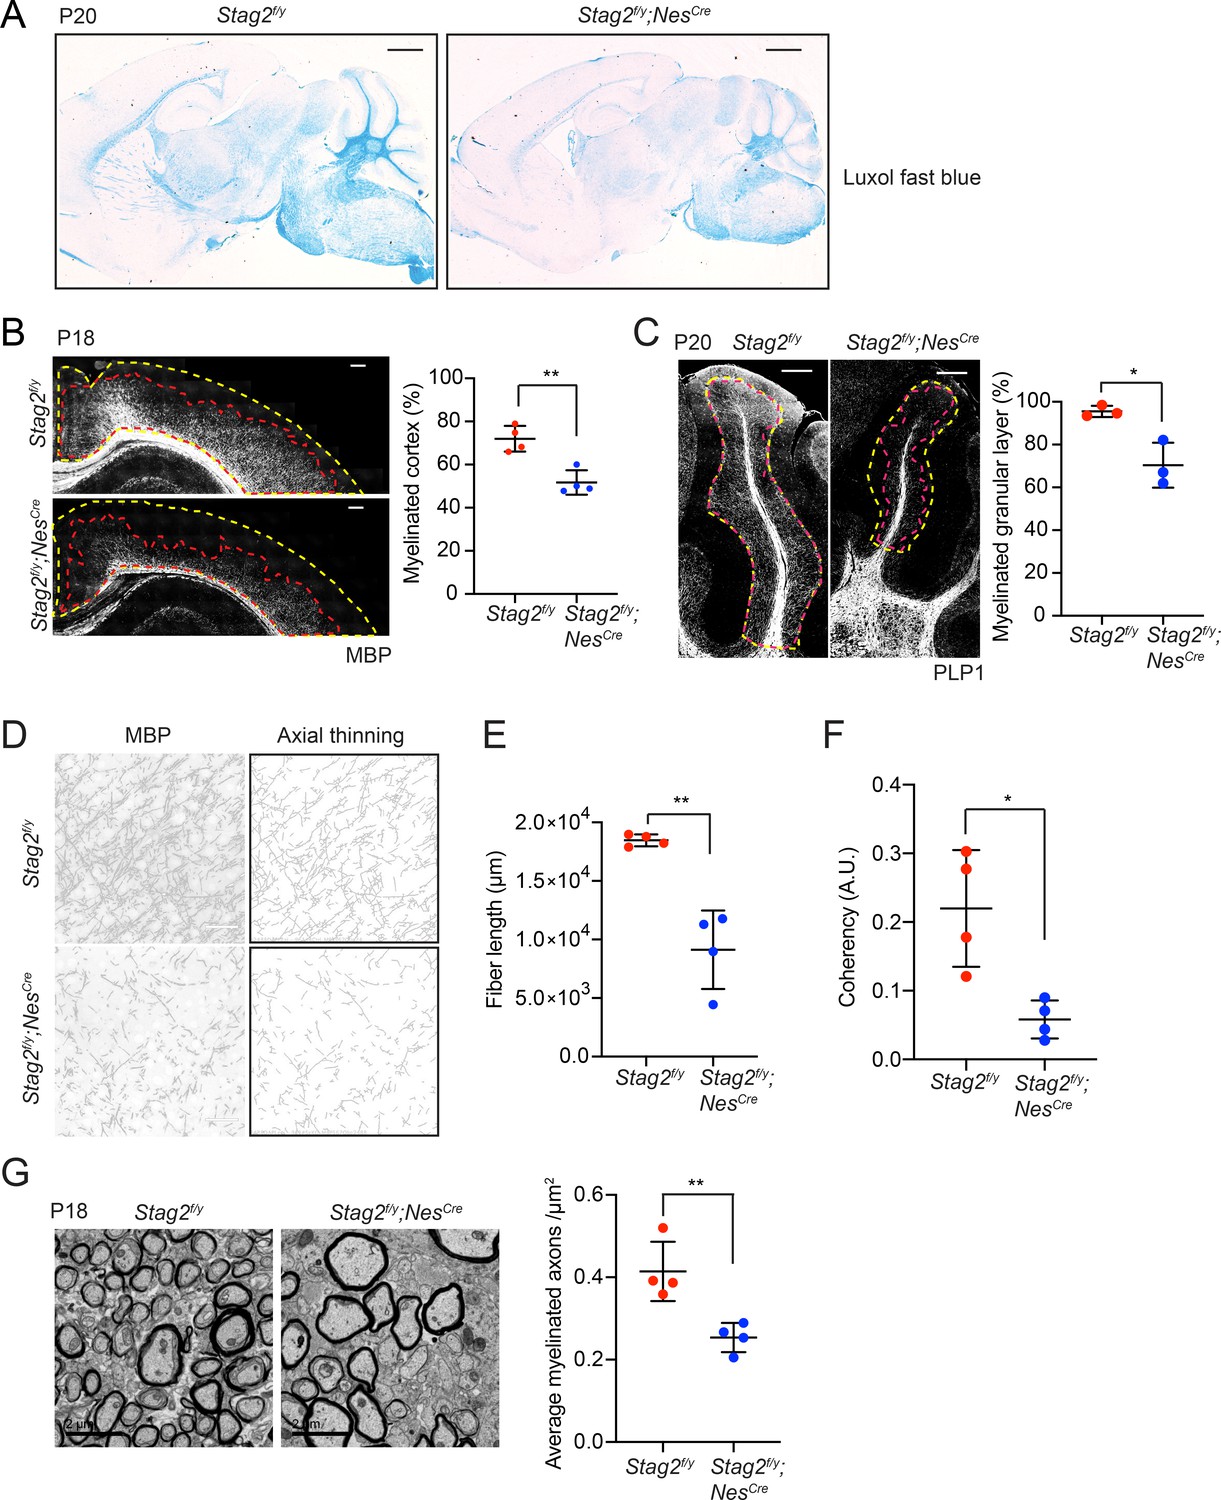
Stag2 ablation in the nervous system compromises myelination during early postnatal development.
(A) Luxol fast blue staining of the sagittal sections of Stag2f/y and Stag2f/y;NesCre brains. n = 3 animals per genotype. Scale bar = 1 mm. (B) Immunohistochemistry staining with the anti-MBP antibody in the cerebral cortex (left panel). Antibody-stained areas and DAPI staining regions are marked with red and yellow dashed lines, respectively. Scale bar = 200 μm. Quantification of the percentage of the myelinated cortex is shown in the right panel. n = 4 pairs of Stag2f/y and Stag2f/y;NesCre littermates were used (P18 or P21) for the comparison. **p < 0.01; mean ± standard deviation (SD). (C) Immunohistochemistry staining with the anti-PLP1 antibody in the cerebellum (left panel). Antibody-stained areas and DAPI staining regions are marked with red and yellow dashed lines, respectively. Scale bar = 200 μm. Quantification of the percentage of the myelinated cerebellum granular layer is shown in the right panel. n = 3 pairs of Stag2f/y and Stag2f/y;NesCre littermates were used (P20 or P25) for the comparison. *p < 0.05; mean ± SD. (D) Higher magnification images (left panel) of the immunohistochemistry staining with the anti-MBP antibody in (B). Images processed through axial thinning are shown in the right panel. Scale bar = 50 μm. Total fiber length (E) and fiber coherency (F) measured using the processed images in (D). n = 4 pairs of Stag2f/y and Stag2f/y;NesCre littermates were used (P18 or P21). *p < 0.05, **p < 0.01; mean ± SD. (G) Transmission electron microscopy images of the optic nerves (left panel). Scale bar = 2 μm. Quantification of myelinated axon distributions is shown in the right panel. n = 4 pairs of P18 Stag2f/y and Stag2f/y;NesCre littermates were used. n ≥ 10 fields of each mouse were taken, and the average distribution of myelinated axons were calculated for each mouse and plotted. **p < 0.01; mean ± SD.
Figure 3—figure supplement 1
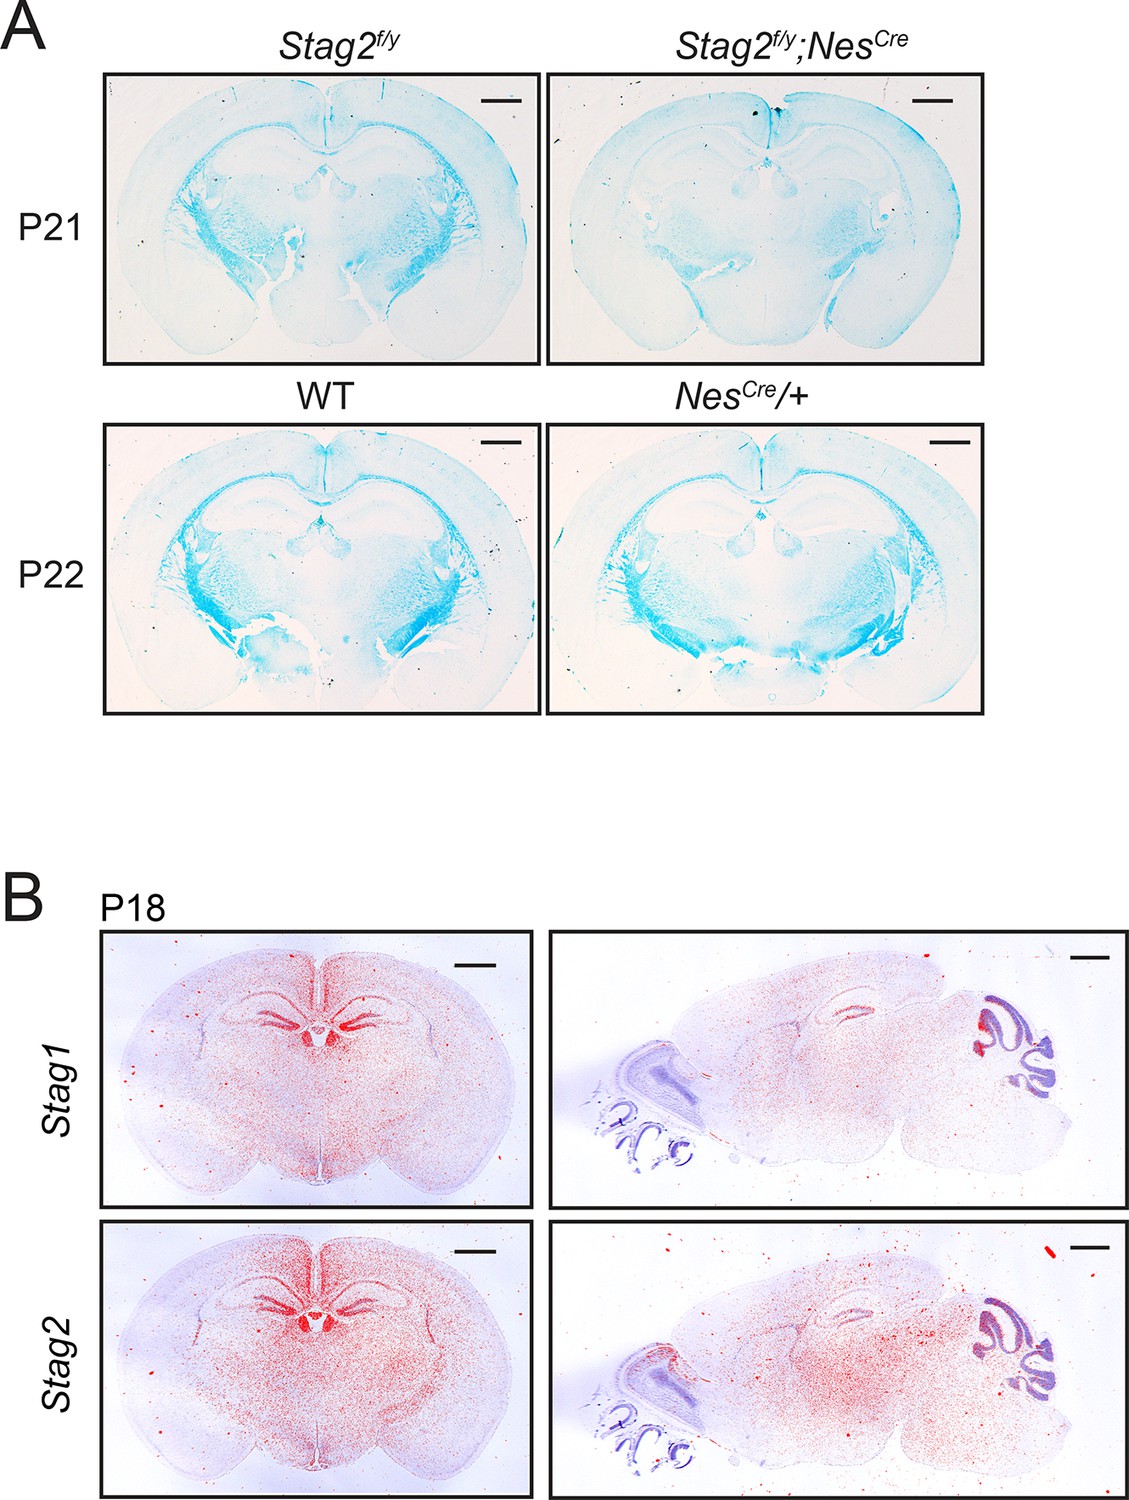
Brain-specific Stag2 deletion impairs central nervous system (CNS) myelination.
(A) Luxol fast blue staining of the coronal brain sections of mice with the indicated genotypes. n = 3 mice each for Stag2f/y and Stag2f/y;NesCre genotypes. n = 2 mice each for wild-type (WT) and NesCre/+ groups. animals per genotype. Scale bar = 1 mm. (B) In situ hybridization of 35S-labeled RNA probes of the coronal (left) and sagittal (right) sections of WT mouse brains. Bright field images (purple) were overlaid with autoradiography images (red). Scale bar = 1 mm.
Figure 4 with 6 supplements
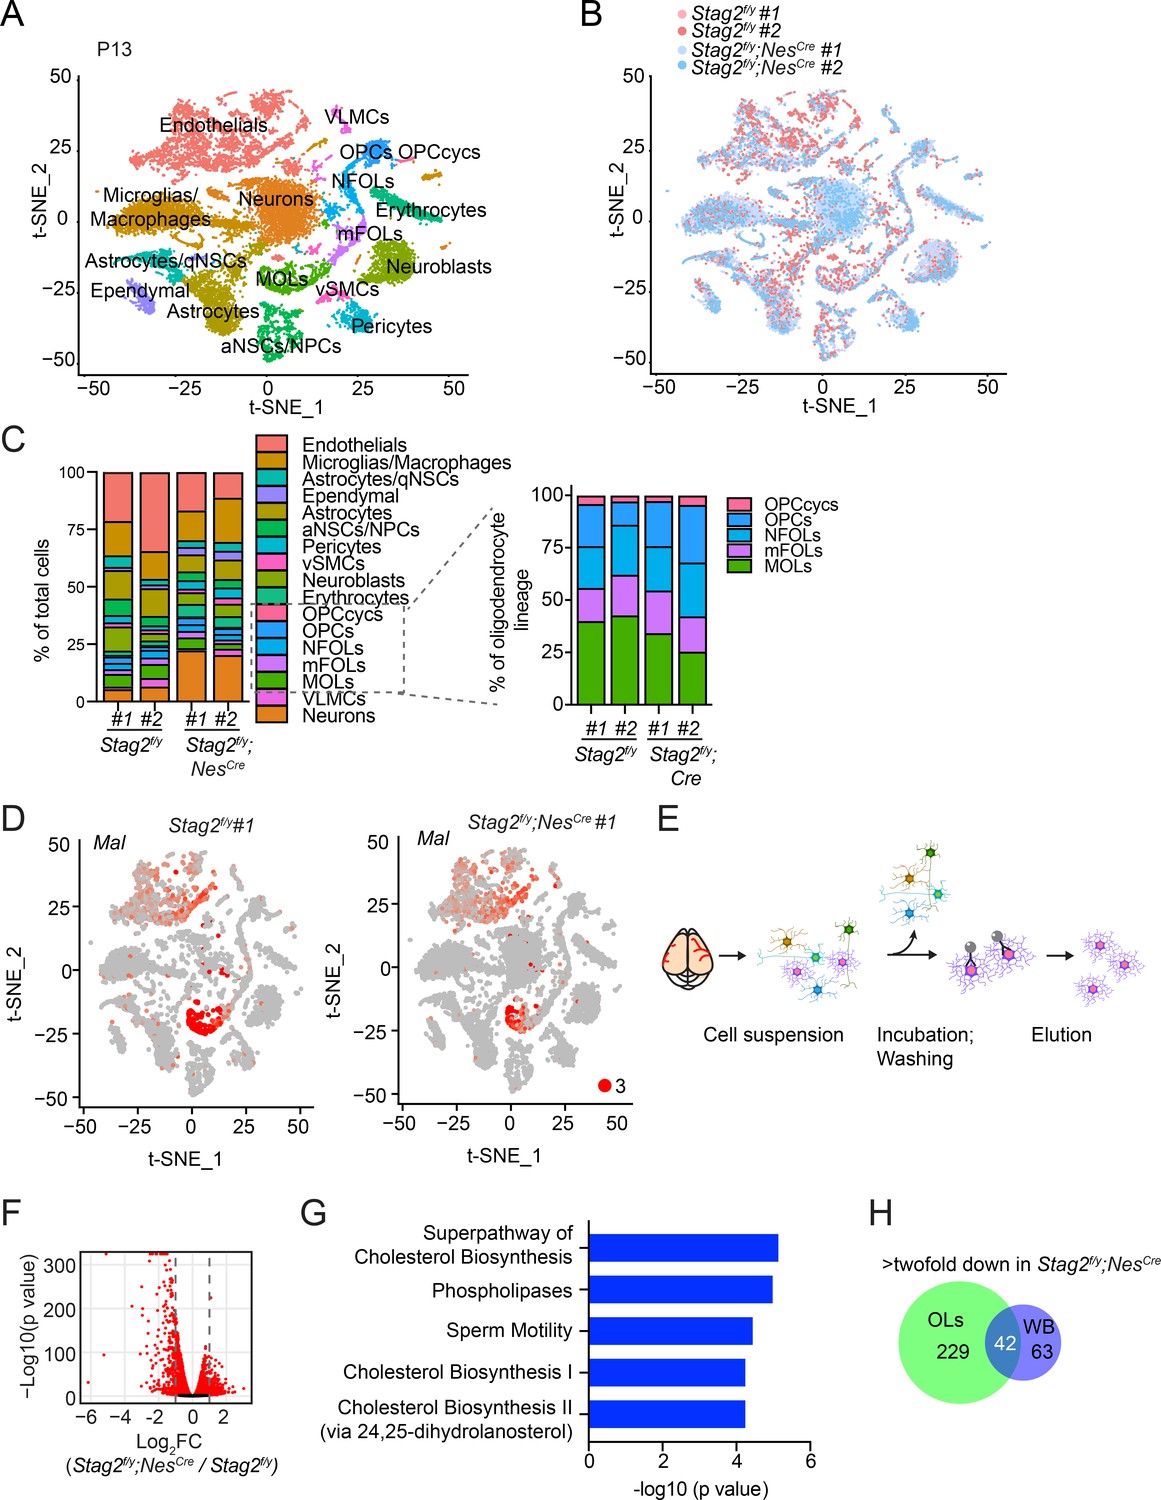
Deletion of Stag2 in mouse brains causes differentiation delay and transcriptional changes in oligodendrocytes.
(A) t-SNE plot of cell clusters in Stag2f/y and Stag2f/y;NesCre forebrains analyzed by single-cell RNA-sequencing (scRNA-seq). n = 2 mice of each genotype were used in the scRNA-seq analysis. aNSCs/NPCs, active neural stem cells or neural progenitor cells; Astrocytes/qNSCs, astrocytes or quiescent neural stem cells; OPCcycs, cycling oligodendrocyte (OL) progenitor cells; OPCs, OL progenitor cells; NFOLs, newly formed OLs; mFOLs, myelin-forming OLs; MOLs, matured OLs; VLMCs, vascular and leptomeningeal cells; vSMCs, vascular smooth muscle cells. (B) t-SNE clustering as in (A) but colored by genotype. (C) Left panel: cell-type composition and percentage as colored in (A). Right panel: percentage of cell clusters of the oligodendrocyte lineage. (D) FeaturePlot of a representative gene (Mal) specifically suppressed in MOLs of Stag2f/y;NesCre forebrains. A maximum cutoff of 3 was used. (E) Experimental scheme of the magnetic-activated cell sorting (MACS) of primary OLs. (F) Volcano plot of bulk RNA-sequencing (RNA-seq) results of Stag2f/y and Stag2f/y;NesCre primary OLs. (G) The top 5 canonical pathways identified by ingenuity pathway analysis (IPA) of the differentially expressed genes (DEGs) with more than twofold change in (F). The complete gene list is used as the background. (H) Commons DEGs shared between bulk RNA-seq analyses of the whole brains (WB) and primary OLs.
Figure 4—figure supplement 1
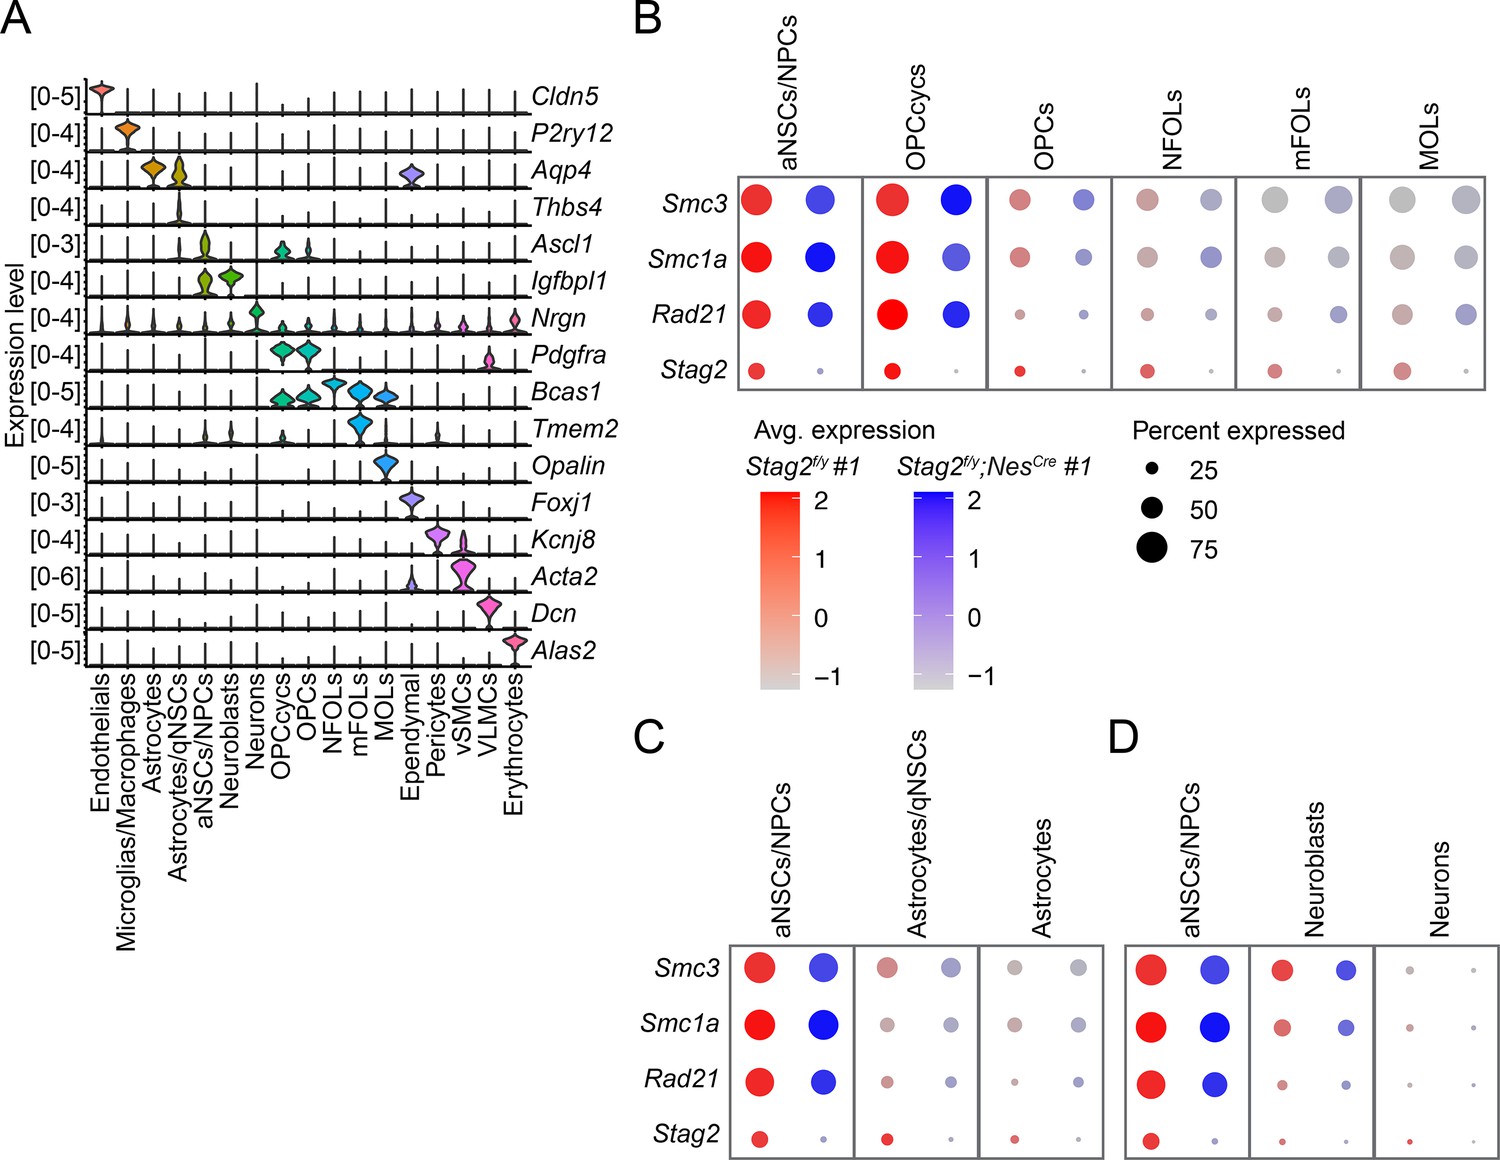
Stag2 is ablated during early neural lineage differentiation of Stag2 knockout mice.
(A) Violin plot of the expression levels of feature genes of the indicated brain cell types. Dotplot showing the expression levels of cohesin subunit genes in the oligodendrocyte lineages (OLs; B), astrocytes (C), and neurons (D) and in the progenitor cells. Stag2 expression is greatly diminished in the neuronal stem cells (NSCs) or neuronal progenitor cells (NPCs).
Figure 4—figure supplement 2
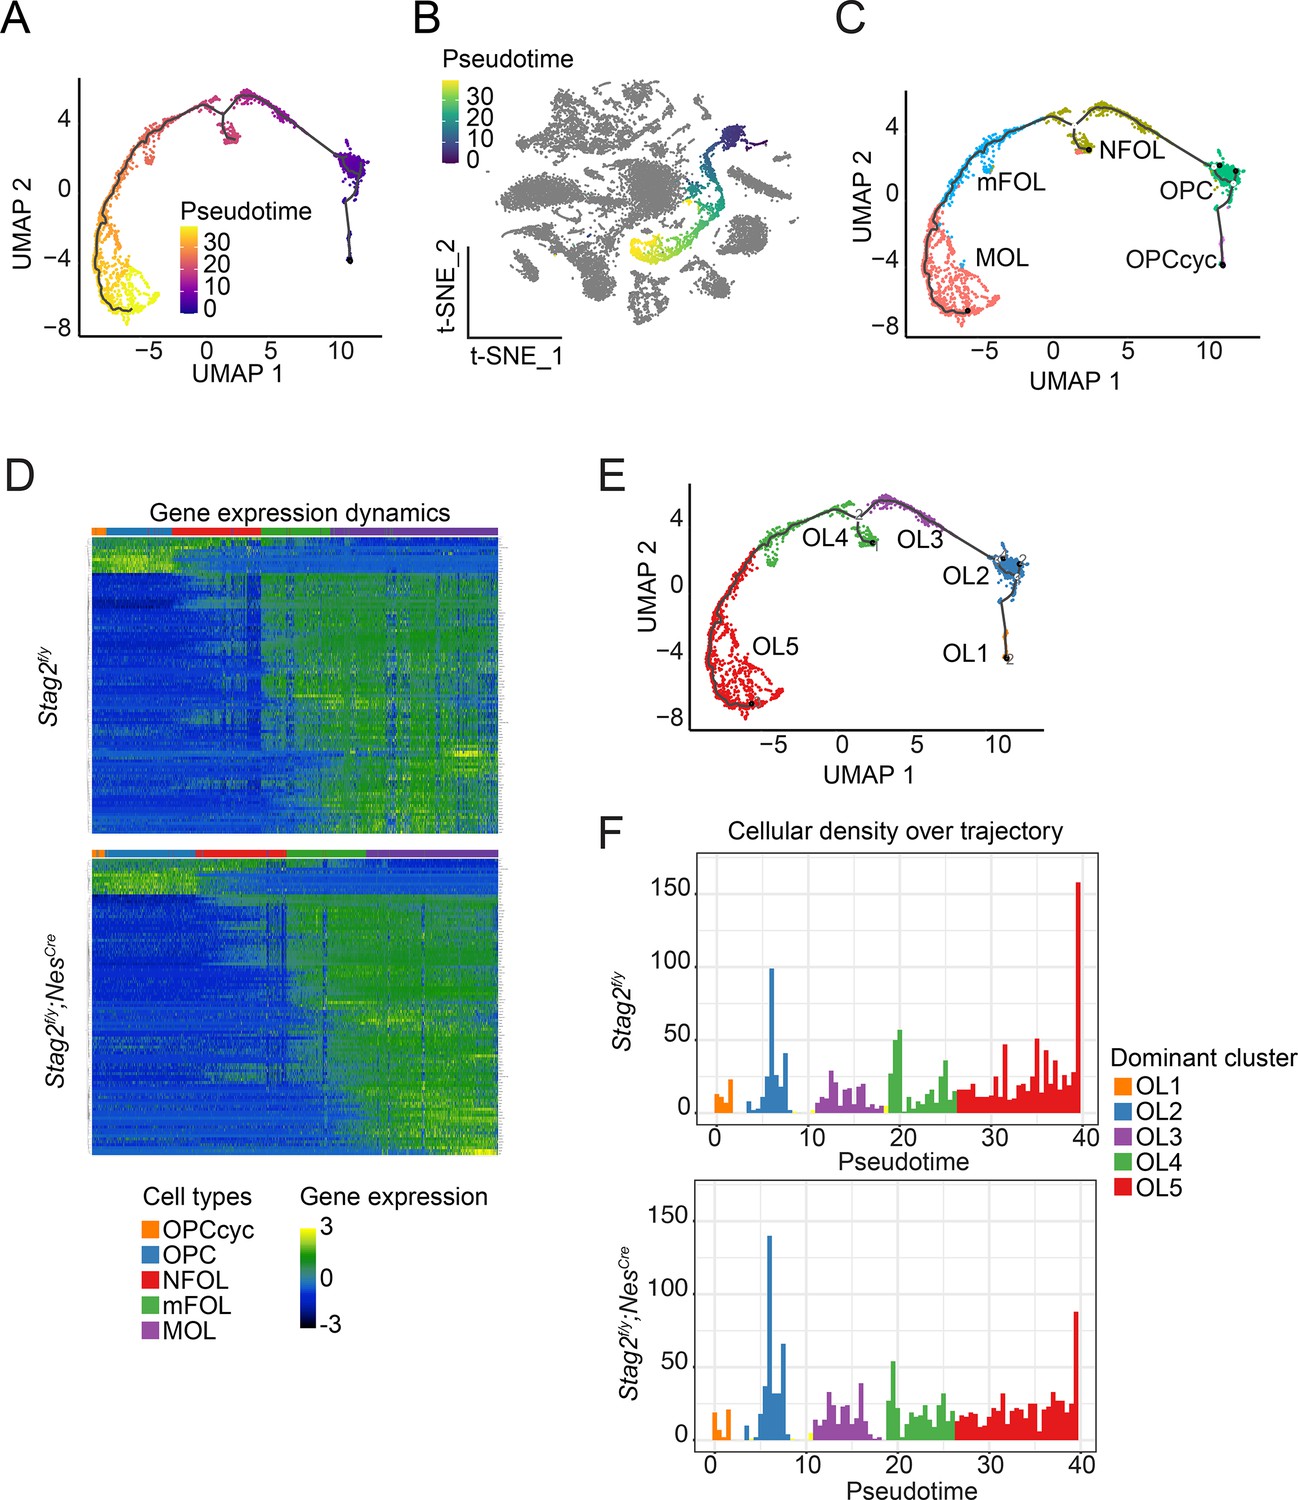
Stag2 deletion causes differentiation delay in the oligodendrocyte lineage.
(A) Trajectory inference analysis of oligodendrocyte (OL) lineage cells extracted from the single-cell RNA-sequencing (RNA-seq) dataset using Monocle3. Cells are colored from purple to yellow by pseudotime variables. (B) OL differentiation trajectory in the t-SNE plot. The OL lineage is colored from navy blue to yellow by pseudotime variables. Cells of other lineages are colored grey. (C) Distribution of the assigned OL cell types along the trajectory. (D) Heatmap of gene expression dynamics over pseudotime along the OL differentiation trajectory. Each row represents one of the top 100 most variable genes along pseudotime. Each column represents a single cell. (E) Reclustered OL subgroups in the trajectory inference analysis. (F) Cell density across pseudotime for the OL differentiation trajectory. Dominant clusters for each pseudotime bin are color labeled as in (E).
Figure 4—figure supplement 3
STAG2 regulates the transcription of oligodendrocyte genes.
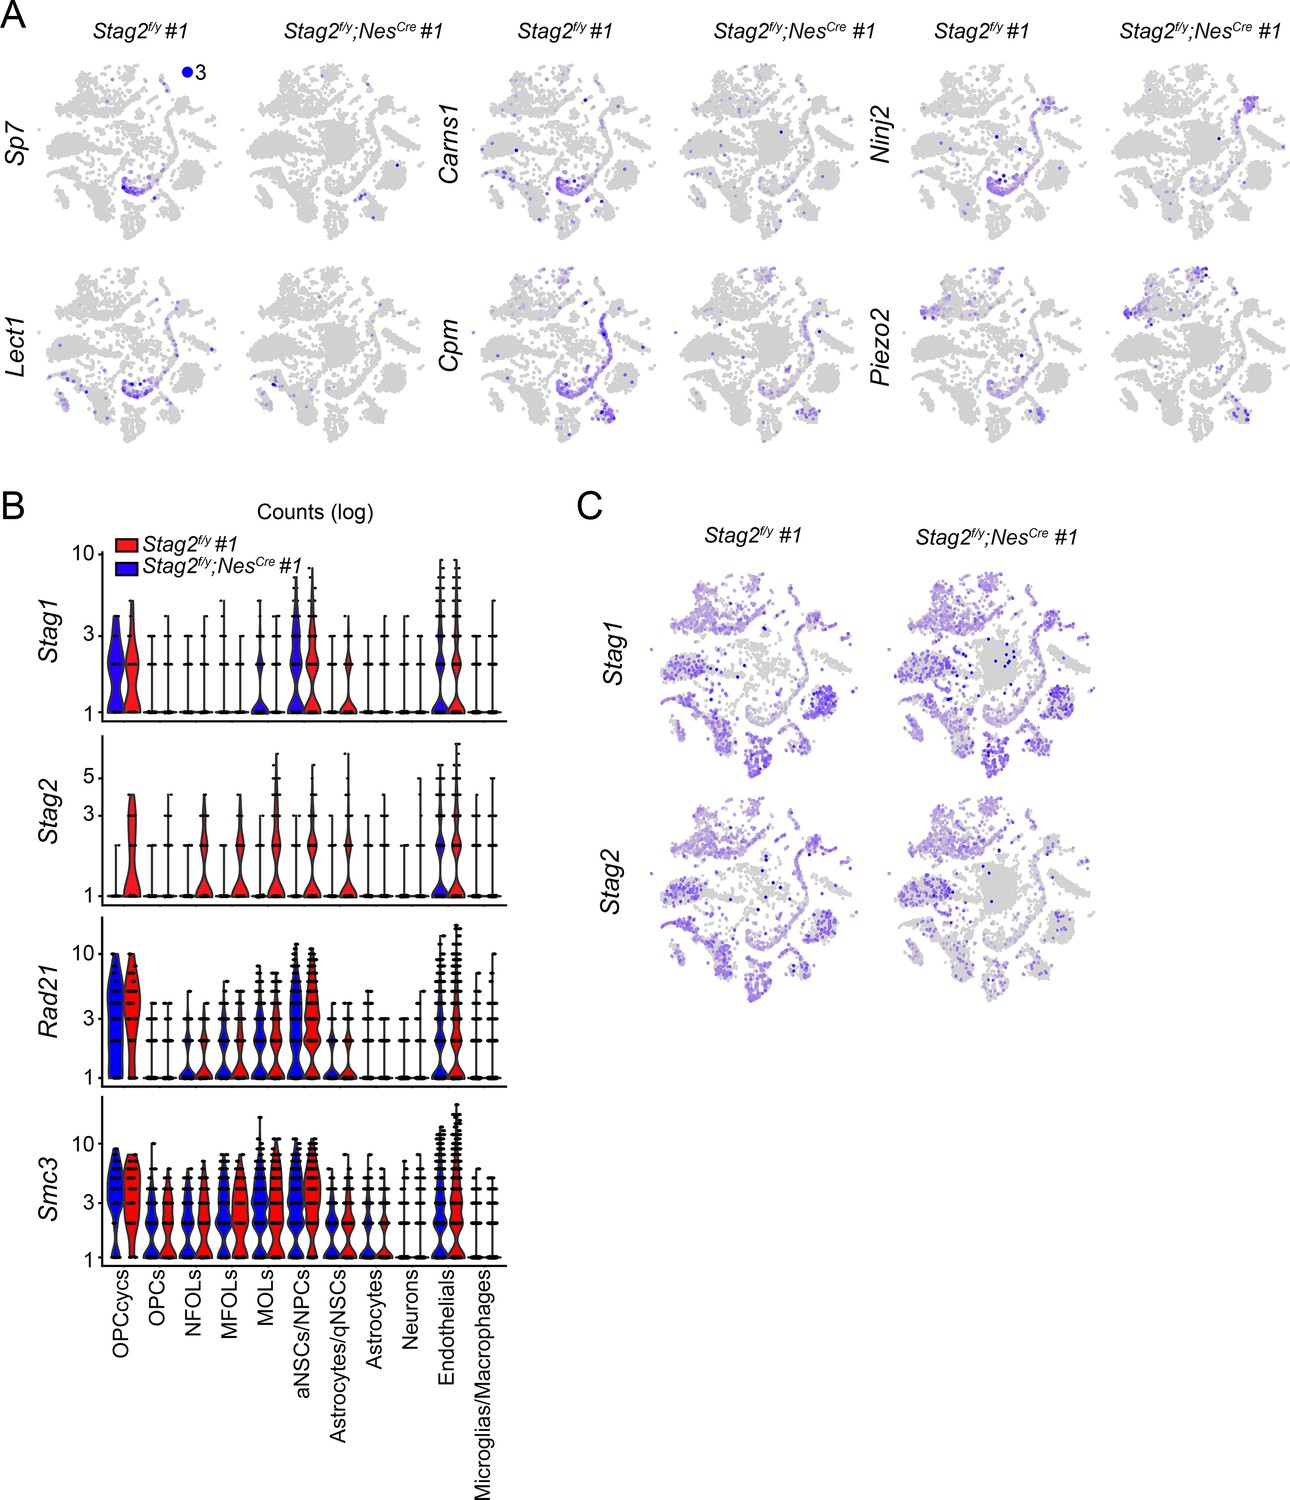
(A) FeaturePlot of the expression levels of representative downregulated genes in the Stag2f/y;NesCre whole brains. Maximum cutoff of 3 was used. (B) Violin plot of the expression of cohesin subunit genes in the indicated brain cell types from the single-cell RNA-sequencing (scRNA-seq) transcriptome analysis. (C) FeaturePlot of the expression of Stag1 and Stag2 in Stag2f/y and Stag2f/y;NesCre forebrains. Maximum cutoff of 3 was used.
Figure 4—figure supplement 4
STAG2 regulates transcription in primary oligodendrocytes.
(A) The expression levels of signature genes of indicated brain cell types in the isolated primary oligodendrocytes (OLs) in this study. The expression levels of the same set of signature genes in the individually isolated cell types from previous studies are shown below. NFOL and mFOL signature genes are highly enriched in the isolated primary OLs in this study. (B) Boxplot of the expression levels for genes in the indicated categories. Red dots represent the mean values. ***p < 0.001. Differentially expressed genes (DEGs) with more than 1.5-fold change are assigned as ‘down’ or ‘up’. Active genes with logFC between ±0.38 are assigned ‘stable’. (C) Violin plot of the expression changes for the active genes with different expression levels. Red dots represent the mean value. ***p < 0.001. (D) Scatter plot of the gene expression level against transcriptional changes. DEGs of the indicated categories are highlighted in red and blue.(E) Ingenuity pathway analysis (IPA) of the downregulated gene sets. The top 5 canonical pathways identified from IPA analysis of the downregulated genes in Stag2-deleted OLs. Downregulated genes with >twofold change were included in the analysis.
Figure 4—figure supplement 5
Over-representation analysis (ORA) of the downregulated genes in Stag2-deleted oligodendrocytes.
(A) The enriched biological pathways identified from the downregulated genes with >twofold change in the Stag2-deleted primary oligodendrocytes. The top 20 pathways with the highest gene ratio are presented. (B) Treeplot of the top 30 enriched biological pathways identified as in (A). Pathways are grouped and colored by similarity. (C) Overlapped genes among the enriched biological pathways. Bar graph shows the number of overlapped genes among biological pathways. (D) Heatmap of the top enriched biological pathways and the expression change of related genes.
Figure 4—figure supplement 6
Over-representation analysis (ORA) of the upregulated genes in Stag2-deleted oligodendrocytes.
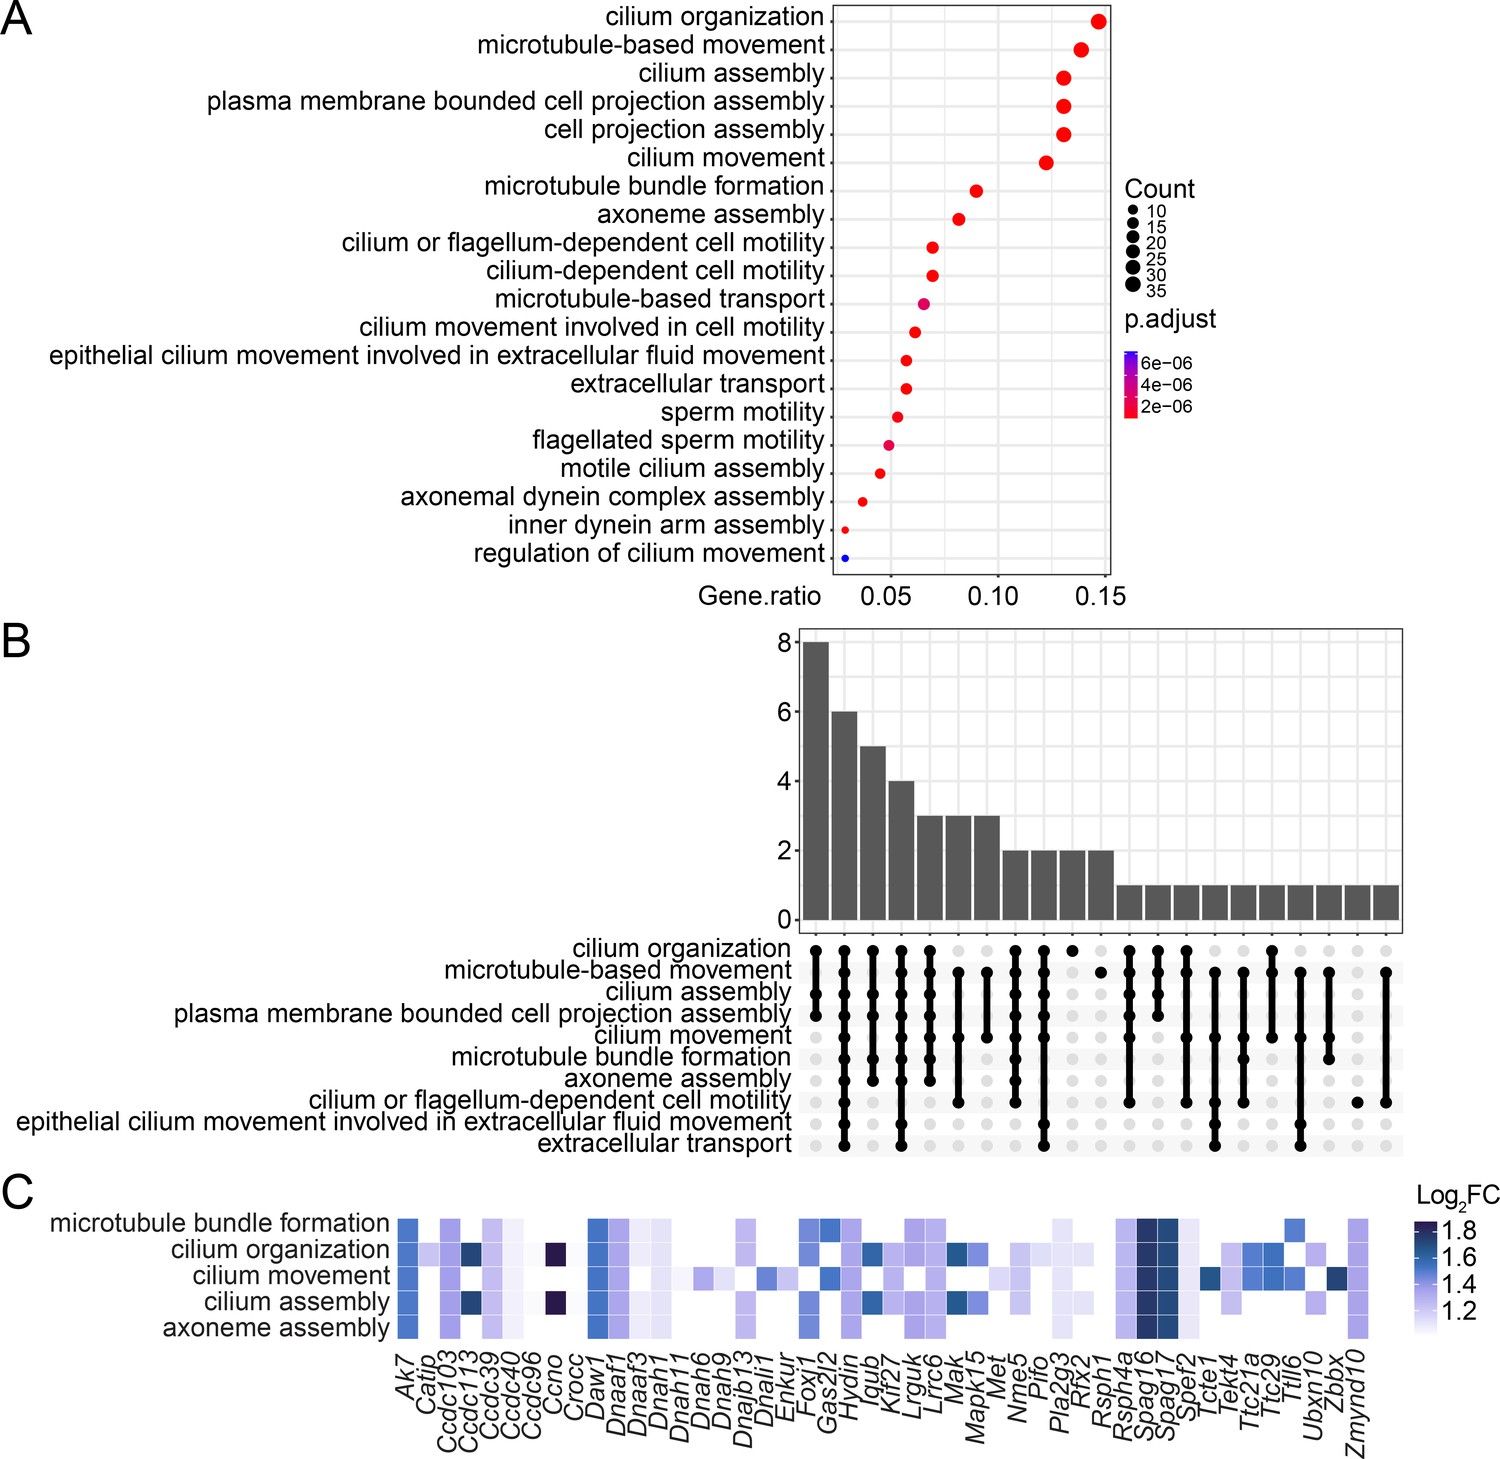
(A) The enriched biological pathways identified from the upregulated genes with >twofold change in the Stag2-depleted primary oligodendrocytes. The top 20 pathways with the highest gene ratio are presented. (B) Overlapped genes among the enriched biological pathways. Bar graph shows the number of overlapped genes among biological pathways. (C) Heatmap of the top enriched biological pathways and the expression change of related genes.
Figure 5 with 1 supplement
Enrichment of STAG2 and histone modifications at gene promoters.
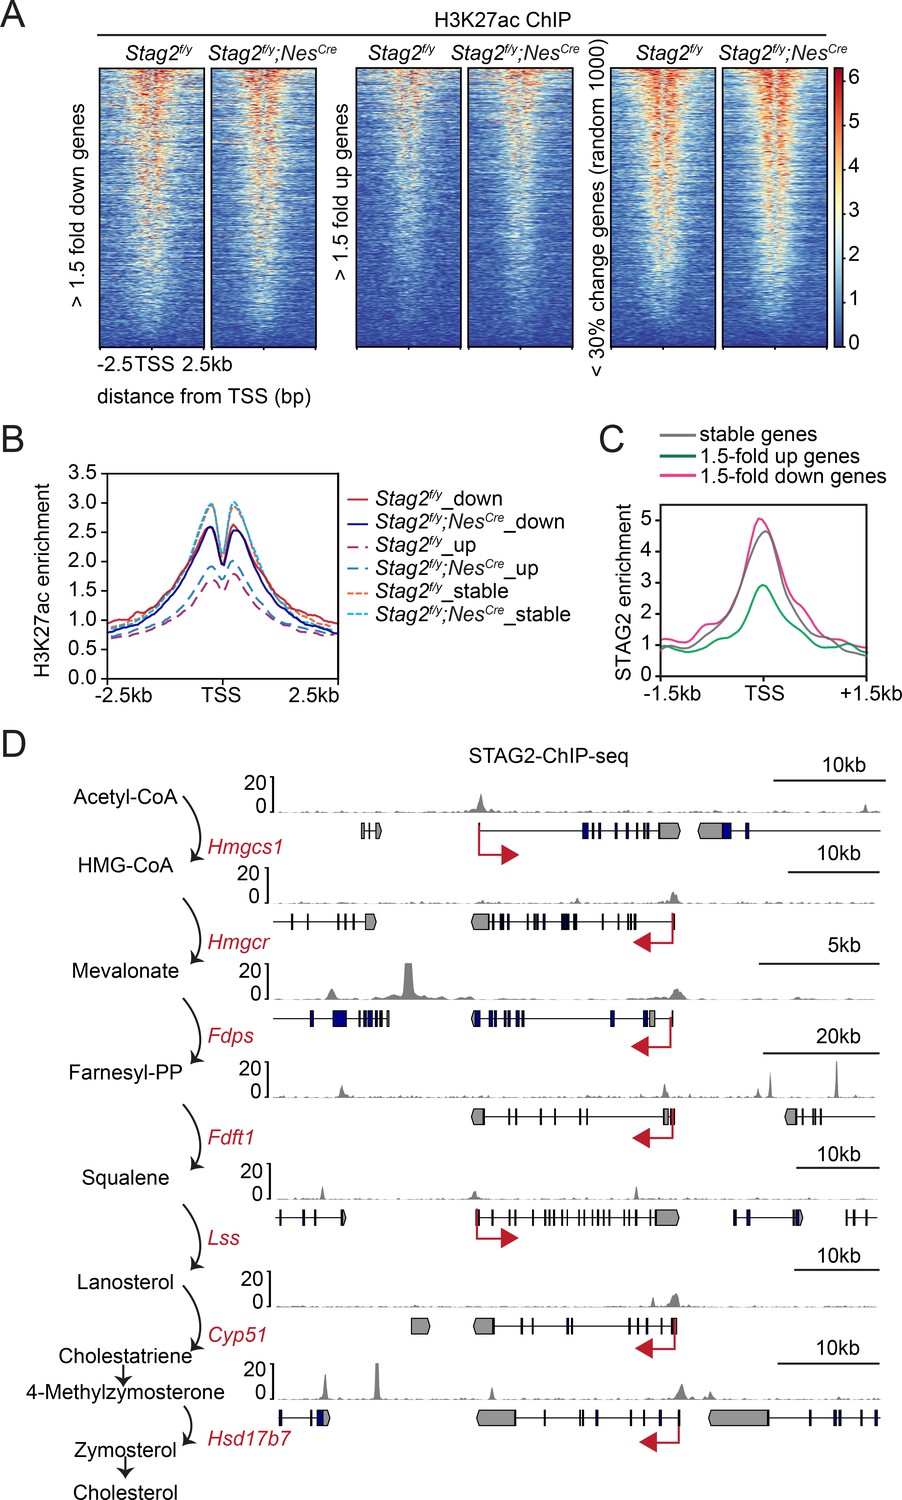
(A) Heatmap of H3K27ac chromatin immunoprecipitation sequencing (ChIP-seq) signal enrichment in the promoter regions of genes in the indicated categories. (B) Density profile of H3K27ac ChIP-seq signal enrichment in the promoter regions of genes in the indicated categories as in (A). (C) Density profile of STAG2 ChIP-seq signal enrichment in the promoter regions of genes in the indicated categories as in (A). (D) Binding of STAG2 at the genomic loci of downregulated genes that encode cholesterol biosynthetic enzymes as revealed by ChIP-seq.
Figure 5—figure supplement 1
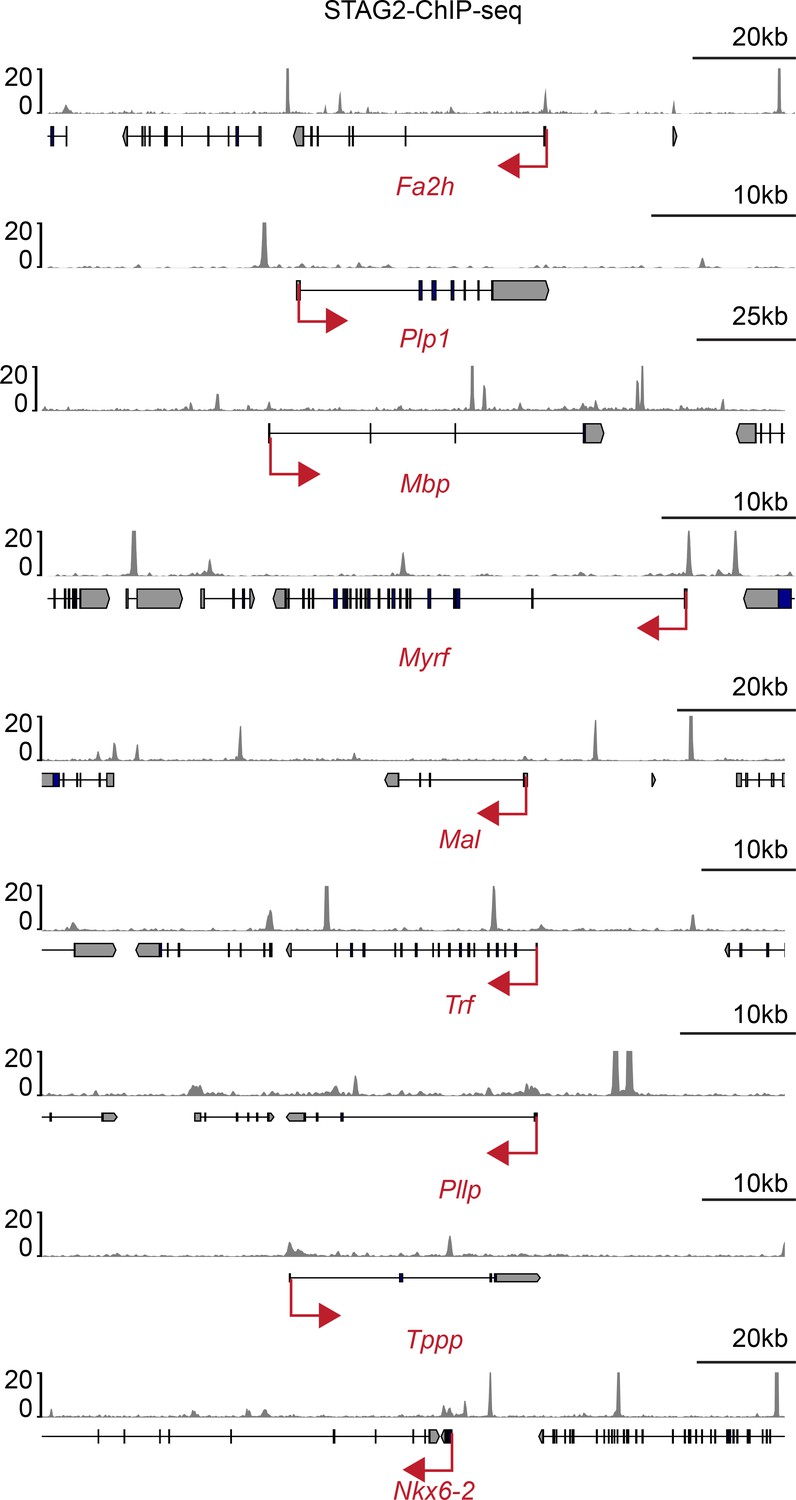
STAG2 occupies the promoters of myelination genes.
Tracks of STAG2 binding at the genomic loci of the downregulated myelination genes. Red arrows indicate the transcription direction.
Figure 6 with 1 supplement
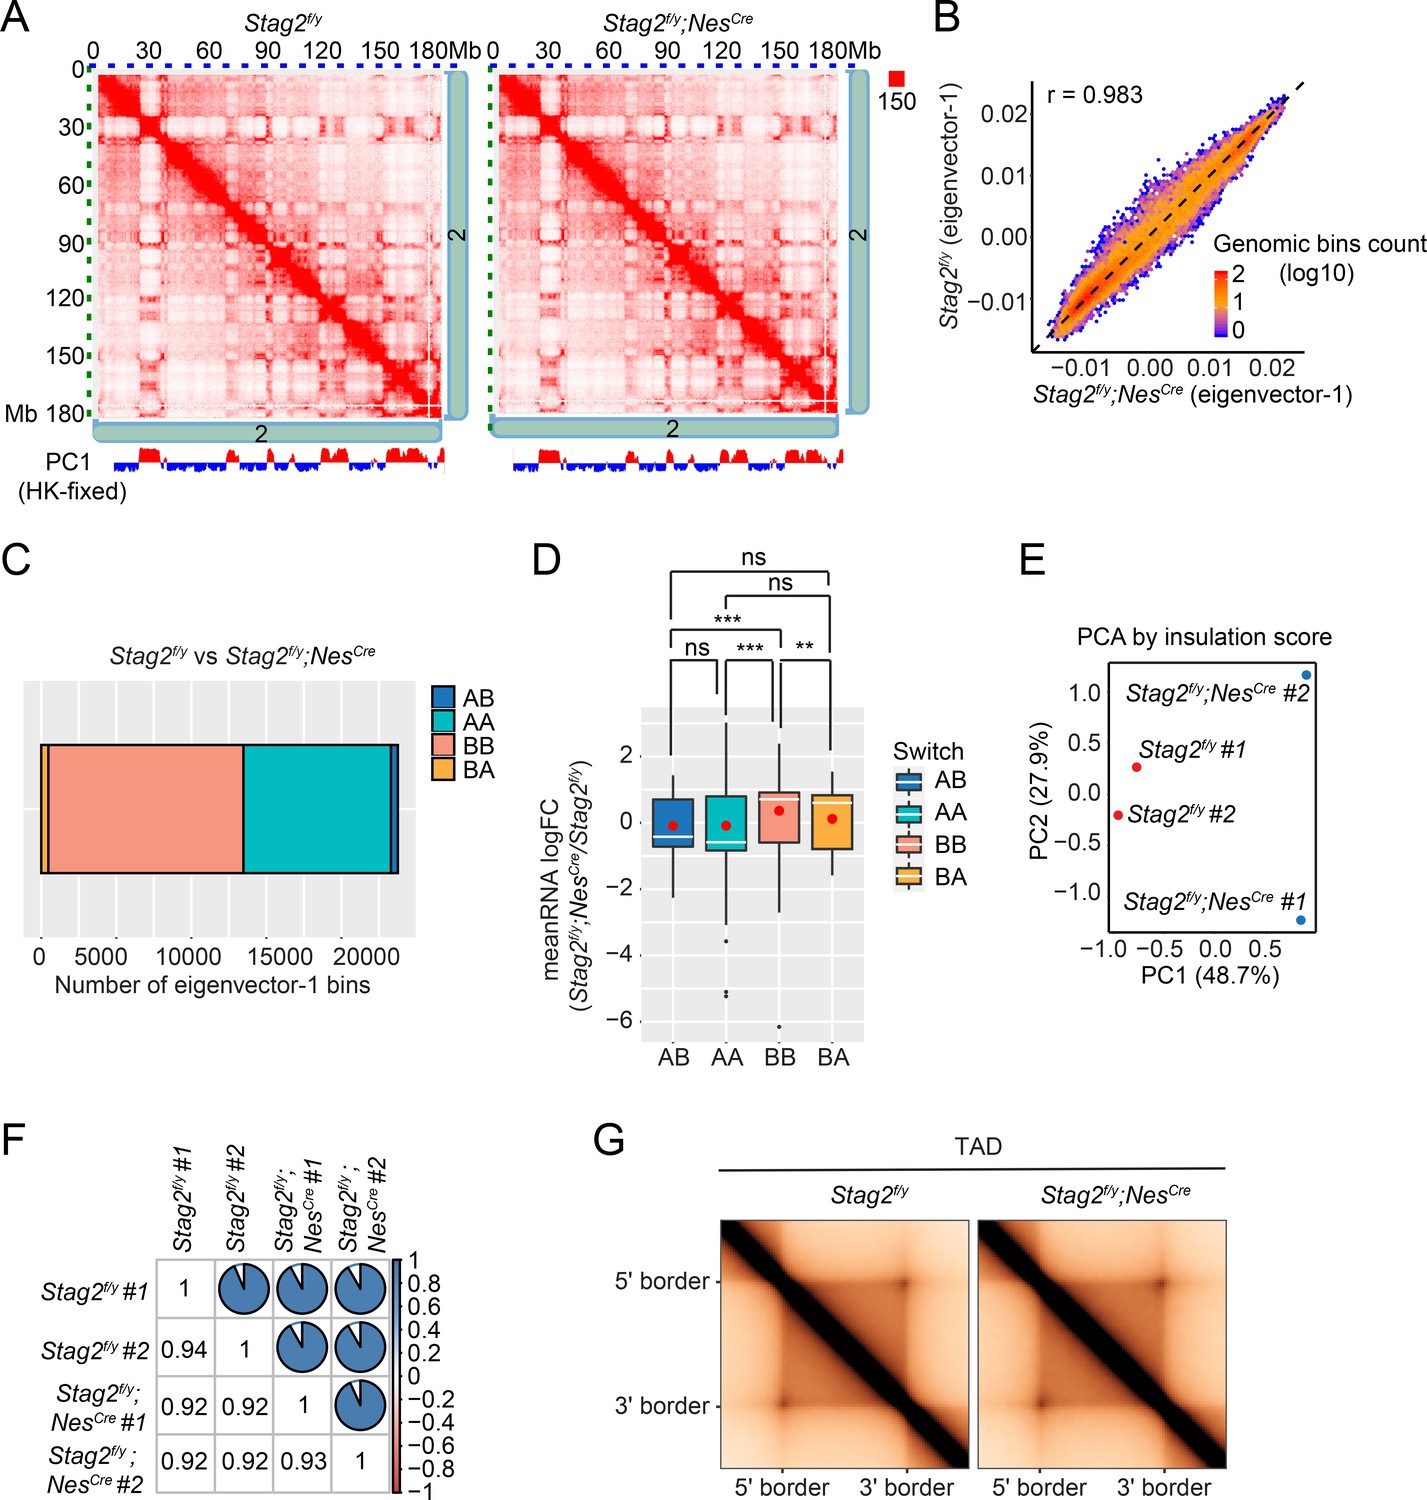
Loss of Stag2 does not alter compartments and topologically associated domains (TADs) in oligodendrocytes.
(A) Representative snapshots of balanced Hi-C contact matrices of chromosome 2. Tracks of eigenvector-1 fixed with housekeeping genes are shown below, with A and B compartments shown in red and blue, respectively. (B) Hexbin plot of eigenvector-1 for genomic bins (100 kb) in Stag2f/y and Stag2f/y;NesCre oligodendrocytes (OLs). (C) Chromatin bins were classified into four categories based on the eigenvector sign and whether it has switched with a delta bigger than 1.5. AB, changing from compartment A in Stag2f/y to compartment B in Stag2f/y;NesCre; BA, from B in Stag2f/y to A in Stag2f/y;NesCre; AA, A in both Stag2f/y and Stag2f/y;NesCre; BB, B in both Stag2f/y and Stag2f/y;NesCre. (D) Boxplot of averaged gene expression change of differentially expressed genes (DEGs) (RNA logFC cutoff of ±0.58) inside each genomic bin. Bins counted: AA, 1646; AB, 56; BA, 69; BB, 910. Red dots represent the mean value. An unpaired Wilcoxon test was used for the statistical analysis. **p < 0.01; ***p < 0.001; ns, not significant. Principal component (E) and similarity (F) analysis performed using the insulation score at 10 kb resolution. (G) Aggregate TAD analysis on the 10 kb merged Hi-C matrices using TADs called from the merged samples of Stag2f/y at 10 kb resolution.
Figure 6—figure supplement 1
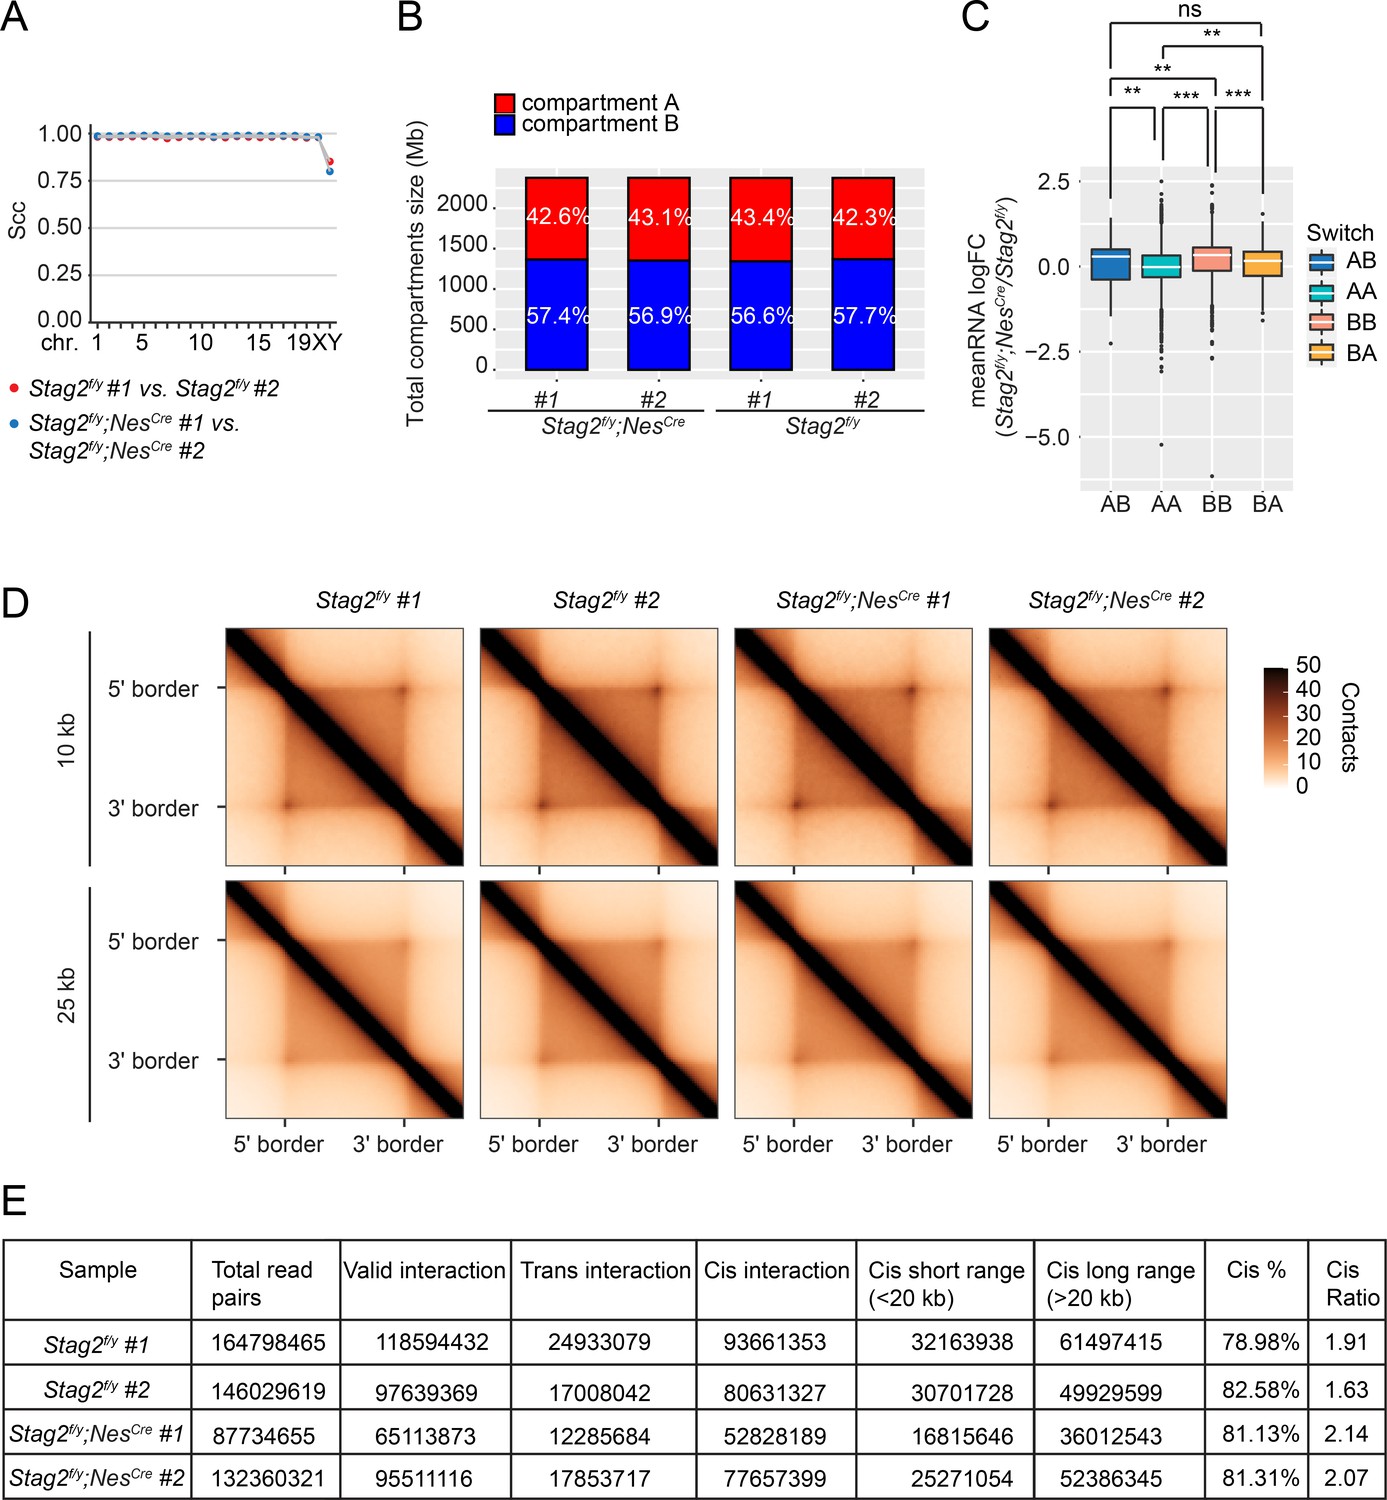
Stag2-deleted OLs do not present significant changes in compartments and topologically associated domains (TADs).
(A) HiCRep analysis for reproducibility of the Hi-C replicates. The stratum-adjusted correlation coefficient (SCC) is calculated for each pair of duplicates for all chromosomes at 25 kb resolution. (B) Compartment compositions of the indicated samples. (C) Boxplot of the average gene expression change for all the differentially expressed genes (false-discovery rate [FDR] <0.05) inside each genomic bin. Bins counted: AA, 5806; AB, 155; BA, 251; BB, 2659. The unpaired Wilcoxon test was used for the statistical analysis. **p < 0.01; ***p < 0.001; ns, not significant. (D) Aggregate TAD analysis on the replicates of 10 kb Hi-C matrices using TADs called from the merged samples of Stag2f/y at 10 or 25 kb resolution. (E) Hi-C sample statistics of total read pairs, valid pairs, and cis-pairs using HiC-Pro.
Figure 7 with 3 supplements
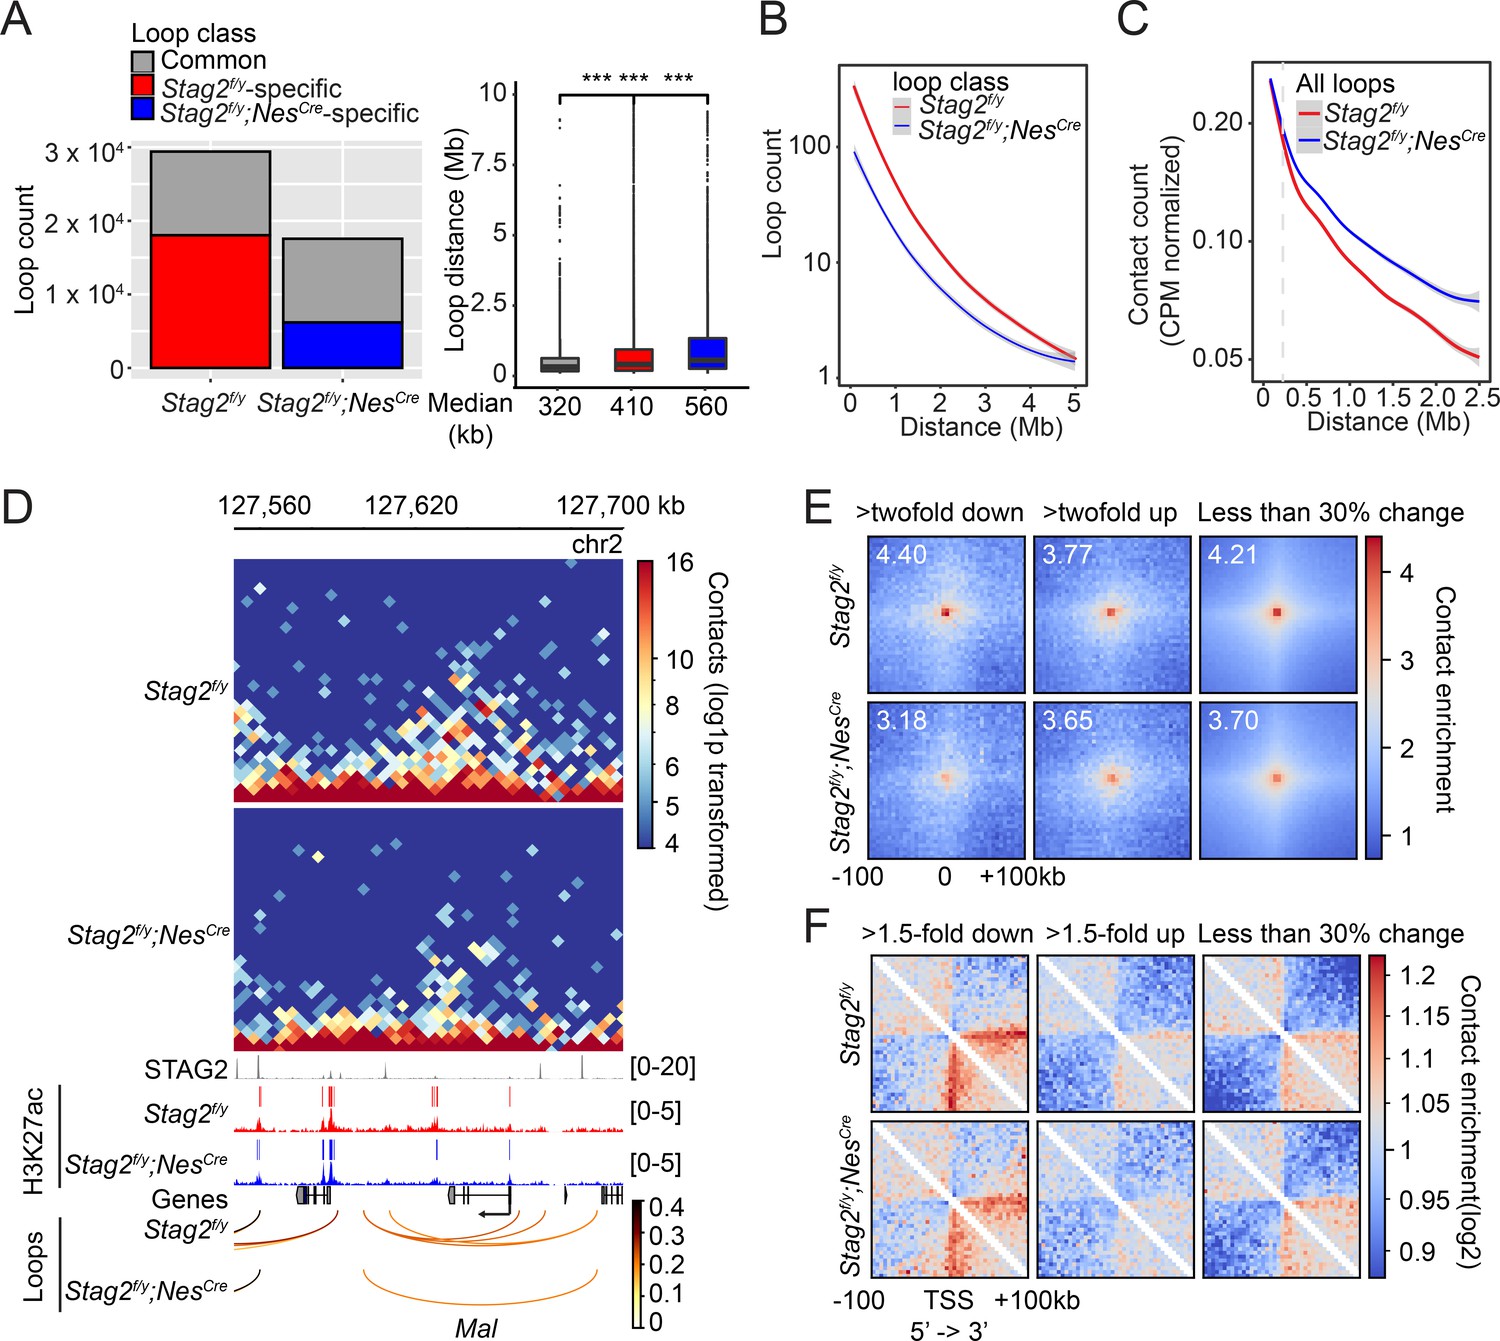
Stag2 deletion impairs the formation of total and promoter-anchored loops in oligodendrocytes.
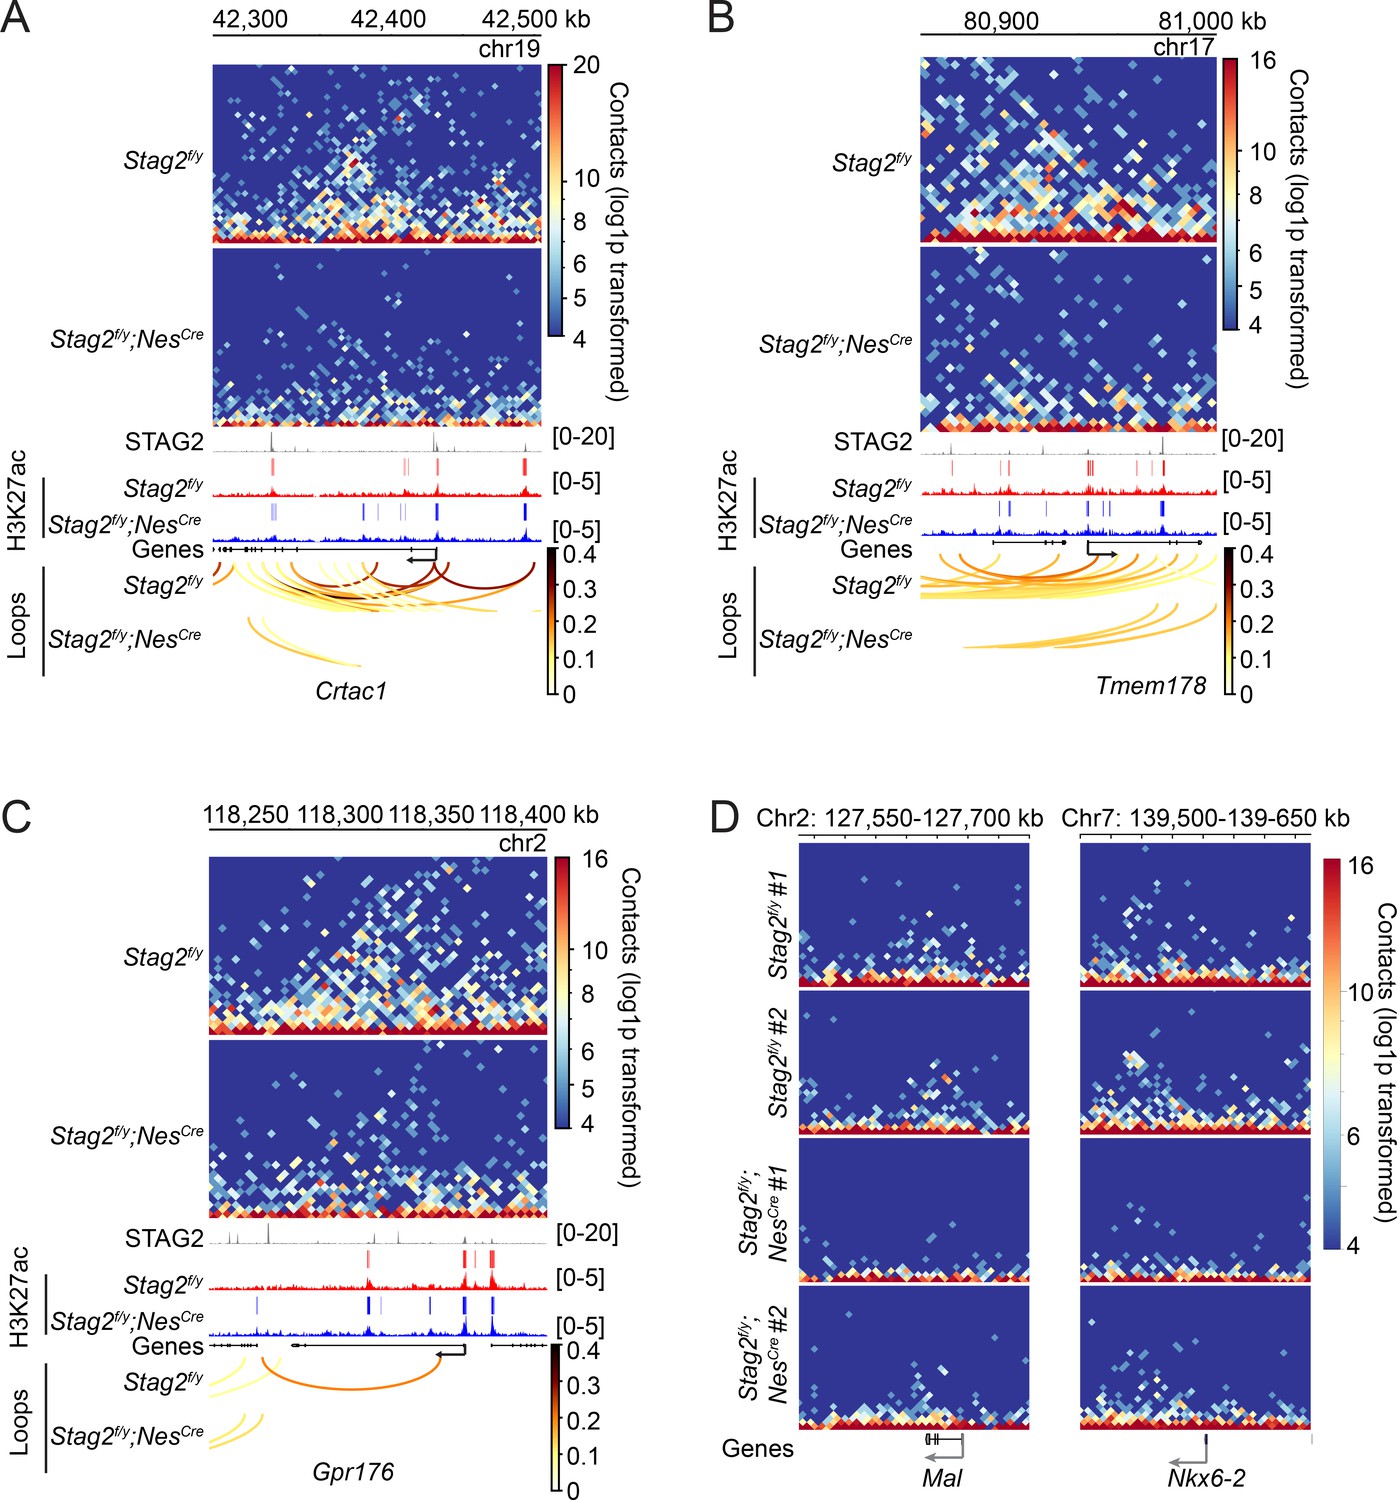
(A) Loop counts (left panel) and length (right panel) in the indicated categories of Stag2f/y and Stag2f/y;NesCre oligodendrocytes (OLs). ***p < 0.001. (B) Loop counts plotted against loop length (from 0 to 5 Mb) of Stag2f/y and Stag2f/y;NesCre OLs. (C) Normalized contact counts for loops across different genomic distances in Stag2f/y and Stag2f/y;NesCre OLs. (D) Representative snapshots of contact maps at the Mal gene locus.hic files generated by HiC-Pro were converted to.cool format for plotting at 5 kb resolution. Tracks and narrow peaks from STAG2 and H3K27ac chromatin immunoprecipitation sequencing (ChIP-seq) as well as the loops are plotted below. Transcription direction is indicated by the black arrow. (E) Pile-up analysis of loop ‘dots’-centered local maps for the promoter-anchored loops of genes in the indicated categories. The maps are balanced, normalized by distance, and plotted at 5 kb resolution. The numbers indicate the enrichment of the central pixel over the upper left and bottom right corners. (F) Pile-up analysis of the local contact maps centered around the transcription start site (TSS) of genes in the indicated categories. Transcription directions are indicated below. 1000 stable genes are chosen randomly and used for the analysis. The maps are balanced, normalized by distance, and plotted at 5 kb resolution. Diagonal pixels are omitted.
Figure 7—figure supplement 1
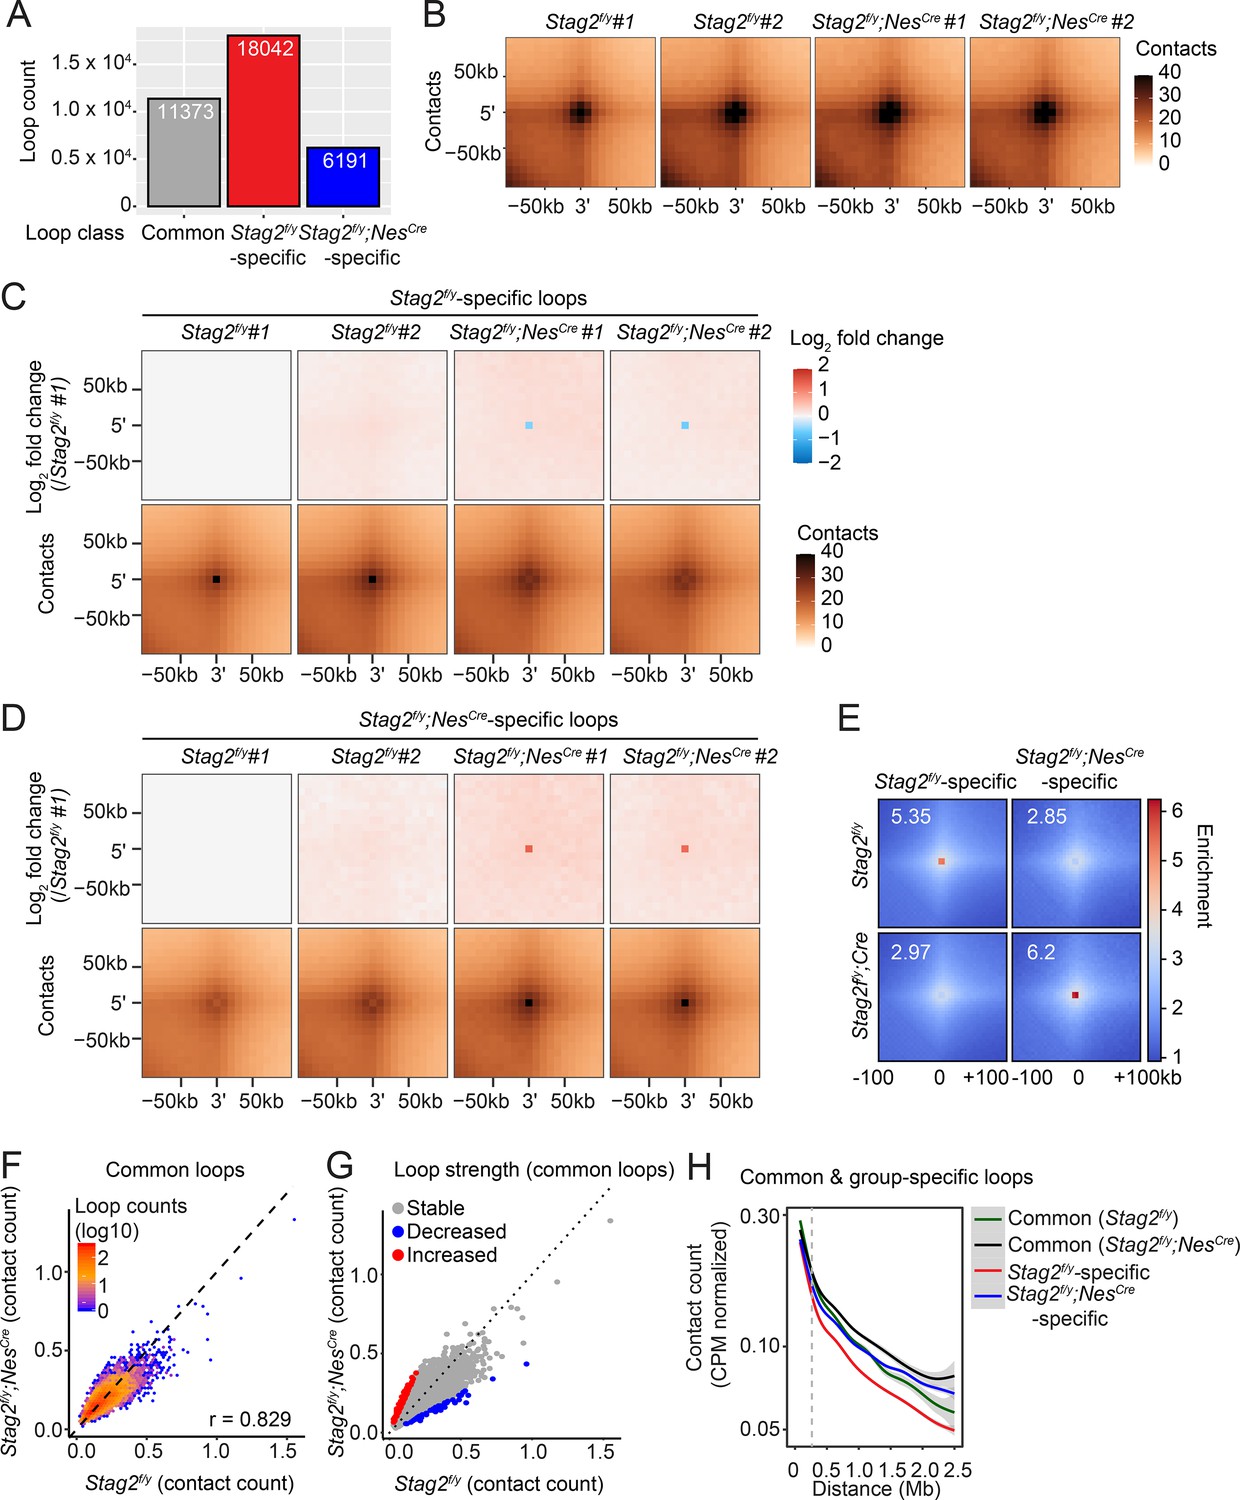
Stag2 deletion reduces chromatin loops in oligodendrocytes.
(A) Loop numbers of the indicated categories. (B) Aggregate peak analysis on the replicates of 10 kb Hi-C matrices using loops called from the merged samples of Stag2f/y or Stag2f/y;NesCre mice. Aggregate peak analysis performed on the replicates of 10 kb Hi-C matrices using the group-specific loops. Stag2f/y-specific loops are used in (C) and Stag2f/y;NesCre-specific loops are used in (D). The log2 fold change over Stag2f/y #1 is plotted on the top panels. (E) Pile-up analysis of loop ‘dots’-centered local contact maps for loops specific to Stag2f/y or Stag2f/y;NesCre oligodendrocytes (OLs). (F) Hexbin plot of contact counts of common loops in Stag2f/y and Stag2f/y;NesCre OLs. (G) Scatter plot of contact counts of common loops in Stag2f/y and Stag2f/y;NesCre OLs. Loops with significantly changed strength in Stag2f/y;NesCre OLs are highlighted in red (increased) and blue (decreased). Log2FC threshold of 1 was used. (H) Normalized contact counts for loops in the indicated categories across different genomic distances.
Figure 7—figure supplement 2
STAG2 controls local chromatin looping at differentially expressed genes.
(A–C) Snapshots of the contact maps at the indicated differentially expressed genes. Tracks and peaks from STAG2 and H3K27ac chromatin immunoprecipitation sequencing (ChIP-seq) as well as loops are shown below. Transcription directions are indicated by arrows. (D) Representative snapshots of contact maps of the replicate samples at Mal and Nkx6-2 genomic loci.hic files generated by HiC-Pro were converted into.cool format. Graphs were plotted with pyGenomeTracks at 5 kb resolution. Transcription orientations are indicated with the black arrows.
Figure 7—figure supplement 3
STAG2 regulates the formation of promoter-anchored loops in oligodendrocytes.
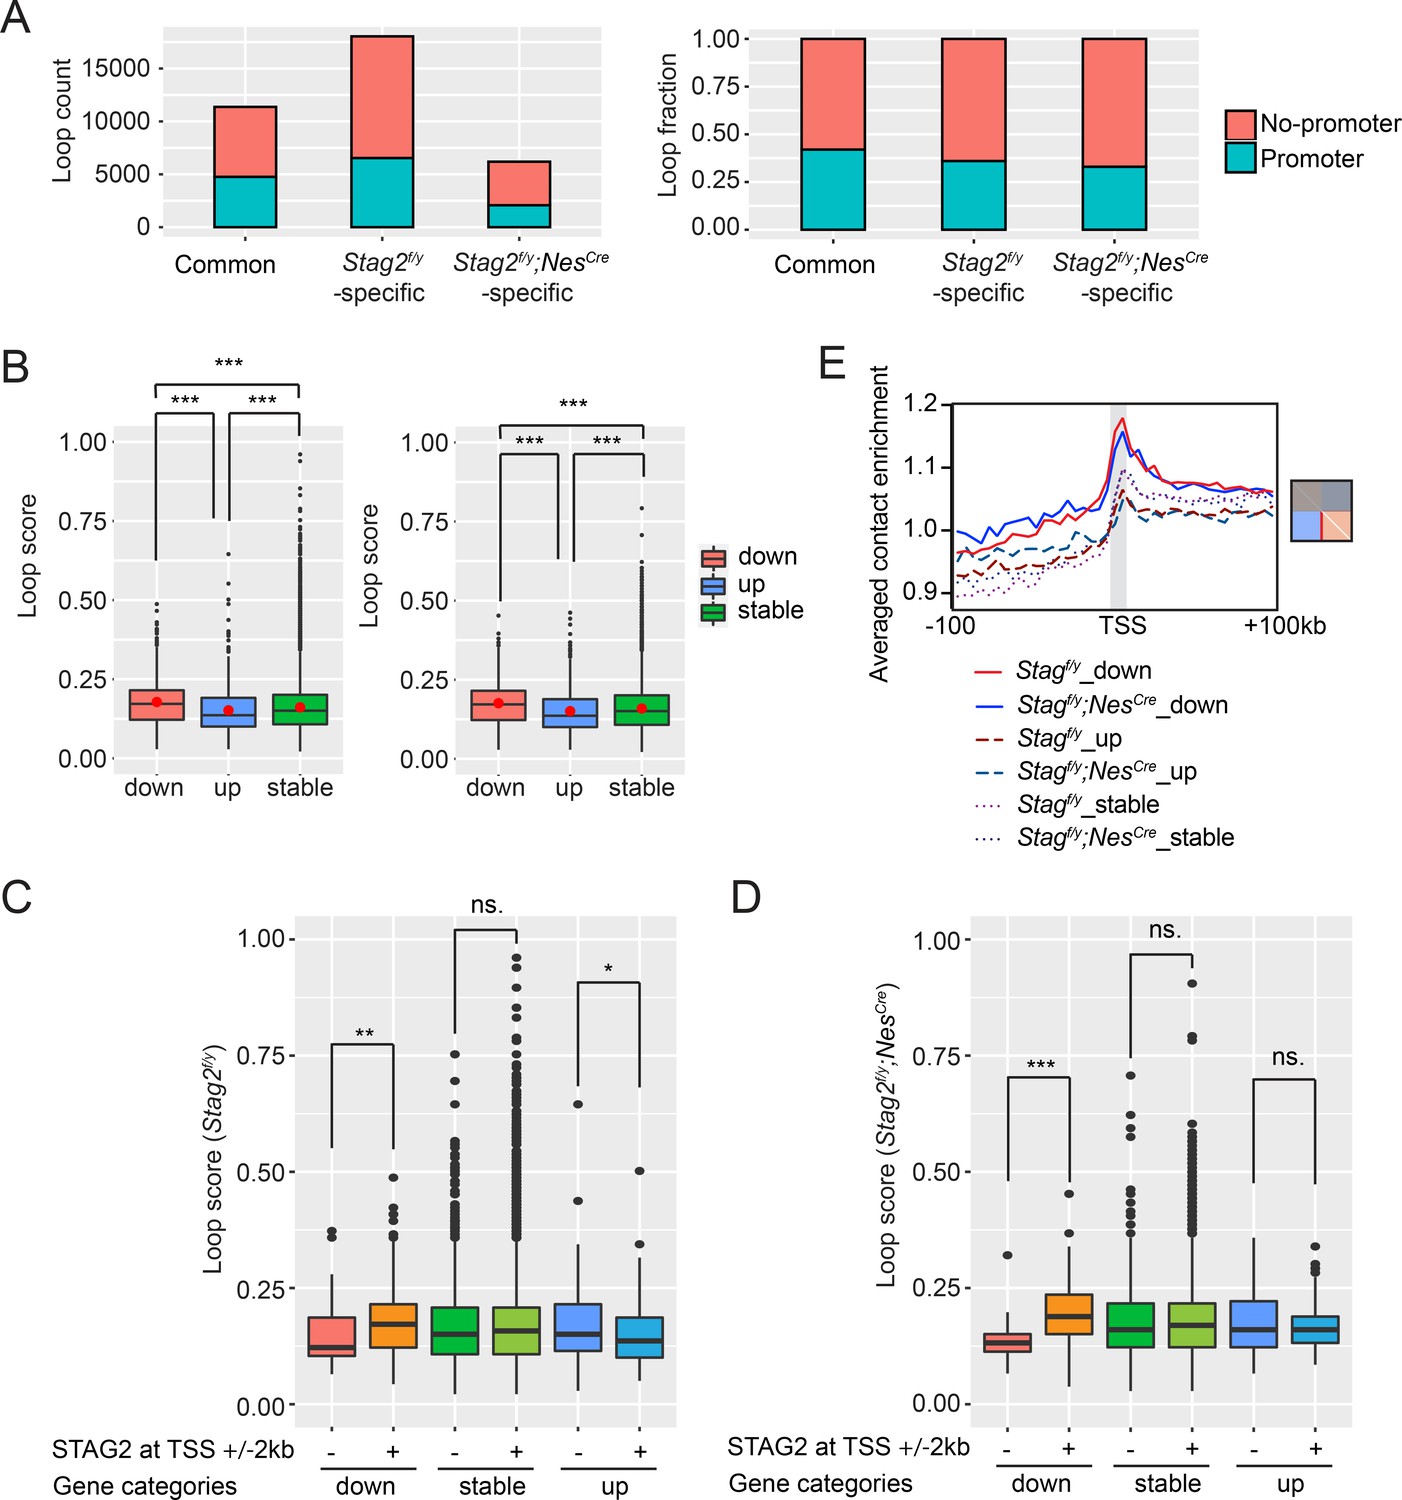
(A) Loop counts (left panel) and fractions (right panel) of loops anchored at promoter or nonpromoter regions in the indicated categories. (B) Loop score of the loops in Figure 7E. Loop score from Stag2f/y oligodendrocytes (OLs) was used for common loops on the left, and loop score from Stag2f/y;NesCre OLs was used for common loops on the right. The unpaired Wilcoxon test was used for the statistical analysis. ***p < 0.001. (C, D) Loop score of loops anchored at differentially expressed genes (DEGs) and stable gene promoters with or without STAG2 enrichment. Loops from Stag2f/y OLs are used for the analysis in (C) and loops from Stag2f/y;NesCre OLs are used for the analysis in (D). Unpaired Wilcoxon test was used for the statistical analysis. *p < 0.05; **p < 0.01; ***p < 0.001; ns, not significant. (E) Profile plot of the average enrichment score for the bottom half of each graph panel in Figure 7F. Diagonal pixels were omitted.
Figure 8
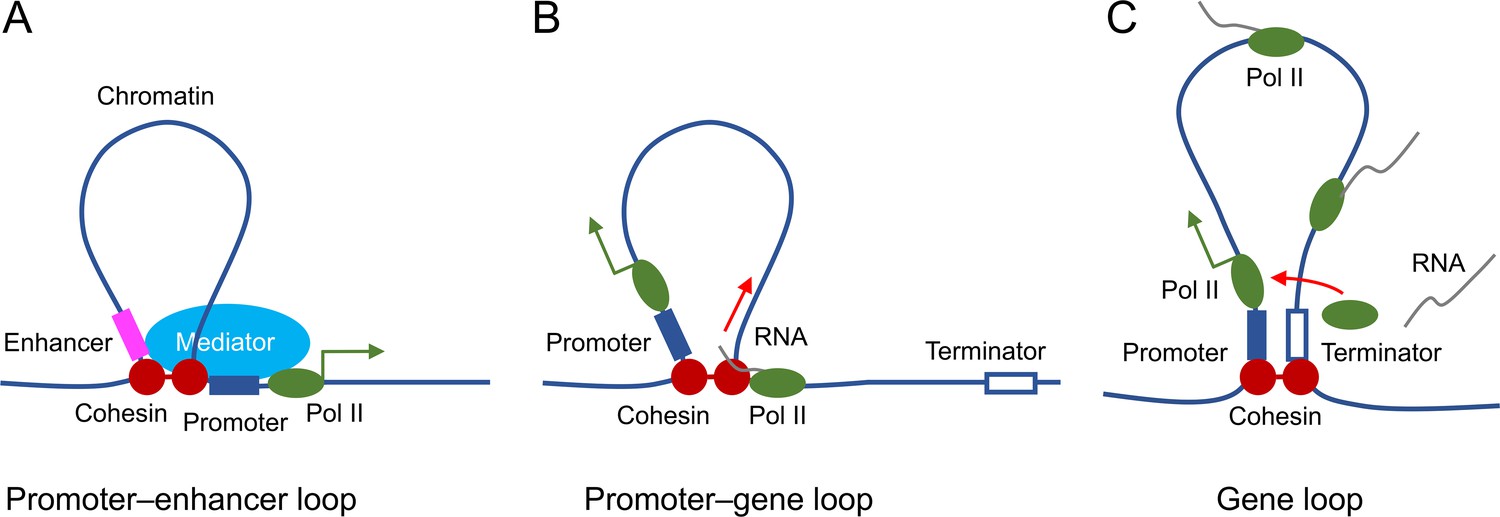
Proposed roles of STAG2-cohesin-mediated loop extrusion during transcription in oligodendrocytes.
(A) STAG2-cohesin-mediated chromosome looping connects the enhancer and the promoter, thus facilitating interactions among oligodendrocyte-specific transcription factors, the mediator complex, and the general transcription machinery including RNA polymerase II. (B) STAG2-cohesin travels along the gene body via transcription-coupled loop extrusion to facilitate pre-mRNA processing. (C) STAG2-cohesin mediates the formation of gene loops that bring the terminator close to the promoter and facilitate Pol II recycling for multiple rounds of transcription.
Author response image 1
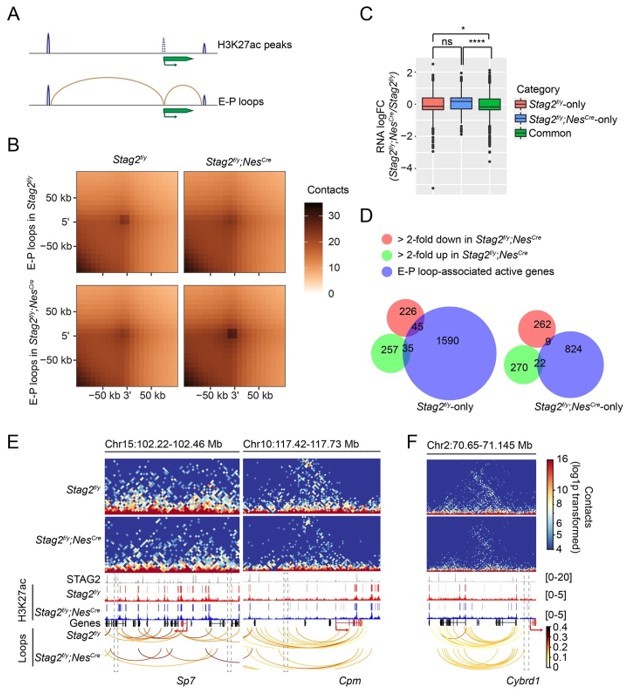
Enhancer-promoter loops and E-P loop-anchored gene expression change.
(A) Scheme for identifying enhancer-promoter (E-P) loops. H3K27ac peaks at gene TSS ±2kb region are removed. E-P loops are anchored to promoters on one end and to the remaining H3K27ac peaks on the other end. (B) Aggregate peak analysis of E-P loops identified from Stag2f/y or Stag2f/y;NesCre OLs on the 10 kb Hi-C matrices using GENOVA. (C) Boxplot of the expression levels for genes in the indicated categories. Stag2f/y, genes only anchored to E-P loops in Stag2f/y cells; Stag2f/y;NesCre, genes only anchored to E-P loops in Stag2f/y;NesCre cells; Common, genes anchored to E-P loops in both Stag2f/y and Stag2f/y;NesCre cells. Significant active genes with FDR<0.05 were included in the analysis. Unpaired Wilcoxon test was used for the statistical analysis. **p < 0.01, ****p < 0.0001, ns, not significant. (D) Venn diagram showing the comparison of down-regulated gene list, up-regulated gene list in Stag2f/y;NesCre OLs, and the EP loop-anchored active gene lists specific to Stag2f/y or Stag2f/y;NesCre OLs, respectively. Gene counts are shown. (E) Snapshots of the contact maps of genomic locus of repressed genes with lost E-P loops and H3K27ac peaks in the Stag2f/y;NesCre cells. Tracks and narrow peaks from STAG2 and H3K27ac ChIP-seq as well as the loops are plotted below. Genes of interest are highlighted in red. The transcription directions are indicated by the arrows. Lost loop anchors and H3K27ac peaks are framed with grey dashed lines. (F) A snapshot of the contact maps of genomic locus of an activated gene Cybrd1 with gained E-P loop in the Stag2f/y;NesCre cells. Tracks and narrow peaks from STAG2 and H3K27ac ChIP-seq as well as the loops are plotted below. The Cybrd1 gene body and TSS are highlighted in red. The gained loop anchor is framed with grey dashed lines.
Author response image 2
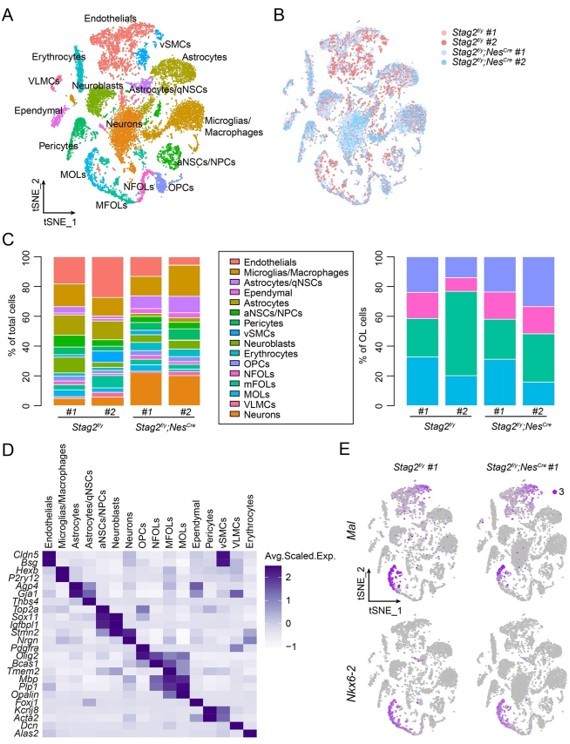
Transcriptome analysis of Stag2-depleted forebrains.
(A) t-SNE plot of cell clusters with the filtering criteria of nFeature_RNA (200-6500) in the single-cell analysis by Seurat. (B) t-SNE clustering as in (A) but colored by genotype. (C) Left panel: cell type composition and percentage as colored in (A). Right panel: percentage of cell clusters of the oligodendrocyte lineage. (D) Heatmap showing the expression levels of cell-type signature genes. (E) FeaturePlot of the representative genes (Mal and Nkx6-2) specifically suppressed in the late stages of OLs in Stag2-depleted forebrains. A maximum cutoff of 3 was used.
Videos
Video 1
Neurological defects of brain-specific Stag2 KO mice.
Tables
Appendix 1—key resources table
| Reagent type (species) or resource | Designation | Source or reference | Identifiers | Additional information |
|---|---|---|---|---|
| Strain, strain background (Mus musculus, female) | Stag2+/− | This paper | Exon8 of Stag2 was targeted by CRISPR–Cas9 (see Materials and methods) | |
| Strain, strain background (Mus. musculus, both sex) | Stag2f/y; Stag2f/f | This paper | Exon8 of Stag2 genomic locus was flanked by loxP sites (see Materials and methods) | |
| Strain, strain background (Mus. musculus, both sex) | C57BL/6J | The Jackson Laboratory | 000664; RRID:IMSR_JAX:000664 | |
| Strain, strain background (Mus. musculus, both sex) | B6.129-Gt(ROSA)26 Sortm1(cre/ERT2)Tyj/J | The Jackson Laboratory | 008463; RRID:IMSR_JAX:008463 | |
| Strain, strain background (Mus. musculus, male) | B6.Cg-Tg(Nes-cre)1Kln/J | The Jackson Laboratory | 003771; RRID:IMSR_JAX:003771 | |
| Antibody | anti-STAG2 (Rabbit polyclonal) | This paper | The C-terminus recombinant protein of STAG2 (Homo sapiens) was used to generate the antibody; WB (1:1000) | |
| Antibody | anti-α-TUBULIN (Mouse monoclonal) | Sigma-Aldrich | T9026; RRID:AB_477593 | WB (1:1000) |
| Antibody | anti-SA1 (Rabbit polyclonal) | Bethyl Laboratories | A302-579A; RRID:AB_2034857 | WB (1:1000) |
| Antibody | anti-SMC1 (Rabbit polyclonal) | Bethyl Laboratories | A300-055A RRID:AB_2192467 | WB (1:1000) |
| Antibody | anti-SMC3 (Rabbit polyclonal) | Bethyl Laboratories | A300-060A; RRID:AB_67579 | WB (1:1000) |
| Antibody | anti-RAD21 (Rabbit polyclonal) | Bethyl Laboratories | A300-080a; RRID:AB_2176615 | WB (1:1000) |
| Antibody | anti-MBP (Rat monoclonal) | Abcam | ab7349; RRID:AB_305869 | IHC (1:100) |
| Antibody | anti-PLP1 (Rabbit polyclonal) | Abcam | ab28486; RRID:AB_776593 | IHC (1:100) |
| Antibody | anti-GFAP (Rabbit polyclonal) | Abcam | ab7260; RRID:AB_305808 | IHC (1:100) |
| Antibody | anti-MAP2 (Rabbit polyclonal) | Abcam | ab32454; RRID:AB_776174 | IHC (1:50) |
| Antibody | anti-H3K27ac (Rabbit polyclonal) | Abcam | ab4729; RRID:AB_2118291 | ChIP (5 μl per test) |
| Antibody | anti-O4 Microbeads (Mouse monoclonal) | Miltenyi Biotec | 130-094-543; RRID:AB_2847907 | MACS (10 μl per 107 cells) |
| Antibody | anti-rabbit IgG (H+L), DyLight 800 Conjugate (Goat polyclonal) | Cell Signaling Technology | 5151 S; RRID:AB_10697505 | WB (1:5000) |
| Antibody | anti-mouse IgG (H+L), DyLight 680 Conjugate (Goat polyclonal) | Cell Signaling Technology | 5470 S; AB_10696895 | WB (1:5000) |
| Antibody | anti-rat IgG (H+L), Alexa Fluor 568 (Goat polyclonal) | Thermo Fisher Scientific | A-11077; RRID:AB_2534121 | IHC (1:500) |
| Antibody | anti-rabbit IgG (H+L), Alexa Fluor 488 (Goat polyclonal) | Thermo Fisher Scientific | A-11008; RRID:AB_143165 | IHC(1:500) |
| Sequence-based reagent | sgRNA#1 target on Stag2 | This paper | CRISPR single-guide RNA target sequence | Target sequence: TAGCCAACCTCTTTCTCTATTGG |
| Sequence-based reagent | sgRNA#2 target on Stag2 | This paper | CRISPR single-guide RNA target sequence | Target sequence: CAGACAGTATACTGTAATGGAGG |
| Sequence-based reagent | TaqMan probes: Stag2 | Thermo Fisher Scientific | Mm01311611_m1 | |
| Sequence-based reagent | TaqMan probes: Klk6 | Thermo Fisher Scientific | Mm00478322_m1 | |
| Sequence-based reagent | TaqMan probes: Ninj2 | Thermo Fisher Scientific | Mm00450216_m1 | |
| Sequence-based reagent | TaqMan probes: Cpm | Thermo Fisher Scientific | Mm01250802_m1 | |
| Sequence-based reagent | TaqMan probes: Fa2h | Thermo Fisher Scientific | Mm00626259_m1 | |
| Sequence-based reagent | TaqMan probes: Gapdh | Thermo Fisher Scientific | Mm99999915_g1 | |
| Sequence-based reagent | Stag2 gt 5 F | This paper | Genotype sequence primers | GGTATTTACTTGATAGCCAACC |
| Sequence-based reagent | Stag2 gt 5 R | This paper | Genotype sequence primers | CTCATCTTGATTTTCCTGAAGC |
| Sequence-based reagent | Stag2 gt 3 F | This paper | Genotype sequence primers | GGTTGAGACAGACAGTATAC |
| Sequence-based reagent | Stag2 gt 3 R | This paper | Genotype sequence primers | AGGCTGGACTATGACAACTC |
| Sequence-based reagent | ISH Probe Stag2 P1 F | This paper | Riboprobe synthesis primers | TACGGTACCGACCTTTCAGATGTCACTCCG |
| Sequence-based reagent | ISH Probe Stag2 P1 R | This paper | Riboprobe synthesis primers | GAAGGATCCGCATCGGATAGACACTCATGA |
| Sequence-based reagent | ISH Probe Stag2 P2 F | This paper | Riboprobe synthesis primers | TACGGATCCGACCTTTCAGATGTCACTCCG |
| Sequence-based reagent | ISH Probe Stag2 P2 R | This paper | Riboprobe synthesis primers | GAAGGTACCGCATCGGATAGACACTCATGA |
| Sequence-based reagent | ISH Probe Stag1 P1 F | This paper | Riboprobe synthesis primers | TTAGGTACCTTACAATGCCTGGTCCTCAGT |
| Sequence-based reagent | ISH Probe Stag1 P1 R | This paper | Riboprobe synthesis primers | GAAGGATCCCTTTCATTGGCTCTCTTCCC |
| Sequence-based reagent | ISH Probe Stag1 P2 F | This paper | Riboprobe synthesis primers | TTAGGATCCTTACAATGCCTGGTCCTCAGT |
| Sequence-based reagent | ISH Probe Stag1 P2 R | This paper | Riboprobe synthesis primers | GAAGGTACCCTTTCATTGGCTCTCTTCCC |
| Commercial assay or kit | Arima-HiC Kit | Arima Genomics | 510008 | |
| Chemical compound, drug | Tamoxifen | Sigma-Aldrich | T5648 | |
| Chemical compound, drug | 4-Hydroxytamoxifen | Sigma-Aldrich | H7904 | |
| Software, algorithm | GraphPad Prism | GraphPad Software | RRID:SCR_002798; https://www.graphpad.com/scientific-software/prism/ | |
| Software, algorithm | ImageJ (Fiji) | ImageJ | RRID:SCR_002285; https://imagej.net/software/fiji/ | |
| Software, algorithm | RStudio | The R Foundation | RRID:SCR_000432; https://www.rstudio.com/ | |
| Software, algorithm | Bcl2fastq | Illumina | RRID:SCR_015058 | v2.17 |
| Software, algorithm | Fastqc | Andrews, 2010; PMID:24501021 | RRID:SCR_014583 | v0.11.2 |
| Software, algorithm | Fastq_screen | Wingett, 2011 | RRID:SCR_000141; https://www.bioinformatics.babraham.ac.uk/projects/fastqc/ | v0.4.4 |
| Software, algorithm | STAR | Dobin et al., 2013; PMID:23104886 | RRID:SCR_004463; https://github.com/alexdobin/STAR | v2.5.3a |
| Software, algorithm | FeatureCounts | Liao et al., 2014; PMID:24227677 | RRID:SCR_012919; https://bioconductor.org/packages/release/bioc/html/Rsubread.html | |
| Software, algorithm | edgeR | Robinson et al., 2010; PMID:19910308 | RRID:SCR_012802; https://bioconductor.org/packages/release/bioc/html/edgeR.html | |
| Software, algorithm | Ingenuity pathway analysis | QIAGEN, Krämer et al., 2014; PMID:24336805 | RRID:SCR_008653; https://www.qiagenbioinformatics.com/products/ingenuity-pathway-analysis | |
| Software, algorithm | MACS2 | Zhang et al., 2008; PMID:18798982 | RRID:SCR_013291 | v2.0.10 |
| Software, algorithm | Bowtie2 | Langmead and Salzberg, 2012; PMID:22388286 | RRID:SCR_016368 | v2.2.3 |
| Software, algorithm | Picard MarkDuplicates | Broad Institute, GitHub Repository | RRID:SCR_006525; http://broadinstitute.github.io/picard/ | v1.127 |
| Software, algorithm | HOMER | Heinz et al., 2010, Ross-Innes et al., 2012; PMID:20513432 | RRID:SCR_010881; http://homer.ucsd.edu/homer/ | |
| Software, algorithm | Deeptools | Ramírez et al., 2016; PMID:27079975 | RRID:SCR_016366; https://deeptools.readthedocs.io/en/develop/ | |
| Software, algorithm | Galaxy | Afgan et al., 2018; PMID:29790989 | RRID:SCR_006281; https://usegalaxy.org | |
| Software, algorithm | Cell Ranger | 10× Genomics | RRID:SCR_017344; https://support.10xgenomics.com/single-cell-gene-expression/software/pipelines/latest/using/mkfastq | |
| Software, algorithm | Seurat | New York Genome Center; Stuart et al., 2019; PMID:31178118 | RRID:SCR_016341; https://satijalab.org/seurat | Satija Lab |
| Software, algorithm | Monocle3 | UW Genome Sciences; Cao et al., 2019; PMID:30787437 | RRID:SCR_018685; https://cole-trapnell-lab.github.io/monocle3/ | Cole Trapnell’s Lab, v3.0 |
| Software, algorithm | HiC-Bench pipeline | Lazaris et al., 2017, Tsirigos et al., 2012; PMID:22113082 | https://github.com/NYU-BFX/hic-bench | v0.1 |
| Software, algorithm | Juicer ‘pre’ tool | Durand et al., 2016; PMID:27467249 | RRID:SCR_017226; https://github.com/aidenlab/juicer | Aiden Lab, v1.11.09 |
| Software, algorithm | Juicebox | Aiden Lab, BCM | RRID:SCR_021172; https://github.com/aidenlab/Juicebox | v1.5.1 |
| Software, algorithm | Hic2cool | Abdennur and Mirny, 2020; PMID:31290943 | https://github.com/4dn-dcic/hic2cool | v0.8.3 |
| Software, algorithm | pyGenomeTracks | Lopez-Delisle et al., 2021; PMID:32745185 | https://github.com/deeptools/pyGenomeTracks | v3.7 |
| Software, algorithm | Fit-HiC | Ay et al., 2014; PMID:24501021 | https://github.com/ay-lab/fithic | v2.0.7 |
| Software, algorithm | Coolpup.py | Flyamer et al., 2020; PMID:32003791 | https://github.com/open2c/coolpuppy | v0.9.5 |
| Software, algorithm | clusterProfiler | Bioinformatics Group, Southern Medical University; Wu et al., 2021; PMID:34557778 | RRID:SCR_016884; https://github.com/YuLab-SMU/clusterProfiler | v4.4.1 |
| Software, algorithm | HiC-Pro | Servant et al., 2015; PMID:26619908 | RRID:SCR_017643 | v3.1.0 |
| Software, algorithm | HiCRep | Yang et al., 2017; PMID:28855260 | https://github.com/TaoYang-dev/hicrep | v1.11.0 |
| Software, algorithm | GENOVA | van der Weide et al., 2021; PMID:34046591 | https://github.com/robinweide/GENOVA | v1.0.0.9 |
Additional files
-
Supplementary file 1
List of enriched pathways of differentially expressed genes between wild-type (WT) and Stag2 KO mouse brains as revealed by ingenuity pathway analysis (IPA).
- https://cdn.elifesciences.org/articles/77848/elife-77848-supp1-v2.xlsx
-
Supplementary file 2
List of differentially expressed genes between wild-type (WT) and Stag2 KO oligodendrocytes, with the status of STAG2 binding at their promoters and the numbers of promoter-anchored loops indicated.
- https://cdn.elifesciences.org/articles/77848/elife-77848-supp2-v2.xlsx
-
Transparent reporting form
- https://cdn.elifesciences.org/articles/77848/elife-77848-transrepform1-v2.pdf
Download links
A two-part list of links to download the article, or parts of the article, in various formats.
Downloads (link to download the article as PDF)
Open citations (links to open the citations from this article in various online reference manager services)
Cite this article (links to download the citations from this article in formats compatible with various reference manager tools)
STAG2 promotes the myelination transcriptional program in oligodendrocytes
eLife 11:e77848.
https://doi.org/10.7554/eLife.77848


