Altered excitatory and inhibitory neuronal subpopulation parameters are distinctly associated with tau and amyloid in Alzheimer’s disease
- Memory and Aging Center, Department of Neurology, University of California, San Francisco, United States
- Department of Radiology and Biomedical Imaging, University of California, San Francisco, United States
- Medical Imaging Business Center, Ricoh Company, Japan
- Helen Wills Neuroscience Institute, University of California, Berkeley, United States
- Mary S. Easton Center for Alzheimer’s Disease Research, Department of Neurology, David Geffen School of Medicine, University of California, Los Angeles, United States
Figures
Figure 1

Spectral power changes and altered excitatory and inhibitory neuronal subpopulation parameters in patients with AD.
Patients with AD showed higher delta–theta (2–7 Hz) spectral power and lacked a clear alpha peak (8–12 Hz) as opposed to controls (A). A two-way ANOVA comparing patients and controls showed significantly higher spectral power within delta–theta frequency band and showed significantly lower spectral power within alpha and beta (13–35 Hz) bands, in AD patients (B). The markers depict the least-square means, and the error bars depict the 95% confidence intervals. Regional patterns of spectral power changes in patients with AD showed increased delta–theta power is predominant in the frontal regions and reduced alpha and beta spectral power is predominant in the temporoparietal and occipital cortices (C). Images show the t-values from statistical comparison of regional data, based on DK atlas parcellations, and thresholded at FDR 10%. Schematic representation of the linear neural mass model (NMM) (D), where the NMM represents local assemblies of excitatory and inhibitory neurons at each region of interest (ROI) lumped into linear systems. External inputs and outputs are gated through both excitatory and inhibitory neurons. The recurrent architecture of the two pools within a local area is captured by the neuronal time-constants, τe and τi, and neural gain terms, gee and gii, indicating the loops created by recurrents within excitatory, inhibitory, and cross-populations. At each ROI, the model delivers these parameters as it predicts the broad-band spectrum (1–35 Hz) optimized to the empirical spectrum derived from MEG. Patients with AD showed significantly increased neuronal time-constants, τe and τi compared to age-matched controls (E). Patients with AD also showed increased excitatory neural gains (gee) and reduced inhibitory neural gains (gii) than controls (c). The markers and error bars depict the least-square means and 95% confidence intervals. Abbreviations: AD, Alzheimer’s disease; MEG, magnetoencephalography.
Figure 2

Regional patterns of neuronal subpopulation parameters and protein tracer uptakes in patients with AD.
Subplots A–D depict the regional differences (z-scores) for excitatory time-constant (A), inhibitory time-constant (B), excitatory gain (C), and inhibitory gain (D) parameters in AD patients when compared to age-matched controls. Subplots E and F depict the average regional patterns of flortaucipir standardized uptake value ratio (SUVR) (E) and 11C-PIB SUVR (F) for patients with AD showing high flortaucipir retention in temporal lobe, posterior and lateral parietal regions, and high 11C-PIB retention in bilateral frontal and posterior parietal cortices. Abbreviations: AD, Alzheimer’s disease; Aβ, amyloid-beta.
Figure 3
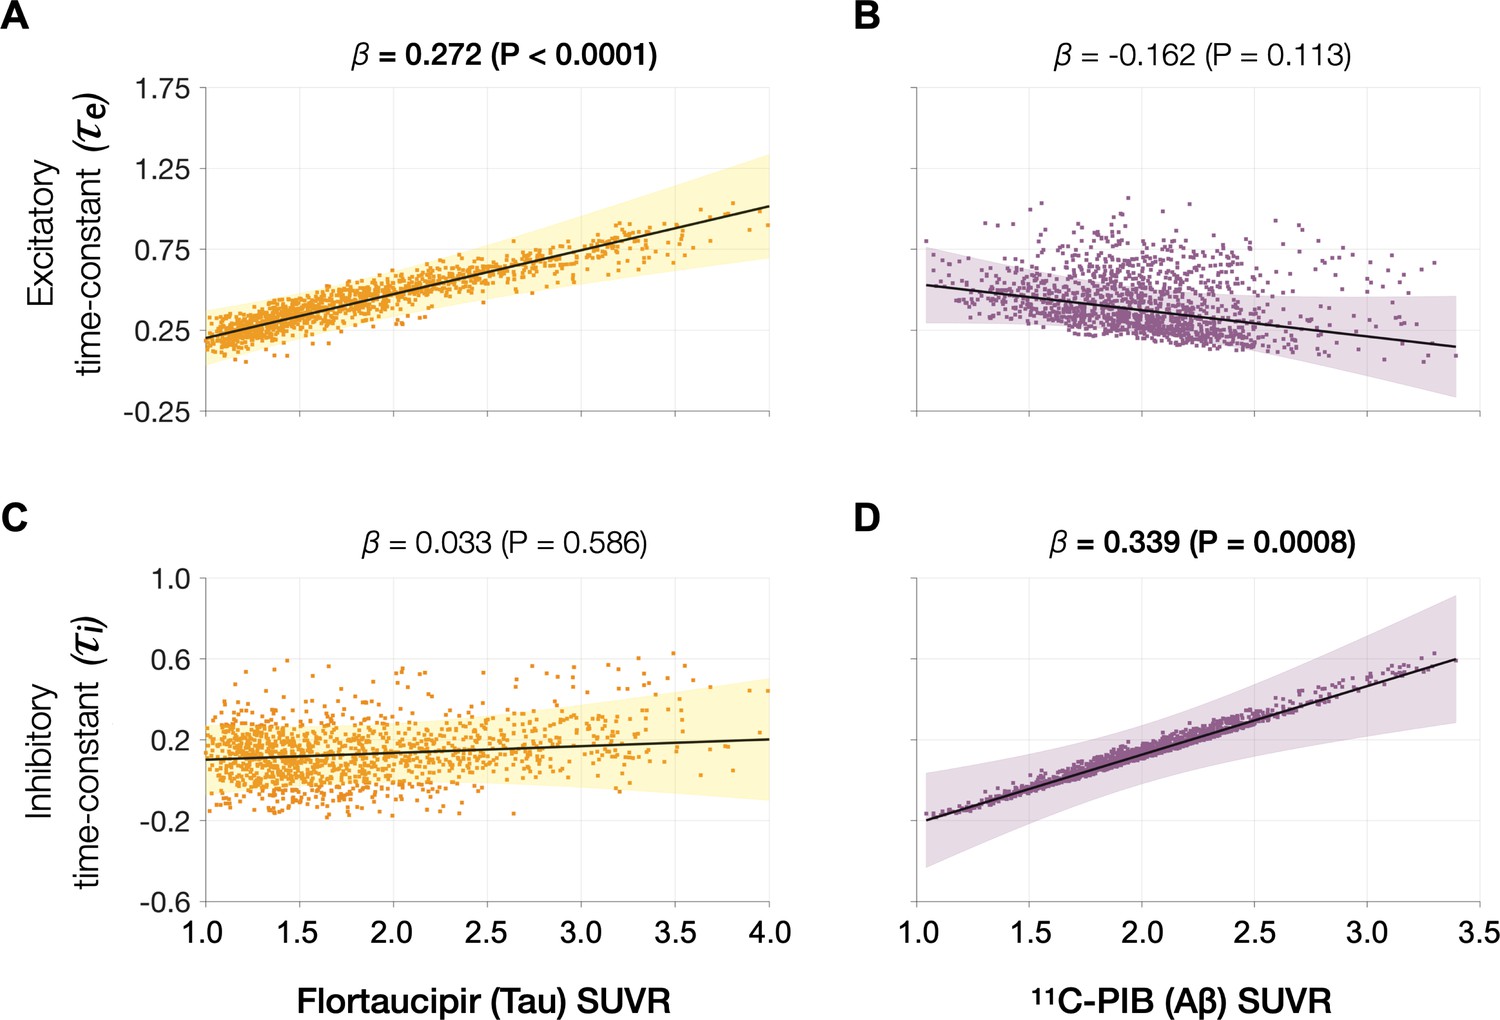
Associations between tau- and Aβ-tracer uptake and excitatory and inhibitory neuronal time-constants in patients with AD.
Increased time-constants showed distinct associations with tau and Aβ in AD patients. Increased excitatory time-constant (τe) was positively correlated with tau, but not with Aβ (A, B). Increased inhibitory time-constant (τi) was positively correlated with Aβ, but not with tau (C, D). Subplots A–D indicate the model estimates from linear mixed-effects models predicting the changes (z-scores) in each neuronal parameter from flortaucipir (tau) standardized uptake value ratio (SUVR) and 11C-PIB (Aβ) SUVR, in patients with AD. The fits depicting tau predictions were computed at the average SUVR of Aβ (1.99), and the fits depicting Aβ were computed at average SUVR of tau (1.64). The scatter plots indicate the predicted values from each model incorporating a repeated measures design. Abbreviations: AD, Alzheimer’s disease; Aβ, amyloid-beta.
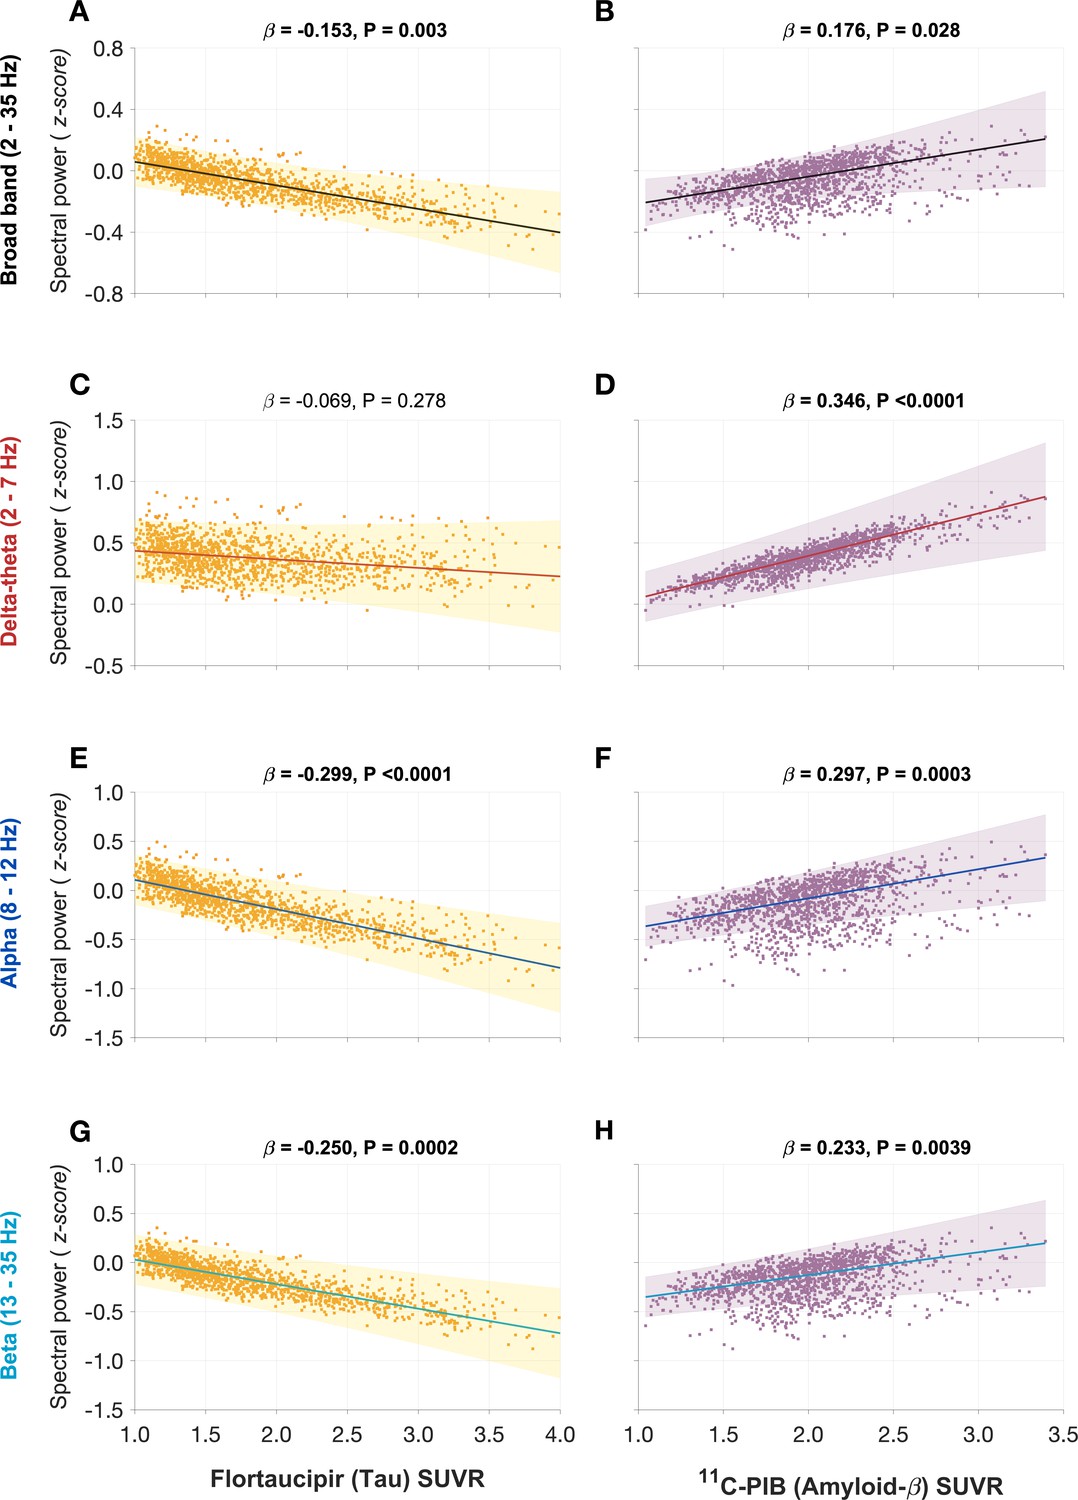
Figure 4
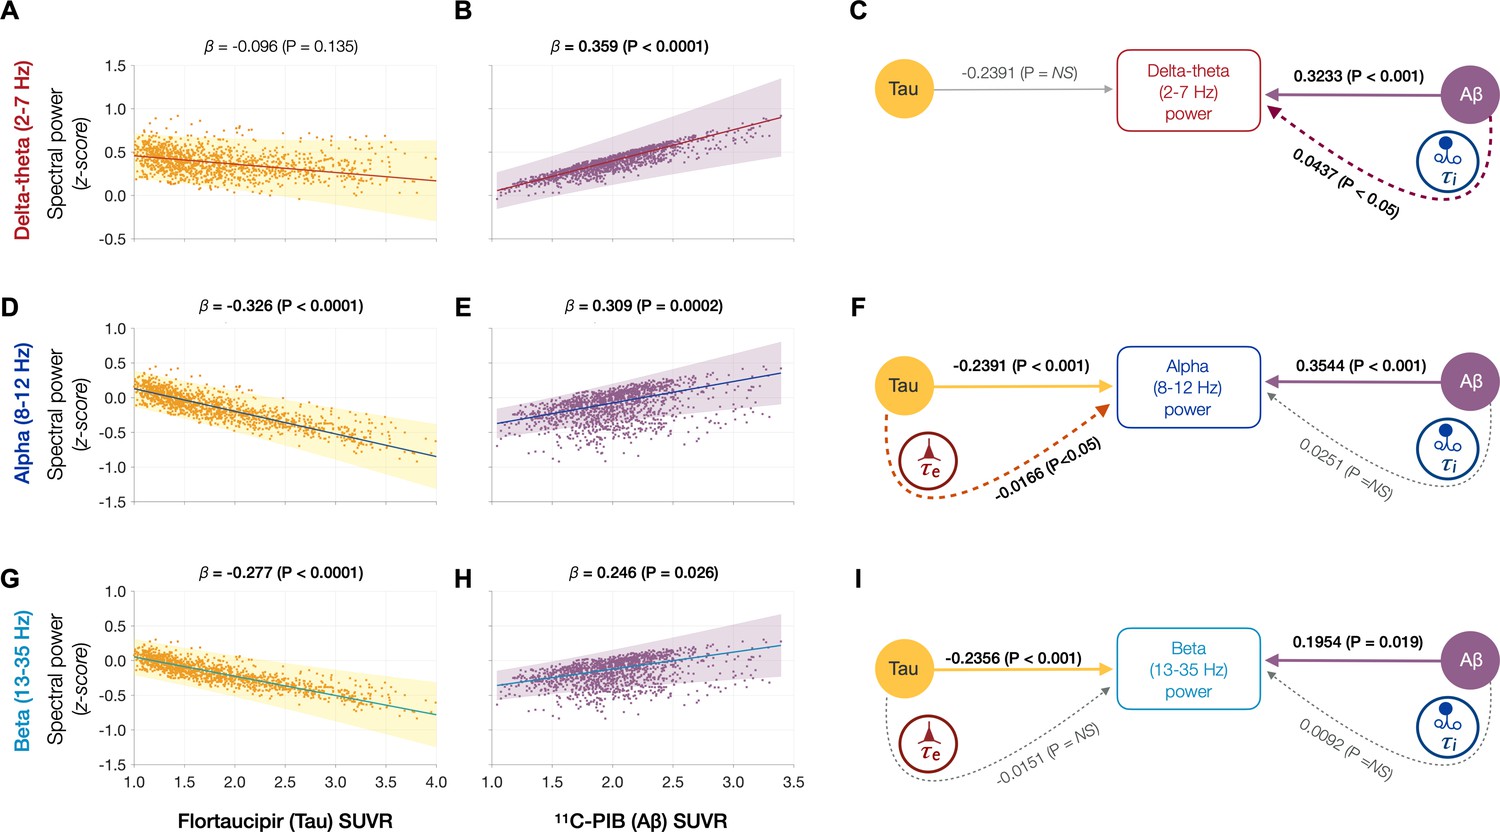
Frequency-specific spectral power modulations of tau and Aβ are partially mediated via increased excitatory (τe) and inhibitory (τi) time-constants.
Associations between tau- and Aβ-tracer uptake and spectral power changes in patients with AD are depicted in subplots A, B, D, E, G, and H. Tau was not associated with the delta–theta (2–7 Hz) spectral changes (A), while it was positively modulated by Aβ (B). Both alpha (8–12 Hz) and beta (13–35 Hz) spectra showed significant negative associations with tau (D, G) and significant positive associations with Aβ (E, H). Subplots indicate the model estimates from linear mixed-effects analyses predicting the spectral power changes from flortaucipir (tau) SUVR and 11C-PIB (Aβ) SUVR, for patients with AD. The fits depicting tau predictions were computed at the average SUVR of Aβ (1.99), while the fits depicting Aβ were computed at average SUVR of tau (1.64). The scatter plots indicate the predicted values from each model incorporating a repeated measures design to account for 68 regions per subject. Subplots C, F, and I depict mediation models to examine the direct effects of tau and Aβ, and the effects mediated through excitatory (τe) and inhibitory (τi) time-constants on different frequency bands. Delta–theta power increases were significantly affected by Aβ and were partially mediated through the effect of Aβ on inhibitory (τi) time-constant (C). Alpha power reductions were affected by tau and a small, but a significant fraction of this effect was mediated through the effect of tau on excitatory (τe) time-constant (F). Beta power reductions were significantly affected by tau, although there was no statistically significant effect mediated through the effect of tau on excitatory (τe) time-constant (I). Aβ effects on alpha and beta spectral changes were only direct effects with no statistically significant effects mediated through altered inhibitory (τi) time-constants. Abbreviations: AD, Alzheimer’s disease; Aβ, amyloid-beta; SUVR, standardized uptake value ratio.
Figure 5
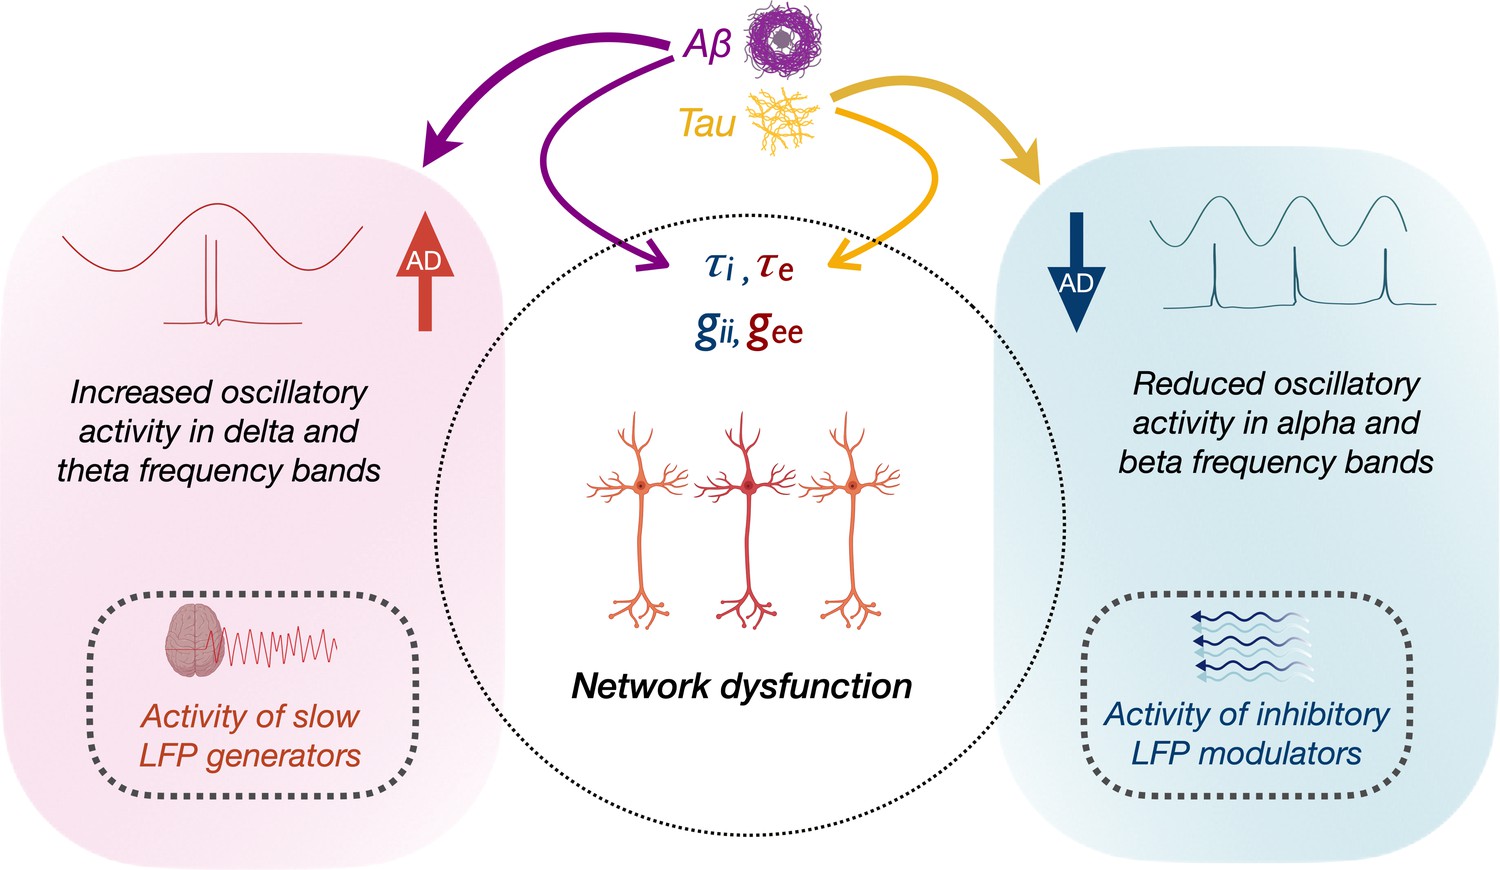
Schematic representation of the modulation of frequency-specific neuronal activity by Aβ and tau, and associated network dysfunction in AD.
Tau and Aβ have distinct effects on excitatory and inhibitory neuronal parameters of local neuronal subpopulations, as well as alpha, beta and delta–theta oscillatory changes in AD. Positive modulation of delta/theta rhythms by Aβ (left panel), may potentially contribute to a status of increased network activity. Alpha/beta, on the other hand, reflects activity of inhibitory regulation of network activity (right panel). Negative modulation of alpha/beta oscillations by tau may therefore contribute to a status of less regulated network activity.
Appendix 1—figure 1

Regional patterns of spectral power change in patients with AD.
Regional change in spectral power distributions within delta–theta (2–7 Hz), alpha (8–12 Hz), and beta (13–35 Hz) frequency bands in patients with AD (A–C) as depicted in z-scores estimated based on age-matched controls. Patients with AD showed frontal predominant increases in delta–theta spectral power and posterior predominant reductions in alpha and beta spectral power. Over the frontal regions AD patients showed a trend toward increased alpha and beta spectral power. Abbreviation: AD, Alzheimer’s disease.
Appendix 1—figure 2
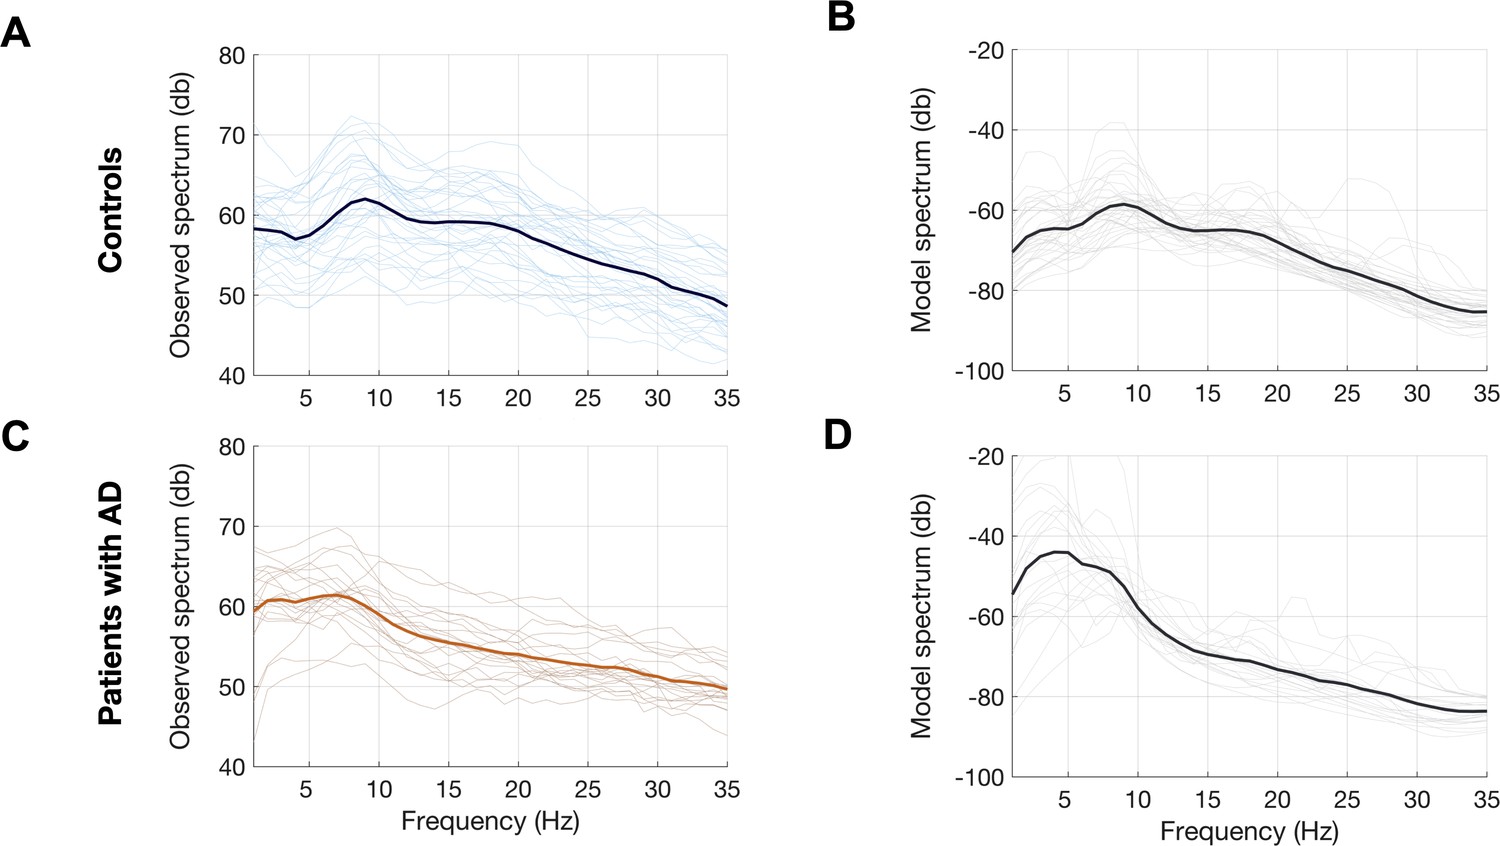
Observed and predicted power spectra in patients with AD and age-matched controls.
Observed and model predicted spectra for each participant in the age-matched controls (A, B) and patients with AD (C, D). Each individual line depicts the average spectrum for a given subject across 68 cortical ROIs. The dark lines depict group averages. The observed spectra were derived from the source space reconstructed MEG time-series data. The model spectra were generated from the linear neural mass model with optimized neuronal parameters for time-constants (excitatory, τe and inhibitory, τi) and neural gains (excitatory, gee and inhibitory, gii) to predict the broad-band spectrum (1–35 Hz) optimized to the empirical spectrum derived from MEG. Abbreviations: AD, Alzheimer’s disease; MEG, magnetoencephalography; ROI, regions-of-interest.
Appendix 1—figure 3

Associations between tau- and Aβ-tracer uptake and neuronal gain parameters in patients with AD.
Altered gain parameters did not show significant associations with tau and Aβ in AD patients. Subplots A–D indicate the model estimates from linear mixed-effects models predicting the changes (z-scores) in each neuronal parameter from flortaucipir (tau) SUVR and 11C-PIB (Aβ) SUVR, in patients with AD. The fits depicting tau predictions were computed at the average SUVR of Aβ (1.99), and the fits depicting Aβ were computed at average SUVR of tau (1.64). The scatter plots indicate the predicted values from each model incorporating a repeated measures design. Abbreviations: AD, Alzheimer’s disease; Aβ, amyloid-beta; gee, excitatory gain; gii, inhibitory gain; MEG, magnetoencephalography; SUVR, standardized uptake value ratio.
Appendix 1—figure 4
Associations between spectral power changes and tau- and Aβ-tracer uptake after correcting for regional atrophy.
Tau showed a significant negative association (A), while Aβ showed a significant positive association (B), with the broad-band power spectrum (2–35 Hz). These effects were distinct within each frequency-specific spectrum. Tau was not associated with the delta–theta (2–7 Hz) spectral changes (C), while it was positively modulated by Aβ (D). Both alpha (8–12 Hz) and beta (13–35 Hz) spectra showed significant negative associations with tau and significant positive associations with Aβ (E–H). Each subplot indicates the estimates from linear mixed-effects models predicting the spectral power changes from flortaucipir (tau) SUVR and 11C-PIB (Aβ) SUVR, after including the additional covariate of cortical atrophy in each ROI, in patients with AD. The fits depicting tau predictions were computed at the average SUVR of Aβ (1.99), while the fits depicting Aβ were computed at average SUVR of tau (1.64), each at the average w-score of cortical volume (−0.62). The scatter plots indicate the predicted values from each model incorporating a repeated measures design to account for 68 regions per subject. Z-scores for spectral power values were calculated based on the normal control cohort. Abbreviations: AD, Alzheimer’s disease; Aβ, amyloid-beta; SUVR, standardized uptake value.
Tables
Table 1
Participant demographics and clinical characteristics.
| Characteristic | Controls(N = 35) | Patients with AD(N = 20) | p† |
|---|---|---|---|
| Age (year) | 69.3.6 ± 8.4 | 66.3 ± 9.8 | 0.237 |
| Female sex, no. (%) | 20 (57.1) | 11 (55.0) | 0.876 |
| White, no. (%) ‡ | 30 (90.9) | 20 (100.0) | 0.282 |
| Education (year) | 18 (16–18) | 18 (16–18) | 0.855 |
| Right handedness, no. (%) | 30 (85.7) | 17 (85.0) | 0.340 |
| MMSE | 30 (29–30) | 23 (22–26) | <0.0001 |
| CDR* | 0 (0–0) | 0.5 (0.5–0.8) | <0.0001 |
| CDR-SOB* | 0 (0–0) | 3.5 (2.3–4.3) | <0.0001 |
| Age at disease onset | . | 59.4±9.39 | . |
| Disease duration | . | 6.9±2.4 | . |
-
*
Scores on the CDR range from 0 to 3 and scores on the CDR-SOB range from 0 to 18, with higher scores denoting more disability. Scores on the MMSE range from 0 to 30, with higher scores denoting better cognitive function. AD = Alzheimer’s disease.
-
†
Statistical tests: p values are reported from unpaired t-test for age, Pearson χ2 test for sex and handedness, Fisher’s exact test for race, Wilcoxon–Mann–Whitney test for education, MMSE, CDR, and CDR-SOB.
-
‡
Race or ethnic group was self-reported. Two control participants opted out from reporting the race.
Appendix 1—table 1
Neuropsychological test performance in patients with AD.
| Variable | Test score(mean ± SD) |
|---|---|
| Episodic memory function | |
| Visual free recall (Benson 10 min) | 4.9 ± 3.2 |
| Short delay verbal memory (CVLT 30 s) | 3.9 ± 2.4 |
| Verbal free recall (CVLT 10 min) | 2.3 ± 2.9 |
| Executive function and working memory | |
| Design fluency | 6.4 ± 2.9 |
| Information processing speed (Stroop color naming) | 48.2 ± 17.6 |
| Cognitive control (Stroop Inhibition) | 21.3 ± 12.9 |
| Verbal working memory (Digit span forward) | 5.3 ± 1.33 |
| Attention (Digit span backward) | 3.8 ± 1.2 |
| Set shifting (Modified trails – speed) | 0.2 ± 0.2 |
| Verbal learning (CVLT total score) | 17.9 ± 6.6 |
| Language function | |
| Reading irregular words | 5.6 ± 0.7 |
| Syntax comprehension | 3.9 ± 1.2 |
| Verbal agility | 4.6 ± 1.2 |
| Boston Naming Test | 12.3 ± 3.1 |
| Lexical fluency (D words/1 min) | 10.8 ± 5.0 |
| Category fluency (animals/1 min) | 11.4 ± 5.0 |
| Repetition | 3.3 ± 1.4 |
| Visuospatial function | |
| Face discrimination (CATS – face matching) | 10.8 ± 1.7 |
| Visuoconstruction (Benson copy) | 12.8 ± 4.2 |
| Location discrimination (VOSP number location) | 7.5 ± 2.5 |
| Calculations | 3.4 ± 1.4 |
| Emotion naming (CATS – affect matching) | 12.7 ± 1.0 |
-
CVLT = California Verbal Learning Test containing nine items; CATS = Comprehensive Affect Testing System; VOSP = Visual Object and Space Perception.
Additional files
Download links
A two-part list of links to download the article, or parts of the article, in various formats.
Downloads (link to download the article as PDF)
Open citations (links to open the citations from this article in various online reference manager services)
Cite this article (links to download the citations from this article in formats compatible with various reference manager tools)
Altered excitatory and inhibitory neuronal subpopulation parameters are distinctly associated with tau and amyloid in Alzheimer’s disease
eLife 11:e77850.
https://doi.org/10.7554/eLife.77850


