Automated hippocampal unfolding for morphometry and subfield segmentation with HippUnfold
- Robarts Research Institute, Schulich School of Medicine and Dentistry, The University of Western Ontario, Canada
- Western Institute for Neuroscience, The University of Western Ontario, Canada
- Department of Clinical Neurological Sciences, Division of Neurosurgery, Schulich School of Medicine & Dentistry, The University of Western Ontario, Canada
- School of Biomedical Engineering, The University of Western Ontario, Canada
- Department of Psychology, Faculty of Social Science, The University of Western Ontario, Canada
- Department of Medical Biophysics, Schulich School of Medicine and Dentistry, The University of Western Ontario, Canada
Figures
Figure 1 with 1 supplement
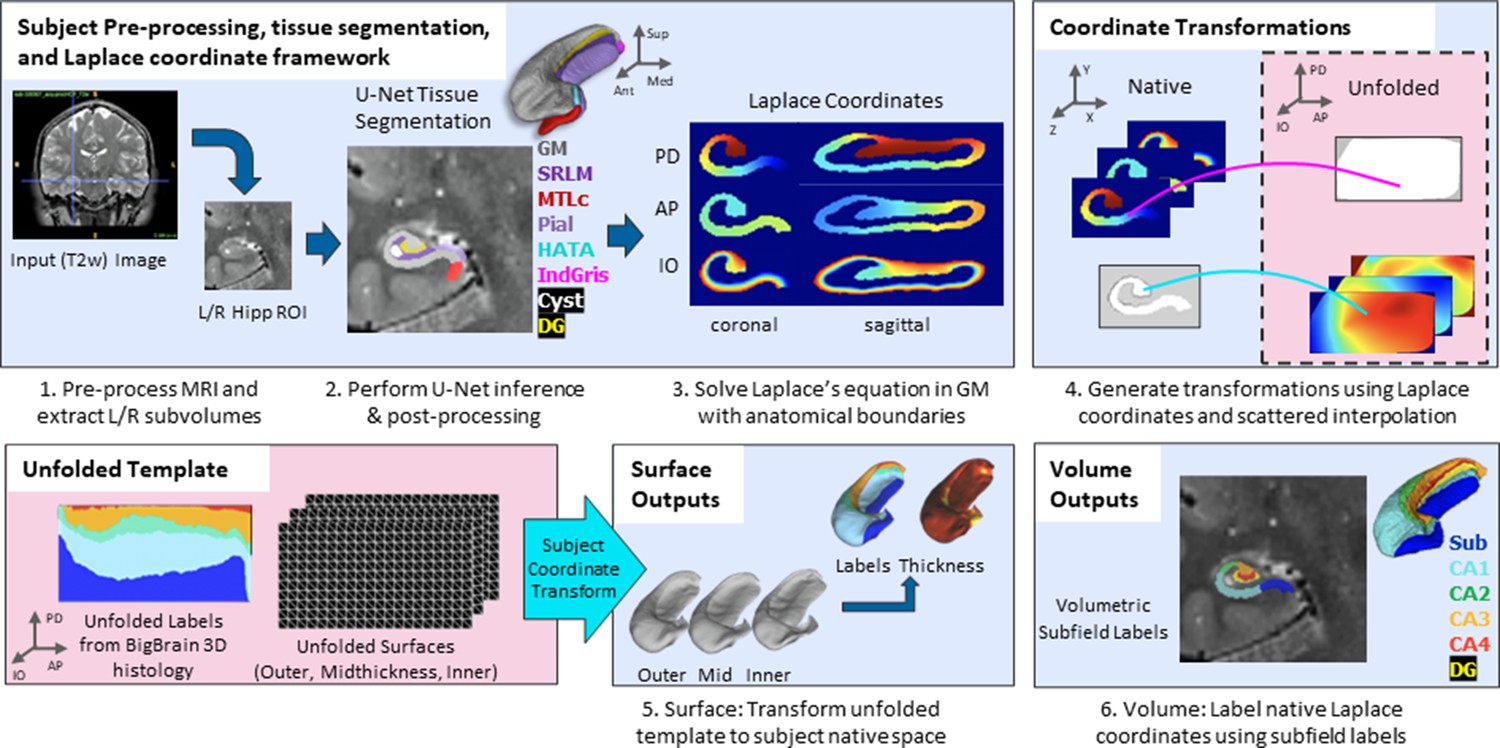
Overview of HippUnfold pipeline.
First, input MRI images are preprocessed and cropped around the left and right hippocampi. Second, a U-Net neural network architecture (nnUNet; Isensee et al., 2021) is used to segment hippocampal grey matter (GM), the high-myelinated stratum radiatum, lacunosum, and moleculare (SRLM), and structures surrounding the hippocampus. Segmentations are post-processed via template shape injection. Third, Laplace’s equation is solved across the anterior-posterior (AP), proximal-distal (PD), and inner-outer (IO) extent of hippocampal GM, making up a geodesic coordinate framework. Fourth, scattered interpolants are used to determine equivalent coordinates between native Cartesian space and unfolded space. Fifth, unfolded surfaces with template subfield labels (DeKraker et al., 2020) are transformed to subjects’ native folded hippocampal configurations. Morphological features (e.g. thickness) are extracted using Connectome Workbench (Glasser et al., 2013) on these folded native space surfaces. Sixth, volumetric subfields are generated by filling the voxels between inner and outer surfaces with the corresponding subfield labels. Additional details on this pipeline can be found in the Materials and methods.
Figure 1—figure supplement 1
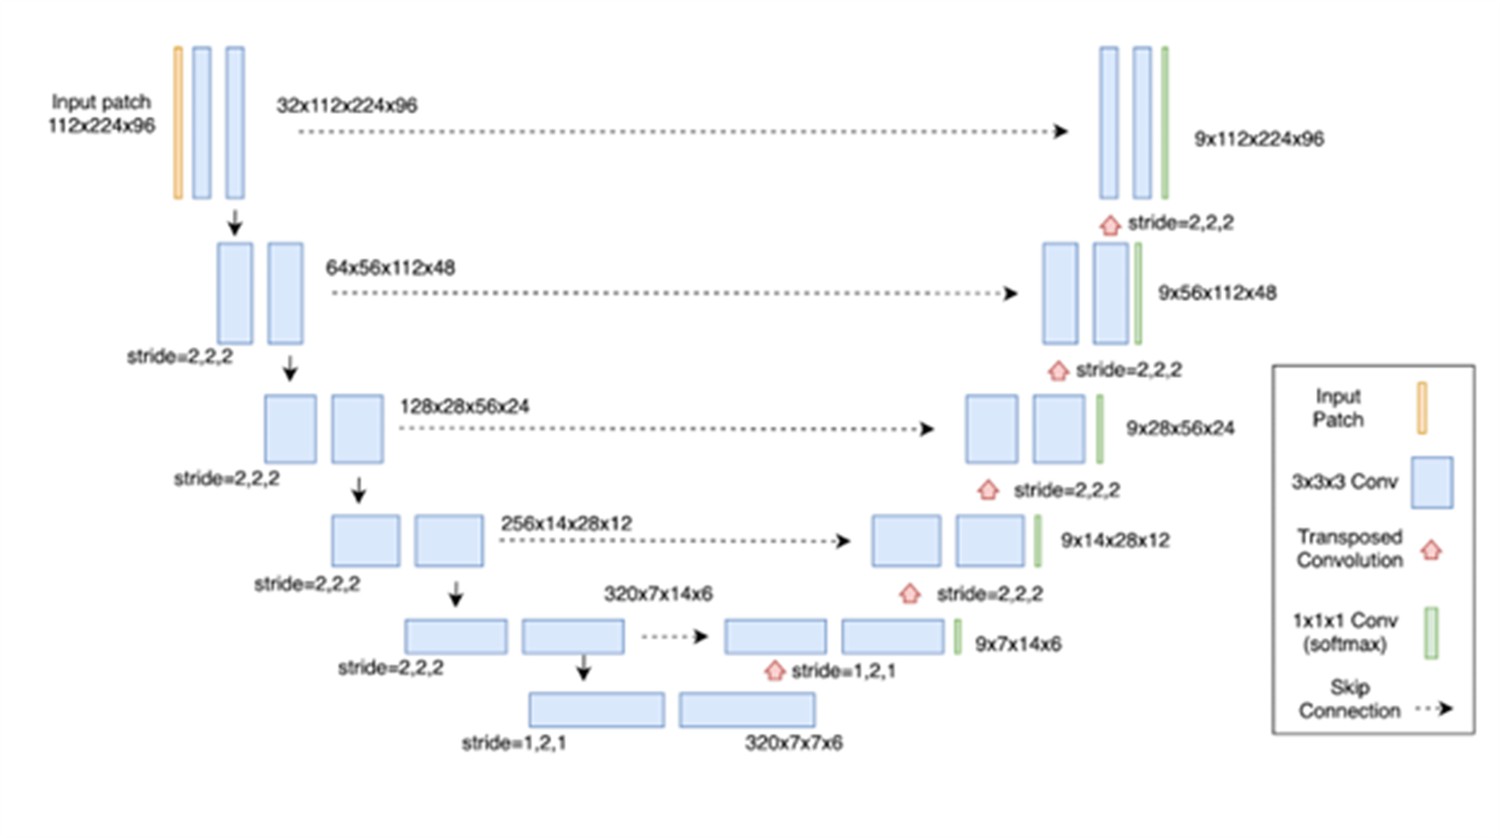
Diagram of the nnU-net architecture used for HippUnfold.
This architecture was automatically configured as the 3D_fullres network, using the 128 × 256 × 128 (0.3 × 0.3 × 0.3 mm3) hippocampal subregion images as training data. All conv3D blocks have stride = 1,1,1 (unless otherwise specified), padding=(1,1,1), instance normalization, and leaky ReLu activation functions (negative slope = 0.01). Output layers for the nine-label (including background) tissue segmentation are present at five feature-map resolutions (deep supervision), and the loss function used for training is an average of a Dice and cross-entropy loss functions. For full details on the training scheme, we refer readers to the supplementary material provided in Waehnert et al., 2014.
Figure 2 with 1 supplement
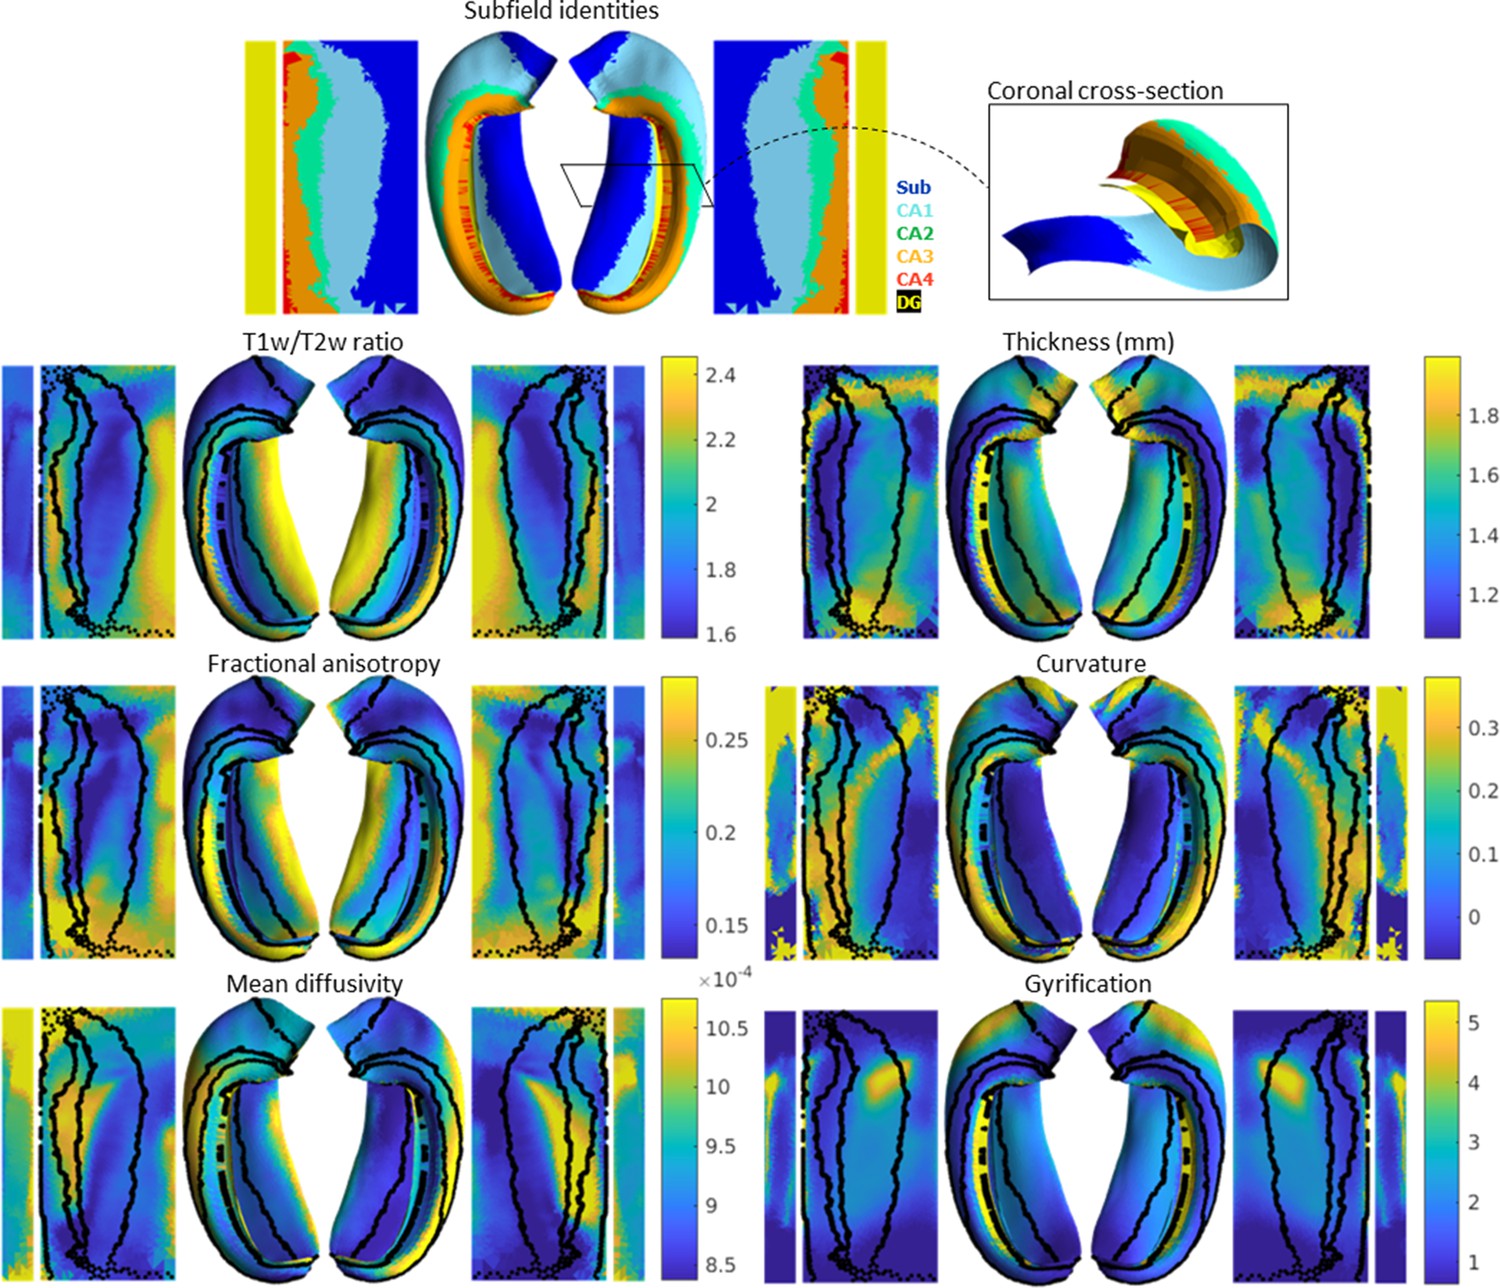
Average hippocampal folded and unfolded surfaces showing subfields, morphometric, and quantitative MRI measures from the Human Connectome Project-Young Adult (HCP-YA) test dataset (see Table 1 of Materials and methods).
The same topologically defined subfields were applied in unfolded space to all subjects (top), which are also overlaid on quantitative MRI plots (black lines). The dentate gyrus (DG) is represented as a distinct surface, reflecting its unique topology, and is mostly occluded in native space. Thickness was not measured across the DG surface. Note that many morphological and quantitative MRI measures show clear distinctions across subfield boundaries.
Figure 2—figure supplement 1
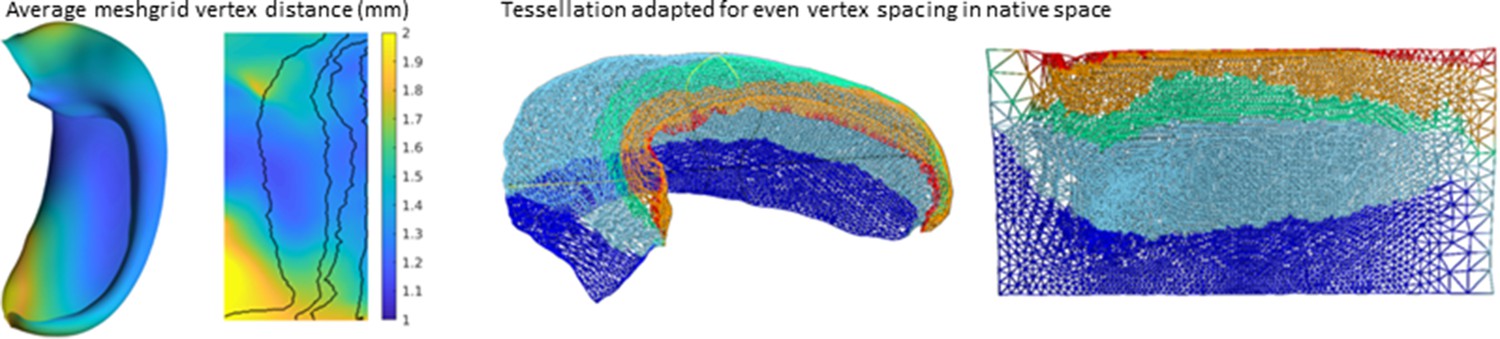
Examination of distortions (or difference in vertex spacing) between an average folded and unfolded space.
Distortions were greatest in the tail of the hippocampus where its proximal-distal distance becomes quite narrow.
Figure 3 with 1 supplement

Out of sample performance of HippUnfold, Automatic Segmentation of Hippocampal Subfields (ASHS), and Freesurfer (FS7).
(A) Side-by-side comparison of results obtained from each method from one representative individual from the Human Connectome Project-Aging (HCP-A) datasets, which was not seen during training. (B) Quantitative comparison of subfield volumes (left) and age-related volume changes (right) between methods. For a full set of snapshots illustrating the differences between these methods, see Supplementary file 2, Supplementary file 3.
Figure 3—figure supplement 1
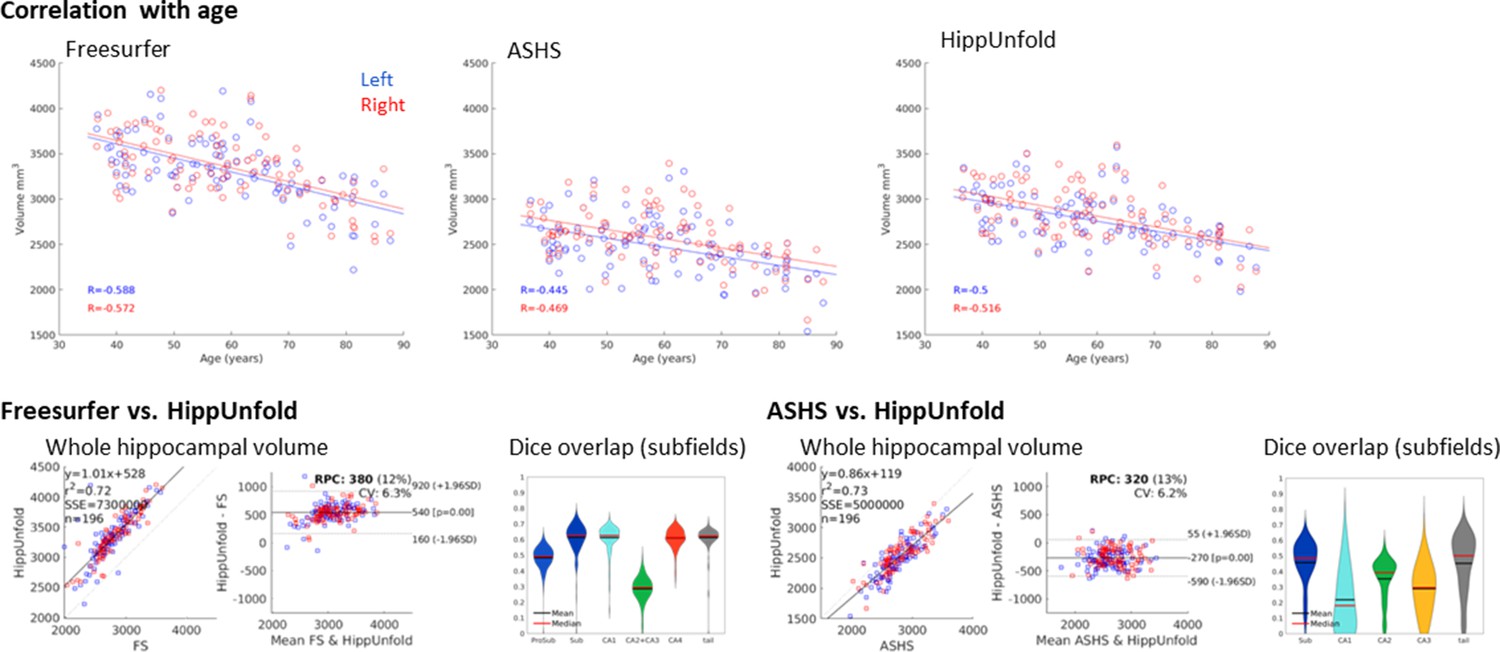
Additional comparisons of results obtained from Freesurfer (FS7), Automatic Segmentation of Hippocampal Subfields (ASHS), and HippUnfold in 100 Human Connectome Project- Aging (HCP-A) subjects.
All three methods showed a moderate correlation with age, as expected based on previous literature. Volumetric comparison of each method to HippUnfold directly revealed that there is a strong correlation between total hippocampal volumes obtained using HippUnfold and those obtained using FS7 or ASHS. HippUnfold and FS7 showed a moderate difference in overall volume (FS7 being on average 540 mm3 larger), whereas ASHS volumes were consistently smaller (by an average of 270 mm3). At the subfield level, using an unfolded subfield atlas from the corresponding method, there was relatively low Dice overlap between labels obtained using these three different methods in native space, which is likely driven by the gross volume differences between methods (i.e. which tissues are included or excluded prior to unfolding) since subfield definitions are nearly identical after unfolding.
Figure 4 with 1 supplement
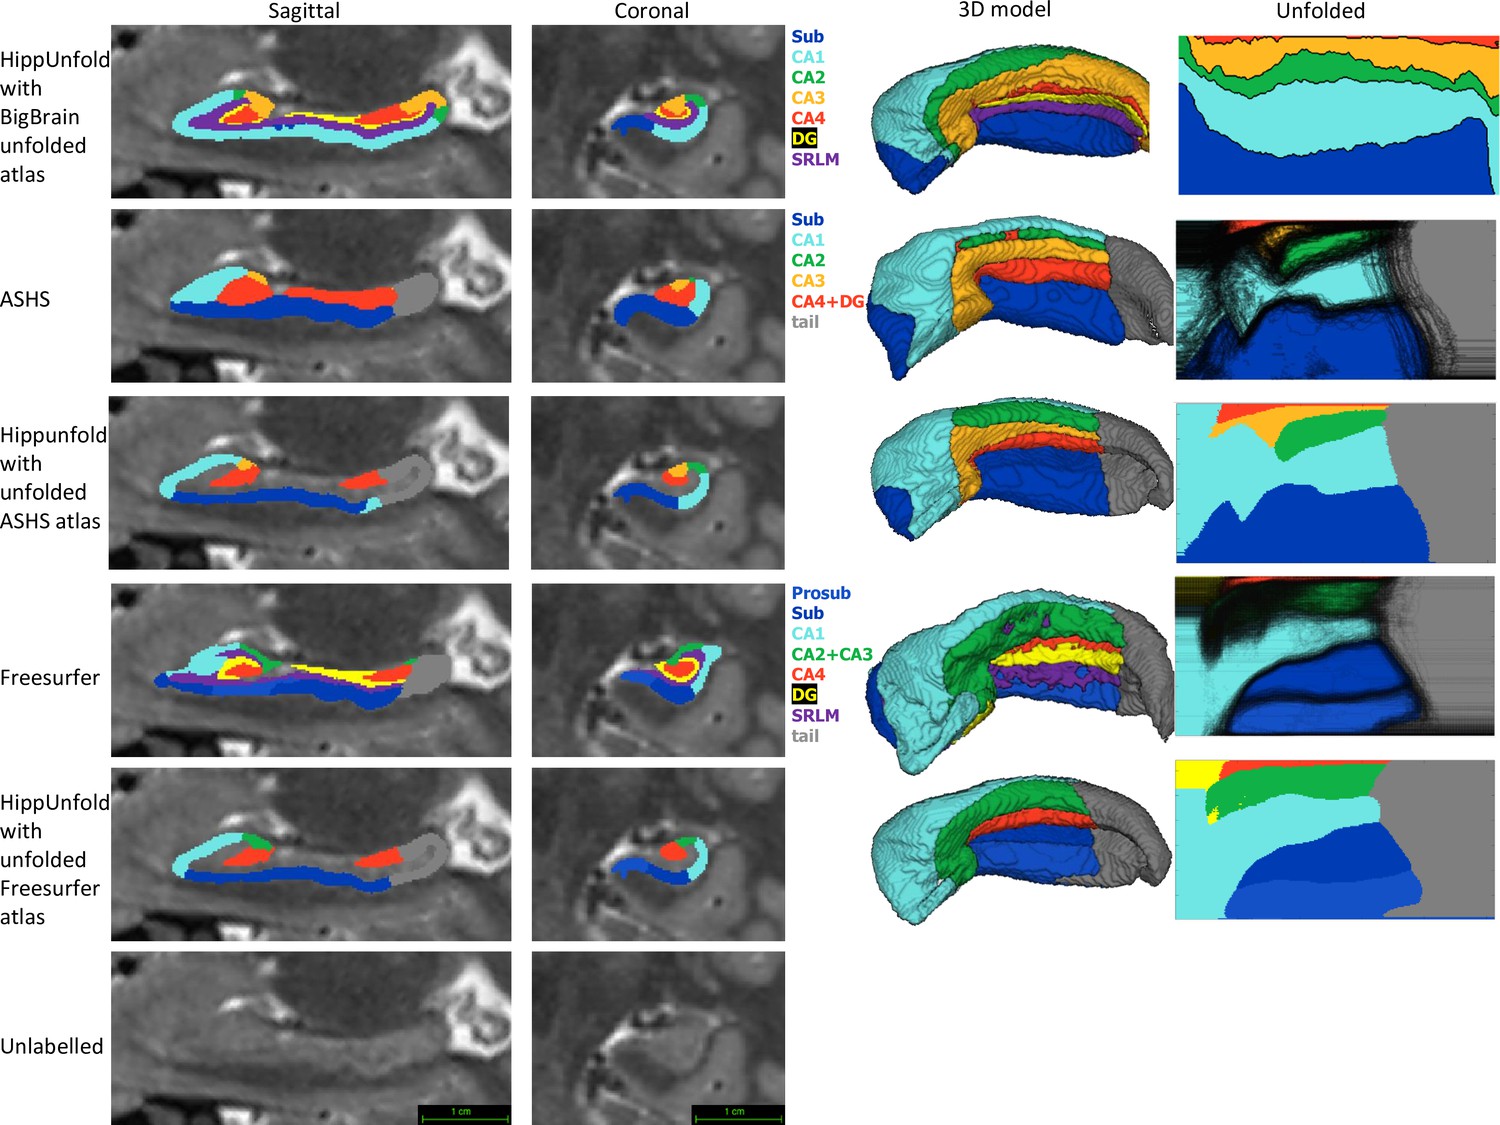
Comparison of HippUnfold, Automatic Segmentation of Hippocampal Subfields (ASHS), and Freesurfer (FS7) subfield segmentations in native and unfolded space.
Sagittal and coronal slices and 3D models are shown for one representative subject. Note that for HippUnfold hippocampal subfields are the same for all individuals in unfolded space, but for ASHS and FS we mapped all subjects’ subfield boundaries which are shown in the black lines in column 4 rows 2 and 4. We then took the maximum probability subfield label from ASHS and FS in unfolded space and used it for HippUnfold subfield segmentation in native space, which is shown in rows 3 and 5.
Figure 4—figure supplement 1
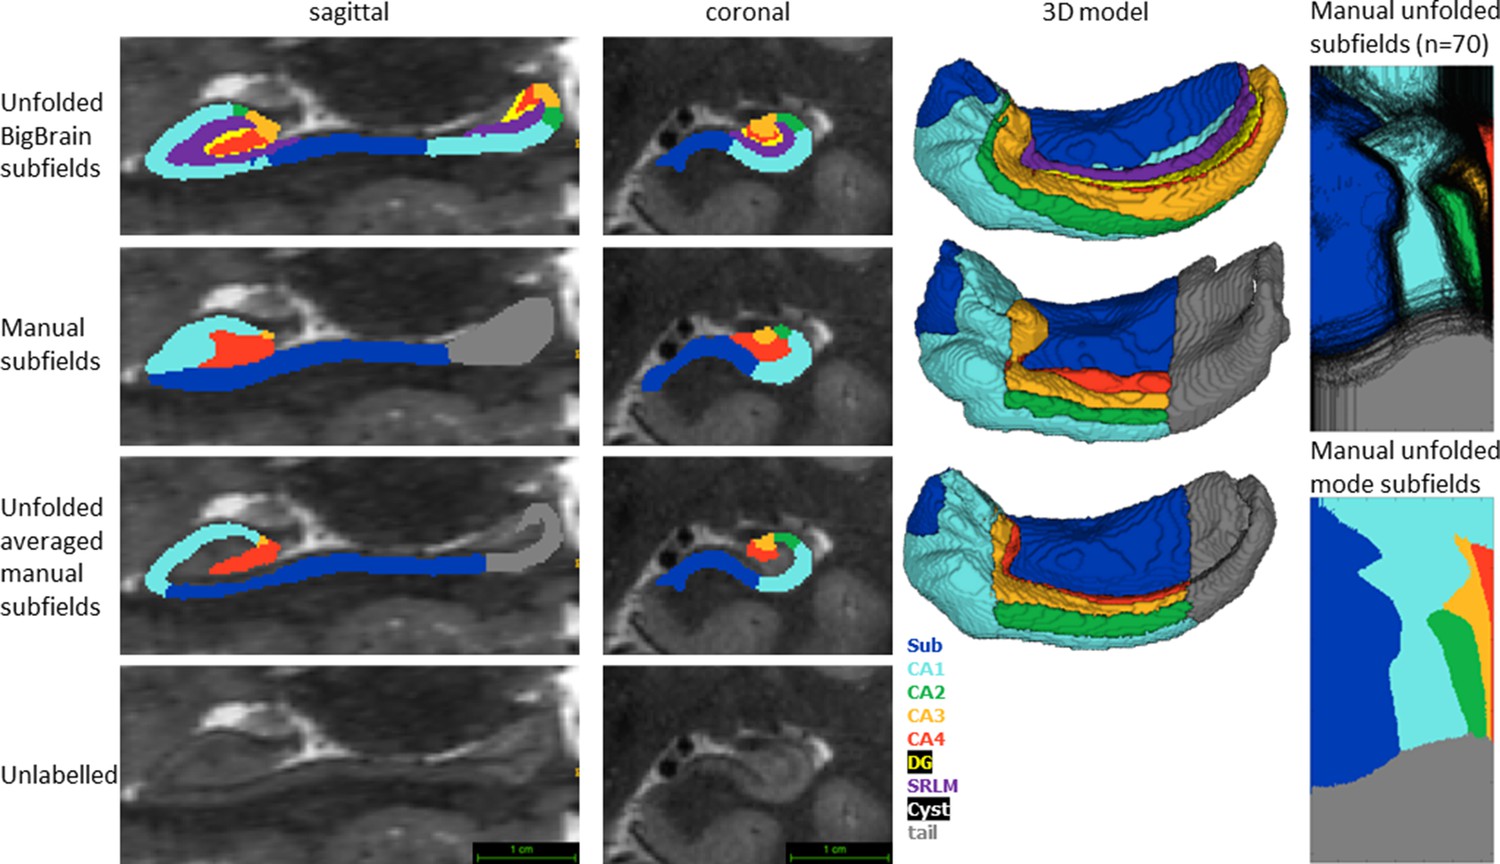
Comparison of HippUnfold and fully manual subfield segmentations (data from Thom, 2014) in native and unfolded space from one representative subject.
Sagittal and coronal slices and 3D models are shown for one representative subject. Note that the 3D model of a fully manual segmentation shows clear anterior and posterior digitations which were also present but considerably smoothed in HippUnfold.
Figure 5
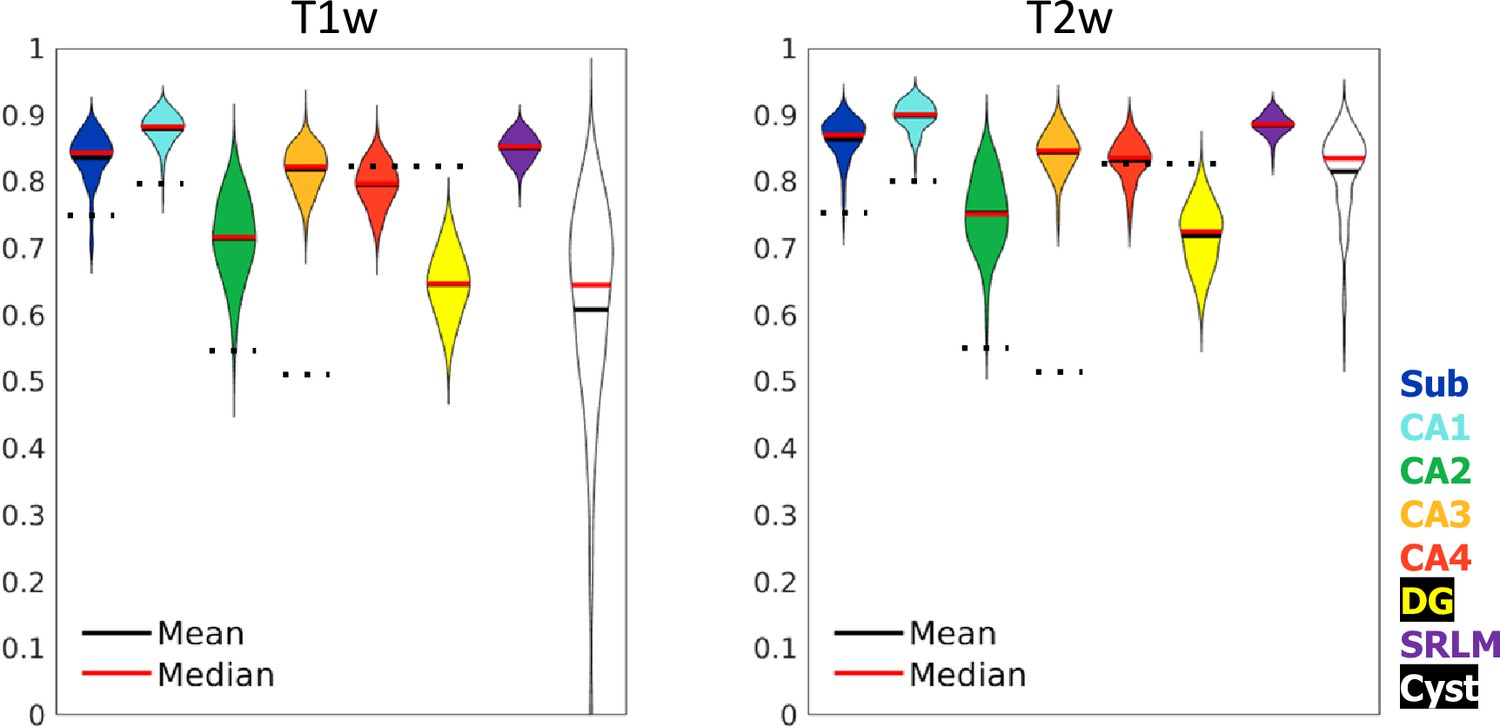
Test set performance in Dice overlaps between HippUnfold and manually unfolded subfields.
All values are compared to ground truth manually defined tissues followed by unfolded subfield definition (manual unfold) to determine how small differences in grey matter parcellation propagate through the unfolding, subfield definition, and re-folding. Two models were trained in parallel using the same labels but different input MRI data modalities consisting of T1w or T2w data. Dotted black lines indicate corresponding values from Yushkevich et al., 2015b, who include stratum radiatum, lacunosum, and moleculaire (SRLM) in all labels and combine CA4 and DG into one label.
Figure 6
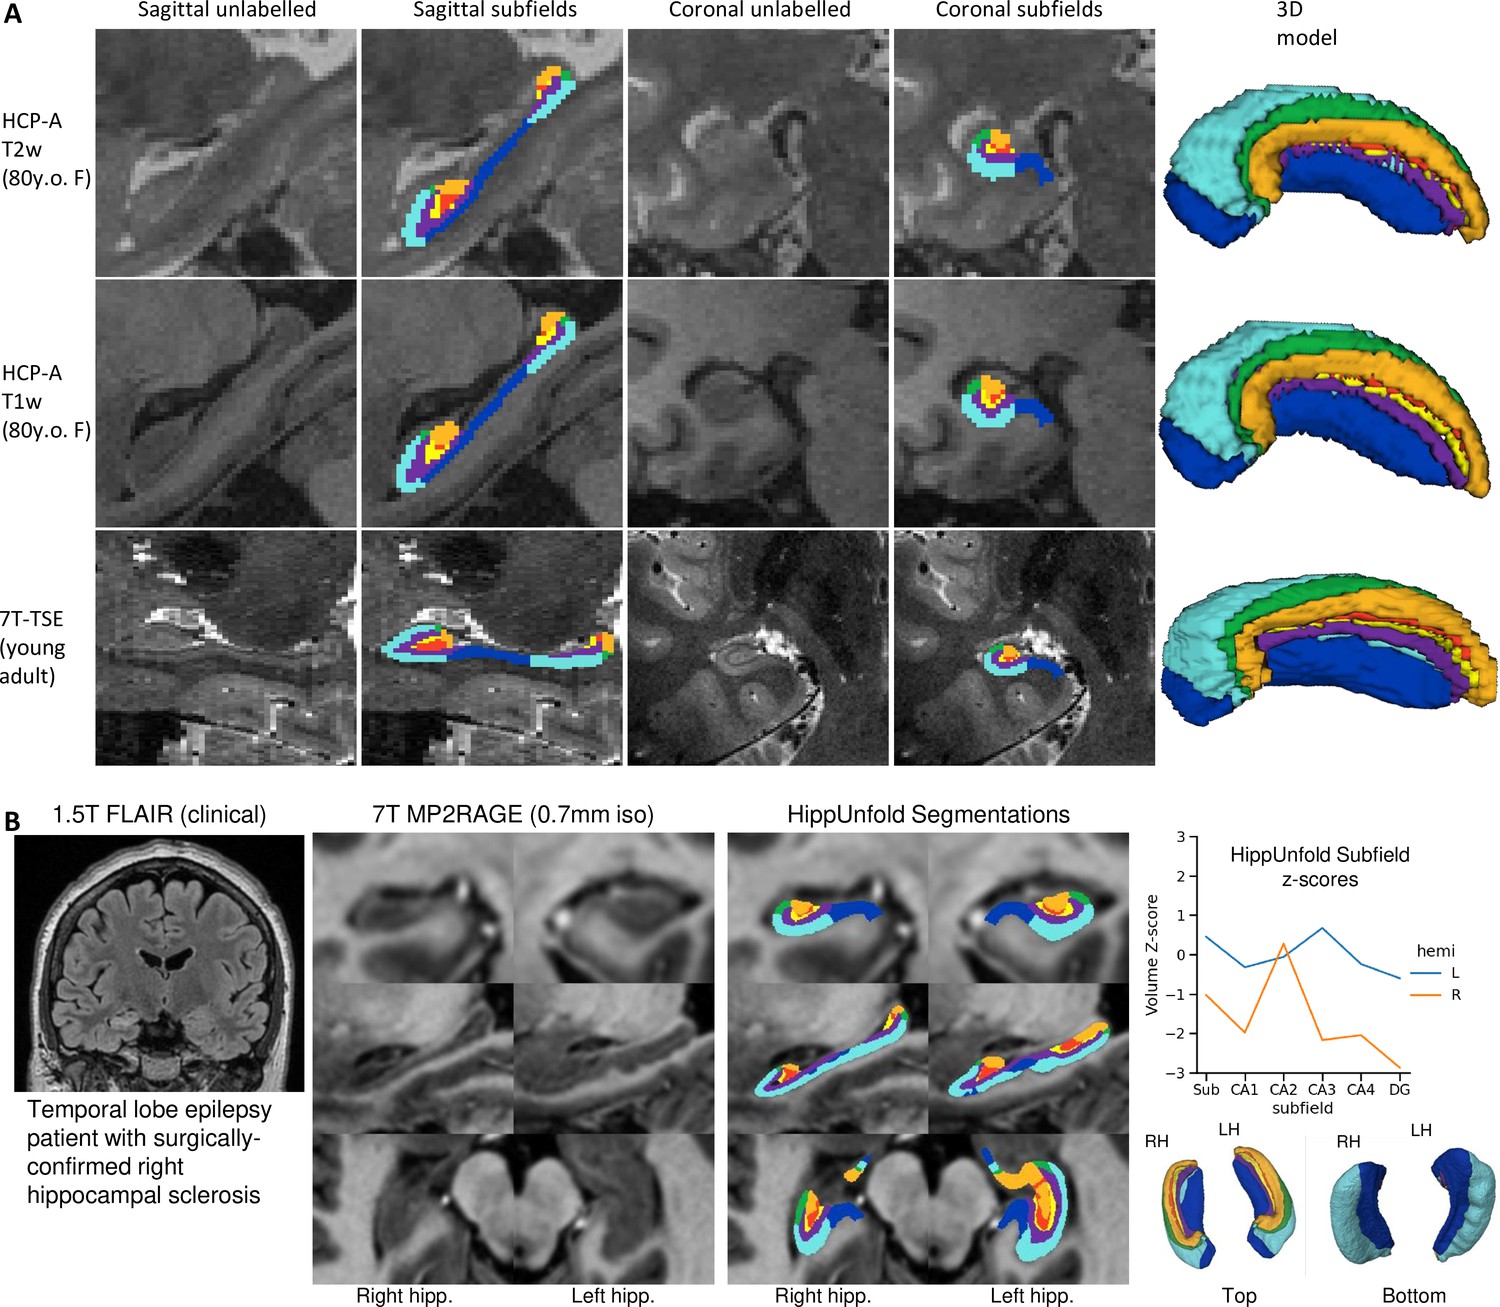
Examination of HippUnfold performance on additional datasets Human Connectome Project-Aging (HCP-A) (T1w and T2w) and anisotropic 7T-TSE data.
(A) Sample subjects’ HippUnfold subfield segmentation in native resolution. The first two rows come from the same subjects but using different input data modalities. (B) HippUnfold results from a 7 T MRI of a temporal lobe epilepsy patient with surgically confirmed right hippocampal sclerosis.
Figure 7
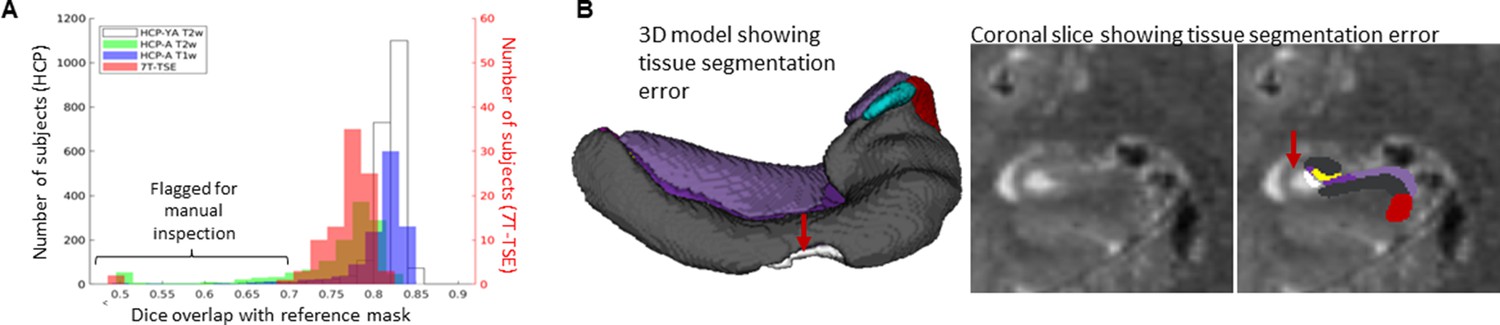
Automated error flagging via overlap with coarse, registration-based segmentation.
(A) Subjects flagged for quality assurance from each dataset based on Dice overlap with a reference mask approximated via deformable registration. (B) Failed subject example illustrating missed tissue (red arrows) at the nnUNet stage of the HippUnfold pipeline.
Tables
Table 1
MRI datasets used in training, evaluation, and comparison to extant methods.
Methods employed include those proposed here (HippUnfold), the same processing but with manual segmentation (similar to previous work; DeKraker et al., 2020) (manual unfold), Freesurfer v7.2.0 (FS7) (Iglesias et al., 2015), and an atlas of manual segmentations (Berron et al., 2017) used in ASHS (Yushkevich et al., 2015b).
| Name | Modalities | Resolution | Sample size (L+R) | Methods employed |
|---|---|---|---|---|
| HCP-YA | T1w, T2w | 0.7 × 0.7 × 0.7 mm3 | n=590 (training) | HippUnfold Manual unfold |
| n=148 (testing) | HippUnfold Manual unfold FS7 | |||
| HCP-A | T1w T2w SPACE T2w TSE | 0.8 × 0.8 × 0.8 mm3 0.8 × 0.8 × 0.8 mm3 0.4 × 0.4 × 2.0 mm3 | n=1312 for T1w, T2w SPACE n=200 for T2w TSE (FS7, ASHS) n=200 for T1w (HippUnfold) | HippUnfold FS7 ASHS |
| 7T-TSE (from ASHS atlas) | T2w | 0.4 × 0.4 × 1.0 mm3 | n=70 | HippUnfold Manual subfields |
Additional files
-
Supplementary file 1
HippUnfold Documentation.
This document fully describes the HippUnfold installation, command-line interface, options, outputs, and provides several useful pieces of information including worked examples and useful tips on viewing data in other common platforms.
- https://cdn.elifesciences.org/articles/77945/elife-77945-supp1-v2.pdf
-
Supplementary file 2
Side-by-side snapshot comparison of Human Connectome Project-Aging (HCP-A) segmentations results from HippUnfold, Freesurfer (FS7), and Automatic Segmentation of Hippocampal Subfields (ASHS) from the left hemisphere.
Snapshots were taken at the conronal centroid, centroid + 15 slices, centroid + 30 slices, and the sagittal centroid.
- https://cdn.elifesciences.org/articles/77945/elife-77945-supp2-v2.pdf
-
Supplementary file 3
Side-by-side snapshot comparison of Human Connectome Project-Aging (HCP-A) segmentations results from HippUnfold, Freesurfer (FS7), and Automatic Segmentation of Hippocampal Subfields (ASHS) from the right hemisphere.
Snapshots were taken at the conronal centroid, centroid + 15 slices, centroid + 30 slices, and the sagittal centroid.
- https://cdn.elifesciences.org/articles/77945/elife-77945-supp3-v2.pdf
-
Supplementary file 4
Detailed mathematical formulation of algorithms used throughout HippUnfold.
- https://cdn.elifesciences.org/articles/77945/elife-77945-supp4-v2.pdf
-
Transparent reporting form
- https://cdn.elifesciences.org/articles/77945/elife-77945-transrepform1-v2.docx
Download links
A two-part list of links to download the article, or parts of the article, in various formats.
Downloads (link to download the article as PDF)
Open citations (links to open the citations from this article in various online reference manager services)
Cite this article (links to download the citations from this article in formats compatible with various reference manager tools)
Automated hippocampal unfolding for morphometry and subfield segmentation with HippUnfold
eLife 11:e77945.
https://doi.org/10.7554/eLife.77945


