Single-cell analysis of skeletal muscle macrophages reveals age-associated functional subpopulations
- Laboratory of Genetics and Genomics, National Institute on Aging Intramural Research Program, National Institutes of Health, United States
- Flow Cytometry Core, National Institute on Aging Intramural Research Program, National Institutes of Health, United States
- Translational Gerontology Branch, National Institute on Aging Intramural Research Program, National Institutes of Health, United States
Figures
Figure 1 with 2 supplements
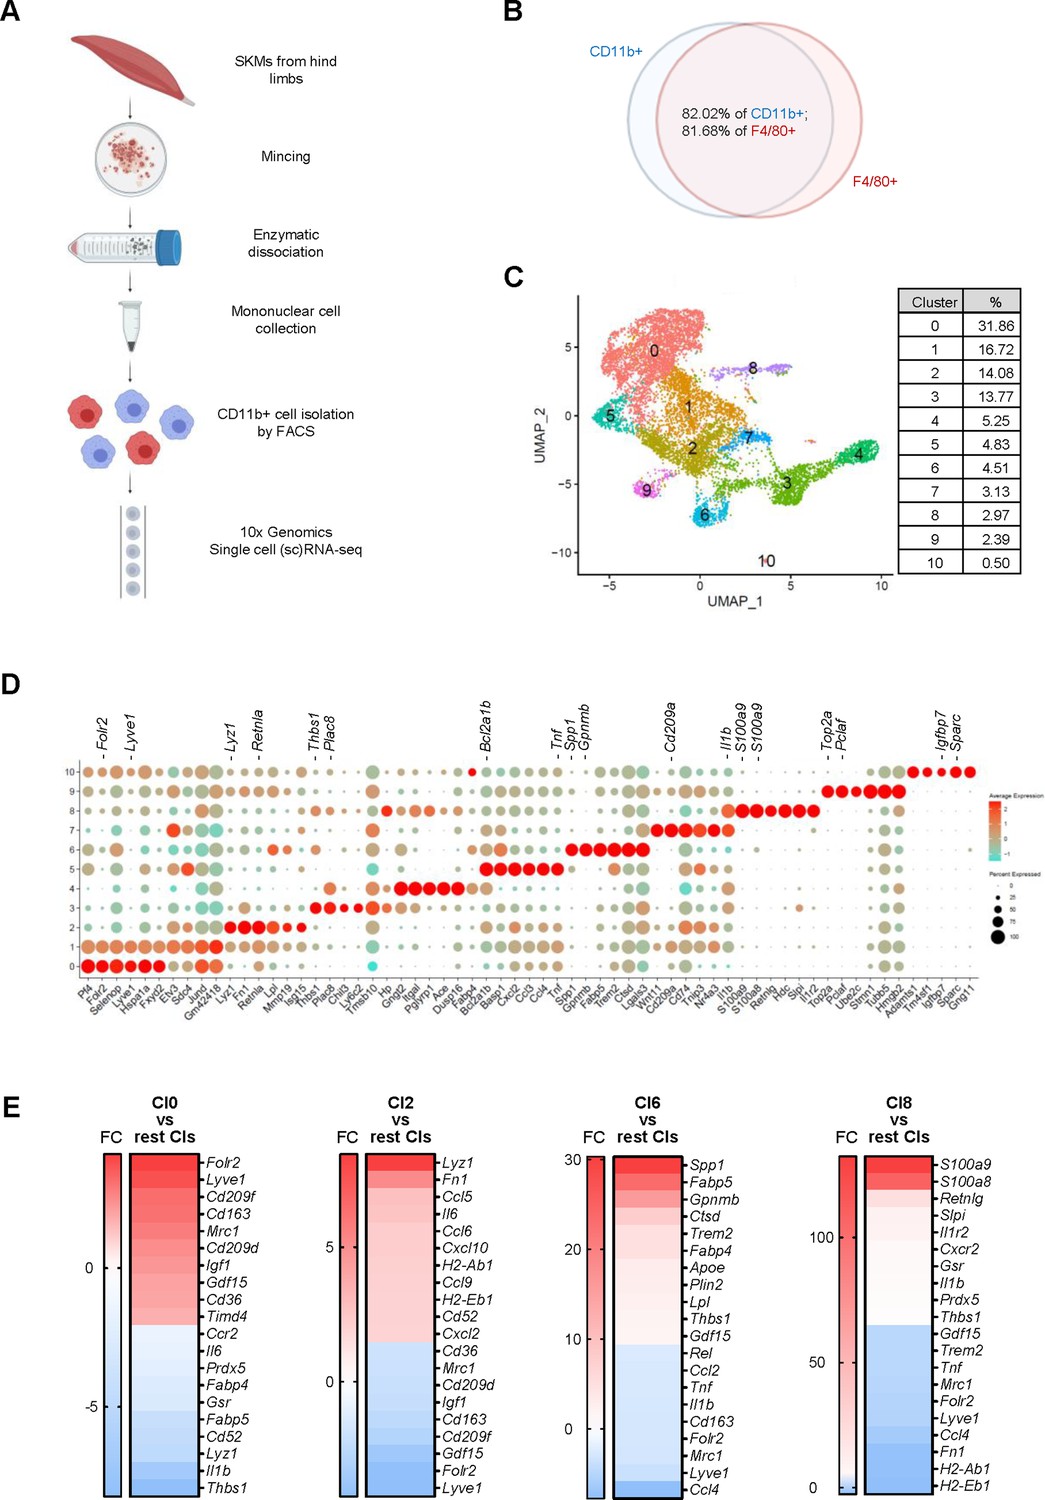
Macrophage isolation from mouse skeletal muscle (SKM) and single-cell RNA-seq analysis.
(A) Workflow of mononuclear cell collection from mouse SKM, CD11b+ cell isolation by FACS, and single-cell RNA-seq analysis using the 10× Genomics platform. (B) Cells isolated from mouse SKM that were CD11b+ and F4/80+. (C) Unsupervised clustering of SKM macrophages revealed 11 clusters. %, proportion of each cluster. (D) Dot plot shows featured mRNAs in each cluster. (E) Heat maps show enriched genes in Cl0, 2, 6, and 8.
Figure 1—figure supplement 1
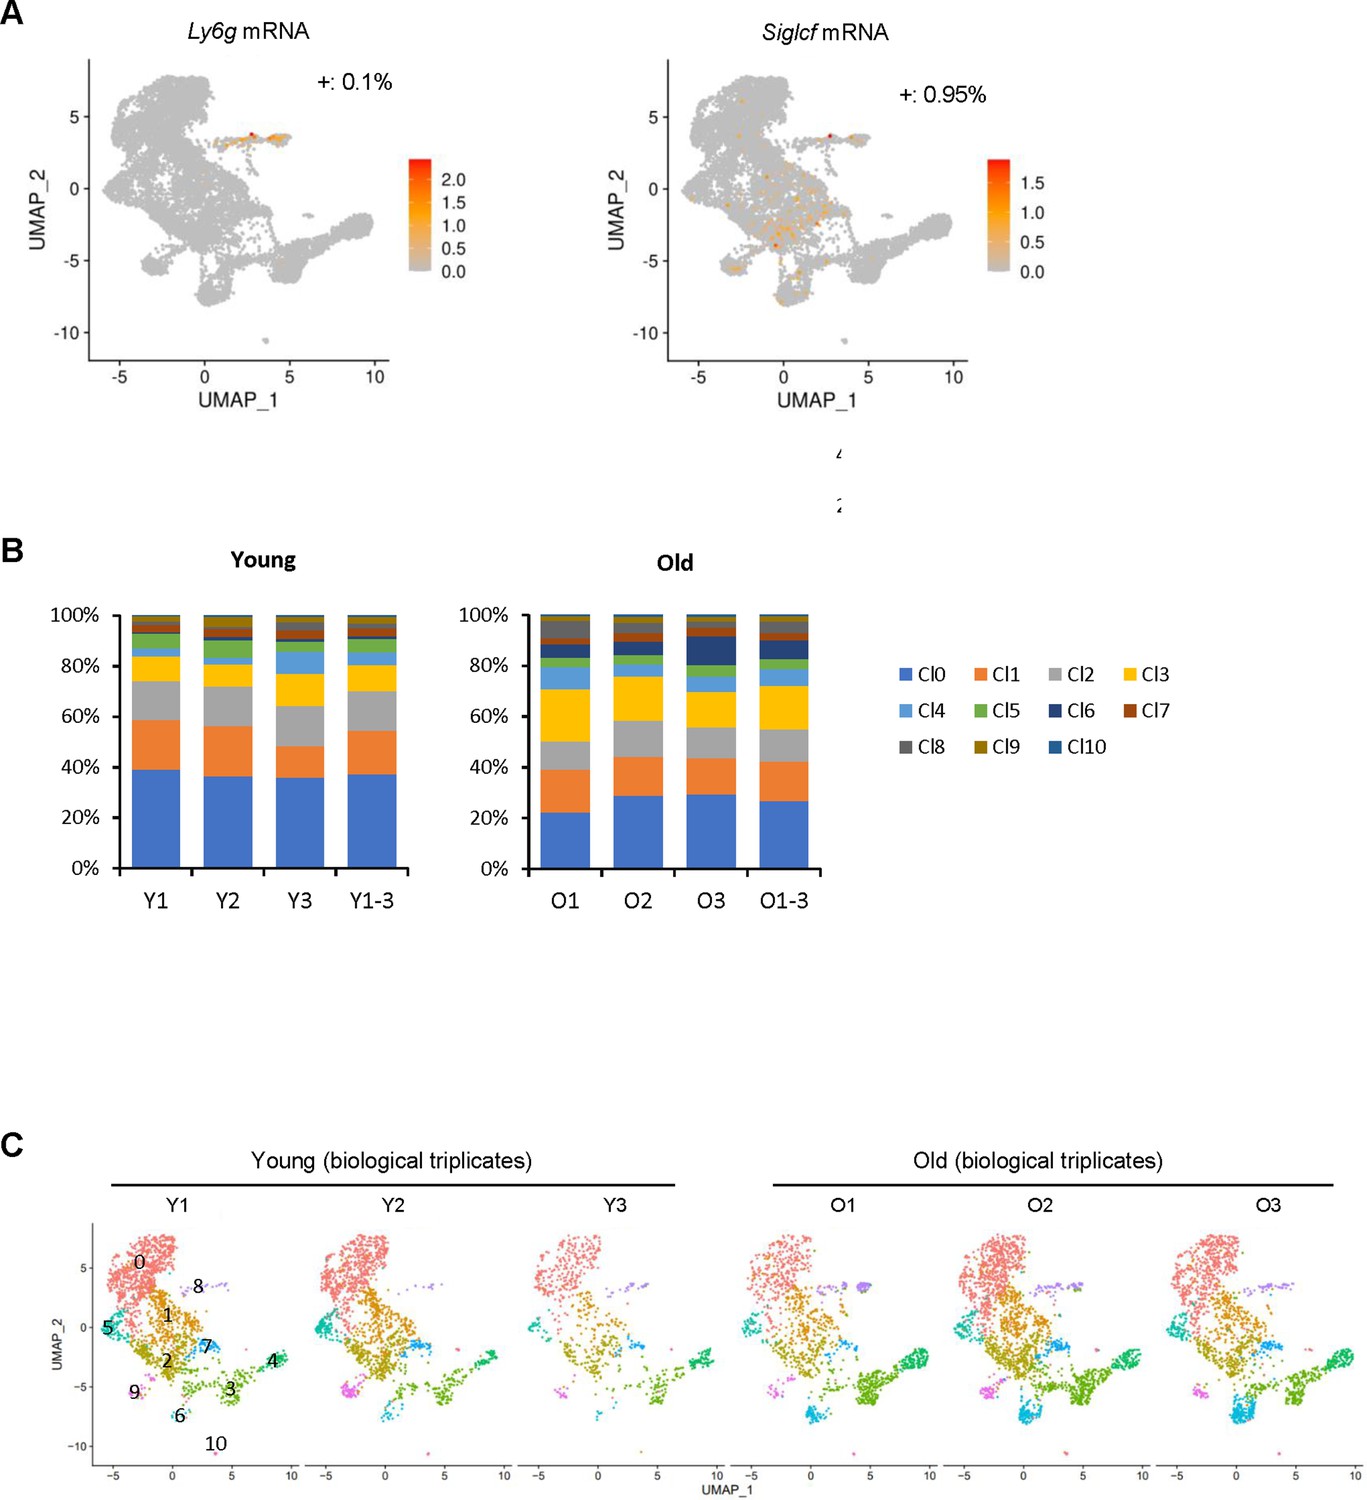
Quality control experiments for the skeletal muscle (SKM) macrophage, single-cell RNA-seq analysis.
(A) Uniform Manifold Approximation and Projection (UMAP) analysis to assess possible contamination of neutrophils and eosinophils in the CD11b+/F4/80+double-positive macrophage population. (B) Percentages of macrophages in each cluster and each biological replicate in young (Y) SKM and old (O) SKM. (C) UMAP representation of three biological replicates of macrophages from young (Y) SKM and old (O) SKM.
Figure 1—figure supplement 2
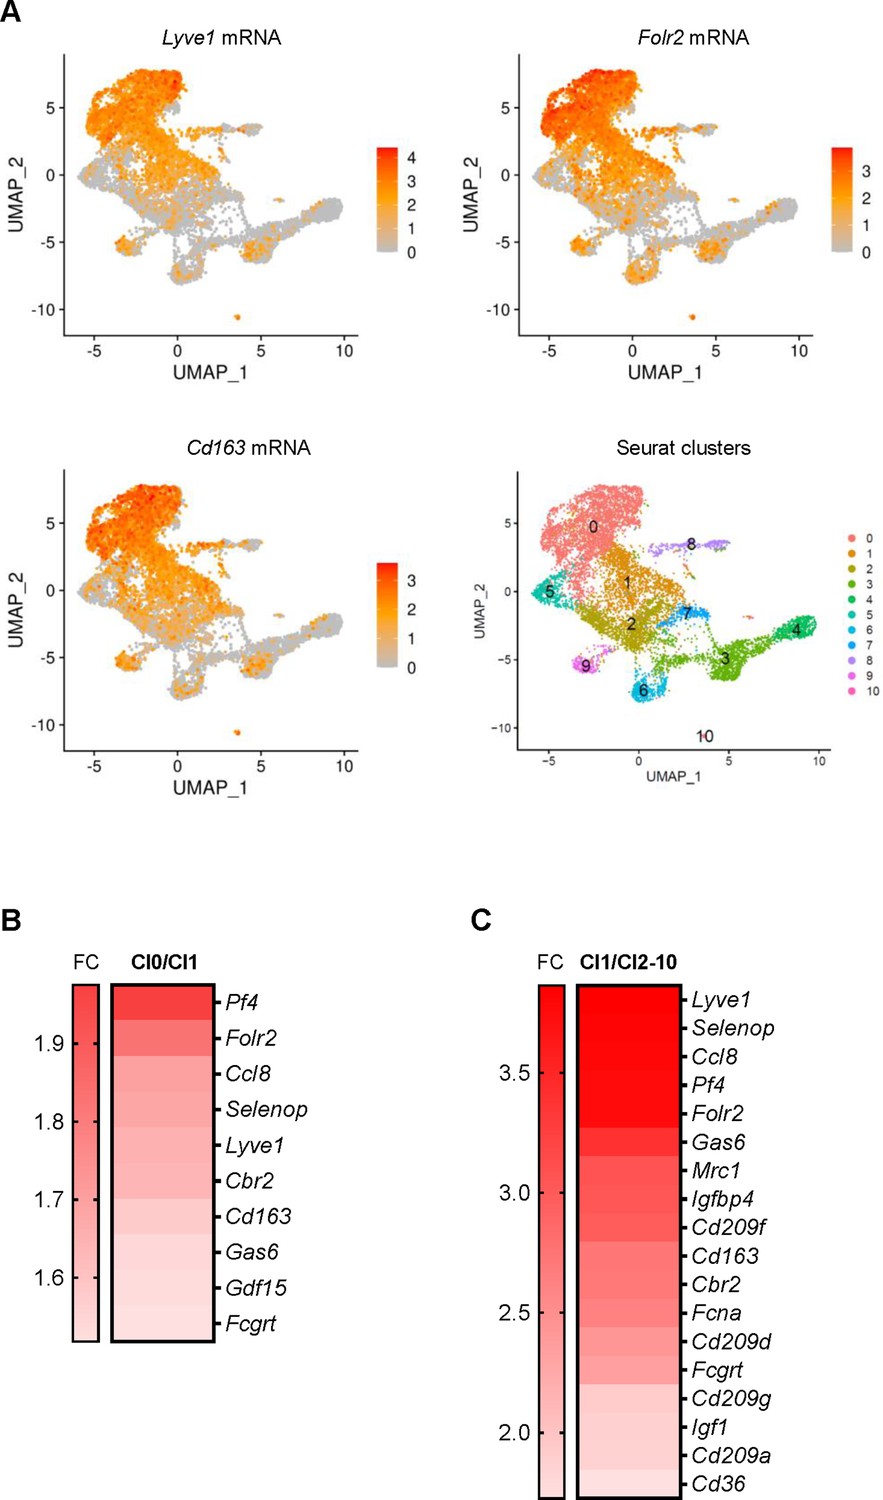
M2-like features of Cl1 in unsupervised clustering.
(A) Uniform Manifold Approximation and Projection (UMAP) representation of Lyve1, Folr2, and Cd163 mRNAs, encoding M2 markers in Cl0 compared to Cl1. Bottom right, designation of unsupervised clusters. (B) Expression levels of M2 marker genes in Cl0 to Cl1. (C) Enrichment of mRNAs encoding M2 markers in Cl1 relative to Cl2-10.
Figure 2 with 1 supplement
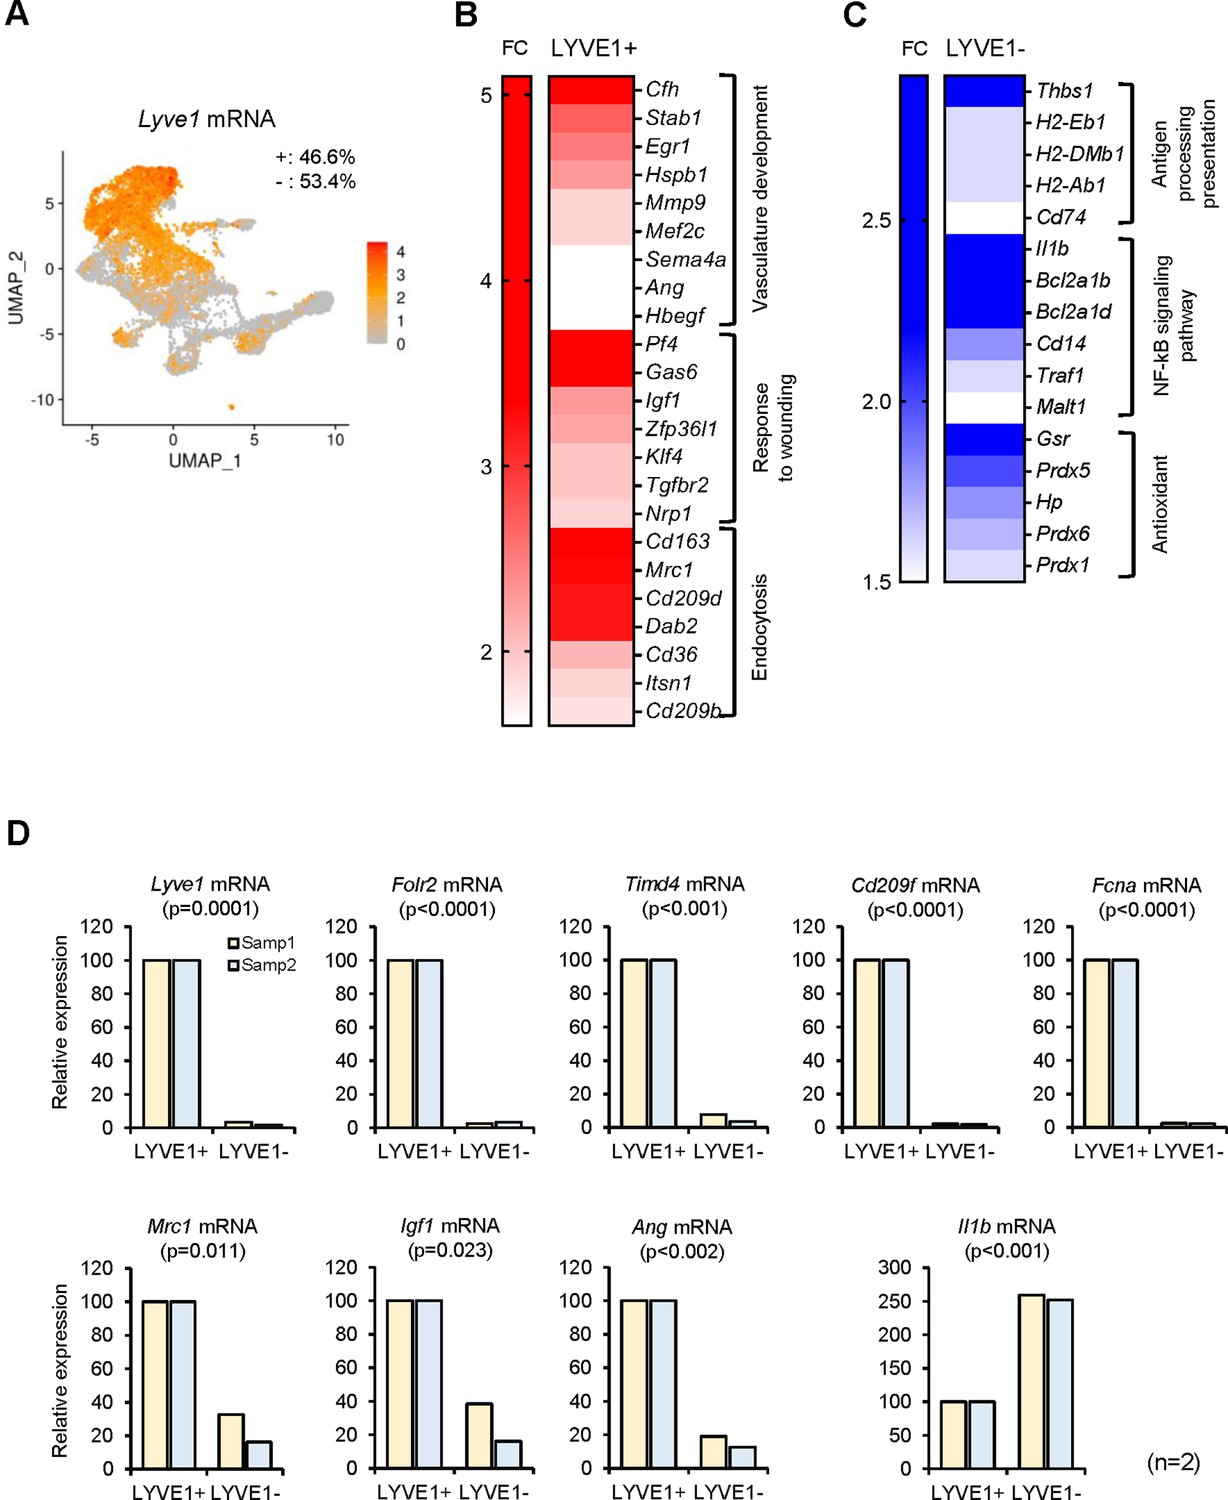
Functional clusters of genes differentially expressed in LYVE1+ and LYVE1− macrophages following single-cell RNA-sequencing (scRNA-seq) analysis.
(A) Lyve1 mRNA expression pattern in skeletal muscle (SKM) macrophages. (B) mRNAs highly expressed in functional clusters of LYVE1+ macrophages. (C) mRNAs highly expressed in LYVE1− macrophages. (D) Validation of select mRNAs differentially abundant as identified in panels (B and C). LYVE1+ and LYVE1− macrophages were isolated by fluorescence-activated cell sorting (FACS) from three male mice, 3 months old (m.o.), and mRNAs elevated in LYVE1+ macrophages (top and bottom left), and mRNAs predominantly elevated in LYVE1− macrophages (bottom right) were quantified by RT-quantitative PCR (qPCR) analysis. Data were normalized to the levels of Gapdh mRNA, also measured by RT-qPCR analysis. Data represent the means and SD from two different sorts for each group.
Figure 2—figure supplement 1
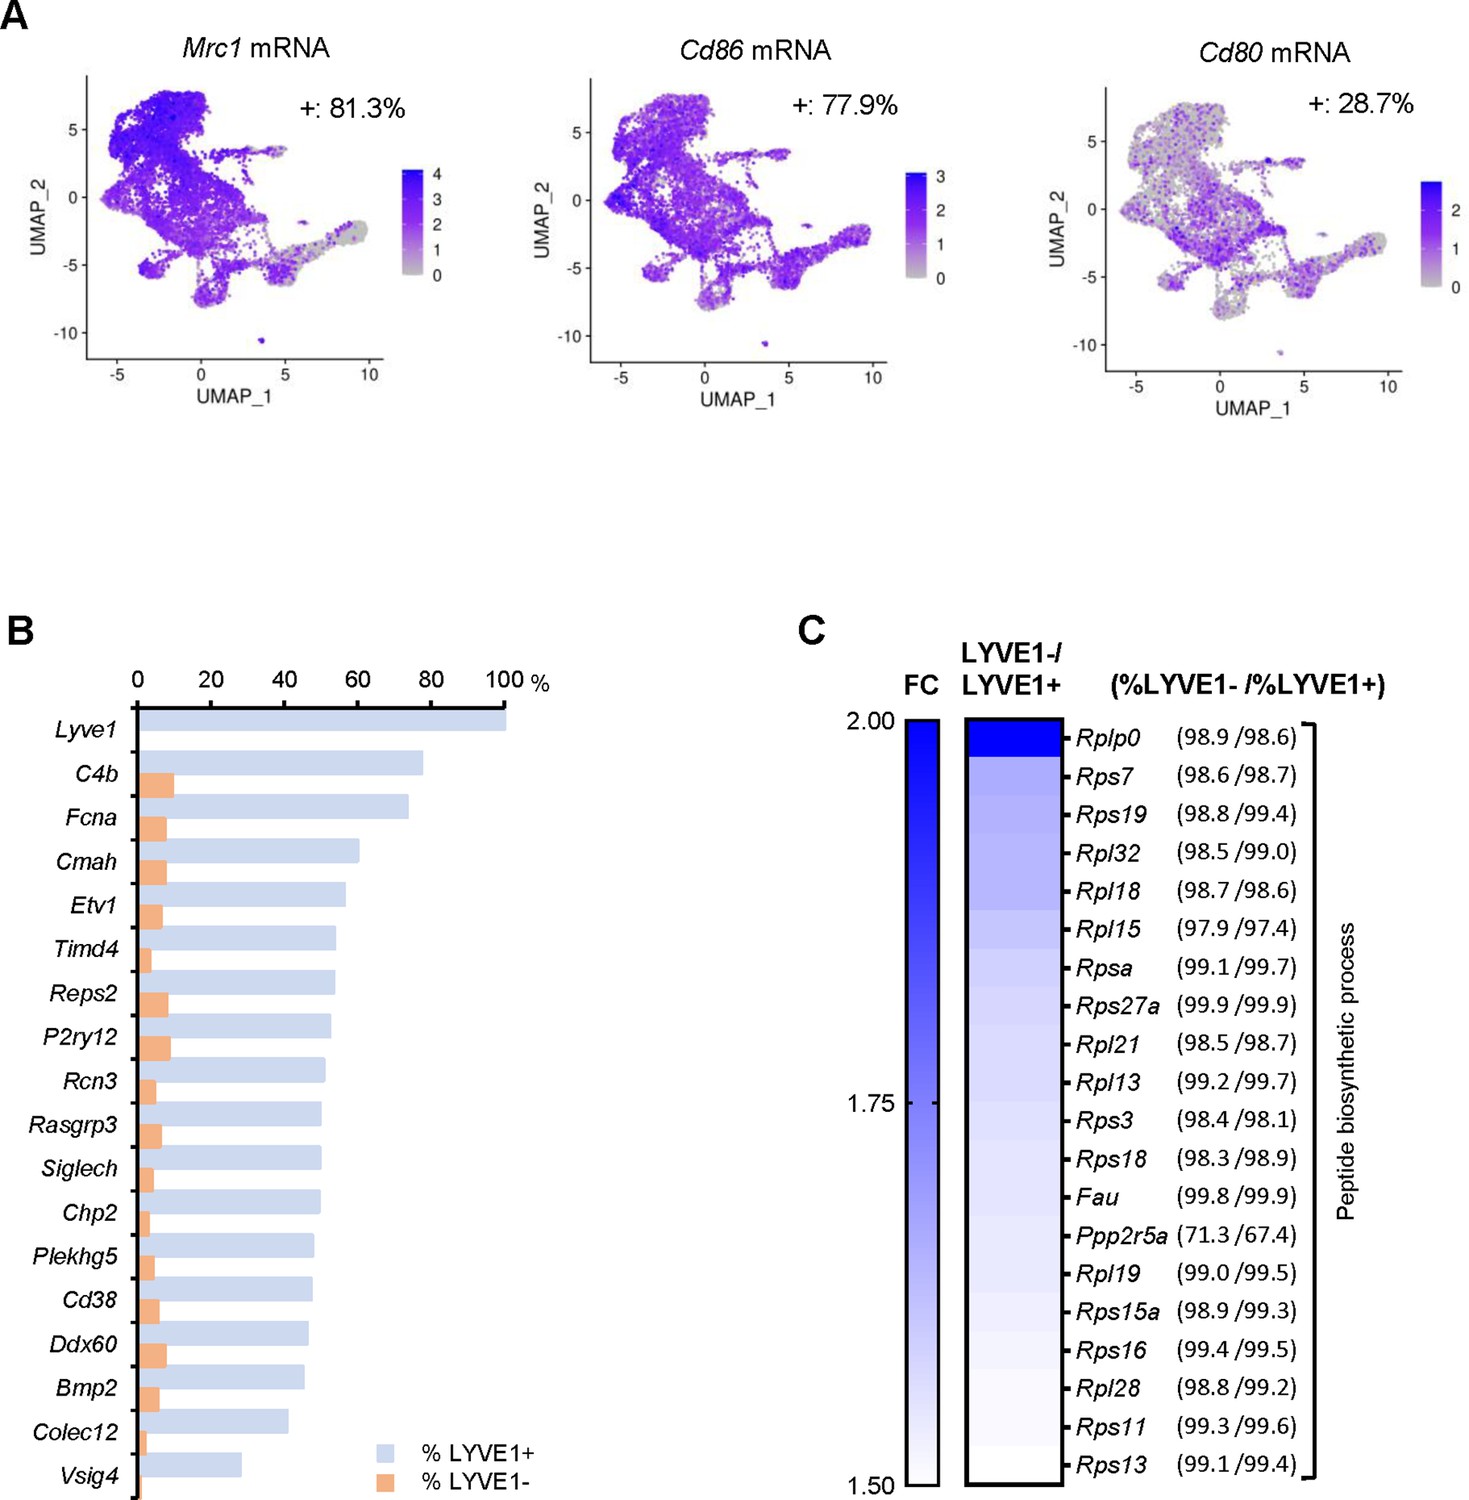
mRNAs highly expressed in LYVE1+ or LYVE1− macrophages.
(A) Mrc1 (Cd206), Cd86, and Cd80 mRNAs expressed in skeletal muscle (SKM) macrophages. (B) mRNAs almost exclusively expressed in LYVE1+ macrophages. (C) Cluster of mRNAs encoding ribosomal proteins highly expressed in LYVE1− macrophages. Note, genes listed in this panel were expressed in similar number of macrophages in the LYVE1+ and LYVE1− subpopulations but were highly expressed in the LYVE1− subpopulation.
Figure 3 with 1 supplement
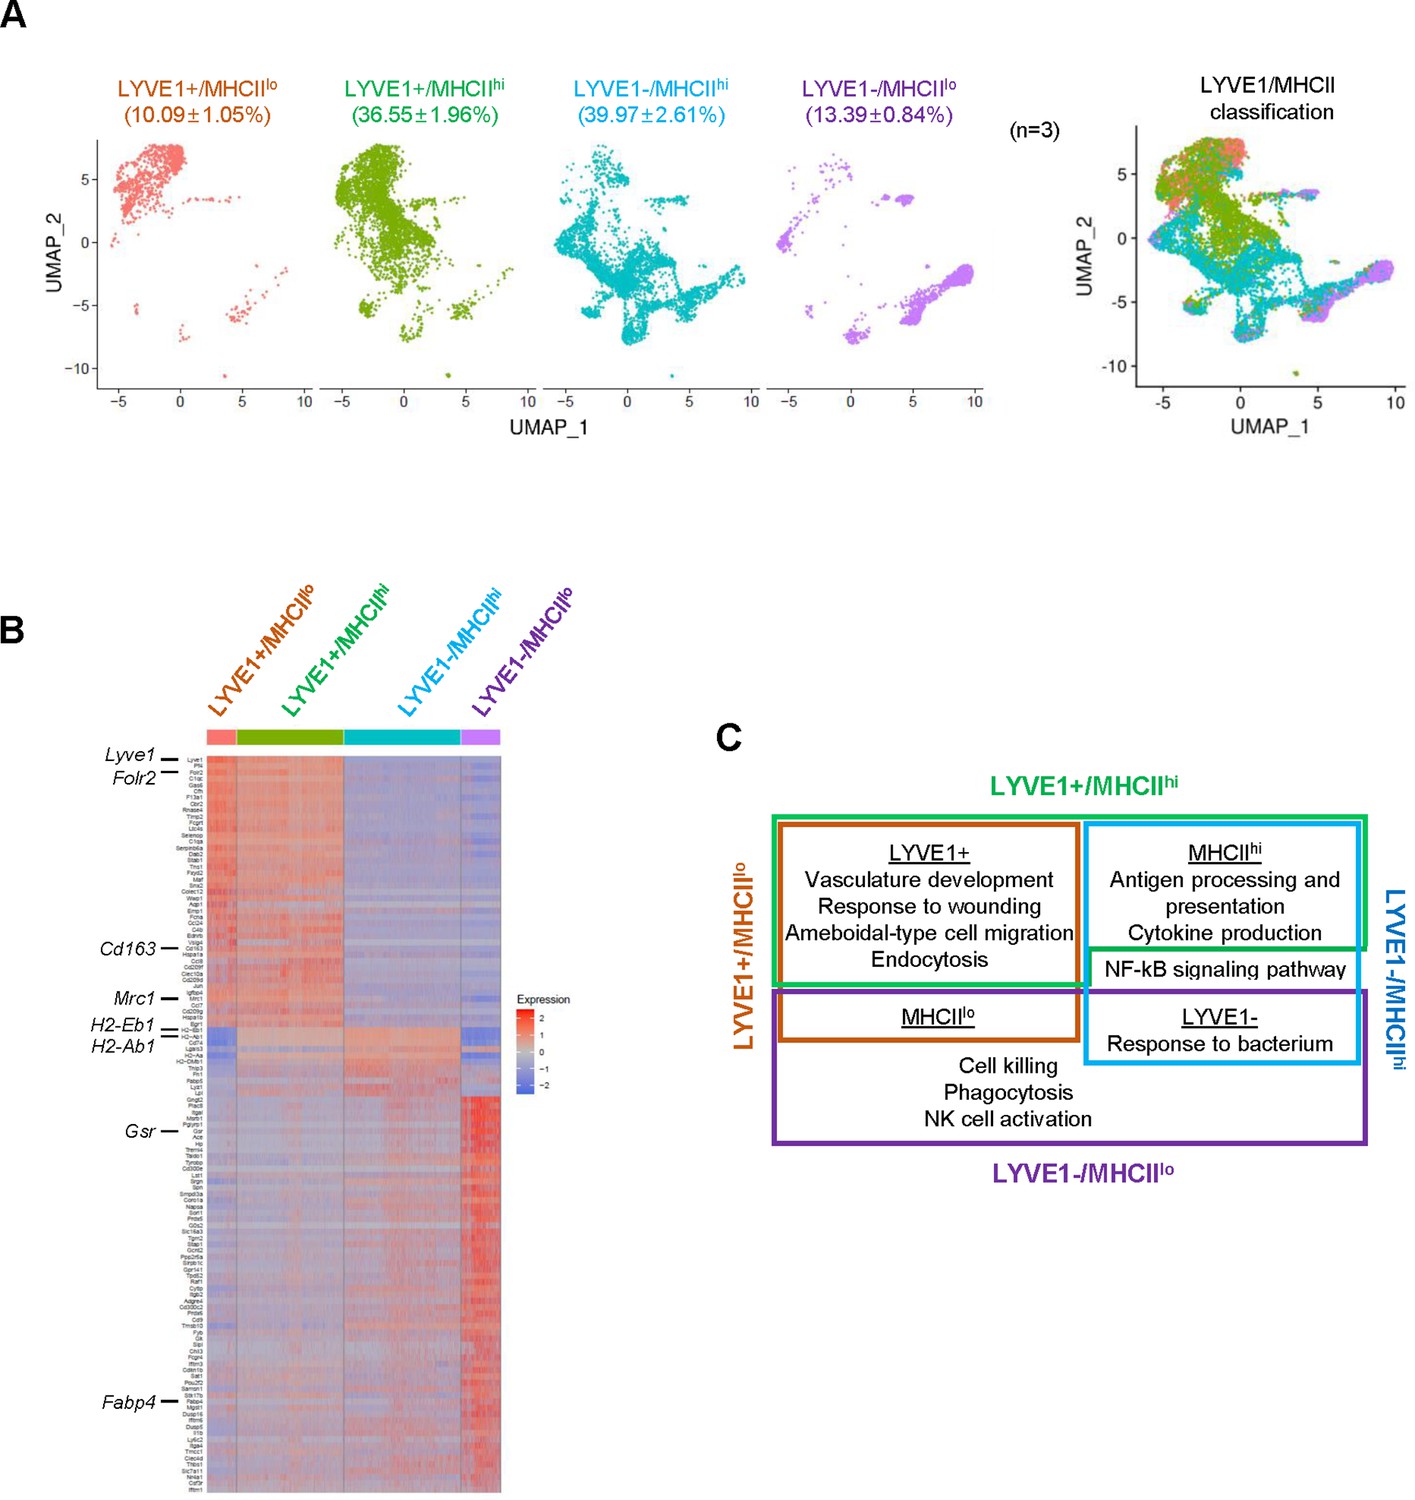
Classification of mouse skeletal muscle (SKM) macrophages into four functional subgroups according to surface markers.
(A) Subclassification of mouse SKM macrophages based on LYVE1 and MHCII levels: LYVE1+/MHCIIlo, LYVE1+/MHCIIhi, LYVE1−/MHCIIhi, and LYVE1−/MHCIIlo. Uniform Manifold Approximation and Projection (UMAP) analysis of the distribution and size of each of four subgroups individually (left) and combined (right). (B) Heat map analysis of the single-cell RNA-sequencing (scRNA-seq) data depicting distinct gene expression patterns of the four subgroups. (C) Gene ontology (GO) annotation of the functions of each subgroup. Brown box, LYVE1+/MHCIIlo; green box, LYVE1+/MHCIIhi; blue box, LYVE1−/MHCIIhi; purple box, LYVE1−/MHCIIlo.
Figure 3—figure supplement 1
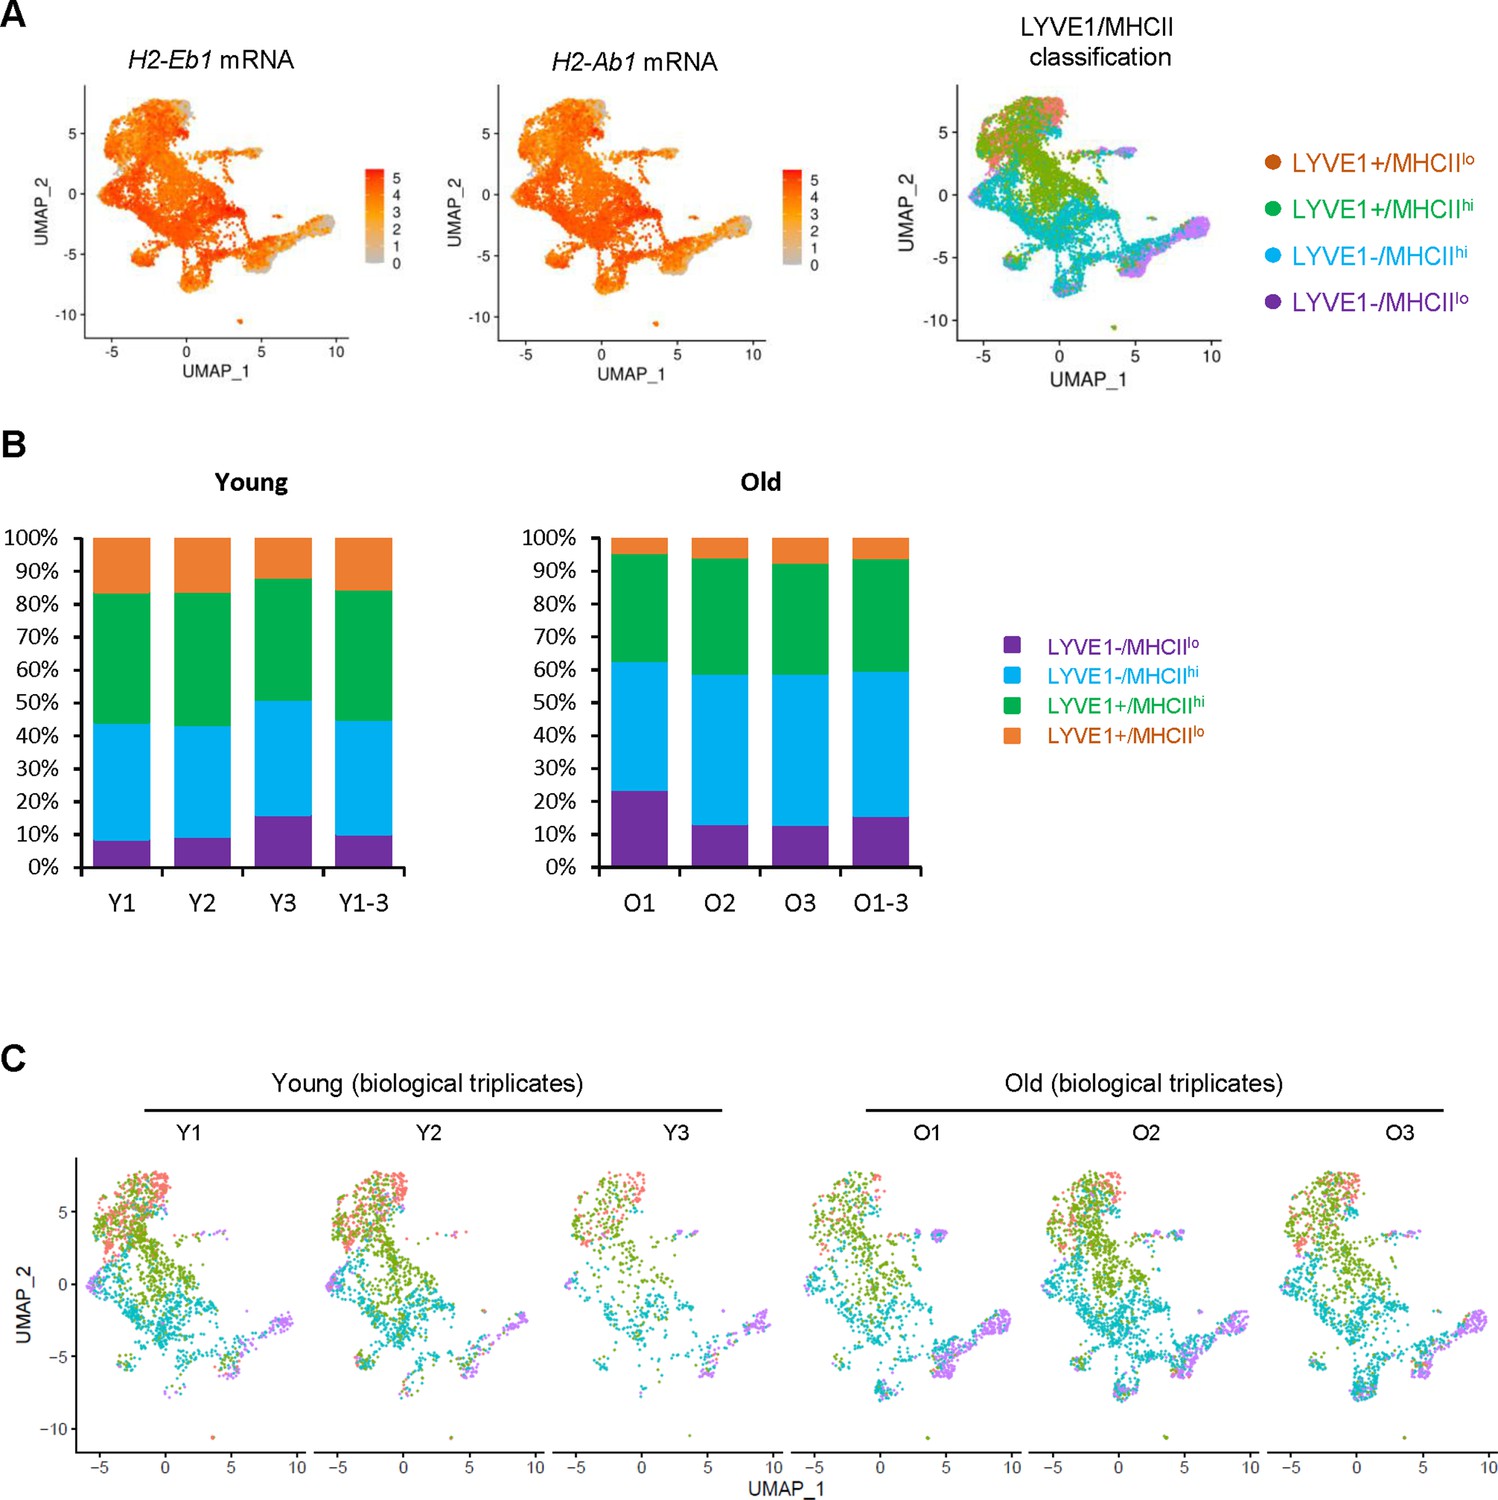
LYVE1 and MHCII are used to classify skeletal muscle (SKM) macrophages into four subgroups.
(A) Expression patterns of two MHCII genes, H2-Eb1 and H2-Ab1 mRNAs. Right, four supervised macrophage subgroups. (B) Percentages of macrophages in each subgroup and each biological replicate in young (Y) and old (O) SKM. (C) Biological replicates of macrophage classification in young (Y) and old (O) SKM.
Figure 4 with 1 supplement
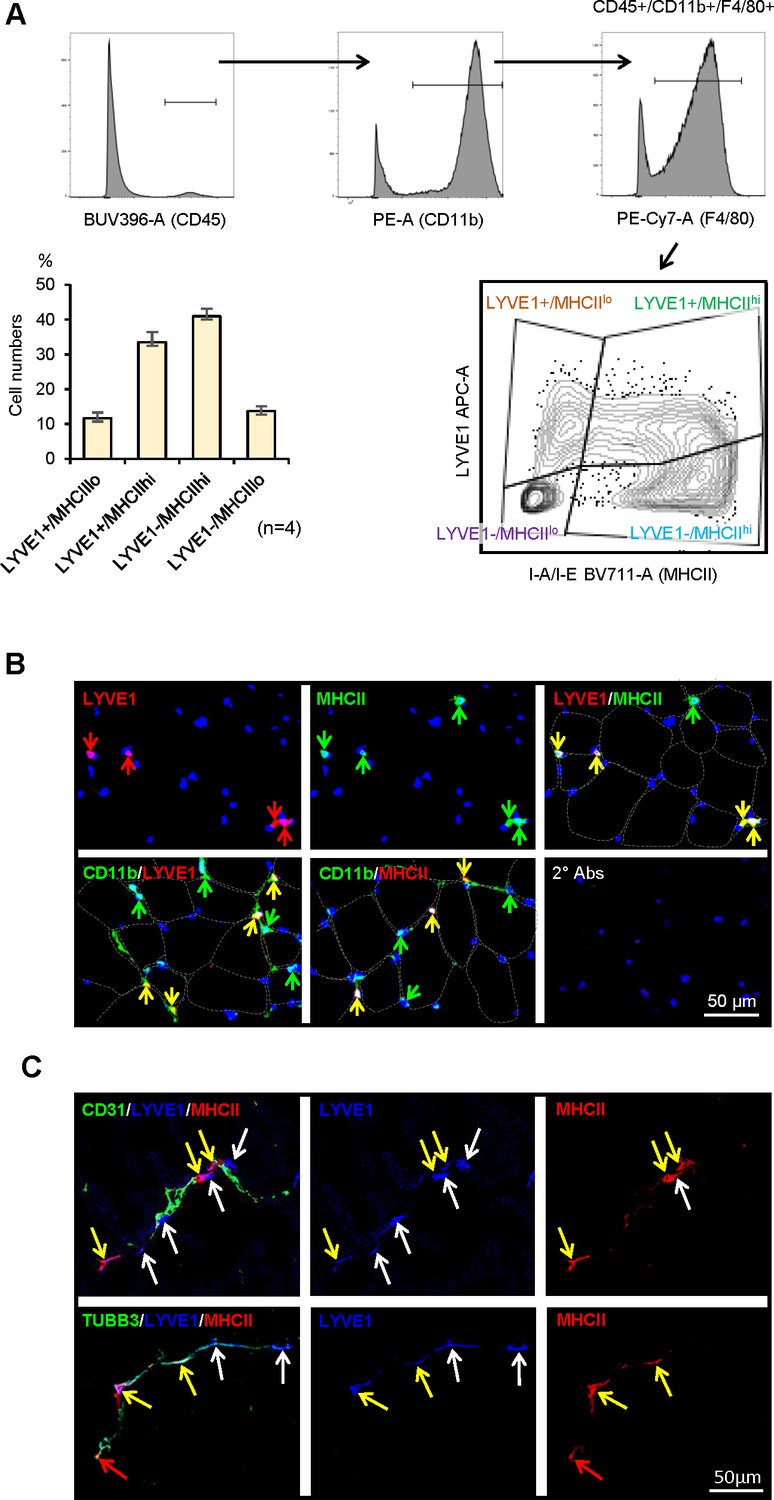
Characterization of macrophage subgroups by flow cytometry and immunofluorescence staining.
(A) Flow cytometric analysis of the four subgroups in skeletal muscle (SKM). CD45+/CD11b+/F4/80+macrophages (top three panels show gating) were further classified by LYVE1 and MHCII (bottom right). LYVE1+/MHCIIlo, LYVE1−/MHCIIhi, and LYVE1−/MHCIIlo subgroups formed clear cell clusters, while LYVE1+/MHCIIhi spanned LYVE1+/MHCIIlo and LYVE1−/MHCIIhi. Note: the sizes of each subgroup by flow cytometric analysis (bottom left) were similar to those seen with single-cell RNA-seq analysis. Gating was based on FMO (fluorescence minus one) controls for each experiment. (B) Immunofluorescence analysis of the presence of LYVE1+/MHCIIhi macrophages in mouse SKM. Top, LYVE1+, MHCII+, and LYVE1+/MHCII+ double-positive cells in endomysium and perimysium areas of mouse SKM. Bottom, colocalization of LYVE1 (left) and MHCII (middle) with CD11b, a macrophage marker; secondary antibodies only (right). (C) LYVE1+ macrophages LYVE1+/MHCIIlo and LYVE1+/MHCIIhi, colocalizing with CD31+, depicting blood vessels (top). LYVE1+ and LYVE1− macrophages colocalizing with the nerve fiber marker TUBB3+ (bottom).
Figure 4—figure supplement 1
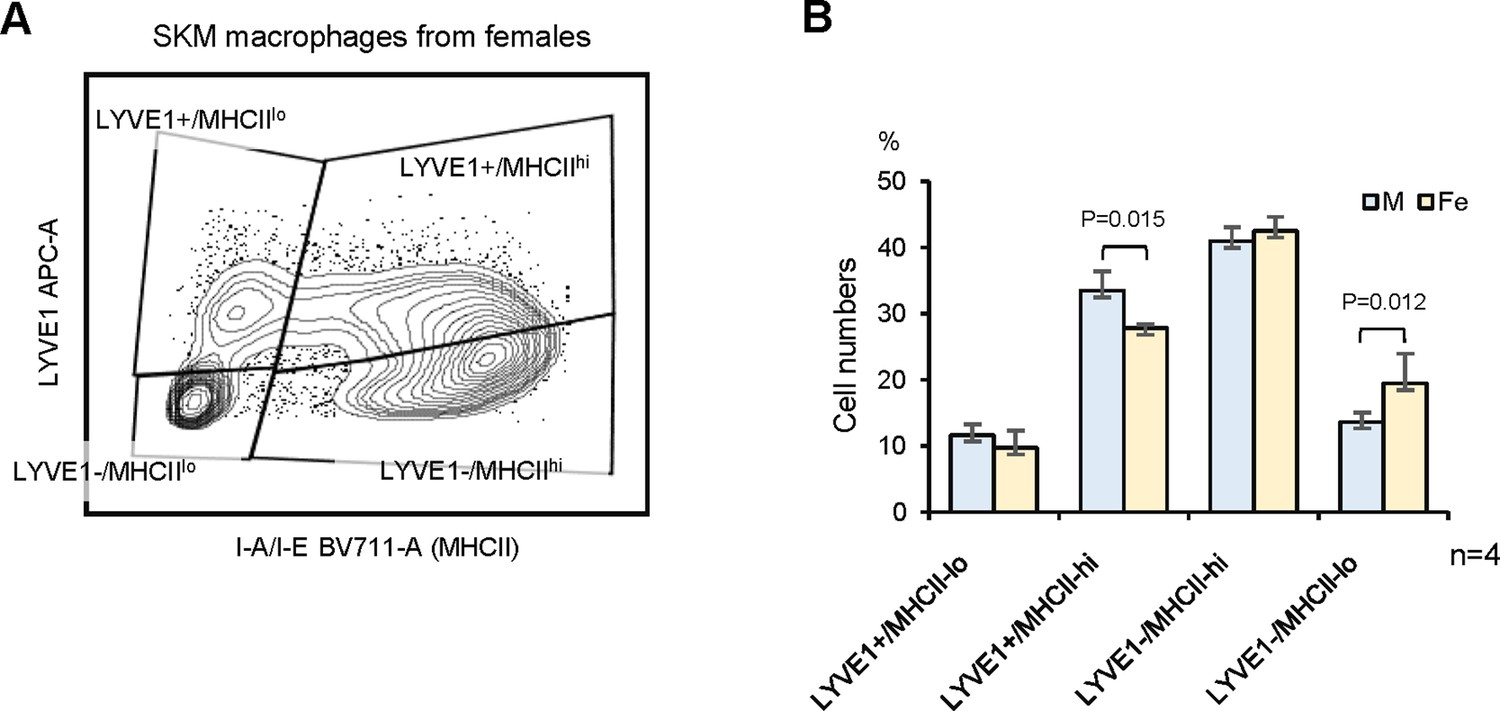
Skeletal muscle (SKM) macrophages from female mice.
(A) Flow cytometric analysis of the four macrophage subgroups in females and males. (B) Quantification of the numbers of each SKM macrophage group in female and male mice.
Figure 5 with 2 supplements
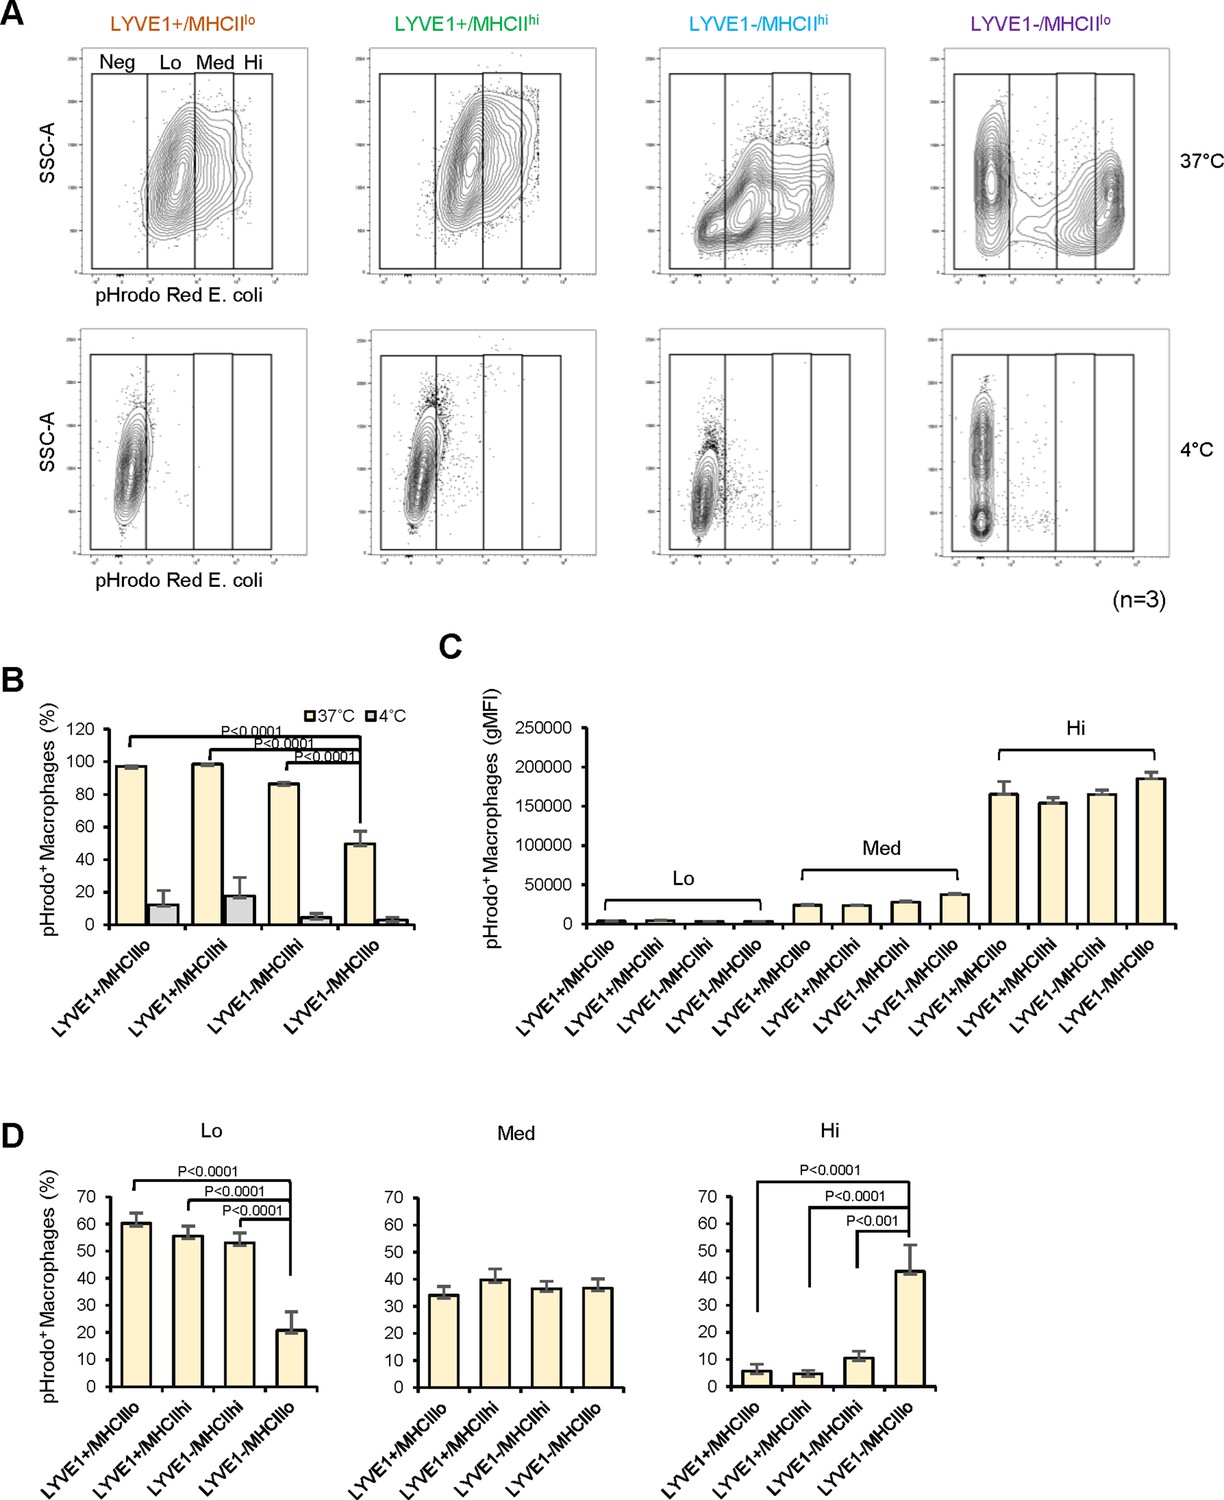
Analysis of the phagocytic capacities of each macrophage subgroup.
(A) Phagocytic activity was measured for mouse skeletal muscle (SKM) macrophages at 4°C (control, low phagocytosis) and 37°C (active phagocytosis, right boxes). Phagocytic capacity was divided into groups that were negative (Neg; intensity <103), low (Lo; 103–104), medium (Med; 104–105), and high (Hi; >105), depending on signal intensities. Gating was established using fluorescence minus one (FMO) controls for each experiment. (B) Quantification of the macrophages showing active phagocytosis (Lo + Med + Hi) in the four subgroups. (C) Signal intensities of macrophages in each capacity group (Lo, Med, and Hi). (D) Quantification of number of active phagocytic macrophages in each subgroup of the three intensity groups. Data are representative of three independent experiments.
Figure 5—figure supplement 1
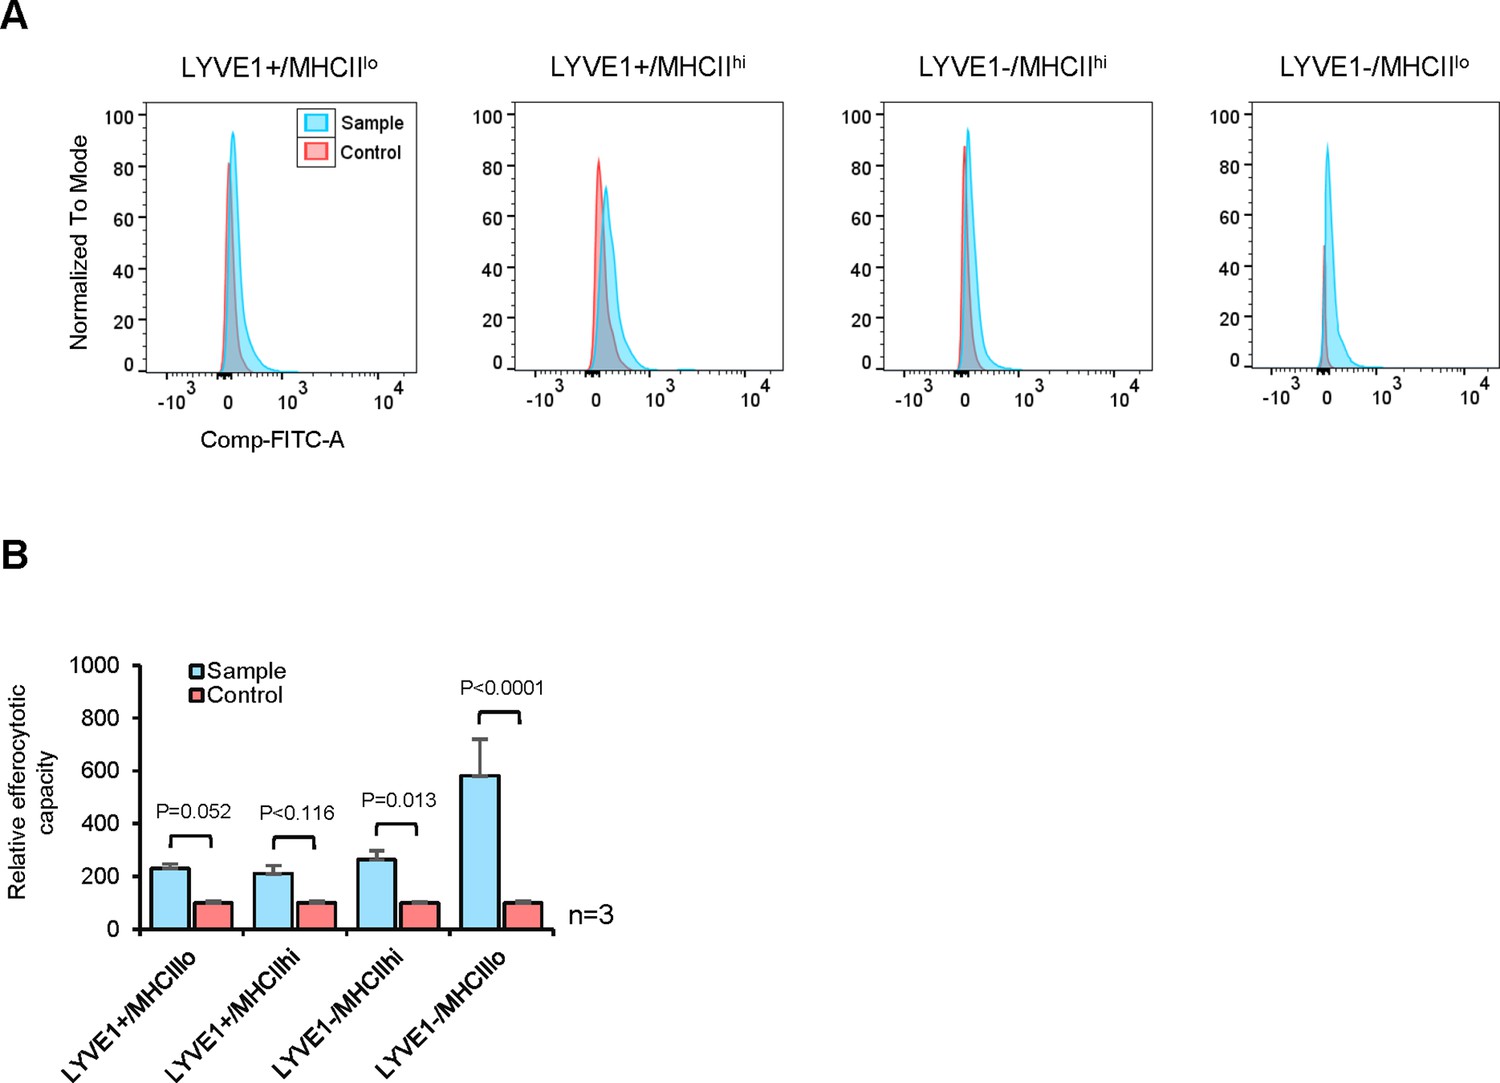
Efferocytotic capacities of four macrophage subgroups.
(A) Efferocytosis assays to identify macrophages phagocytizing apoptotic cells. (B) Quantification of the efferocytosis activity of each macrophage subgroup.
Figure 5—figure supplement 2
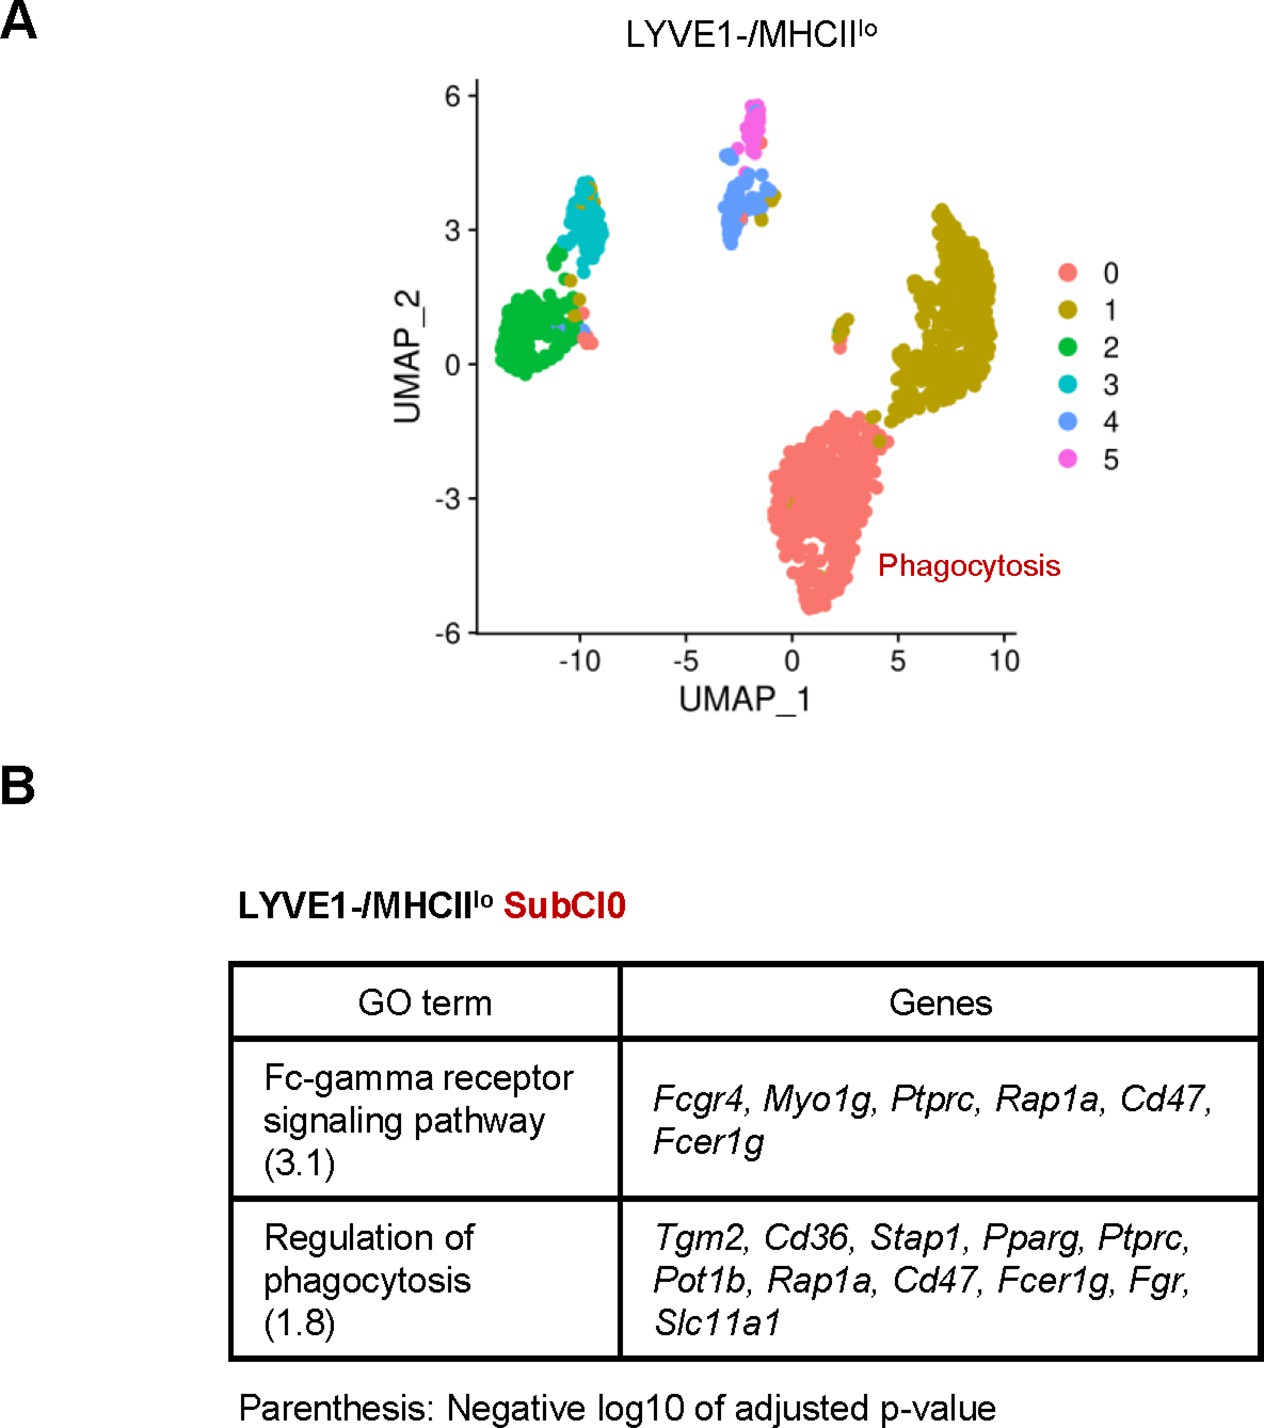
Classification of LYVE1−/MHCIIlo subgroup by unsupervised clustering.
(A) Unsupervised clustering revealed six subclusters (SubCl) in LYVE1−/MHCIIlo subgroup. (B) Gene ontology (GO) terms and associated genes in SubCl0.
Figure 6 with 1 supplement

Analysis of gene expression programs in skeletal muscle (SKM) macrophages from young and old mice before clustering.
(A) In single-cell RNA-sequencing (scRNA-seq) analysis, a total of 88 mRNAs were differentially expressed between old and young SKM. Arrows indicate featured mRNAs upregulated (red) or downregulated (blue) in old SKM macrophages. (B) Gene ontology (GO) annotation depicting the functional categories that were upregulated and downregulated in the old SKM macrophages relative to young SKM macrophages. (C) Fold changes in the abundance of select mRNAs (O/Y), as determined from the scRNA-seq analysis.
Figure 6—figure supplement 1

Number of CD45+, CD45+/CD11b+, and CD45+/CD11b+/F4/80+ cells obtained from young and old males and females.
(A) Number of corresponding cells from skeletal muscle (SKM) tissues. Male mice tend to have more CD45+, CD45+/CD11b+, and CD45+/CD11b+/F4/80+ cells compared to females (not statistically significant). (B) Females show very similar numbers between young and old. (C) % of corresponding cell populations in CD45+ cells in young and old males. (D) % of corresponding cell populations in CD45+ cells in young and old females.
Figure 7 with 2 supplements
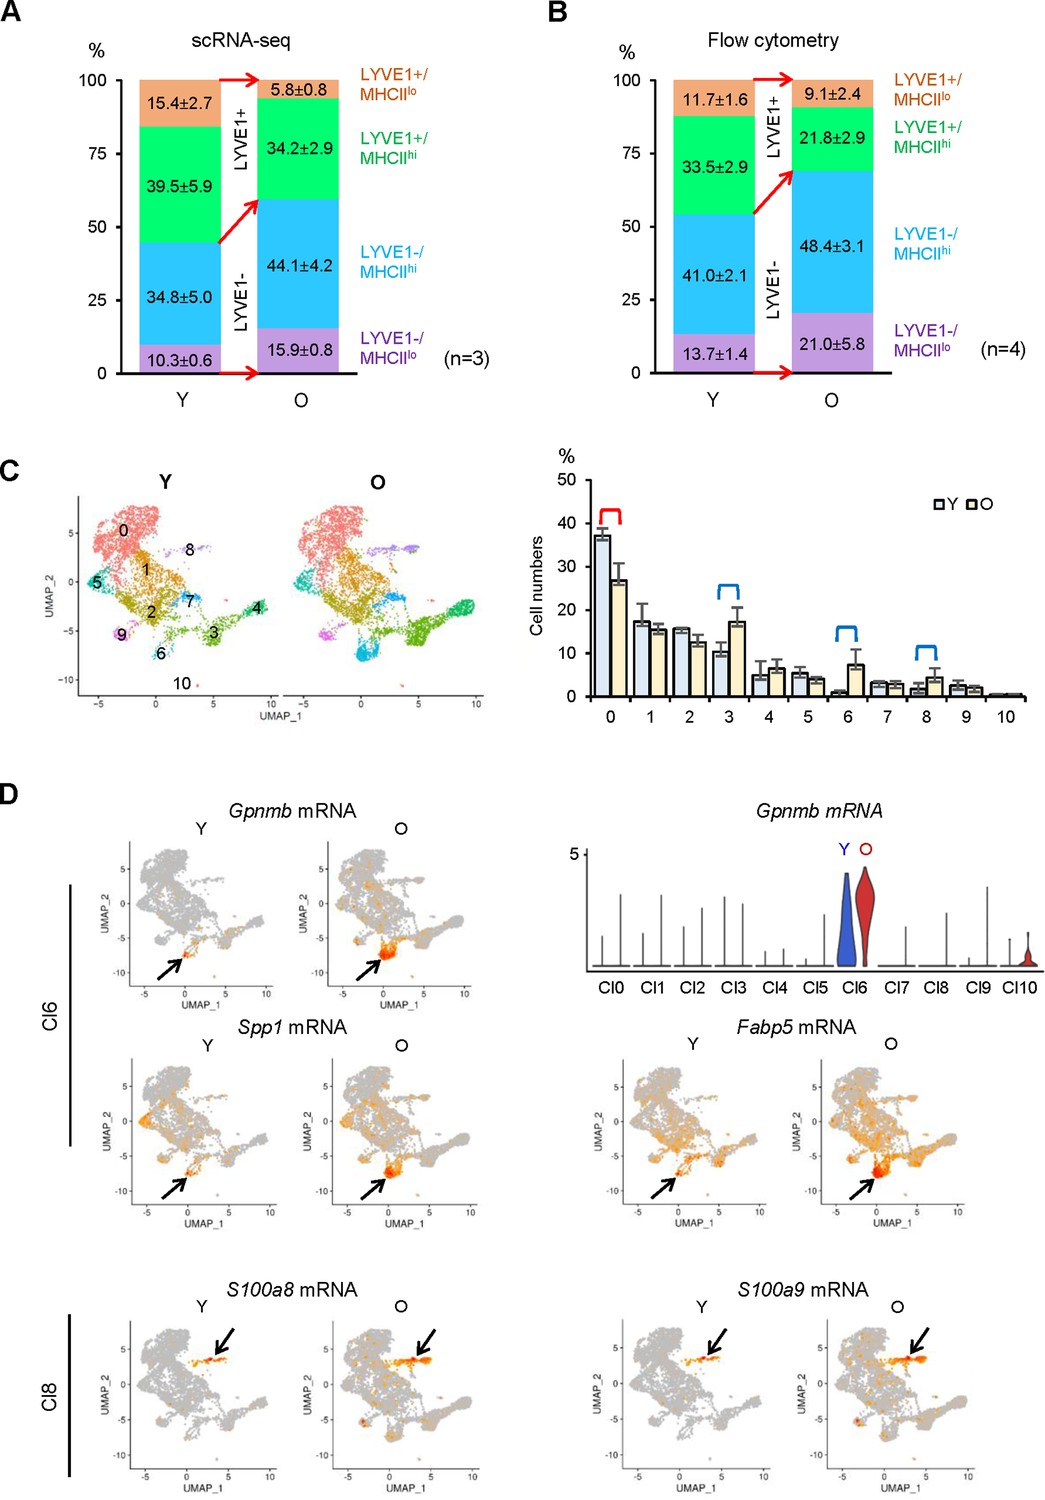
Identification of changes in macrophage subpopulations in old (O) relative to young (Y) skeletal muscle (SKM).
(A) Single-cell RNA-sequencing (scRNA-seq) analysis showing altered numbers of LYVE1+ and LYVE1− macrophages in old SKM. (B) Flow cytometric analysis showing comparable changes with scRNA-seq in old SKM. (C) Changes in macrophage numbers in unsupervised Cl0, 3, 6, and 8. (D) Top, UMAP plots showing Gpnmb, Spp1 and Fabp5 mRNAs in old (O) and young (Y) SKM (arrow, Cl6); violin plot representing Gpnmb mRNA (number of macrophages and expression levels) in the different clusters. Bottom, S100a8 and S100a9 mRNAs in O and Y SKM (arrow, Cl8).
Figure 7—figure supplement 1

Changes in genes expressed by macrophages from old skeletal muscle (SKM).
(A) Flow cytometric analysis of macrophages from old SKM showing four subgroups, as in the young (Figure 4A). Gating was based on fluorescence minus one (FMO) controls for each experiment. (B) Top, % of LYVE1+ and LYVE1− macrophages in old and young SKM. Bottom, % of each of the four macrophage groups in old and young SKM. (C) Select mRNAs differentially expressed in young and old SKM macrophage subgroups.
Figure 7—figure supplement 2
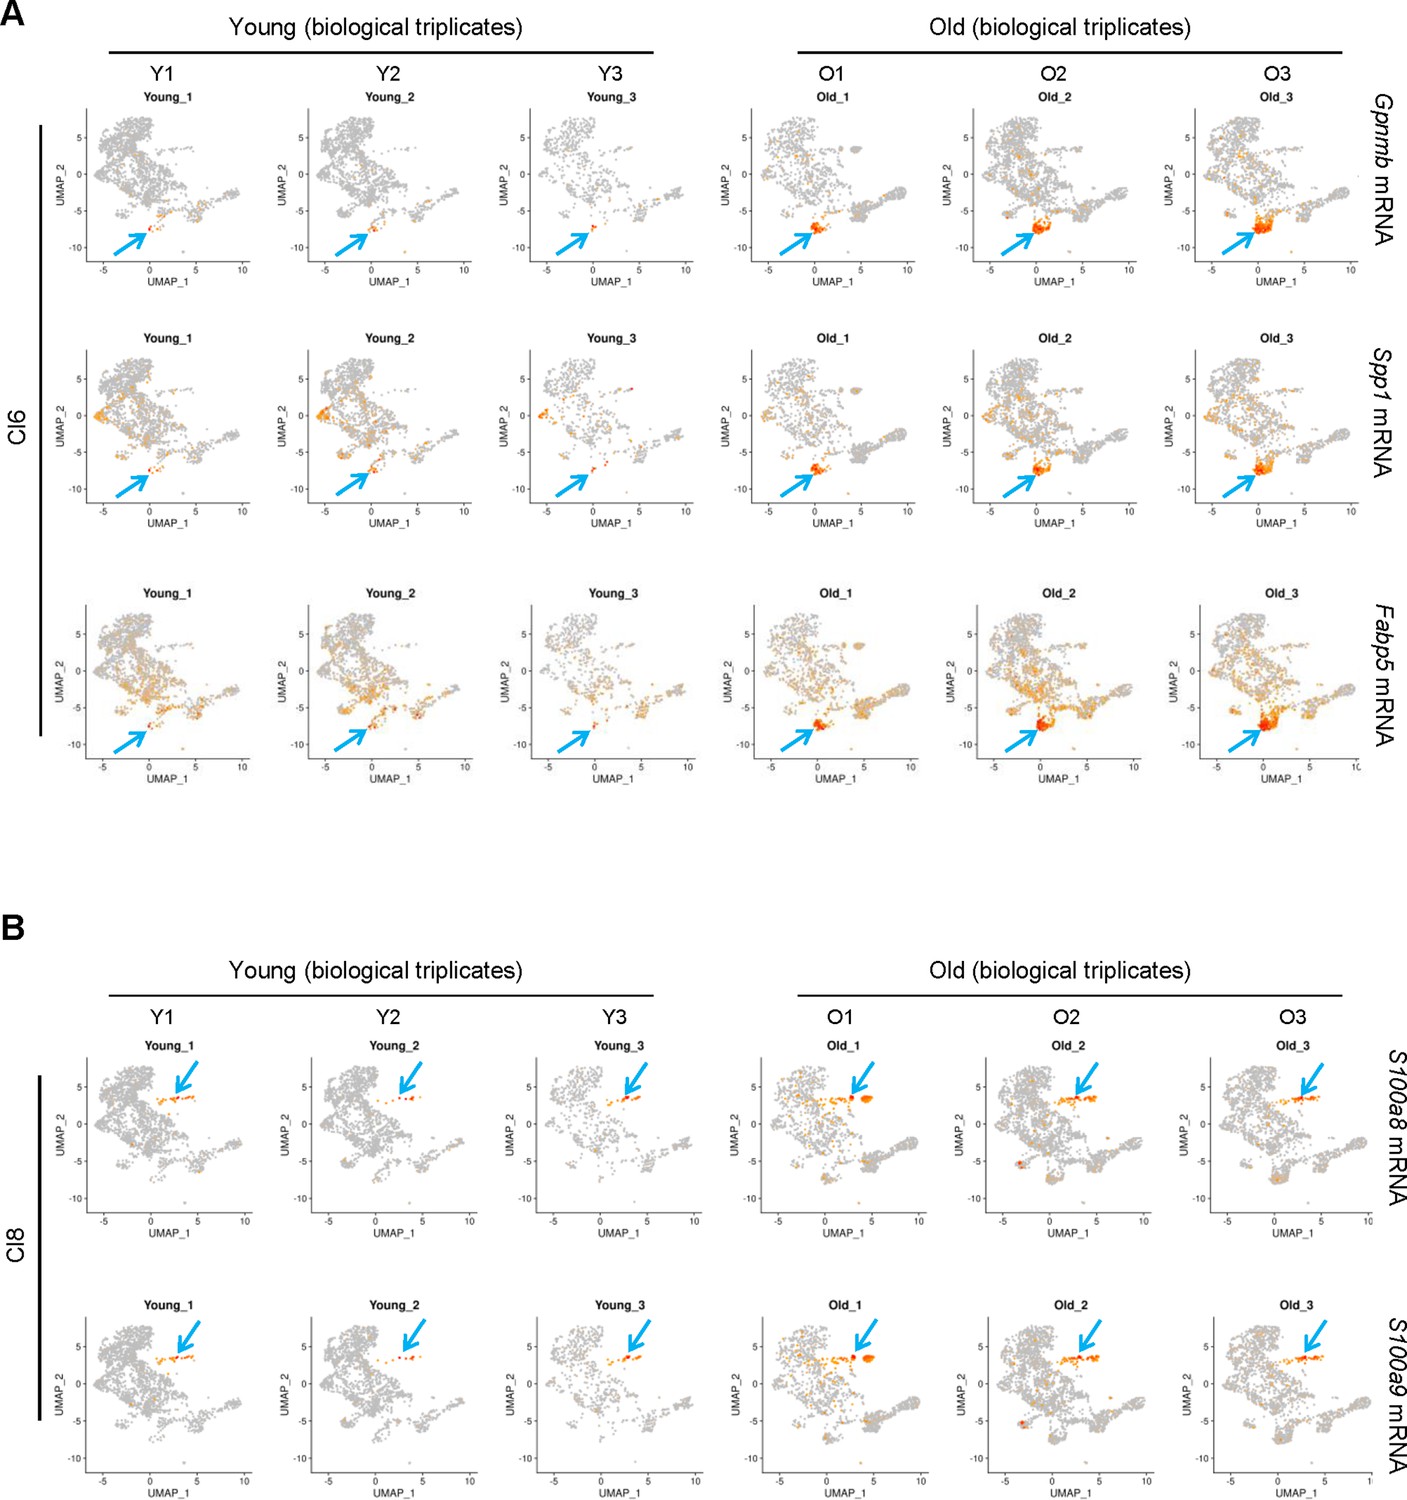
Biological replicates of expression patterns in young and old skeletal muscle (SKM) macrophages.
(A) Biological replicates of expression patterns of select Cl6 genes. (B) Biological replicates of expression patterns of select Cl8 genes.
Author response image 1

Tables
Table 1
Gene ontology (GO) annotation of unsupervised clusters.
| GO annotation | |||
|---|---|---|---|
| Clusters | Elevated | Reduced | Featured membrane proteins |
| Cl0 | Vasculature development (7.8) Amoeboidal-type cell migration (3.7) Endocytosis (3.4) Response to wounding (2.1) | Cytokine production (3.6) Positive regulation of inflammatory response (1.9) Cellular detoxification (1.5) | ↑: LYVE1, FOLR2, MRC1, CD163 ↓: H2-AB1, H2-DMB1 |
| Cl1 | Vasculature development (6.7) Amoeboidal-type cell migration (4.3) Endocytosis (2.9) Response to wounding (1.6) | Translation (4.2) | ↑: LYVE1, FOLR2, MRC1, CD163 |
| Cl2 | Antigen processing and presentation via MHC class II (6.7) Cytokine-mediated signaling pathway (4.3) Cellular response to IL-1 (3.3) Chemotaxis (2.2) Defense response to virus (2.2) | Vasculature development (5.3) Endocytosis (3.4) Muscle cell proliferation (2.5) Amoeboidal-type cell migration (1.4) | ↑: H2-AB1, H2-EB1, H2- DMB1, CCR2 ↓: LYVE1, FOLR2, MRC1, CD163 |
| Cl3 | Cellular detoxification (4.0) Lymphocyte activation (1.6) | Vasculature development (6.9) Muscle cell proliferation (3.9) Response to wounding (1.7) | ↑: CCR2 ↓: LYVE1, FOLR2, MRC1, CD163 |
| Cl4 | Fc receptor signaling pathway (4.2) Regulation of phagocytosis (3.5) Antigen processing and presentation via MHC class I (2.5) Cell killing (1.5) | Angiogenesis (8.6) IL-1 production (5.2) Muscle cell proliferation (2.2) Antigen processing and presentation via MHC class II (2.2) | ↑: H2-K1, H2-D1 ↓: LYVE1, FOLR2, MRC1, CD163, H2-AB1, H2- EB1, H2-DMB1, CCR2 |
| Cl5 | Response to LPS (6.4) TLR signaling pathway (2.9) TNF production (2.0) | Viral entry into host cell (2.3) | ↑: TREM2 ↓: LYVE1, FOLR2, MRC1, CD163 |
| Cl6 | Response to lipoprotein particle (3.3) ATP metabolic process (2.6) Long-chain fatty acid transport (2.0) | Regulation of transcription from RNA polymerase II promoter in response to stress (7.3) Cell chemotaxis (5.1) | ↑: GPNMB, TREM2 ↓: LYVE1, FOLR2, MRC1, CD163, CCR2 |
| Cl7 | Translation (12.4) Antigen processing and presentation via MHC class II (5.2) Ribosome assembly (2.2) | Vasculature development (8.3) IL-1β production (3.9) Response to wounding (2.1) | ↑: H2-AB1, H2-EB1, H2- DMB1 ↓: LYVE1, FOLR2, MRC1, CD163 |
| Cl8 | Positive regulation of cell death (4.2) Phagocytosis (2.2) Autocrine signaling (1.9) | Antigen processing and presentation via MHC class II (4.4) response to IFN-γ (3.3) | ↓: LYVE1, FOLR2, MRC1, CD163, H2-AB1, H2- EB1, H2-DMB1, CCR2 |
| Cl9 | Cell cycle (20.3) DNA replication (4.5) DNA repair (3.2) | Myeloid cell differentiation (3.6) IL-1 production (1.4) | ↓: LYVE1, FOLR2 |
| Cl10 | Vasculature development (19.9) Extracellular matrix organization (9.2) Response to wounding (2.2) | ↑: LY6C1 | |
-
Parenthesis: negative log10 of adjusted p-value. ↑:elevated in the cluster. ↓:reduced in the cluster.
Additional files
-
Supplementary file 1
Top mRNAs differentially expressed in each of 11 unsupervised clusters (Cl0-Cl10), identified after single-cell analysis using 10× Genomics (Materials and methods).
- https://cdn.elifesciences.org/articles/77974/elife-77974-supp1-v2.xlsx
-
Supplementary file 2
mRNAs highly expressed in LYVE1+ or LYVE1− macrophages.
- https://cdn.elifesciences.org/articles/77974/elife-77974-supp2-v2.xlsx
-
Supplementary file 3
Top mRNAs in each of the four supervised macrophage subgroups, LYVE1+/MHCIIlo, LYVE1+/MHCIIhi, LYVE1−/MHCIIhi, and LYVE1−/MHCIIlo.
- https://cdn.elifesciences.org/articles/77974/elife-77974-supp3-v2.xlsx
-
Supplementary file 4
Differentially expressed mRNAs in skeletal muscle (SKM) macrophages from young and old mice.
- https://cdn.elifesciences.org/articles/77974/elife-77974-supp4-v2.xlsx
-
Supplementary file 5
List of antibodies used in this study, including catalog number, company, and dilution used.
- https://cdn.elifesciences.org/articles/77974/elife-77974-supp5-v2.docx
-
Supplementary file 6
R processing scripts used for data analysis.
- https://cdn.elifesciences.org/articles/77974/elife-77974-supp6-v2.docx
-
Transparent reporting form
- https://cdn.elifesciences.org/articles/77974/elife-77974-transrepform1-v2.docx
Download links
A two-part list of links to download the article, or parts of the article, in various formats.
Downloads (link to download the article as PDF)
Open citations (links to open the citations from this article in various online reference manager services)
Cite this article (links to download the citations from this article in formats compatible with various reference manager tools)
Single-cell analysis of skeletal muscle macrophages reveals age-associated functional subpopulations
eLife 11:e77974.
https://doi.org/10.7554/eLife.77974


