Rapid and specific degradation of endogenous proteins in mouse models using auxin-inducible degrons
- MRC Human Genetics Unit, Institute of Genetics and Cancer, University of Edinburgh, United Kingdom
- Cancer Research UK Edinburgh Centre, Institute of Genetics and Cancer, University of Edinburgh, United Kingdom
- Program in Developmental and Stem Cell Biology, Hospital for Sick Children, Canada
- Department of Obstetrics, Gynecology and Reproductive Biology, Michigan State University, United States
- Department of Biomedical Engineering; Michigan State University, United States
- Institute for Quantitative Health Science and Engineering, Michigan State University, United States
Figures
Figure 1 with 1 supplement
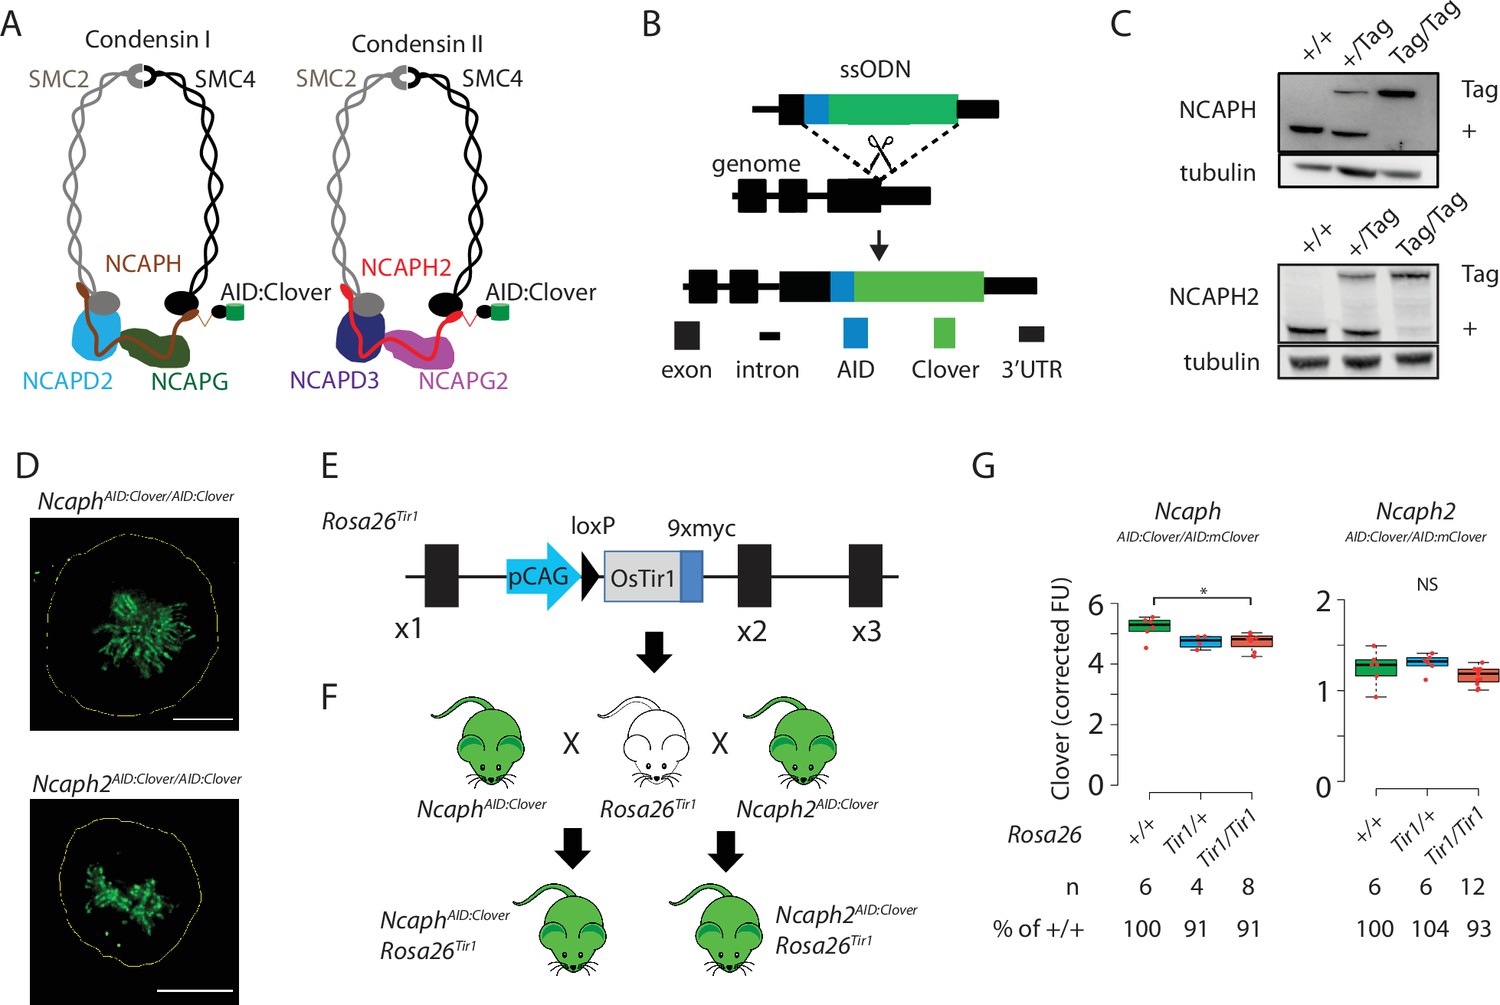
Mouse models for auxin-inducible degradation of condensin proteins.
(A) Schematic diagrams showing the subunit composition of condensin I and II complexes with C-terminal AID:Clover. The kleisin subunits of condensin I and II are NCAPH and NCAPH2, respectively. (B) CRISPR-Cas9 strategy for integrating mClover cassettes at the Ncaph and Ncaph2 loci using long single stranded deoxyoligonucleotides (ssODN) to generate NcaphAID:Clover and Ncaph2AID:Clover alleles. Full details and sequences for the integrated cassettes are given in Supplementary file 3. (C) Western blots prepared from thymic whole cell protein extract were probed with antibodies recognising endogenous NCAPH or NCAPH2, with tubulin as a loading control. ‘+’ indicates wildtype allele, ‘tag’ indicates AID:Clover. (D) Immunofluorescence imaging of mitotic murine embryonic fibroblast lines derived from NcaphAID:Clover/AID:Clover and Ncaph2AID:Clover/AID:Clover embryos. Scale bar = 5 μm. (E) Schematic diagram showing the Rosa26Tir1 allele. Details on how this allele was generated are detailed in Figure 1—figure supplement 1D and Materials and methods. (F) Breeding scheme to combine endogenously tagged Ncaph and Ncaph2 alleles with Rosa26Tir1. (G) Clover fluorescence was measured by flow cytometry in primary S/G2/M thymocytes (gated on DNA content, n > 1000 cells/sample) from mice homozygous for AID:Clover-tagged target proteins, in combination with 0, 1, or 2 alleles of the Rosa26Tir1 transgene. Cells were not subjected to IAA treatment. Boxplots show background-corrected mean fluorescence values from (n) biological replicate samples. * indicates a significant (p < 0.05) difference between genotypes (one-way analysis of variance [ANOVA] with Tukey HSD test, p < 0.05). NS: not significant.
Figure 1—figure supplement 1
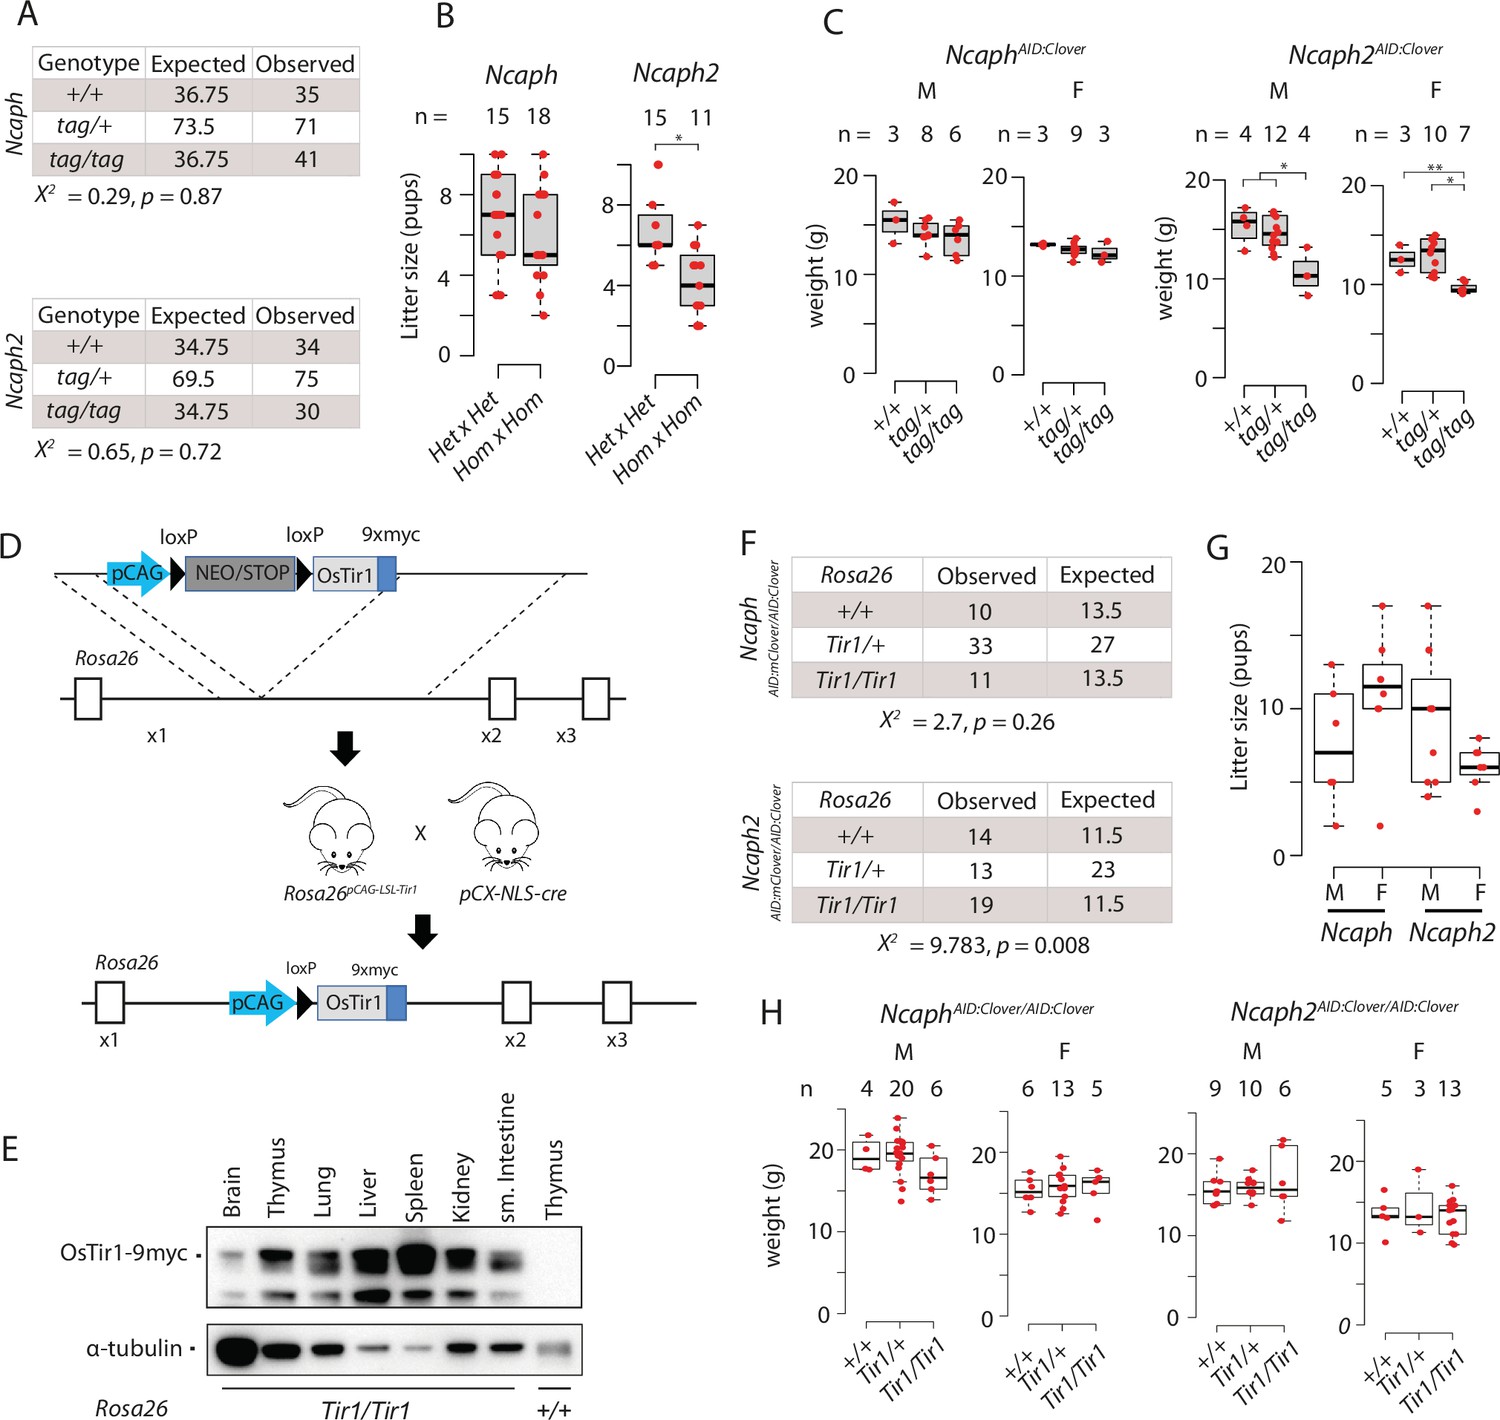
Mouse models for auxin-inducible degradation of condensin proteins.
(A) Observed and expected genotype frequencies among 28-day-old animals generated from heterozygous crosses for each AID:Clover transgene. Chi-squared tests revealed no significant deviation from expected Mendelian frequencies. (B) Litter sizes from matings between animals heterozygous versus homozygous for each AID:Clover transgene. * indicates significant difference at p < 1 × 10⁻³ from unpaired two-tailed t-tests (C). Weight of pups at 28 days post-partum from crosses between parents heterozygous for the AID:Clover transgene (tag/+). M = male, F = female. * indicates significant differences between genotypes at p < 0.01, ** at p < 0.05 from one-way analysis of variance (ANOVA) with Tukey’s HSD post hoc test. (D) Schematic illustrating the derivation of Rosa26Tir1 via a Rosa26LSL-Tir1 intermediate. Breeding of Rosa26pCAG-LSL mice to pCX-NLS-Cre caused germline deletion of the lox-stop-lox cassette to produce Rosa26Tir1. (E) Western blots of whole tissue extracts from Rosa26Tir1/TIr1 or Rosa26+/+ animals, probed with an anti-myc tag antibody (9B11). (F) Observed and expected genotype frequencies among 28-day-old animals generated from crosses between parents homozygous for either Ncaph- or Ncaph2AID:Clover and heterozygous for Rosa26OsTir1. Chi-squared tests revealed no significant deviation from expected Mendelian frequencies of Rosa26 genotypes in the Ncaph background, and elevated frequencies of Rosa26Tir1 homozygotes in the Ncaph2 background. (G) Litter sizes from any mating involving a male (M) or female (F) carrying Rosa26Tir1 and either Ncaph- or Ncaph2AID:Clover alleles in the homozygous state, in combination with animals of various genotype. Because genotypes of the other animal in each mating differed between conditions, these data show simply that breeding from double homozygous transgenic mice is possible and are not suitable to quantify fertility across conditions. (H) Weight of pups at 28 days post-partum. Differences between Tir1 genotypes were not significant at p < 0.05 in one-way ANOVA tests. M = male, F = female.
Figure 2

Rapid and titratable degradation of endogenous NCAPH and NCAPH2 in primary cells.
(A) Schematic illustration of experiments designed to test targeted degradation of condensin subunits in primary cells. (B) Western blots prepared from thymus whole cell extract and probed with polyclonal antibodies against NCAPH, NCAPH2, or a GAPDH loading control. Robust tag-dependent degradation of target proteins is clearly evident after 3 hr of auxin treatment. (C and D) Boxplots quantify the extent of targeted protein depletion following IAA treatment (500 μM for 3 hr), measured by flow cytometry in primary CD8+ thymocytes (C) and murine embryonic fibroblasts (MEFs - D). n = 3 biological replicates from at least 2 independent experiments, with degradation measured in over 1000 S/G2/M cells in each case. To calculate % protein remaining, the background-corrected fluorescence value of each cell was expressed as a percentage of the mean fluorescence value for all cells in the vehicle-only condition. Boxes show the boundaries of upper and lower quartiles and whiskers show the range. Where negative values were observed (e.g. in MEFs due to variable autofluorescence between lines), a value of 0% was assigned. (E) Titration of target protein levels in primary neural stem cells treated with different IAA concentrations for 2 hr. Boxplots were generated as described for panels C and D.
Figure 3 with 1 supplement
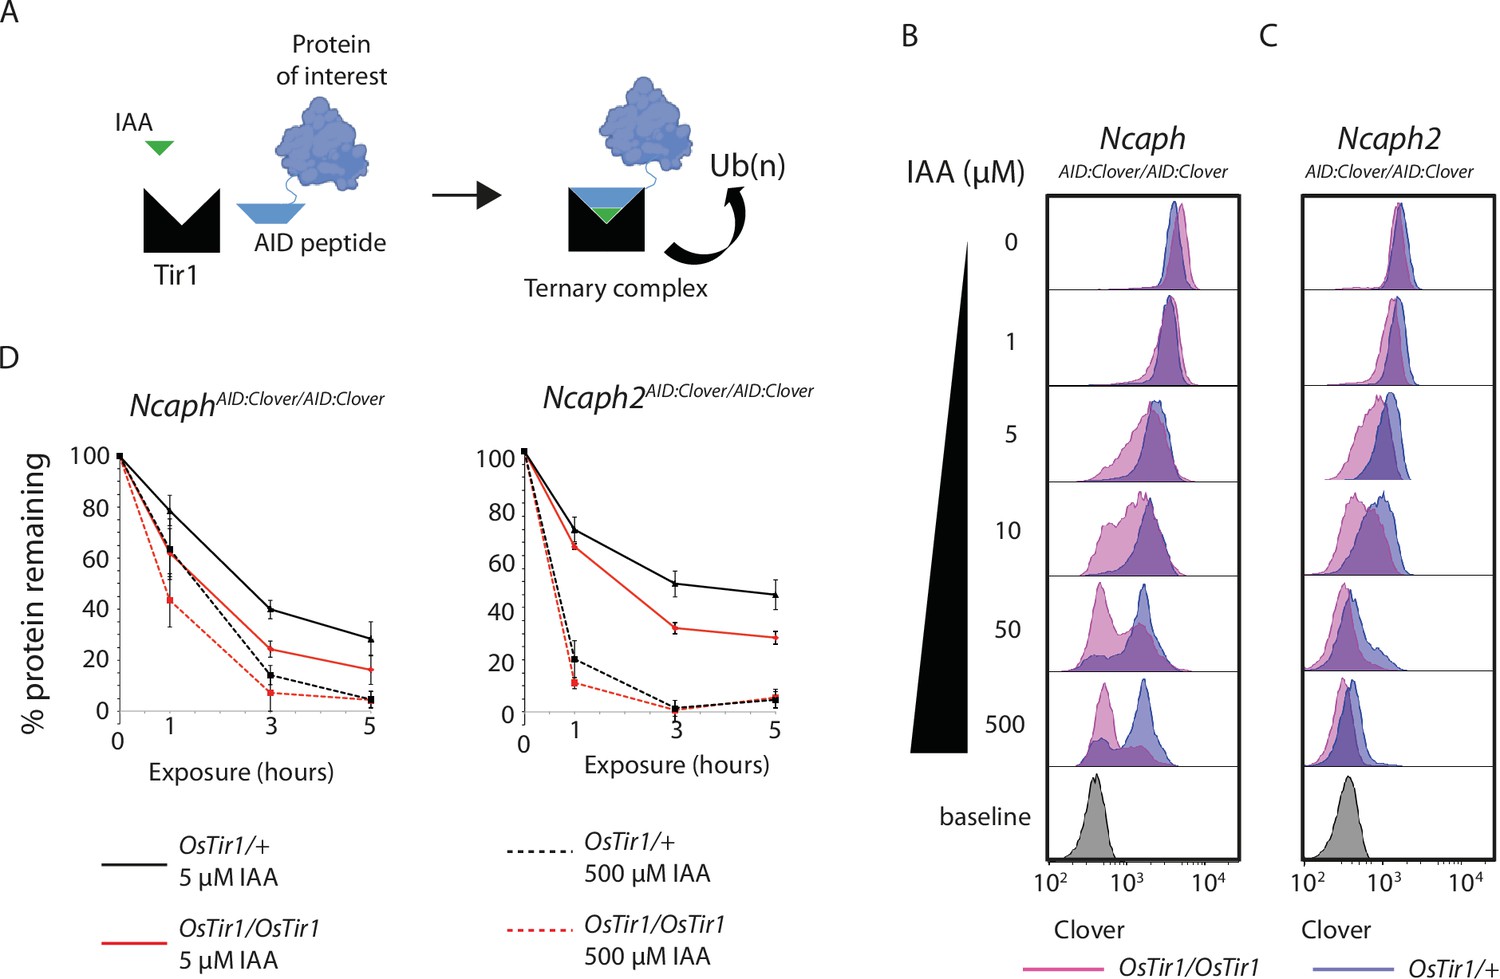
TIR1 dosage determines degradation kinetics of auxin-inducible degron (AID)-tagged proteins.
(A) Schematic diagram illustrates the assembly of the Tir1 substrate receptor protein, IAA ligand and AID-tagged target protein-of-interest into a ternary complex necessary for target protein ubiquitination via SCFTir1, and degradation. (B and C) Histograms show the distribution of Clover expression levels, measured by flow cytometry in S/G2/M thymocytes cultured for 2 hr ex vivo in the presence of different IAA concentrations. Thymocytes were isolated from animals homozygous for either (B) NcaphAID:Clover or (C) Ncaph2AID:Clover alleles in combination with either one (dark purple) or two (light purple) alleles of Rosa26Tir1. Equivalent data from animals heterozygous for AID-tagged alleles are shown in Figure 5—figure supplement 1. (D) Comparison of depletion kinetics in the presence of one (black) versus two (red) alleles of the Tir1 transgene at low (solid line) versus high (dashed line) ligand concentrations (n = 3 biological replicate samples). Each experiment in panels B–D used data from at least 1000 S/G2/M thymocytes, gated on DNA content. In panel D, the mean background-corrected fluorescence value for each cell population is expressed as a percentage of the mean background-corrected fluorescence value for the vehicle only condition.
Figure 3—figure supplement 1
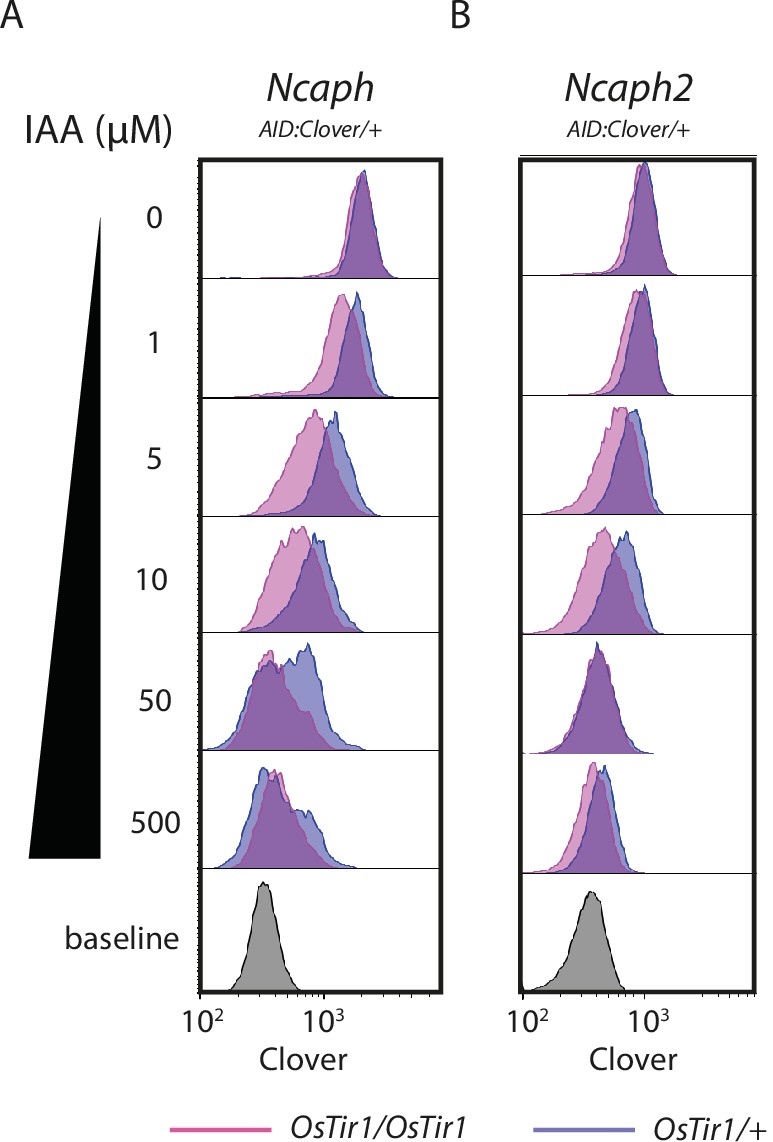
Histograms show the distribution of Clover expression levels, measured by flow cytometry in >1000 S/G2/M thymocytes cultured for 2 hr ex vivo in the presence of different IAA concentrations.
Thymocytes were isolated from animals heterozygous for either (A) NcaphAID:Clover or (B) Ncaph2AID:Clover alleles in combination with either one (dark purple) or two (light purple) alleles of Rosa26Tir1.
Figure 4
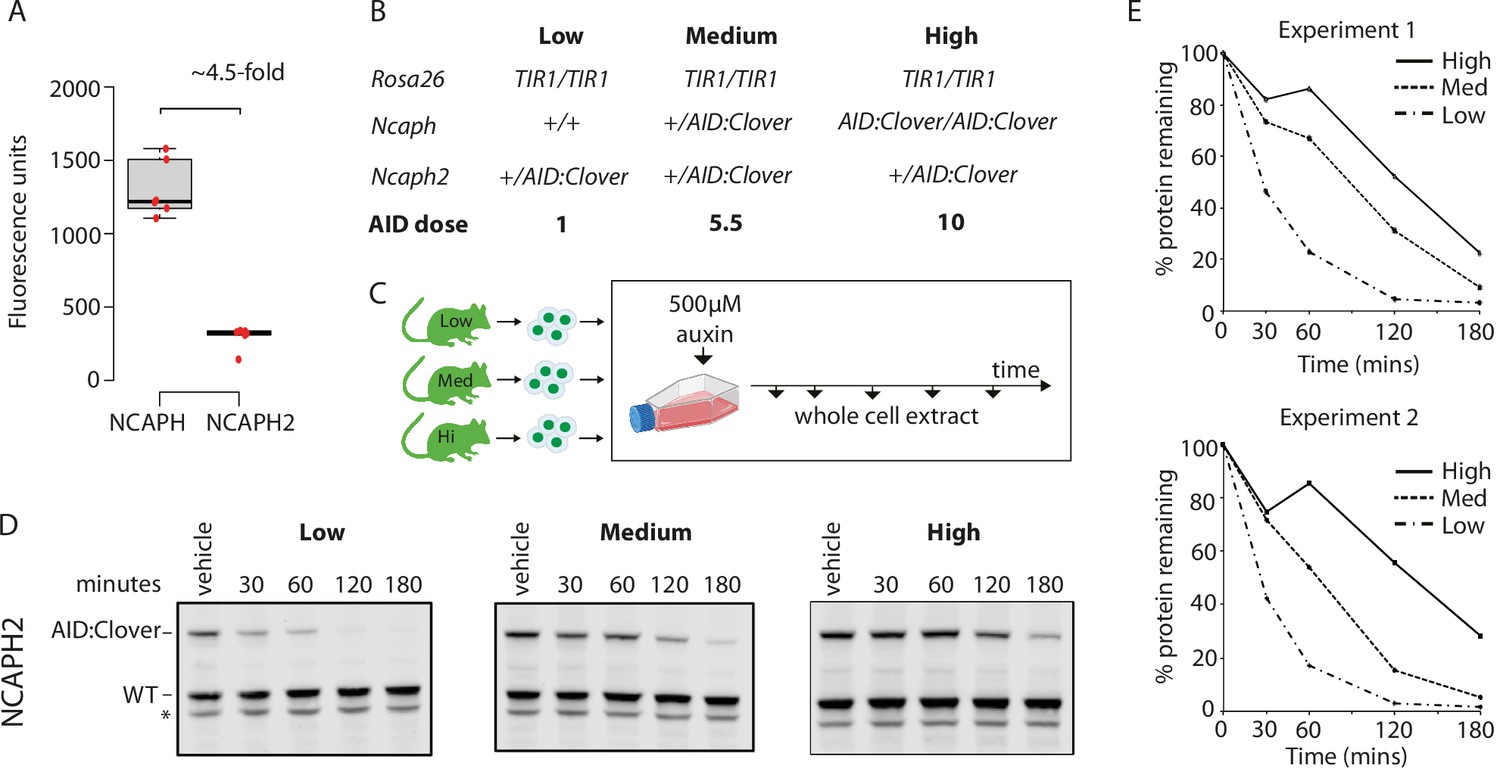
Dosage of auxin-inducible degron (AID)-tagged substrate proteins determines degradation kinetics.
(A) The relative expression of NCAPH and NCAPH2 (n = 6 biological replicates each) in thymocytes, based on flow cytometric Clover fluorescence measurements in >1000 cells. (B) Table showing the relative total dose of AID-tagged proteins in mice heterozygous for Ncaph2AID:Clover in combination with either 0 (Low), 1 (Medium), or 2 (High) alleles of NcaphAID:Clover. Relative AID dose is calculated based on data in panel A. (C) Schematic showing the time course for auxin treatment of primary thymocytes in panels D and E. (D) Western blots probed with a polyclonal antibody against NCAPH2. Tagged protein (upper band) is degraded, whereas wildtype protein (lower band) is not. * indicates non-specific band. (E) Quantification of NCAPH2-AID:Clover depletion in the presence of low, medium, or high overall AID-tagged protein dose. Density of the AID:Clover band (see panel D) was first measured relative to the corresponding wildtype allele (bottom) as an internal control. The AID:WT ratio in the vehicle only control was set at 100% and IAA treatment conditions were then calculated relative to this value. Data from two independent experiments are presented.
Figure 5 with 1 supplement

Dynamic changes in condensin dependency during lymphocyte differentiation.
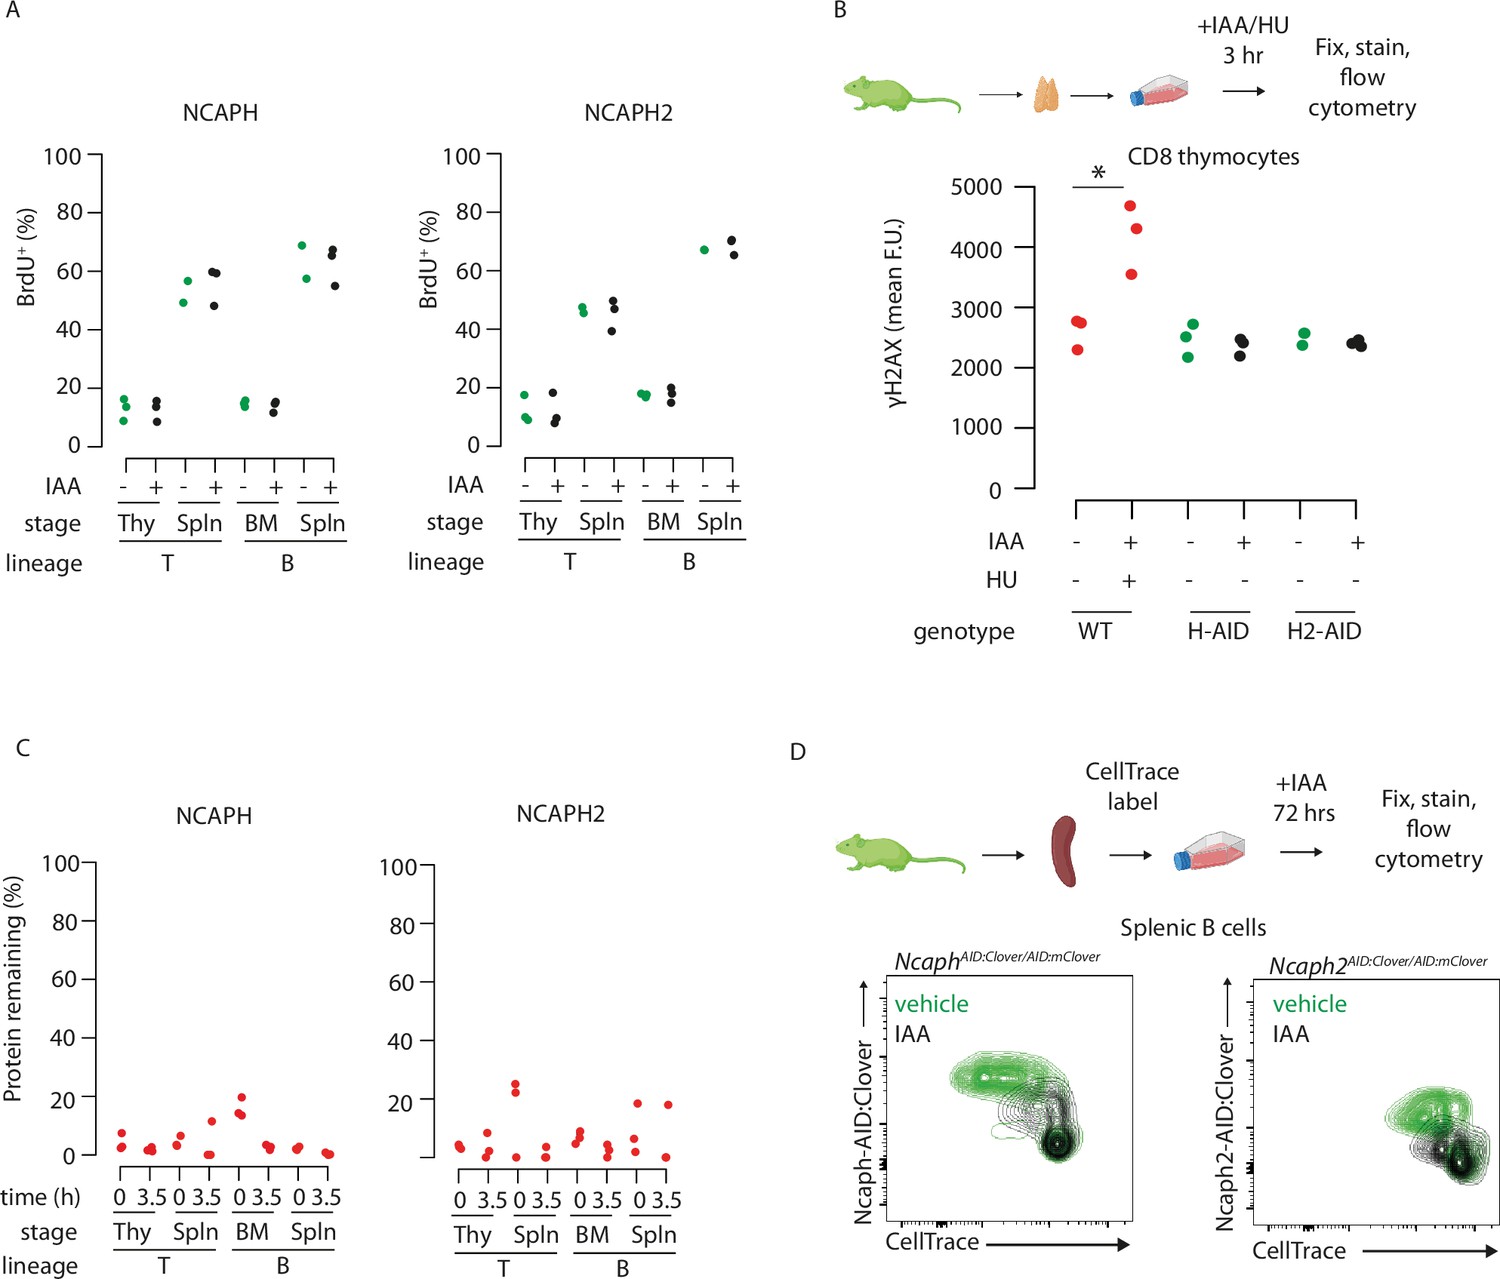
(A) Chronological representation of the BrdU pulse chase assay to measure the efficiency of cell division in primary cell types cultured ex vivo. Lymphocyte isolation and culture protocols are detailed in Materials and methods. Quantifying the % of BrdU+ cells (B) that complete mitosis and halve their DNA content (C) allows the efficiency of a single-cell division to be quantified under normal or acute condensin deficient conditions. The appearance of BrdU+G1 cells can be seen at 3 and 5 hr. (D) Representative DNA content profiles, gated on BrdU+ as shown in panel B, from cycling early (thymic/marrow) or activated mature (Splenic) T and B lymphocytes, measured following a 3.5-hr chase in the presence or absence of condensin I or II. (E) Quantification of division efficiency, based on the % of BrdU+ cells in G1 after 3.5 hr (n = 3 biological replicates from at least 2 independent experiments). Corresponding condensin depletion levels for each experiment are shown in Figure 5—figure supplement 1C (F). Quantification of the effect of NCAPH or NCAPH2 degradation on cell division across cell types in panel E. For each cell type, division efficiency (panel E) in the vehicle only control condition was set to 100%, and the same parameter in IAA-treated cells was expressed relative to this. Asterisks represent p values from paired t-tests ***p < 0.01, **p < 0.05, *p < 0.1.
Figure 5—figure supplement 1
Dynamic changes in condensin dependency during lymphocyte differentiation.
(A) The % of cells engaged in DNA replication (BrdU+) is not significantly different following acute depletion of NCAPH or NCAPH2. Each point shows the average % of cells incorporating BrdU following a 30-min pulse following 2 hr of culture in 500 μM IAA or vehicle, measured by flow cytometry. Bone marrow B cells required an extra hour of IAA treatment (3 h total) to achieve robust depletion. Experimental schematic is shown in Figure 5A. (B) Acute depletion of NCAPH or NCAPH2 does not induce the DNA damage marker ˠH2AX in interphase cells undergoing DNA replication. Each point represents the average fluorescence intensity from at least 1000 single CD8+ thymocytes single cells with DNA content between 2N and 4N (presumed to be in S phase). * indicates significant differences at p < 0.05 based on two-tailed unpaired t-tests. Positive control wildtype cells were treated with 500 μM hydroxyurea for 3 hr to induce replication fork collapse. (C) Mean depletion levels of NCAPH and NCAPH2 proteins in the BrdU pulse chase experiments shown in Figure 5. Clover was quantified by flow cytometry in S/G2/M cells at the start (0 hr) and end (3.5 hr) of the chase period, with the +IAA value expressed as a % of vehicle only control after correcting for background autofluorescence. Where mean Clover fluorescence was lower than autofluorescence in the +IAA condition, a mean value of 0% was assigned. (D) Reduced proliferation in peripheral B cells following acute degradation of NCAPH or NCAPH2, measured by Cell Trace flow cytometry assays. Contour plots show Cell Trace dye dilution via cell division following stimulation with LPS + IL4 for 48 hr in the continuous presence of 500 μM IAA. Condensin-AID:Clover signal is shown on the y-axis to visualise degradation.
Figure 6 with 3 supplements
Rapid degradation of endogenous tagged proteins in living mice.
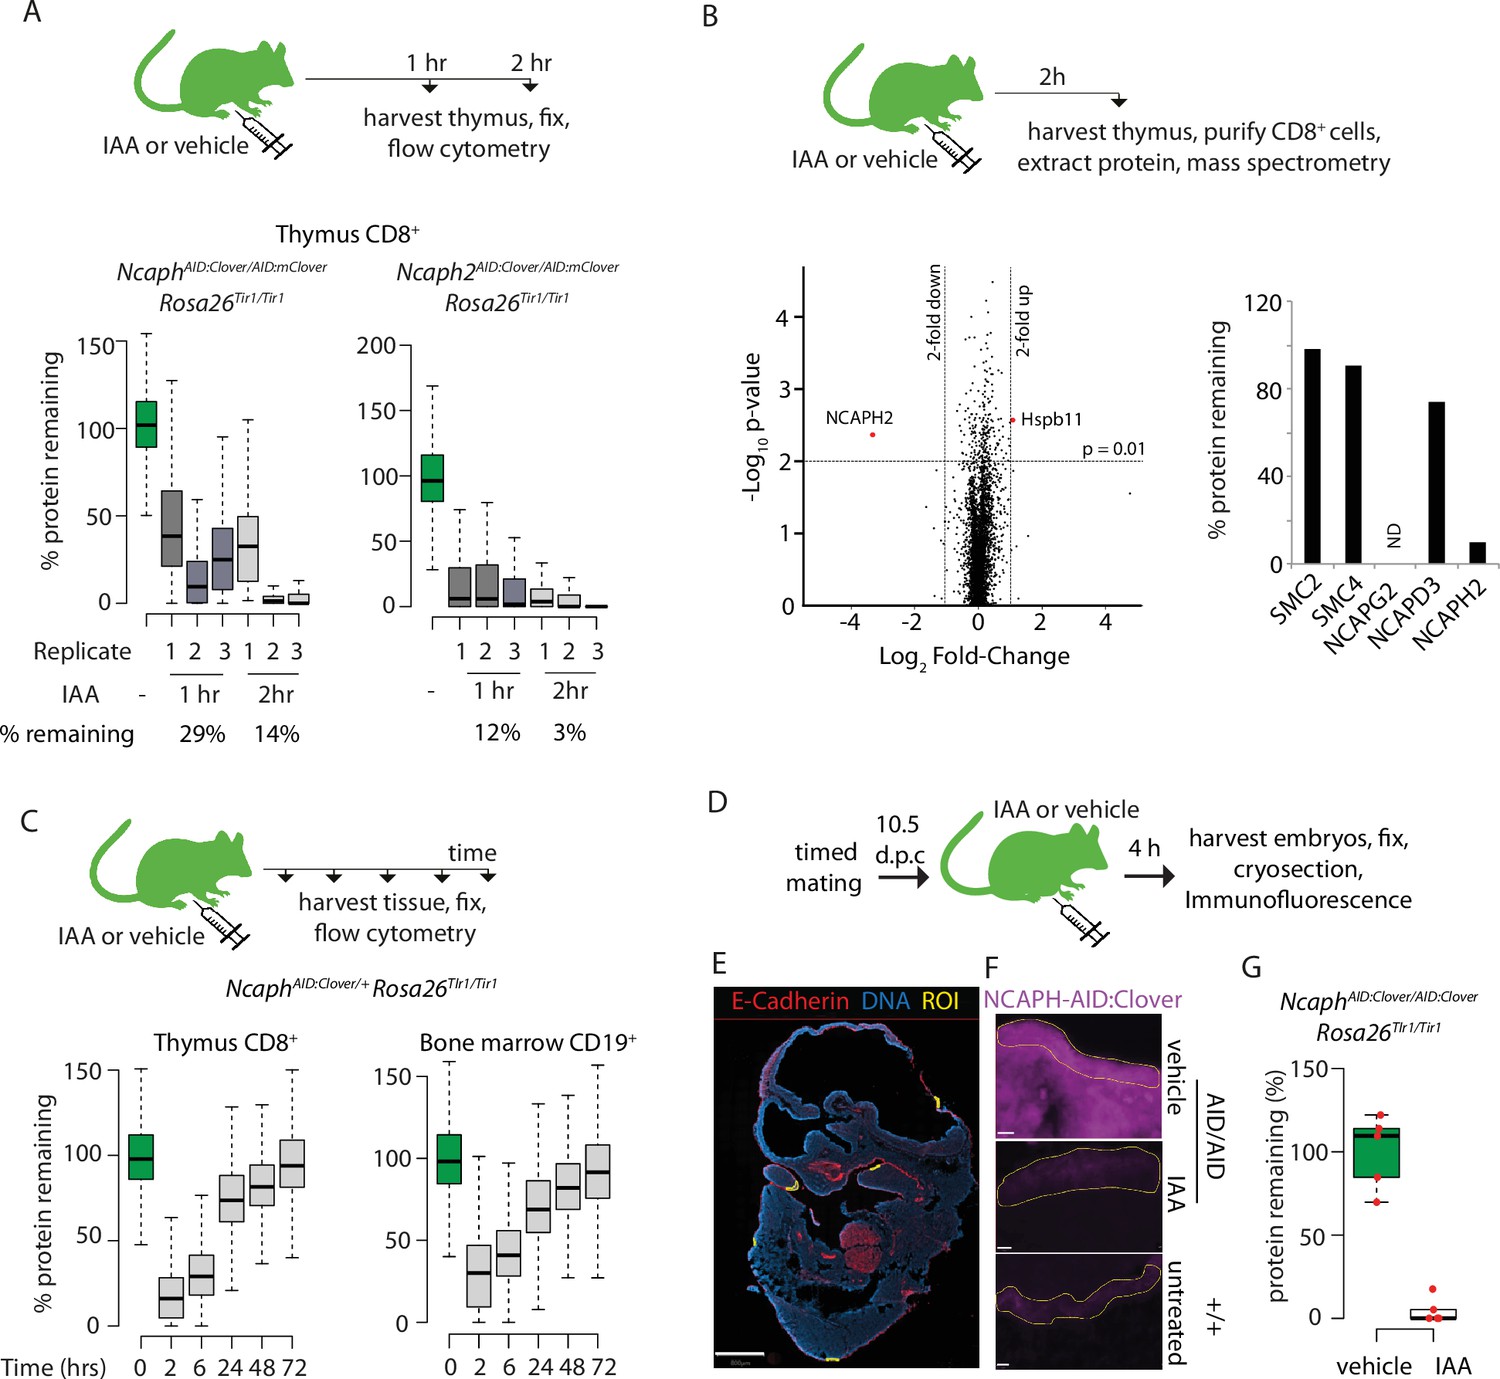
(A) (Top) I.P. injection time course to test protein degradation in vivo. Each mouse received a single injection of IAA solution (100 mg/kg), or vehicle. (Bottom) Boxplots show the extent of targeted protein degradation in >1000 S/G2/M CD8+ thymocytes harvested 1 or 2 hr following auxin injection, measured by flow cytometry. % protein remaining was calculated as described in Figure 2 legend. Boxes indicate the boundaries of upper and lower quartiles and whiskers show the range. Data are from three biological replicate injections performed over at least two independent experiments. (B) Proteome quantification by mass spectrometry analysis of MACS-purified CD8+ thymocytes. n = 3 animals per condition. (C) Protein degradation and recovery following a single I.P. injection. Data are presented as described for panel A, except mice were heterozygous for the Ncaph2AID:Clover allele. (D) Schematic illustration of experimental workflow for protein degradation in E10.5 embryos. (E) Example image from whole-mount immunofluorescence performed on E10.5 embryo cryosections, stained with DAPI, anti-GFP-647 nanobooster (detecting NCAPH-AID:Clover), and anti-CDH1. Anti-GFP signal was quantified within five CDH1+ regions of interest (ROI) per embryo, which were selected based solely on the CDH1 staining pattern. To enable CDH1 localisation and ROIs to be visualised, the anti-GFP-647 channel is not shown in this panel. Images were captured at ×40 magnification, scale bar = 800 μm. (F) Example ROI’s from CDH1+ stained tissue on which target protein quantification was performed. To visualise degradation, only the NCAPH-AID:Clover channel is shown. Scale bar = 10 μm. (G) Quantification of degradation efficiency in CDH1+ embryonic cells. Mean pixel intensity was first calculated from five Cdh1+ regions in NcaphAID:Clover/AID:Clover Rosa26Tir1/Tir1 embryos from mothers injected with either IAA or vehicle, and non-fluorescent negative control embryos (n = 1 embryo each). The mean pixel intensity value from negative control ROIs was set to 0%, and the mean value from vehicle-only ROIs to 100%. Mean pixel intensity values for each ROI from vehicle and IAA-exposed embryos were then plotted on this scale. Negative values were set to 0%.
Figure 6—figure supplement 1
Rapid degradation of endogenous tagged proteins in living mice.
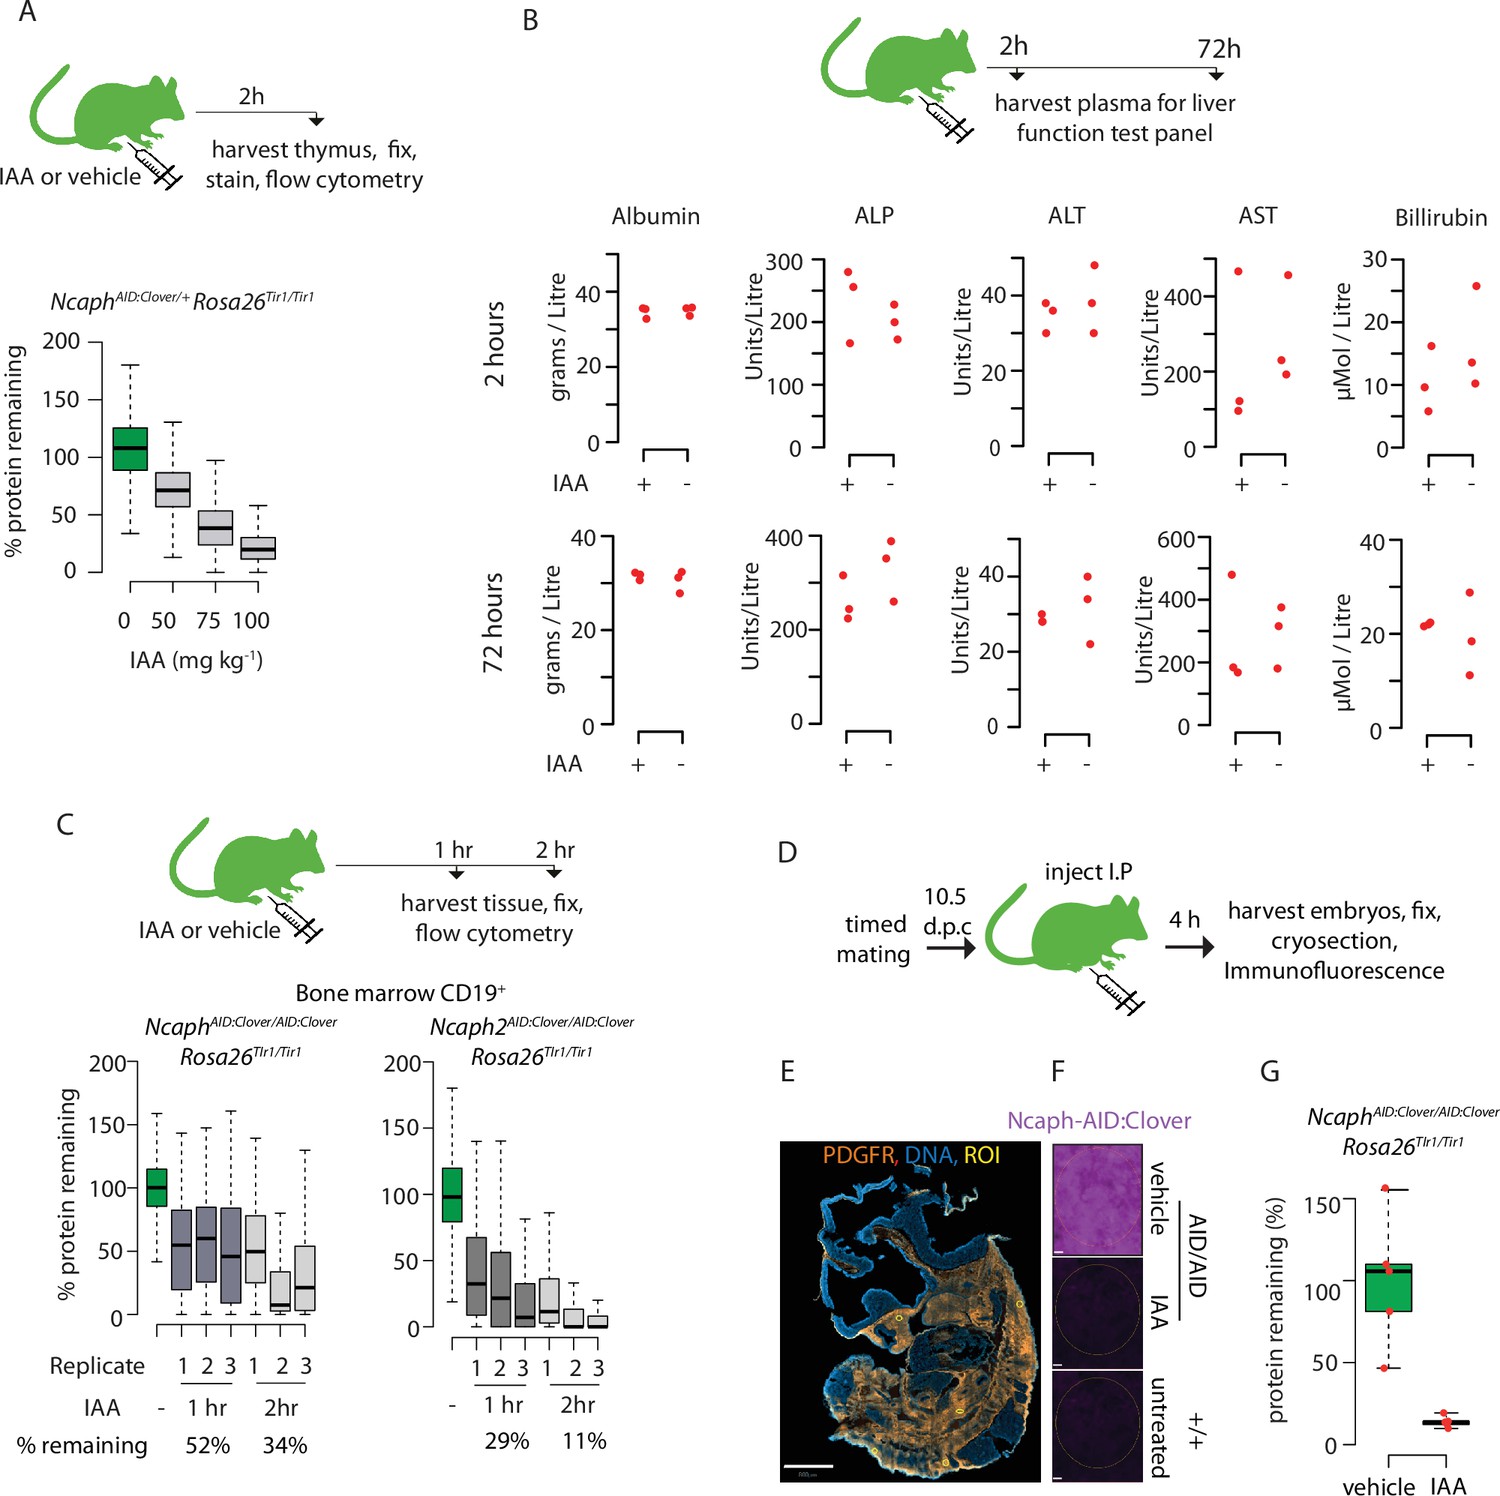
(A) Boxplots quantify the extent of targeted protein depletion in CD8+ thymocytes from NcaphAID:Clover/+Rosa26Tir1 animals injected with IAA at increasing dose. % protein remaining was calculated as described in the legend for Figure 2. Boxes show the boundaries of upper and lower quartiles and whiskers show the range. Where negative values were observed, a value of 0% was assigned. N = 1 per condition. (B) A panel of liver function tests performed on plasma collected post-mortem from adult mice (n = 3 per condition) 2 or 72 hr after I.P. injection with IAA (100 mg/kg) or vehicle. No significant differences (p < 0.05) were detected in unpaired two-tailed t-tests. ALP: alkaline phosphatase; AST: aspartate transaminase; ALT: alanine transaminase. (C) I.P. injection time course to test protein degradation in CD19+ bone marrow cells in vivo. Data were captured, analysed and presented as described in Figure 6A.(D) Schematic illustration of experimental workflow for protein degradation in E10.5 embryos. (E) Example image from whole mount immunofluorescence performed on E10.5 embryo cryosections, stained with DAPI, anti-GFP-647 nanobooster (detecting NCAPH-AID:Clover) and anti-PDGFR. Anti-GFP signal was quantified within 5 PDGFR+ regions of interest (ROI) per embryo, which were selected based solely on the PDGFR staining pattern. To enable PDGFR localisation and ROIs to be visualised, the anti-GFP-647 channel is not shown in this panel. Images were captured at 40X magnification, scale bar = 800μm (F) Example ROI’s from PDGFR+ stained tissue on which target protein quantification was performed. To visualise degradation, only the NCAPH-AID:Clover channel is shown. Scale bar = 10μm (G) Quantification of degradation efficiency in PDGFR+ embryonic cells. Mean pixel intensity was first calculated from 5 PDGFR+ regions in NcaphAID:Clover/AID:Clover Rosa26Tir1/Tir1 embryos from mothers injected with either IAA or vehicle, and non-fluorescent negative control embryos (n = 1 embryo each). The mean pixel intensity value from negative control ROIs was set to 0%, and the mean value from vehicle-only ROIs to 100%. Mean pixel intensity values for each ROI from vehicle and IAA-exposed embryos were then plotted on this scale.
Figure 6—figure supplement 2
Rapid degradation of endogenous tagged proteins in living mice.
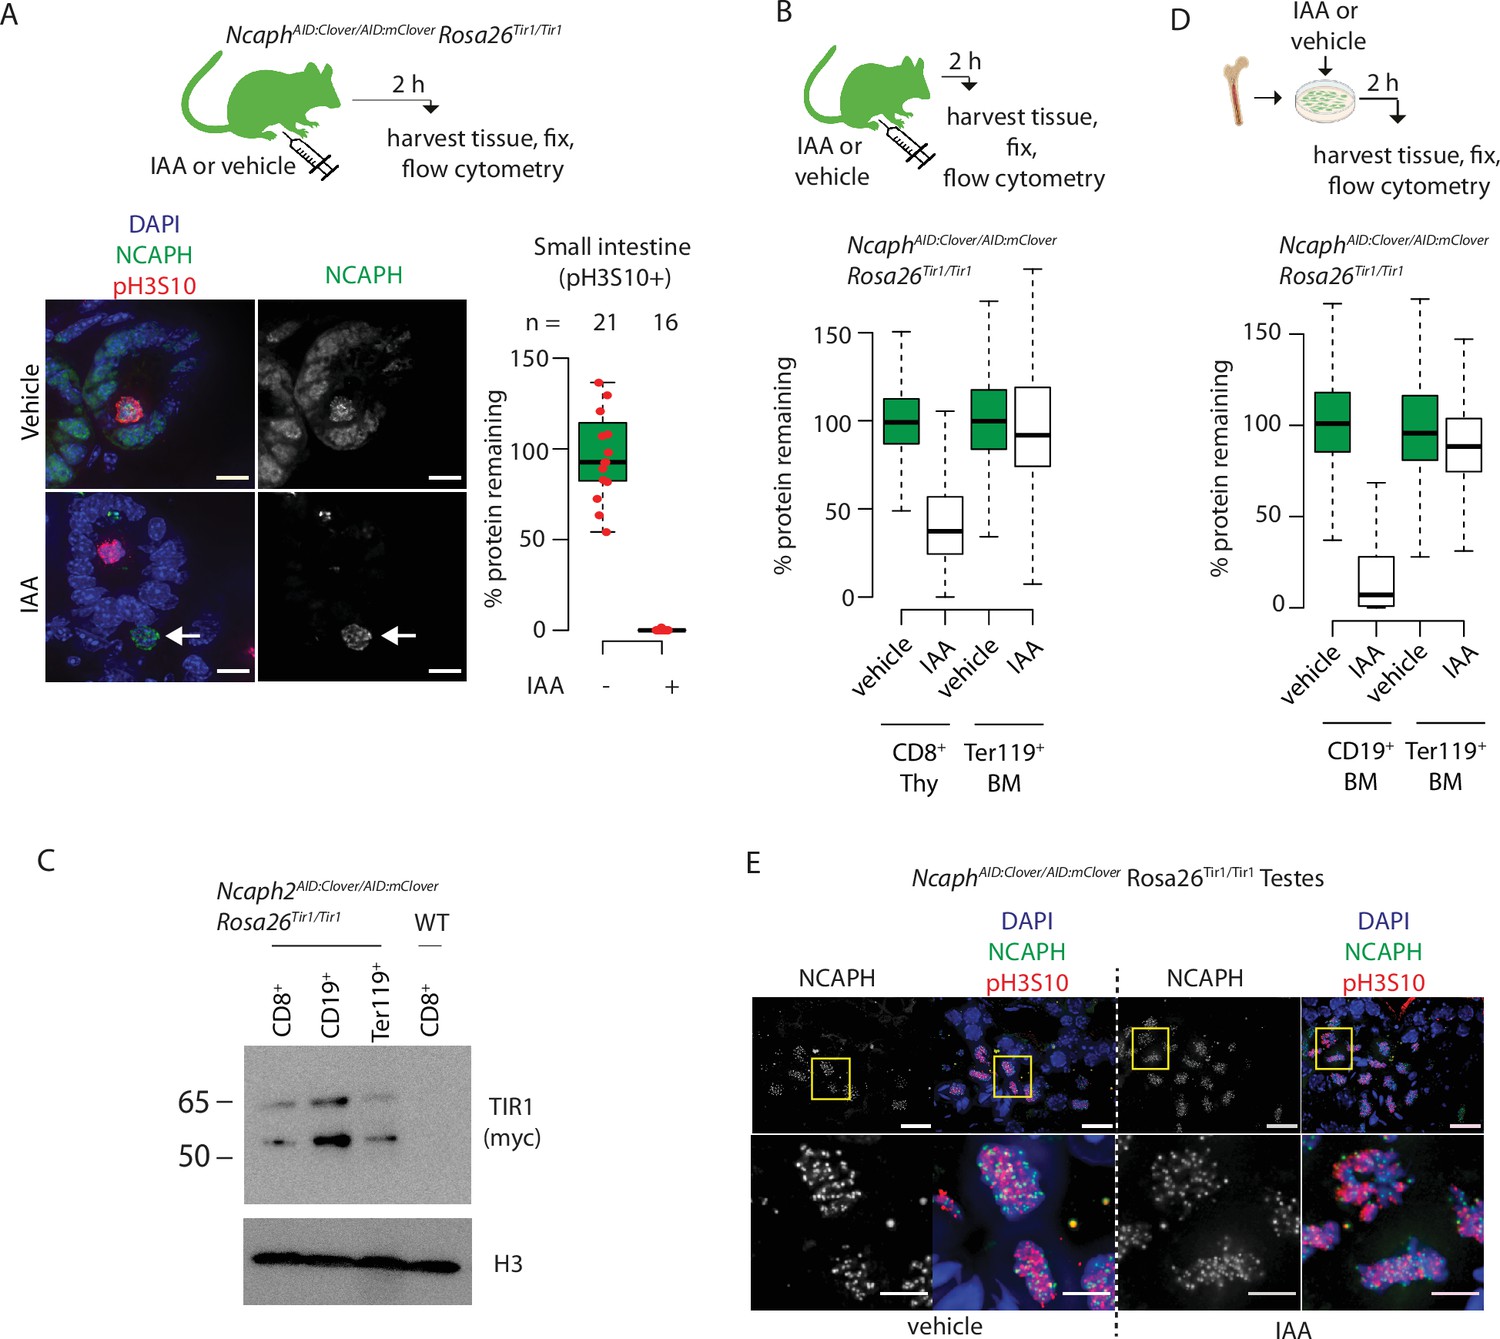
(A) Immunofluorescence on cryosections from small intestine of an NcaphAID/AID Rosa26TIr1/Tir1 adult, fixed following 2-hr exposure to IAA in vivo (100 mg/kg, I.P.). Scale bar 10 μm. NCAPH degradation was quantified specifically within DAPI-stained regions of mitotic (ph3S10+) cells, but can also be observed in the vast majority of interphase cells. Arrows show the position of an IAA-unresponsive cell. (B) Different levels of NCAPH degradation observed in CD8+ thymocytes and Ter119+ erythroblasts from a single animal 2 hr following I.P. injection of IAA. (C) Western blots probed with anti-myc (top) to detect Tir1 expression, and anti-pan histone H3 loading control (bottom) in whole cell extracts from MACS-purified blood cell populations shown in panels B and D. (D) Different levels of NCAPH degradation in CD19+ B-cell precursors and Ter119+ erythroblasts following IAA treatment from the same ex vivo short-term bone marrow culture. In panels B and D, boxes show the boundaries of upper and lower quartiles and whiskers show the range of degradation values for >1000 S/G2/M cells, calculated as described in the legend for Figure 2. (E) Immunofluorescence on cryosections from fixed adult testes (NcaphAID/AID Rosa26TIr1/Tir1) shows little if any target protein degradation. Yellow boxes in the upper panel show zoomed regions in the lower panel. Upper scale bar = 15 μm, lower scale bar = 10 μm.
Figure 6—figure supplement 3
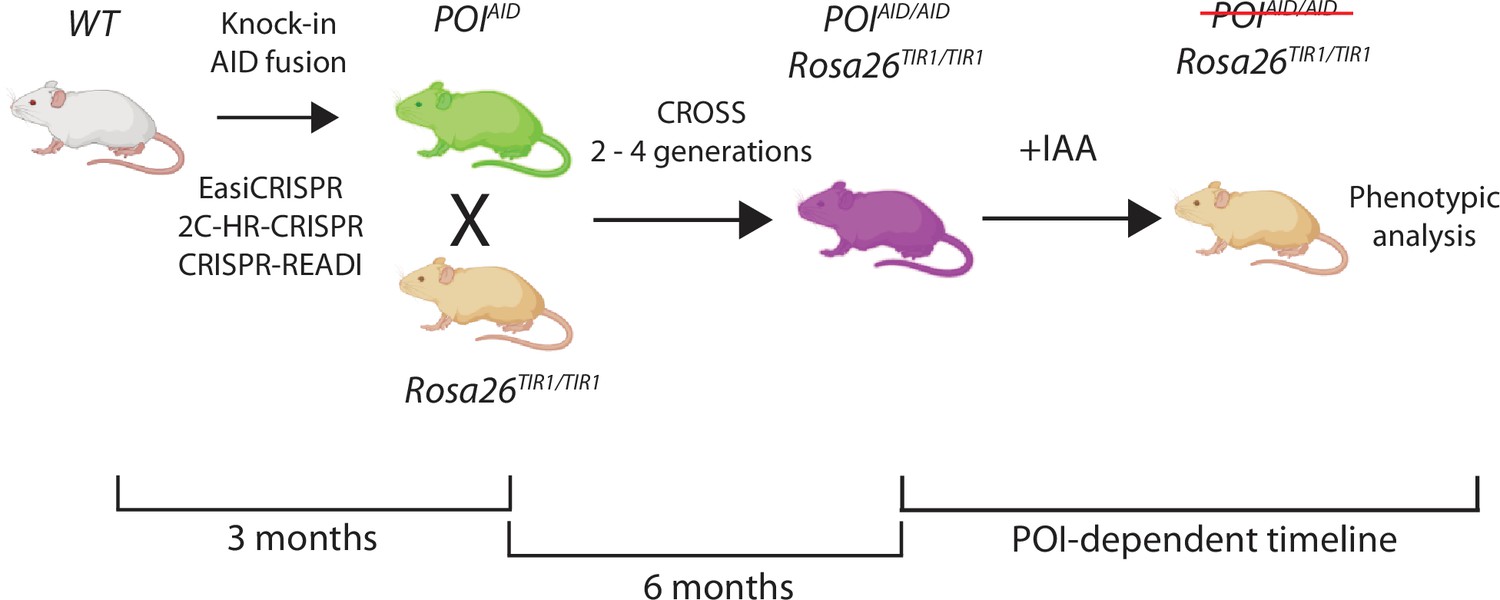
General schematic and timeline for generating germline transgenic mice for studying protein function using the auxin-inducible degron (AID) system.
Figure created with https://biorender.com/.
Tables
Key resources table
| Reagent type (species) or resource | Designation | Source or reference | Identifiers | Additional information |
|---|---|---|---|---|
| Gene (O. sativa) | osTIR1 | Addgene | 64,945 | |
| Gene fragment (A. thaliana) | mAID | Nora et al., 2017 | IAA17 | |
| Strain, strain background (Mus musculus) | CD1 | Charles River | Crl:CD1(ICR) | |
| Strain, strain background (Mus musculus) | C57BL/6J | Charles River | ||
| Genetic reagent (Mus musculus) | Rosa26-LSL-osTIR1-9myc | This paper | CD1-Gt(ROSA)26Sorem1(CAG-LSL-osTIR1-myc)Jrt | Sequence details in Supplementary file 3 |
| Genetic reagent (Mus musculus) | Rosa26-osTIR1-9myc (Mus musculus) | This paper | CD1-Gt(ROSA)26Sorem1.1(CAG-LSL-osTIR1-myc)Jrt | Sequence details in Supplementary file 3 |
| Genetic reagent (Mus musculus) | pCX-NLS-cre (Mus musculus) | Belteki et al., 2005 | ICR-Tg(CAG-cre) | http://www.informatics.jax.org/reference/J:99607 |
| Genetic reagent (Mus musculus) | NcaphAID:Clover | This paper | NcaphAID:Clover | Sequence details in Supplementary file 3 |
| Genetic reagent (Mus musculus) | Ncaph2AID:Clover | This paper | Ncaph2AID:Clover | Sequence details in Supplementary file 3 |
| Recombinant DNA reagent | pRosa26-CAG-LSL-osTIR1 | This paper | Belteki et al., 2005 |
Additional files
-
Supplementary file 1
Mass spectrometry quantification of proteome-wide changes in protein level in CD8+ thymocytes following IAA exposure in vivo.
These data were used to generate volcano plots in Figure 6B.
- https://cdn.elifesciences.org/articles/77987/elife-77987-supp1-v2.xlsx
-
Supplementary file 2
Details of antibodies used in this study.
- https://cdn.elifesciences.org/articles/77987/elife-77987-supp2-v2.xlsx
-
Supplementary file 3
DNA sequences used to generate sgRNAs and donor templates for generating mouse strains via CRISPR-Cas9.
- https://cdn.elifesciences.org/articles/77987/elife-77987-supp3-v2.docx
-
MDAR checklist
- https://cdn.elifesciences.org/articles/77987/elife-77987-mdarchecklist1-v2.docx
Download links
A two-part list of links to download the article, or parts of the article, in various formats.
Downloads (link to download the article as PDF)
Open citations (links to open the citations from this article in various online reference manager services)
Cite this article (links to download the citations from this article in formats compatible with various reference manager tools)
Rapid and specific degradation of endogenous proteins in mouse models using auxin-inducible degrons
eLife 11:e77987.
https://doi.org/10.7554/eLife.77987


