An M protein coiled coil unfurls and exposes its hydrophobic core to capture LL-37
- Department of Chemistry & Biochemistry, University of California, San Diego, United States
- Division of Host-Microbe Systems and Therapeutics, Department of Pediatrics, University of California, San Diego, United States
Figures
Figure 1 with 1 supplement
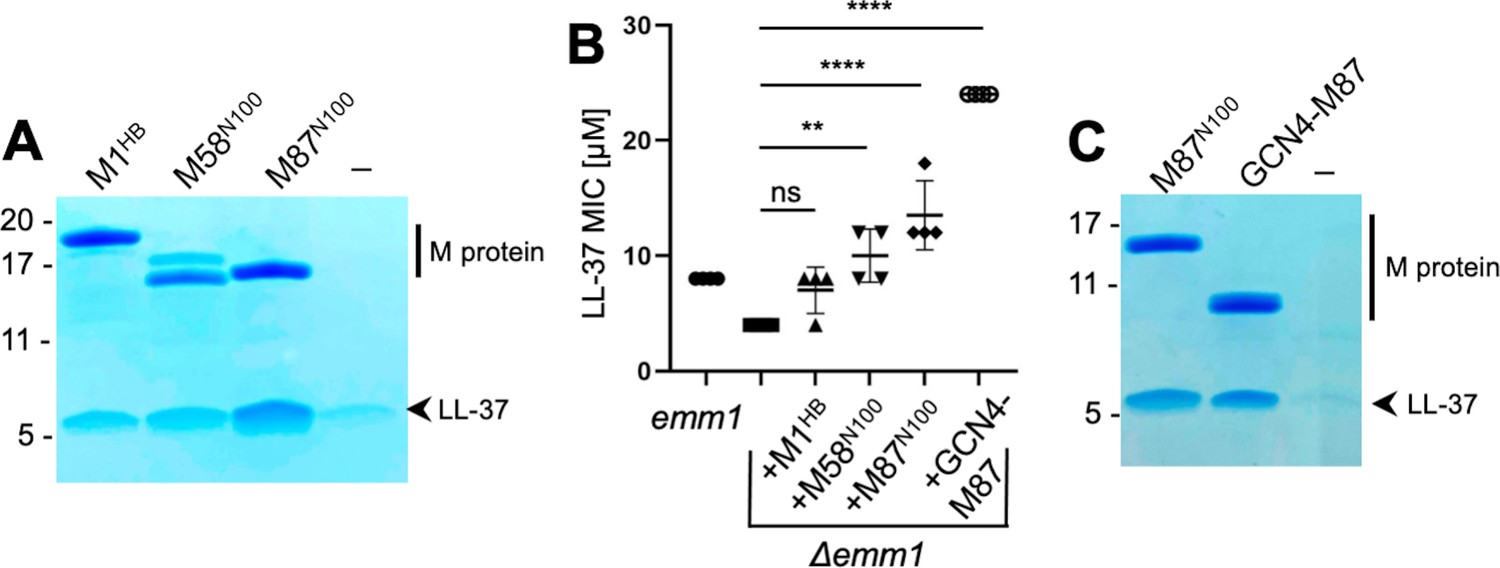
LL-37 binding and detoxification.
(A) LL-37 binding to His-tagged M1HB, M58N100, or M87N100 as determined by Ni2+-NTA agarose bead co-precipitation assay at 37°C. The last lane contains no M protein. Bound fractions were resolved by SDS-PAGE and visualized by Coomassie staining. The gel is representative of at least three experiments. Figure 1—figure supplement 1 shows LL-37 binding to other M types. (B) LL-37 minimal inhibitory concentration (MIC) for wild-type Strep A emm1 and isogenic Δemm1 alone or supplemented with 10 μΜ M1HB, M58N100, M87N100, or GCN4-M87. Data from four independent experiments are presented with means and standard deviations. Statistical significance was calculated using one-way ANOVA with Dunnett’s post-hoc test. p-Values are as follows: ns > 0.05, *≤0.05, **≤0.01, ***≤0.001, and ****≤0.0001. (C) LL-37 binding to His-tagged M87N100 or GCN4-M87, determined as in panel (A). The last lane contains no M protein. The gel is representative of at least three experiments.
Figure 1—figure supplement 1
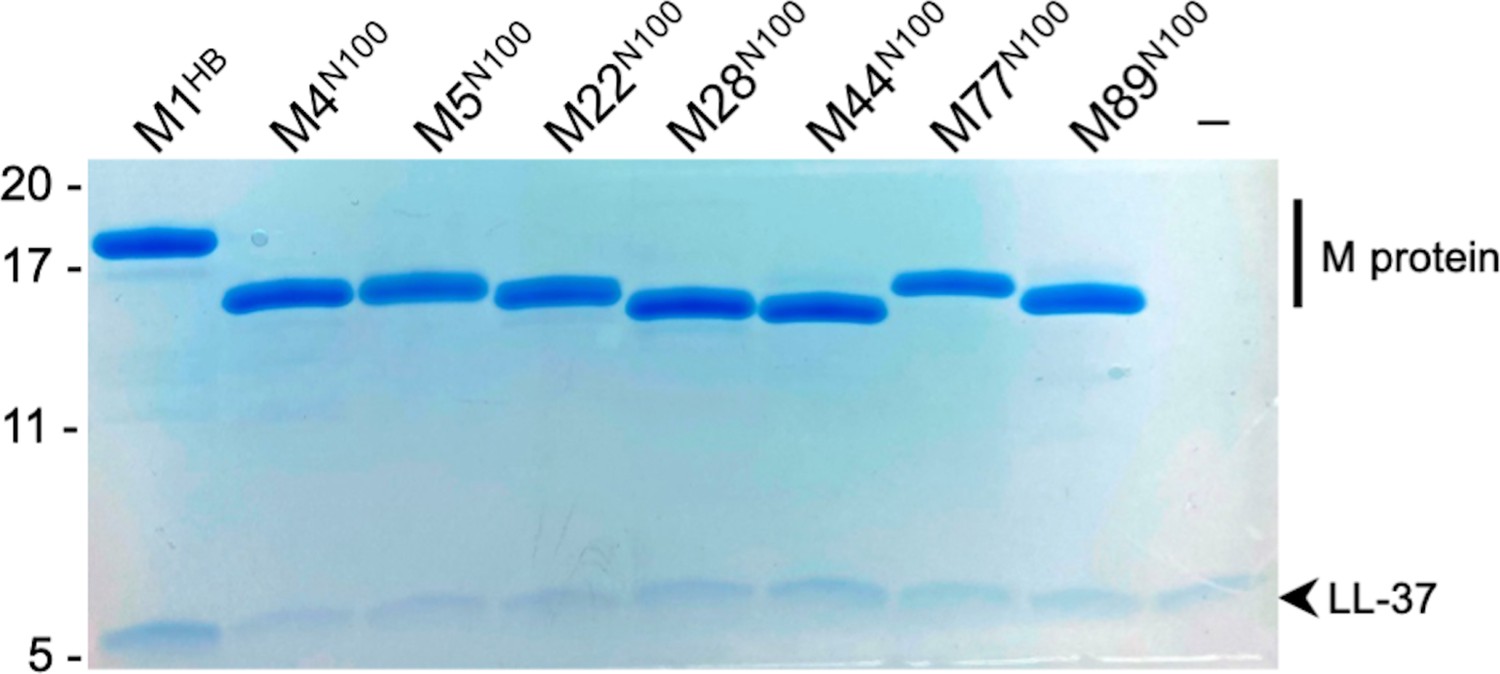
LL-37 binding.
LL-37 binding to His-tagged M1HB, M4N100, M5N100, M22N100, M28N100, M44N100, M77N100, or M89N100 as determined by a Ni2+-NTA agarose bead co-precipitation assay at 37°C. The last lane contains no M protein. Bound fractions were resolved by SDS-PAGE and visualized by Coomassie staining. The gel is representative of three experiments.
Figure 2 with 1 supplement
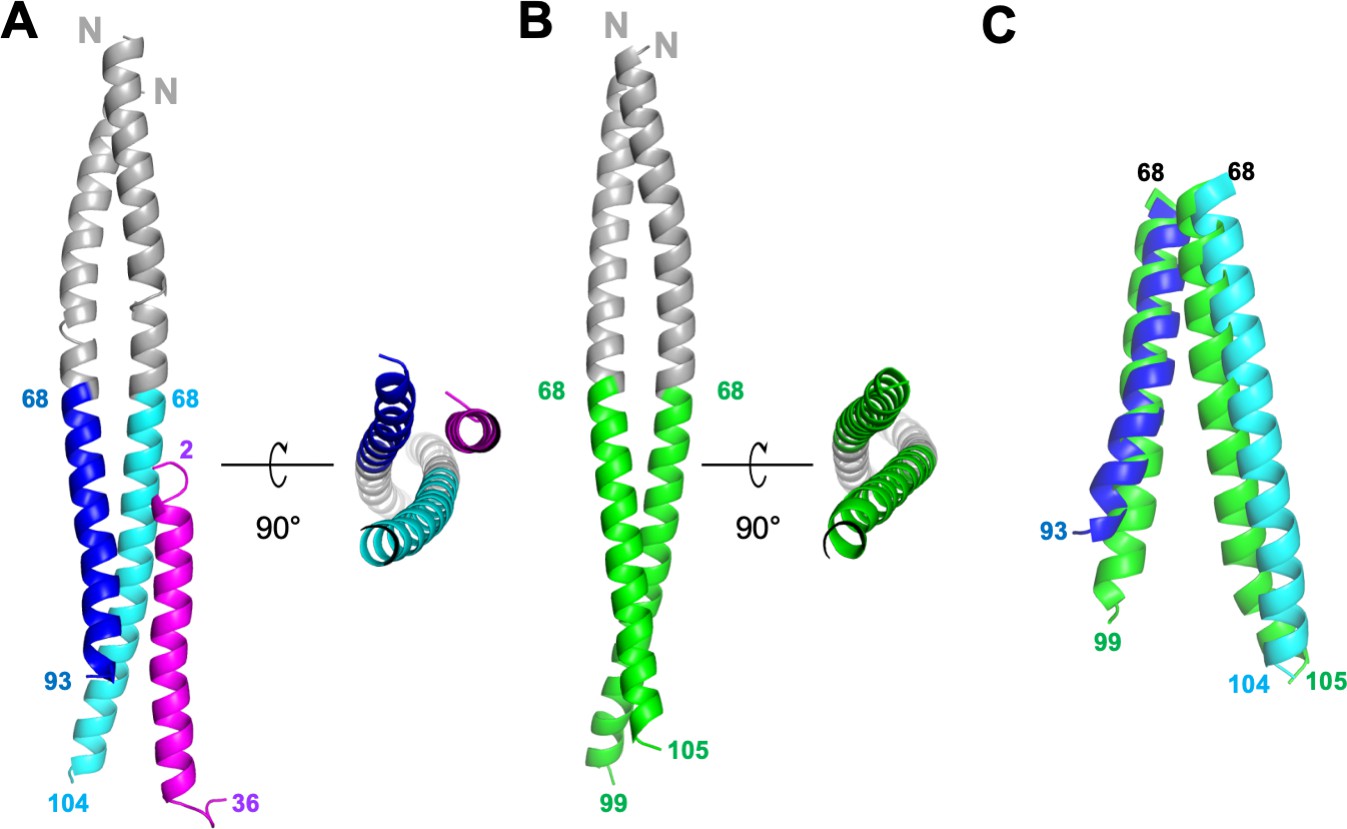
Structures of GCN4-M87/LL-37 complex and free GCN4-M87.
(A) Cartoon representation of the GCN4-M87/LL-37 complex. LL-37 is in magenta. The GCN4 portion of GCN4-M87 is in gray, and the M87 portion in blue for the chain that makes more contacts to LL-37 (M87α1), and cyan for the chain that makes fewer contacts to LL-37 (M87α2). The N- and C-terminal amino acids for LL-37 and M87 are indicated. Figure 2—figure supplement 1 shows electron density and superposition of the two GCN4-M87/LL-37 complexes in the asymmetric unit. (B) Cartoon representation of free GCN4-M87. The GCN4 portion is colored gray and the M87 portion green. (C) Superposition (based on GCN4, not depicted) of the M87 portions in bound (blue and cyan) and free (green) states.
Figure 2—figure supplement 1
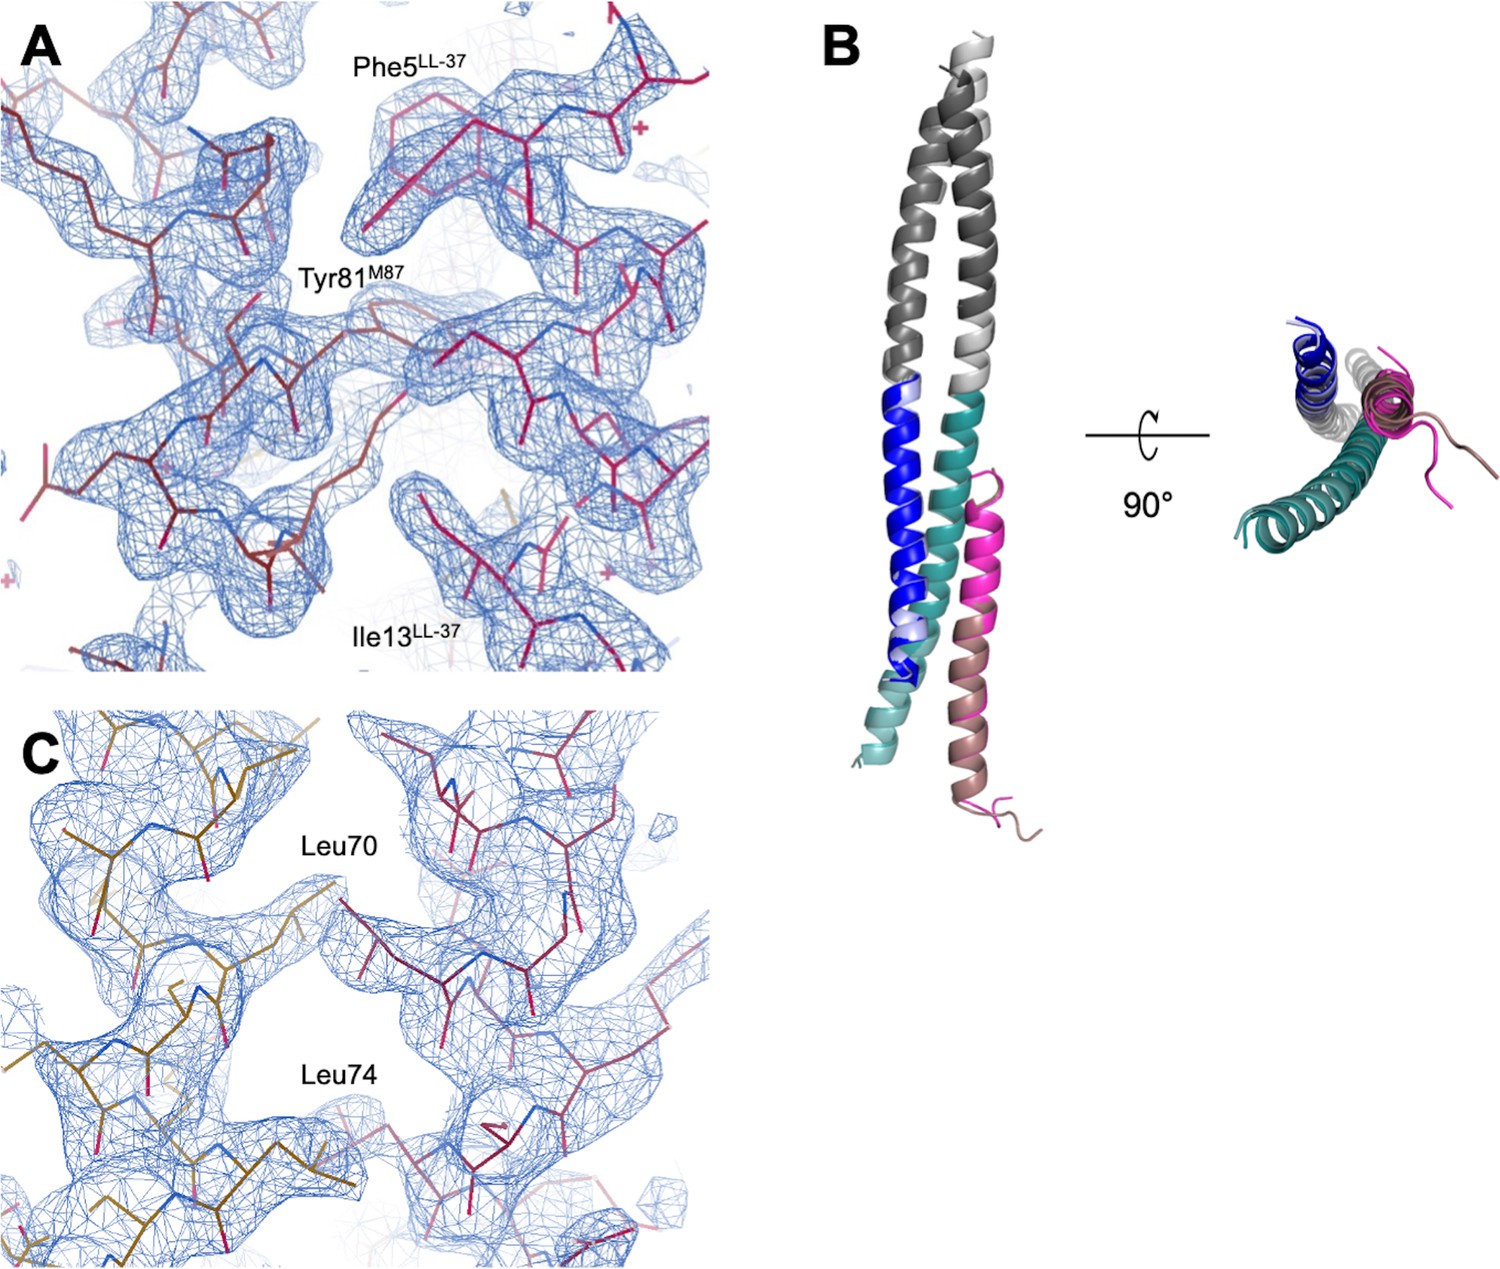
Structures of the GCN4-M87/LL-37 complex and free GCN4-M87.
(A) Electron density for GCN4-M87 from a simulated annealing σA-weighted 2mFo-DFc composite omit map contoured at 1.4σ. Part of the interface between M87 (left) and LL-37 (right) is shown. (B) Superposition of the two GCN4-M87/LL-37 complexes present in the asymmetric unit of the crystal. LL-37 is in different shades of magenta. The GCN4 portions are in shades of gray, and the M87 portions are in blue and cyan. (C) Electron density for free GCN4-M87 from a simulated annealing σA-weighted 2mFo-DFc composite omit map contoured at 1.4σ.
Figure 3
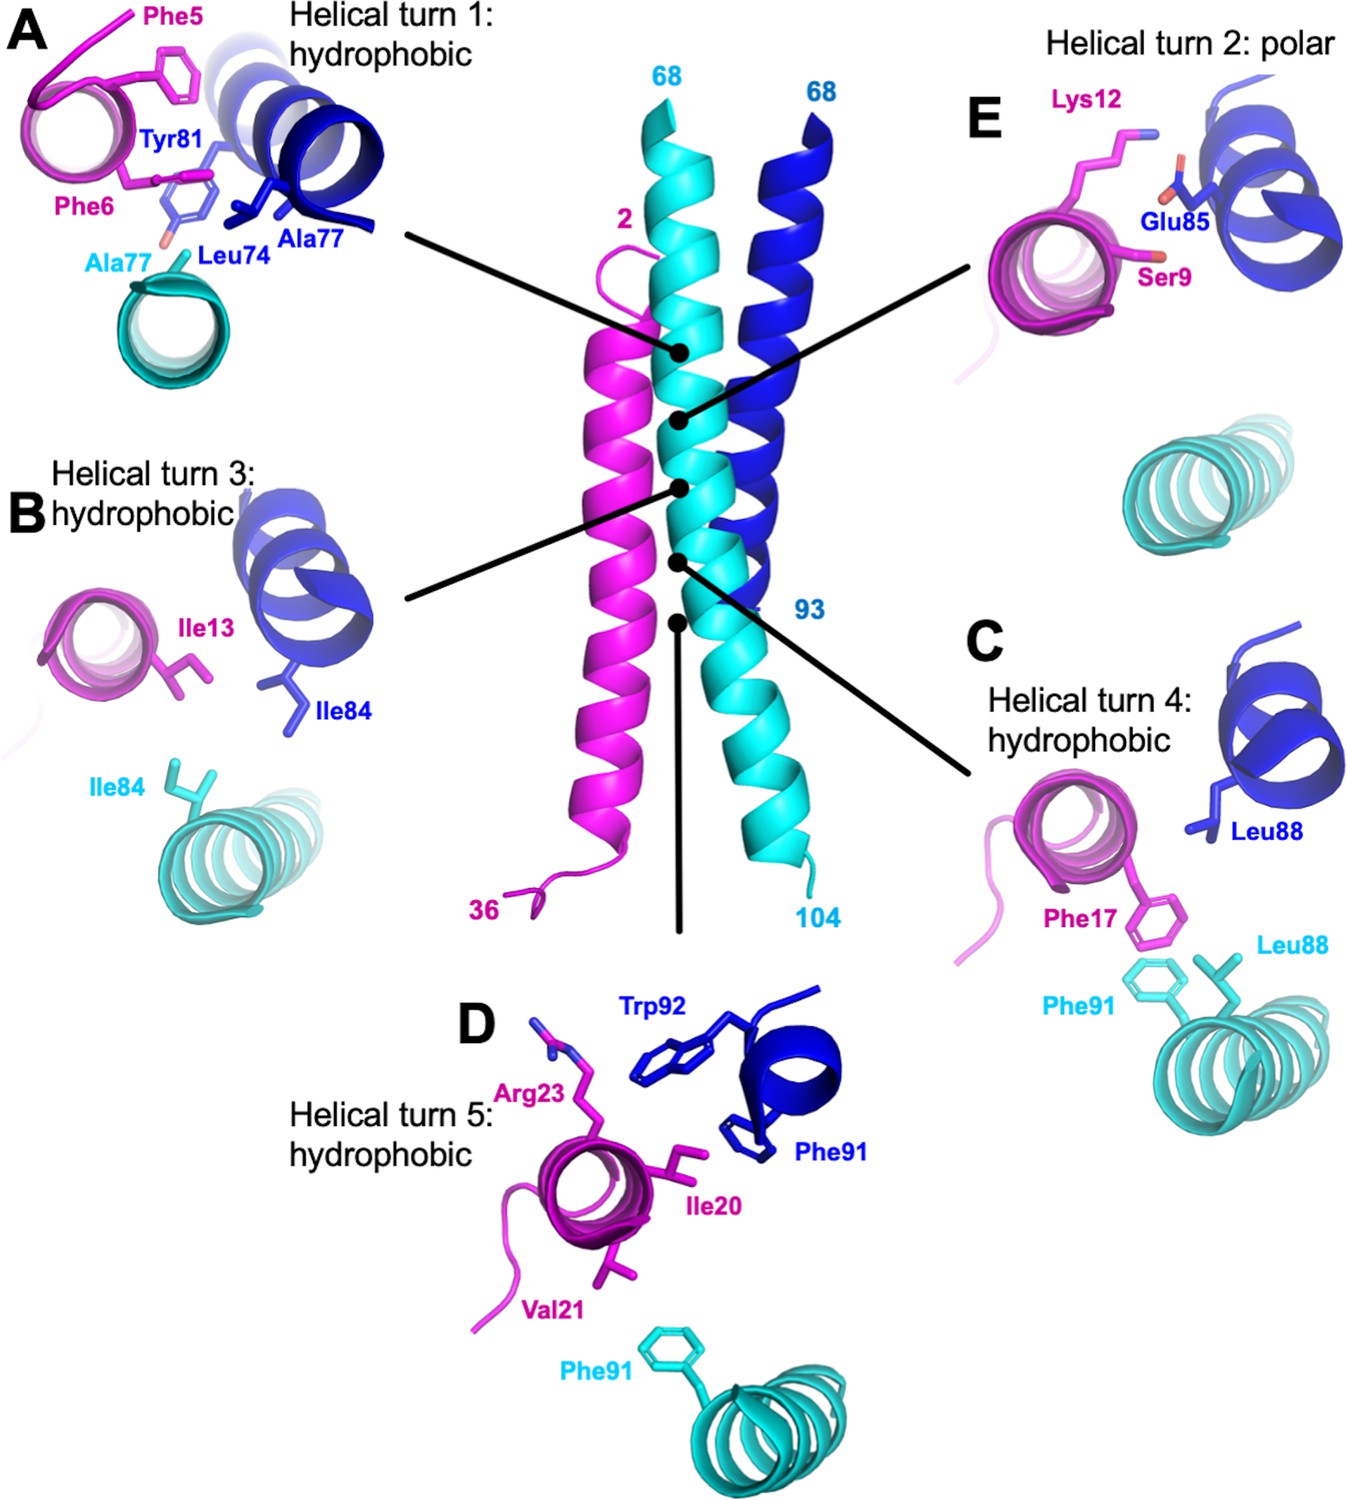
M87/LL-37 interface.
LL-37 is in magenta, and the M87 α-helix that forms a greater number of contacts with LL-37 is in blue (M87α1) and the one that forms fewer contacts in cyan (M87α2). Shown are contacts formed with LL-37 (A) Phe5 and Phe6; (B) Ile 13; (C) Phe17; (D) Ile20, Val21, and Arg23; and (E) Ser9 and Lys12.
Figure 4 with 2 supplements
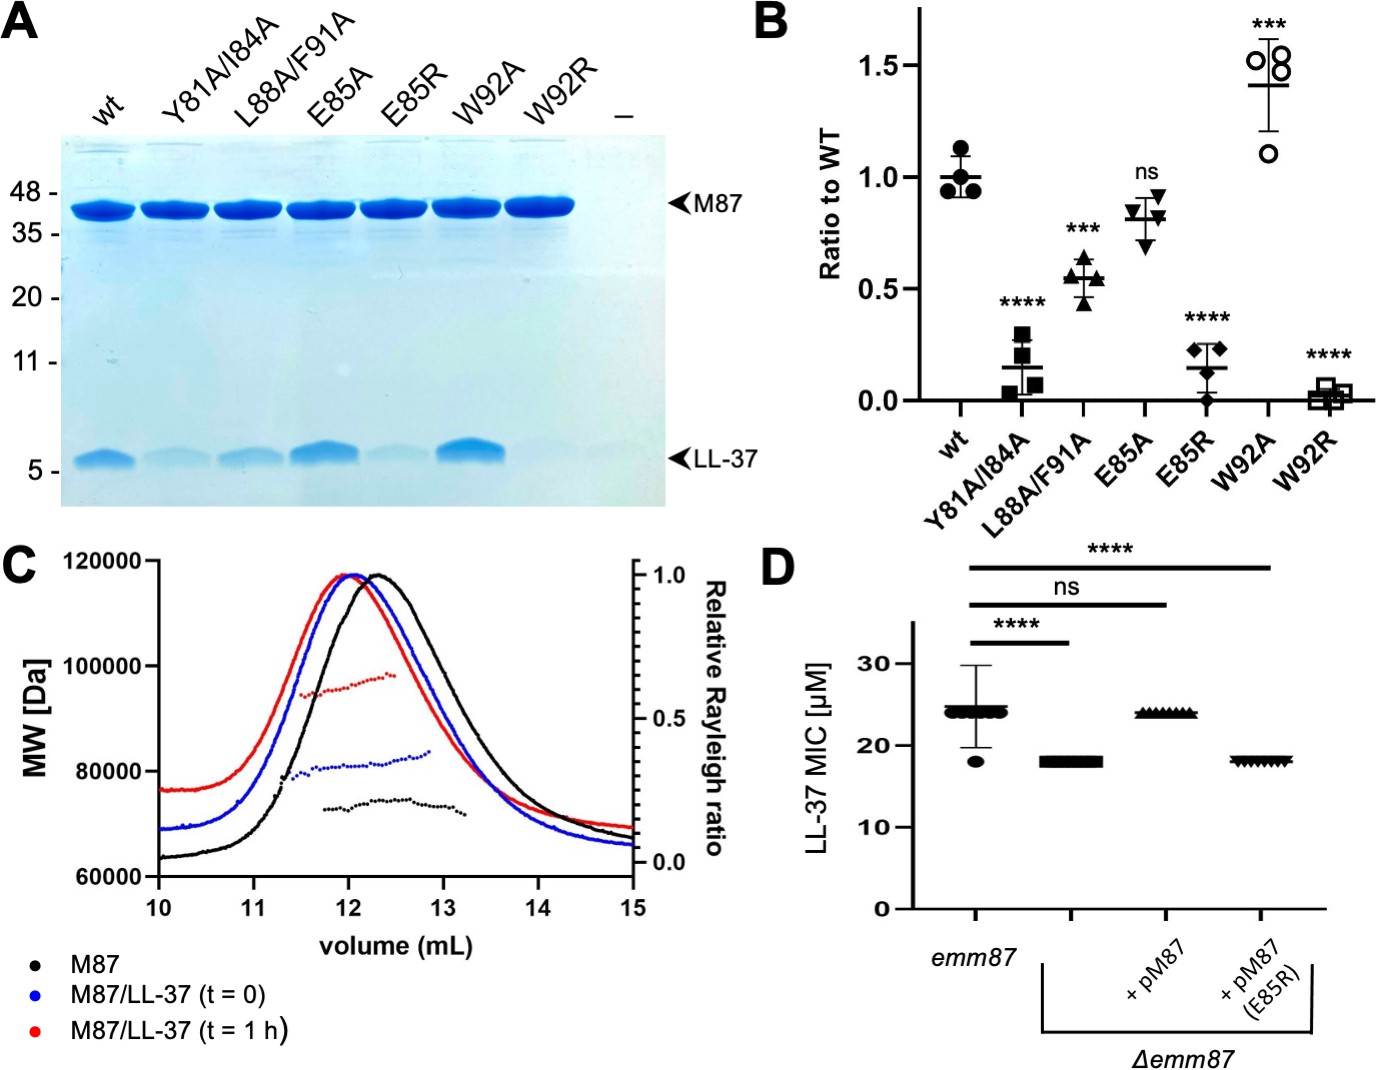
Evaluation of M87/LL-37 interactions.
(A) LL-37 binding by His-tagged, intact wild-type M87 or M87 Y81A/I84A, L88A/F91A, E85A, E85R, W92A, or W92R at 37°C as determined by Ni2+-NTA agarose bead co-precipitation. The last lane contains no M protein. Bound fractions were resolved by SDS-PAGE and visualized by Coomassie staining. The gel is representative of four experiments. Figure 4—figure supplement 1 shows circular dichroism (CD) spectra and melting curves of wild-type and mutant M87 proteins. (B) Quantification of LL-37 binding to intact wild-type and mutant M87 proteins. The ratio between LL-37 and wild-type M87 protein band intensities was quantified in four independent experiments and used to determine a mean LL-37/wt-M87 ratio. Points shown are ratios between LL-37 and (wild-type or mutant) M87 protein band intensities, normalized by the mean LL-37/wt-M87 ratio. For each sample, means and SD are shown. Statistical significance was calculated using one-way ANOVA with Dunnett’s post-hoc test. p-Values are as follows: ns > 0.05, *≤0.05, **≤0.01, ***≤0.001, and ****≤0.0001. (C) Molecular weight determination of intact M87 alone (black), M87 and LL-37 added together and immediately analyzed (blue), or M87 and LL-37 incubated for 1 hr before being analyzed (red) by size-exclusion chromatography (SEC) coupled to multiangle light scattering (MALS). Dotted lines indicate calculated molecular weights across the profile. Data are representative of three experiments. Figure 4—figure supplement 2 shows SEC-MALS analysis of M87 protein and LL-37 incubated for 1 or 4 hr. (D) LL-37 minimal inhibitory concentration (MIC) for emm87 and Δemm87 alone or expressing wild-type M87 (pM87) or M87 E85R (pM87(E85R)) from a plasmid. Data from eight independent experiments are presented as mean ± SD. The statistical test and p-values are the same as described for panel (B).
Figure 4—figure supplement 1
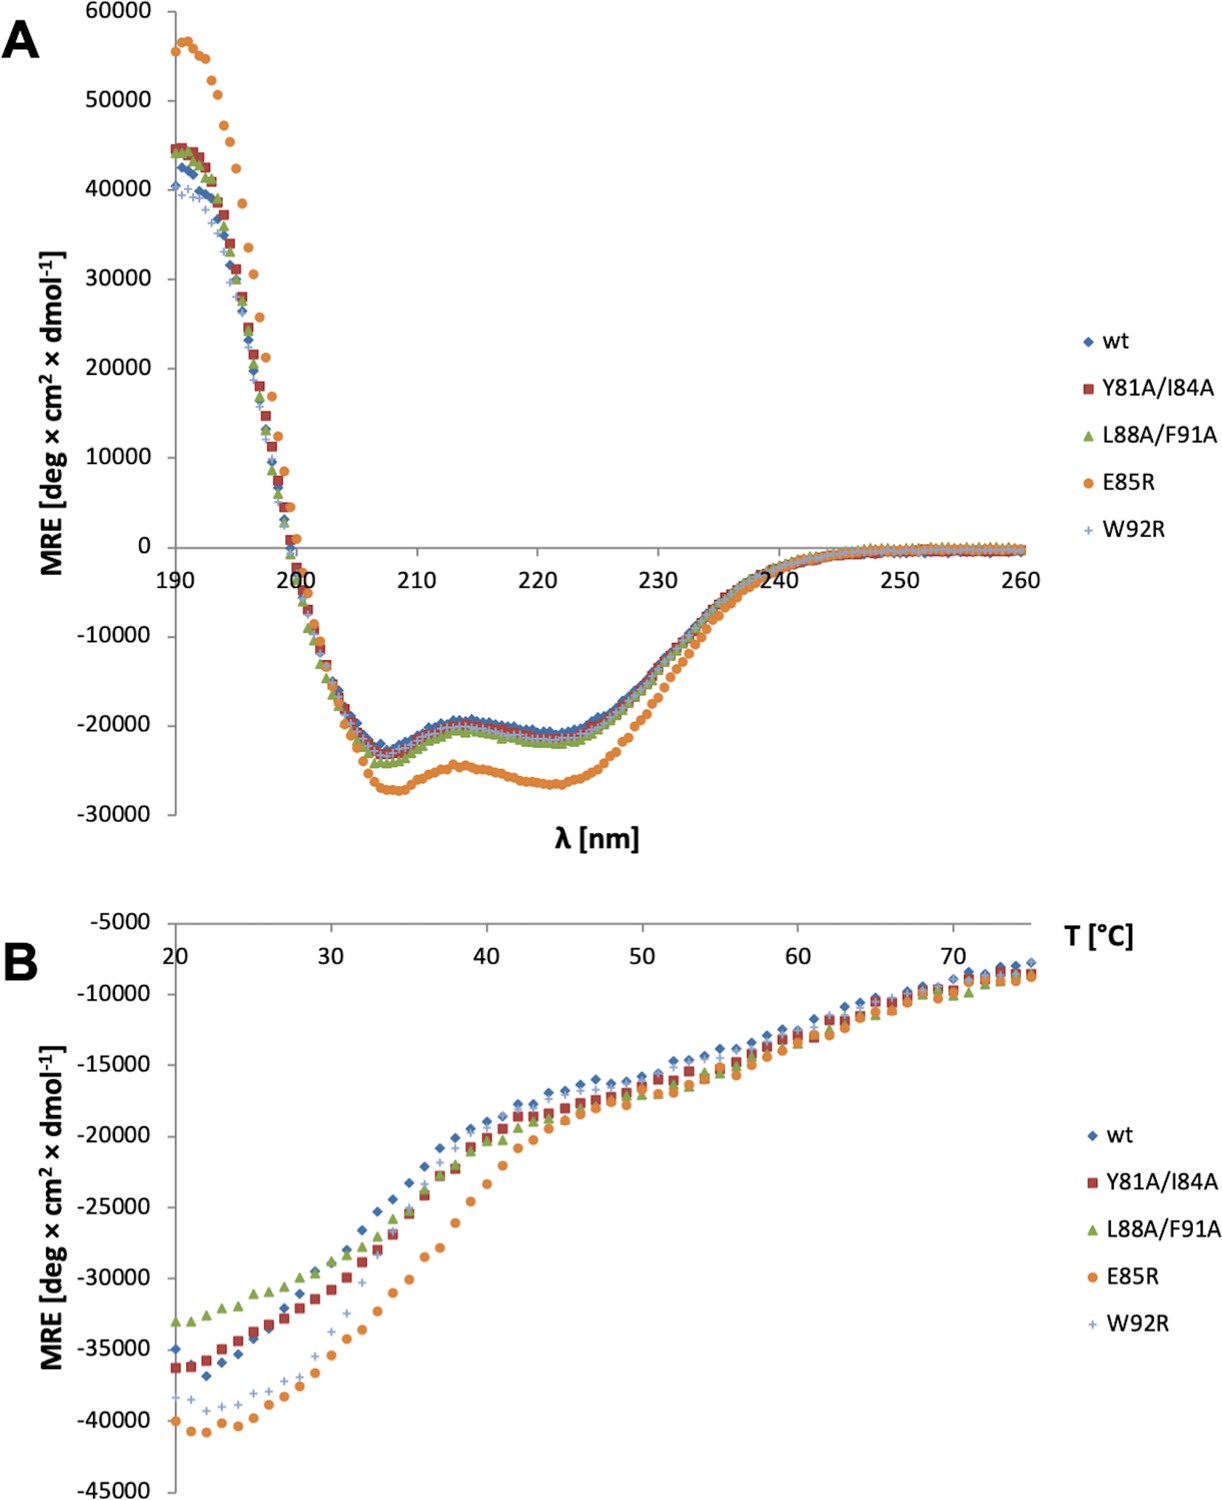
Structure and stability of M87 mutant proteins.
(A) Circular dichroism (CD) spectra of intact wild-type and mutant M87 proteins at 37°C. The data are an average of two independent measurements. (B) Melting curves of intact wild-type and mutant M87 proteins, as monitored by the CD mean molar residue ellipticity at 222 nm. The data are an average of two independent measurements.
Figure 4—figure supplement 2
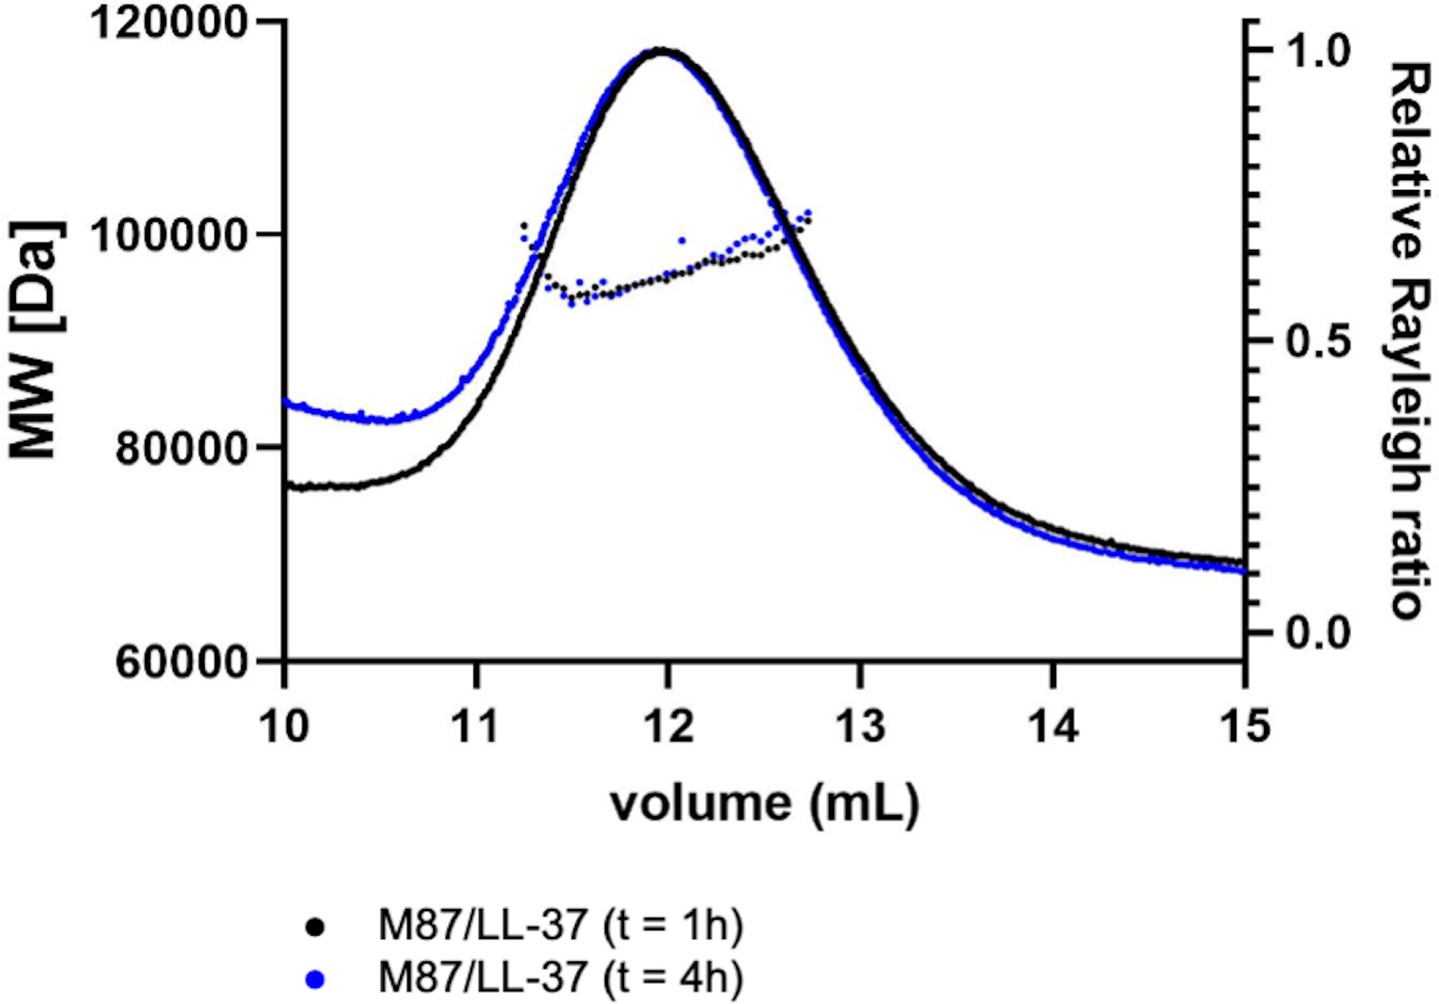
Self-limiting growth of the M87/LL-37 complex.
Molecular weights of intact M87 protein and LL-37 added together and incubated for 1 hr (black) or 4 hr (blue) were determined by size-exclusion chromatography coupled to multiangle light scattering. Dotted lines indicate calculated molecular weights across the profile.
Figure 5
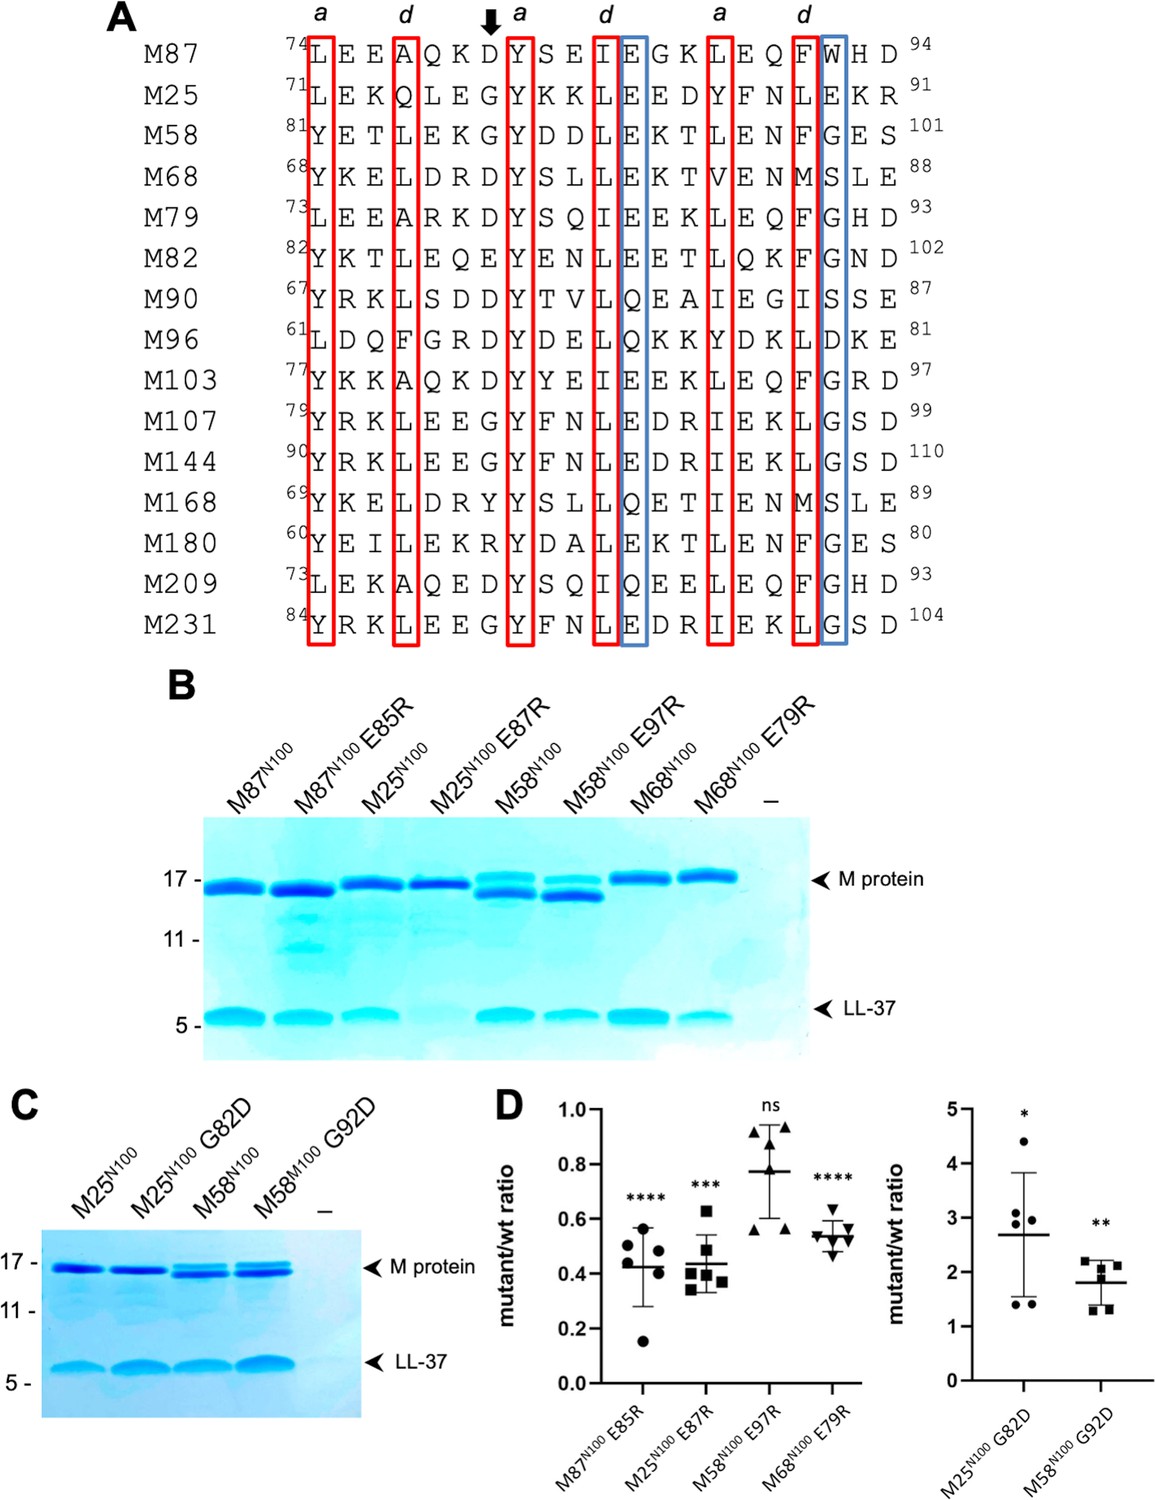
Conservation of the M87LL-37-binding motif.
(A) M87 amino acids that make hydrophobic contact to LL-37 are boxed in red and those that disrupt interaction with LL-37 through Arg substitution are in blue boxes, as are amino acids that are similarly positioned in other M proteins. The arrow indicates the position of M87 D80. (B) LL-37 interaction with His-tagged wild-type or mutant M87N100, M25N100, M58N100, M68N100 proteins determined by Ni2+-NTA agarose bead co-precipitation at 37°C. Bound fractions were resolved by SDS-PAGE and visualized by Coomassie staining. Data are representative of six experiments. (C) LL-37 interaction with His-tagged M25N100, M25N10 G82D, M58N100, and M58N100 G92D, determined as in panel (B). Data are representative of six experiments. (D) Quantification of the effect of mutagenesis on LL-37 binding. The ratio between LL-37 and wild-type M protein (i.e., M25, M58, M68, or M87) band intensities was quantified in six independent experiments and used to determine a mean LL-37/wt-M ratio. Points shown are ratios between LL-37 and mutant M protein band intensities, normalized by the corresponding mean LL-37/wt-M ratio. For each sample, means and SD are shown. Statistical significance was calculated using Student’s t-test to compare mutant and the corresponding wild-type protein. p-Values are as follows: ns > 0.05, *≤0.05, **≤0.01, ***≤0.001, and ****≤0.0001.
Figure 6 with 1 supplement
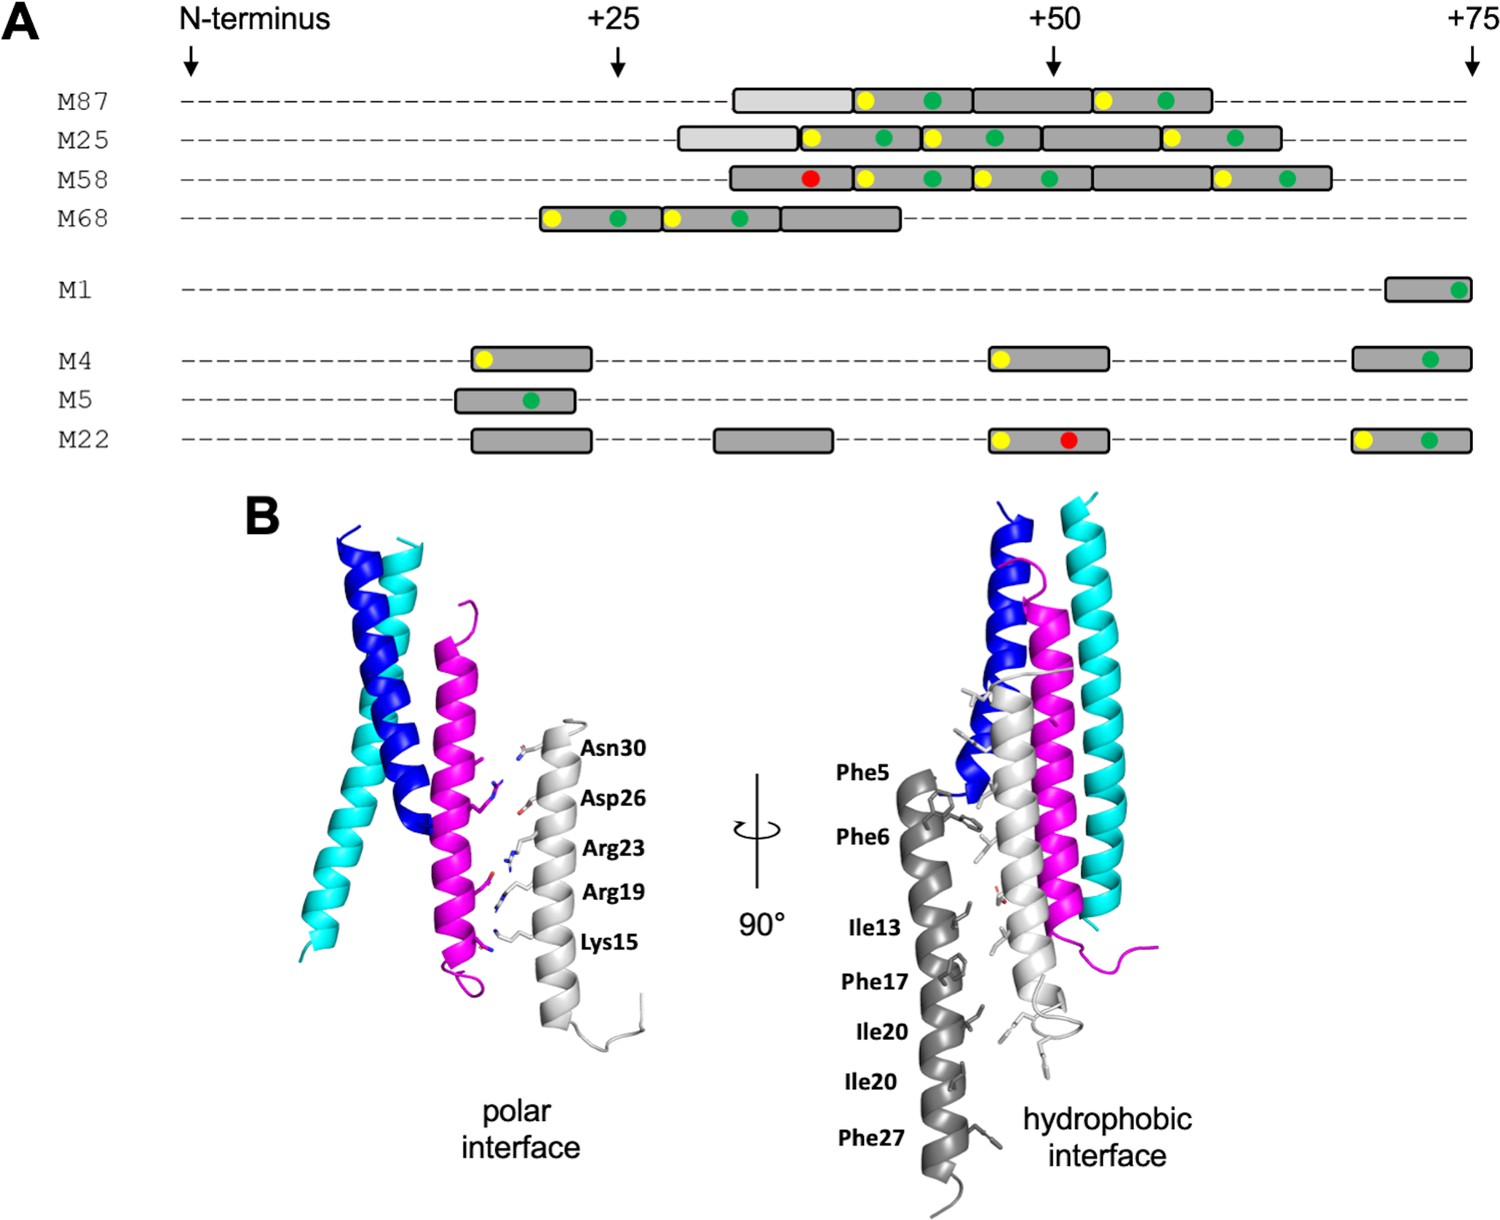
LL-37-binding motif and higher-order complex formation.
(A) Occurrence of ideal heptads (dark gray boxes; Ile, Leu, Met, Phe, Tyr, or Val at both a and d positions) and near-ideal heptads (light gray boxes; ideal amino acid at a position and Ala at d position, with M25 being an exception with Gln at this position) within the N-terminal regions of various M protein types. Within these boxes, yellow circles indicate Tyr at an a position; green circles Asp, Asn, Glu, or Gln at an e position; and red circles Arg or Lys at an e position. Yellow and red circles favor LL-37 binding, while the red circles disfavor LL-37 binding. Figure 6—figure supplement 1 shows the occurrence of ideal and near-ideal heptads within the N-terminal regions of additional M types. (B) Model of higher-order M87/LL-37 complex. M87α1 and M87α2 are in blue and cyan, respectively, and LL-37 is in magenta. Left: LL-37 bound to M87 protein has its polar face free to form polar contacts with a second LL-37 molecule (light gray, as seen in a structure of LL-37 alone, PDB 7PDC). Right: the light gray LL-37 has its hydrophobic face free to form hydrophobic contacts with yet another LL-37 molecule (dark gray, as seen in another structure of LL-37 alone, PDB 5NNM). The light and dark gray LL-37 molecules do not contact M87 protein.
Figure 6—figure supplement 1

LL-37-binding motif.
Depiction as in Figure 6A. The first grouping contains M proteins that have the LL-37-binding motif identified in M87 protein (experimentally verified for M87, M25, M58, and M68, and predicted for M79, M82, M90, M96, M103, M107, M144, M168, M180, M209, and M231). M1 protein, which binds LL-37 but does not have the motif identified in M87 protein, is next, followed by M proteins that have been shown experimentally to not bind LL-37. Lastly, 11 M proteins randomly selected from the remaining pool of M proteins are shown (M12, M15, M18, M42, M63, M71, M73, M101, M114, M176, and M178).
Tables
Table 1
Crystallographic data collection and model refinement.
| GCN4-M87/LL-37 | GCN4-M87 | |
|---|---|---|
| Data collection | ||
| Wavelength (Å) | 0.979 | 0.979 |
| Resolution range (Å) | 45.02 – 2.10 (2.18 – 2.10)* | 43.48 – 2.45 (2.54 – 2.45) |
| Space group | P21 | P43212 |
| Cell dimensions | ||
| a, b, c (Å) | 50.2, 57.1, 71.5 | 97.2, 97.2, 40.7 |
| α, β, γ (°) | 90.0, 102.7, 90.0 | 90.0, 90.0, 90.0 |
| Total reflections | 134,344 (9365) | 91,495 (8197) |
| Unique reflections | 22,092 (1694) | 7580 (738) |
| Multiplicity | 6.1 (5.5) | 12.1 (11.1) |
| Completeness (%) | 94.51 (89.58) | 99.75 (100.00) |
| I/σ(I) | 8.50 (2.10) | 31.40 (0.78) |
| Wilson B-factor (Å2) | 26.42 | 55.23 |
| † | 0.128 (0.735) | 0.404 (4.911) |
| CC1/2‡ | 0.996 (0.878) | 0.987 (0.556) |
| Refinement | ||
| Resolution range (Å) | 45.02 – 2.10 (2.20 – 2.10) | 43.48 – 2.45 (2.80 – 2.45) |
| No. of reflections (work/test set) | 21,958/2426 | 7563/383 |
| § | 0.22/0.27 (0.27/0.34) | 0.26/0.27 (0.29/0.38) |
| No. of non-hydrogen atoms | 2673 | 1138 |
| Macromolecules | 2556 | 1126 |
| Ligands | 16 (ethylene glycol) | 2 (PO43-) |
| Solvent | 101 | 2 |
| r.m.s. deviations | ||
| Bonds (Å) | 0.003 | 0.007 |
| Angles (°) | 0.46 | 0.95 |
| Ramachandran plot | ||
| Favored (%) | 100.00 | 100.00 |
| Outliers (%) | 0.00 | 0.00 |
| Rotamer outliers (%) | 0.00 | 0.00 |
| Clashscore | 3.37 | 3.98 |
| Average B-factor (Å2) | 46.59 | 76.91 |
| Macromolecules | 46.80 | 75.60 |
| Ligands | 37.52 | 110.74 |
| Solvent | 42.81 | 64.27 |
| Number of TLS groups | 8 | 2 |
| PDB code | 7SAY | 7SAF |
-
Formulas for and are identical except 95% of the total number of reflections was used to calculate , whereas the remaining 5% of reflection was used to calculate .
-
*Values in parentheses are for the highest resolution shell.
-
†
-
‡CC1/2 is the Pearson correlation between two half datasets.
-
§
Additional files
-
Transparent reporting form
- https://cdn.elifesciences.org/articles/77989/elife-77989-transrepform1-v1.docx
-
Source data 1
Source data for Figure 1, Figure 1—figure supplement 1, Figure 4, and Figure 5.
- https://cdn.elifesciences.org/articles/77989/elife-77989-data1-v1.zip
Download links
A two-part list of links to download the article, or parts of the article, in various formats.
Downloads (link to download the article as PDF)
Open citations (links to open the citations from this article in various online reference manager services)
Cite this article (links to download the citations from this article in formats compatible with various reference manager tools)
An M protein coiled coil unfurls and exposes its hydrophobic core to capture LL-37
eLife 11:e77989.
https://doi.org/10.7554/eLife.77989


