Domain fusion TLR2-4 enhances the autophagy-dependent clearance of Staphylococcus aureus in the genetic engineering goat
- Beijing Key Laboratory of Animal Genetic Improvement, College of Animal Science and Technology, China Agricultural University, China
- National Engineering Laboratory for Animal Breeding, College of Animal Science and Technology, China Agricultural University, China
- Key Laboratory of Animal Genetics, Breeding and Reproduction of the Ministry of Agriculture and Rural Affairs, College of Animal Science and Technology, China Agricultural University, China
- Tianjin Academy of Agricultural Sciences, China
- Key Laboratory of Animal Biotechnology, Ministry of Agriculture, Northwest Agriculture and Forest University, China
- State Key Laboratory for Conservation and Utilization of Subtropical Agro-bioresources, Guangxi University, China
- Farm Animal Genetic Resources Exploration and Innovation Key Laboratory of Sichuan Province, College of Animal Science and Technology, Sichuan Agricultural University, China
Figures
Figure 1 with 2 supplements
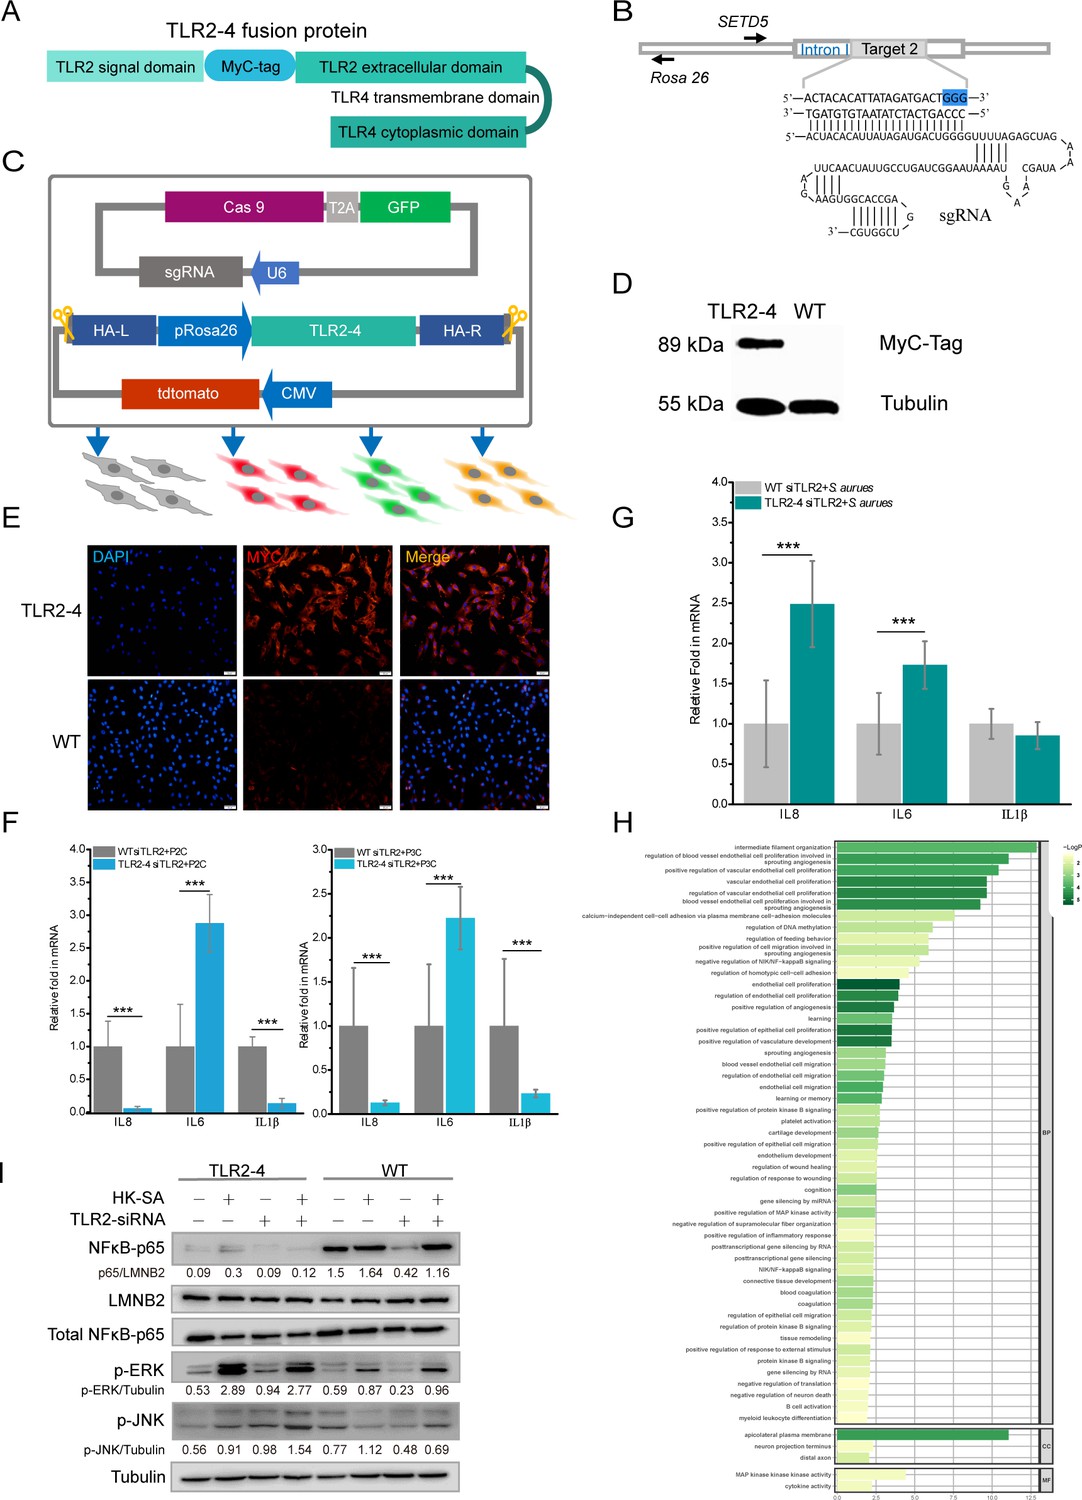
Construction of fibroblast cell line expressing Toll-like receptor 2-4 (TLR2-4).
(A) Structure of fusion protein TLR2-4. Total RNA was extracted from goat peripheral blood and was reverse- transcribed into cDNA. TLR2 extracellular domain and TLR4 transmembrane and intracellular domain were amplified from cDNA. (B) Schematic representation of the small guide RNA2 (sgRNA2) and its target genome DNA. The sgRNA target 2 was located on the first intron of SETD5 and the PAM site is colored blue. (C) The expression vector of sgRNA2-CRISPR/Cas9 was constructed by joining the crRNA-oligo into PX458 vector containing GFP. TLR2-4 was inserted into pRosa26-promoter vector, and the expression construction of CMV-tdTomato was cloned into reconstructed pRosa26-TLR2-4 vector. Both PX458-sgRNA and pRosa26-TLR2-4-tdTomato were co-transfected into goat fibroblasts. Transfected cells expressing both green and red fluorescence were selected by flow cytometry. (D) The protein level of TLR2-4 in fibroblasts was detected by Western blotting using MyC-Tag mouse monoclonal antibody. Tubulin was used to normalize the data of each sample. (E) The expression of TLR2-4 was confirmed by immunofluorescence in fibroblasts. The selected positive and wild-type (WT) fibroblasts were incubated with MyC-Tag primary antibody and conjugated with Alexa Fluor 594-labeled goat anti-mouse secondary antibody, then were observed by confocal microscopy. Scale bar: 50 μm. (F and G) The mRNA expression of cytokines was detected by real-time reverse transcription PCR (qRT-PCR) in TLR2 ligands or killed S. aureus-stimulated TLR2-4 and WT fibroblasts. Cells were pretreated with small interfering RNA (siRNA) of TLR2 for 24 hr, and then treated with 500 ng/ml P2C, P3C (F) or heat-killed S. aureus (HK-SA) (multiplicity of infection [MOI] = 10) (G) (n=6 biologically independent samples). Cells were harvested at 10 hr after infection, and the mRNA levels of IL8, IL6, and IL1β were measured by qRT-PCR. (H) Gene Ontology (GO) enrichment terms of differentially expressed genes (DEGs) between both endogenous TLR2 silenced TLR2-4 and WT fibroblasts after stimulated with HK-SA (MOI = 10) for 10 hr according to RNA-seq data. (I) The cells were challenged with HK-SA (MOI = 10) for 10 hr, and the phosphorylation of ERK1/2 and JNK, and the nuclear translocation of NF-κB were detected by Western blot. The results are presented as the means SD (standard deviation). Student’s t tests were used for comparisons between two groups. ***p<0.001. Exact p-values are provided in Supplementary file 1.
-
Figure 1—source data 1
The original blots of Toll-like receptor 2-4 (TLR2-4) (TLR2-4 blot was repeated twice) and wild-type (WT) fibroblasts.
- https://cdn.elifesciences.org/articles/78044/elife-78044-fig1-data1-v1.zip
-
Figure 1—source data 2
The original blots.
- https://cdn.elifesciences.org/articles/78044/elife-78044-fig1-data2-v1.zip
Figure 1—figure supplement 1
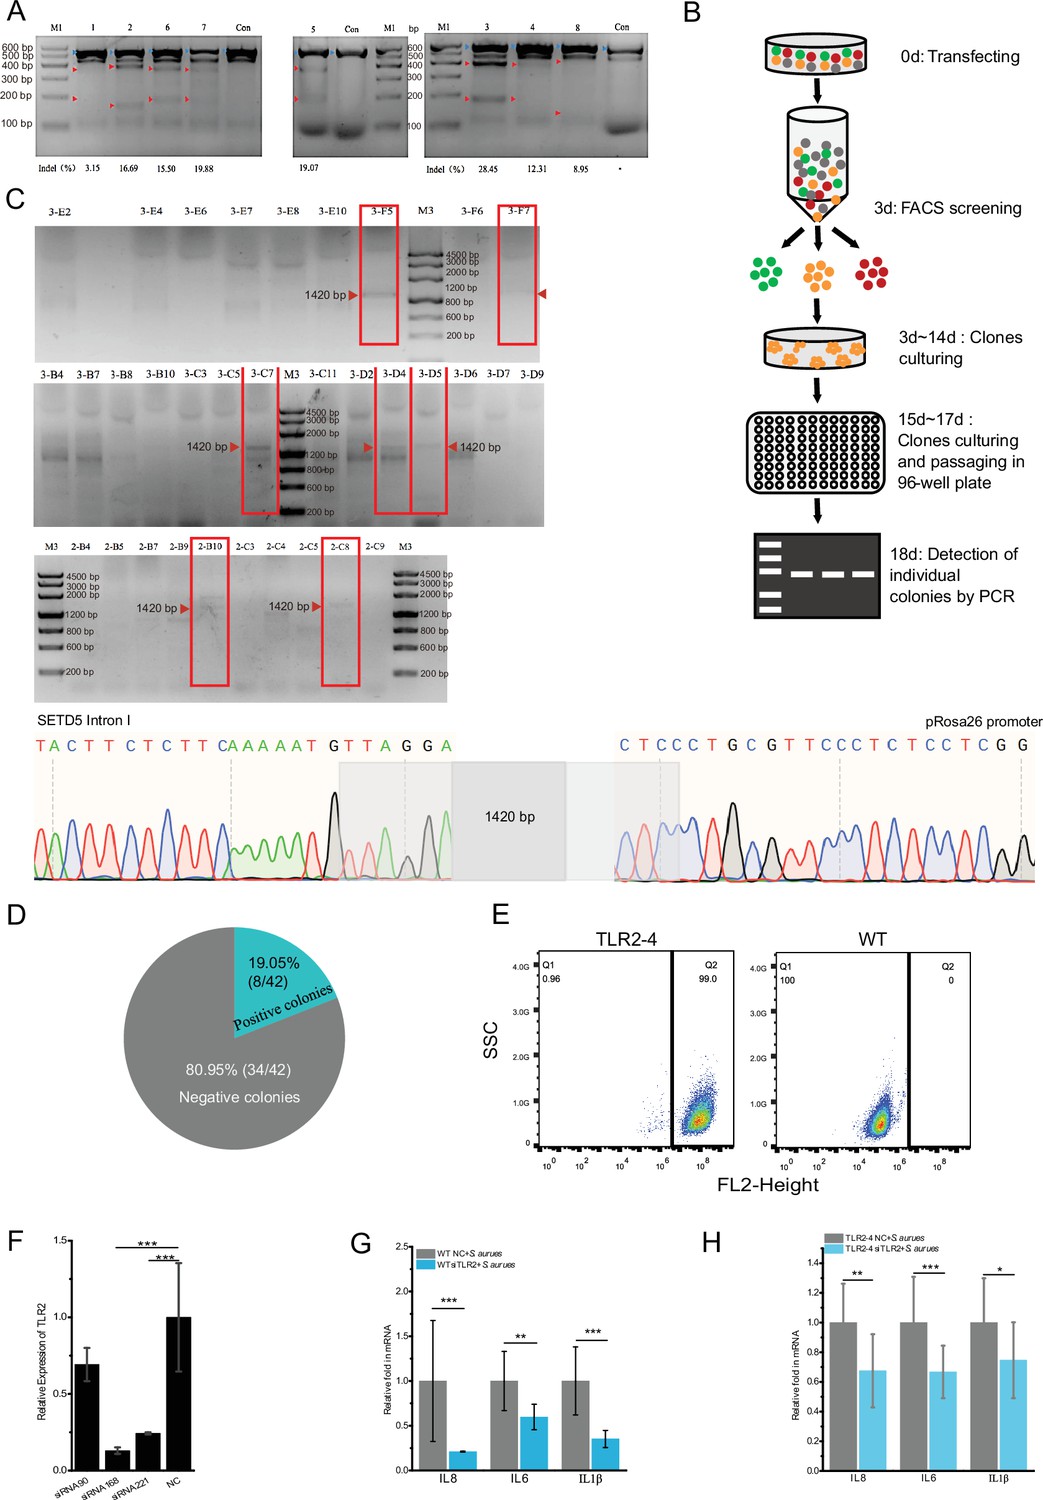
Establishment and identification of the Toll-like receptor 2-4 (TLR2-4) fibroblast cell line.
Establishment of the TLR2-4 fibroblast cell line. (A) Gene editing efficiency was evaluated by the T7E1 cleavage assay. Fibroblasts were individually transfected with the eight small guide RNA (sgRNA)-CRISPR/Cas9 vectors for 72 hr, and then the genomic DNA was extracted. The fragment spanning the sgRNA target sites were amplified by PCR for T7E1 cleavage assay. The cleaved PCR products are indicated with red arrows. The density value of bands was calculated to evaluate the gene editing efficiency of each target. 1, 2, 6, 7, 5, 3, 4, 8 were the corresponding target numbers, respectively. Indel (%): percentage of gene editing; M1: LD Marker; Con: un-transfected cells. (B) Screening process of TLR2-4 cells. Goat fibroblasts were co-transfected with PX458-sgRNA and donor plasmid pRosa26-TLR2-4. After 3 days of transfection, cells with both green and red fluorescence were obtained by fluorescence-activated cell sorting (FACS). The sorted cells were seeded in 100 mm dishes and cultured with DMEM/F12 medium containing 20% FBS. After culturing for 12–14 days, the clone fibroblasts were picked by clone ring and cultured in 96-well plates. Then the cell clones were identified by PCR. (C) The genomic integration of TLR2-4 in cell clones were identify by PCR. The positive cell clones of TLR2-4 were confirmed, including 3-F5, 3-F7, 3-C7, 3-D4, 3-D5, 2-B10, and 2-C8. M3: LD Marker. The PCR product of the DNA fragment of 1420 bp was further purified to sequence by Sanger sequencing analysis, demonstrating TLR2-4 was inserted into first intron of SETD5. (D) The percentage of targeted knock-in of TLR2-4 was calculated in total cell clones. (E) TLR2-4-positive cells were determined by flow cytometry. The positive and wild-type (WT) fibroblasts were incubated with MyC-tag mouse monoclonal antibody and conjugated with Alexa Fluor 594-labeled goat anti-mouse antibody. The expression of TLR2-4 on cell surface was detected by flow cytometry. (F) The three designed TLR2 small interfering RNAs (siRNAs) were transfected into fibroblasts for 48 hr, and knockdown efficiency of TLR2 was evaluated by qRT-PCR (n=3 biologically independent samples). (G and H) WT (G) and TLR2-4 fibroblasts (H) with knockdown TLR2 by siRNA were stimulated with heat-killed S. aureus for 10 hr (multiplicity of infection [MOI] = 10). The mRNA expression of cytokines was detected by qRT-PCR (G: n=3 biologically independent samples; H: n=6 biologically independent samples). NC: negative control of siRNA. Data are means ± SD. Student’s t tests were used for comparisons between two groups. ***p<0.001, **p<0.01, *p<0.05. Exact p-values are provided in Supplementary file 1.
-
Figure 1—figure supplement 1—source data 1
The original gels of Figure 1—figure supplement 1A.
- https://cdn.elifesciences.org/articles/78044/elife-78044-fig1-figsupp1-data1-v1.zip
-
Figure 1—figure supplement 1—source data 2
The original gels of Figure 1—figure supplement 1C.
- https://cdn.elifesciences.org/articles/78044/elife-78044-fig1-figsupp1-data2-v1.zip
-
Figure 1—figure supplement 1—source data 3
The original gels of Figure 1—figure supplement 1C.
- https://cdn.elifesciences.org/articles/78044/elife-78044-fig1-figsupp1-data3-v1.zip
Figure 1—figure supplement 2
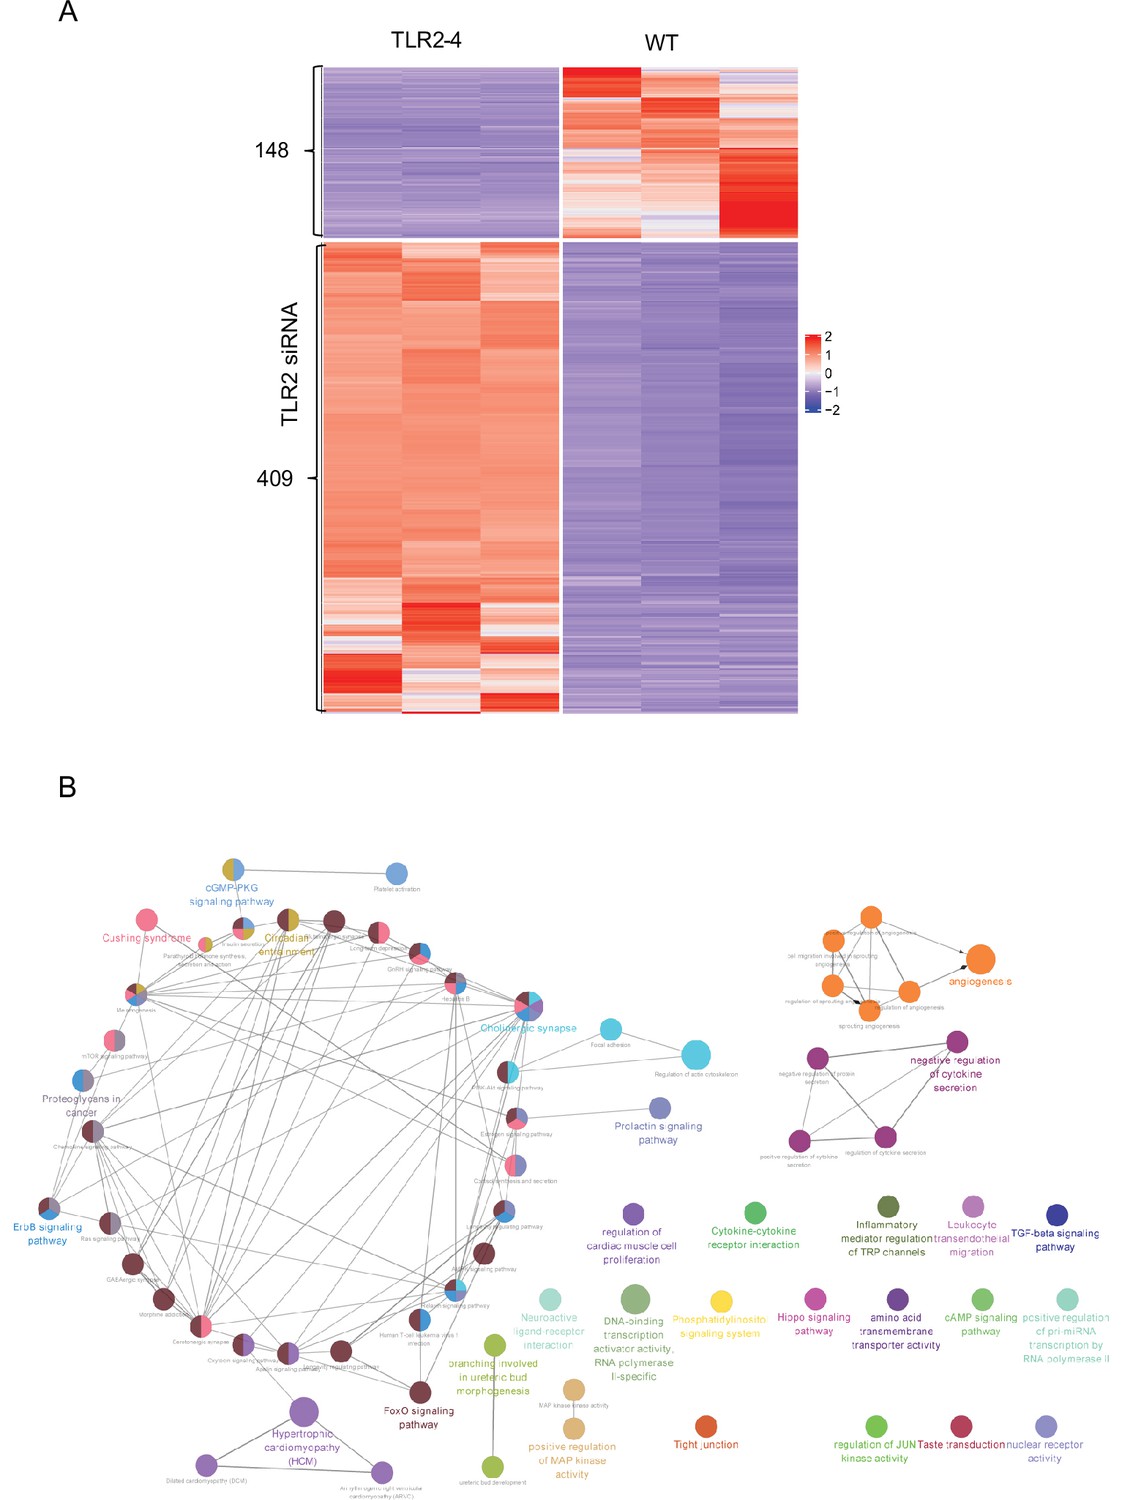
Heatmap and Kyoto Encyclopedia of Genes and Genomes (KEGG) pathway enrichment analysis of the differentially expressed genes (DEGs) between Toll-like receptor 2-4 (TLR2-4) and wild-type (WT) fibroblasts after S. aureus infection (n=3 biologically independent samples).
The effect of TLR2-4 on global transcriptome in killed S. aureus-infected fibroblasts. Both TLR2-4 and WT fibroblasts with knockdown endogenous TLR2 were stimulated with heat-killed S. aureus for 10 hr (multiplicity of infection [MOI] = 10). 557 DEGs between TLR2-4 and WT cells were screened by RNA-seq. (A) Heatmap presents the screened DEGs. (B) The enriched KEGG pathways of DEGs.
Figure 2 with 1 supplement
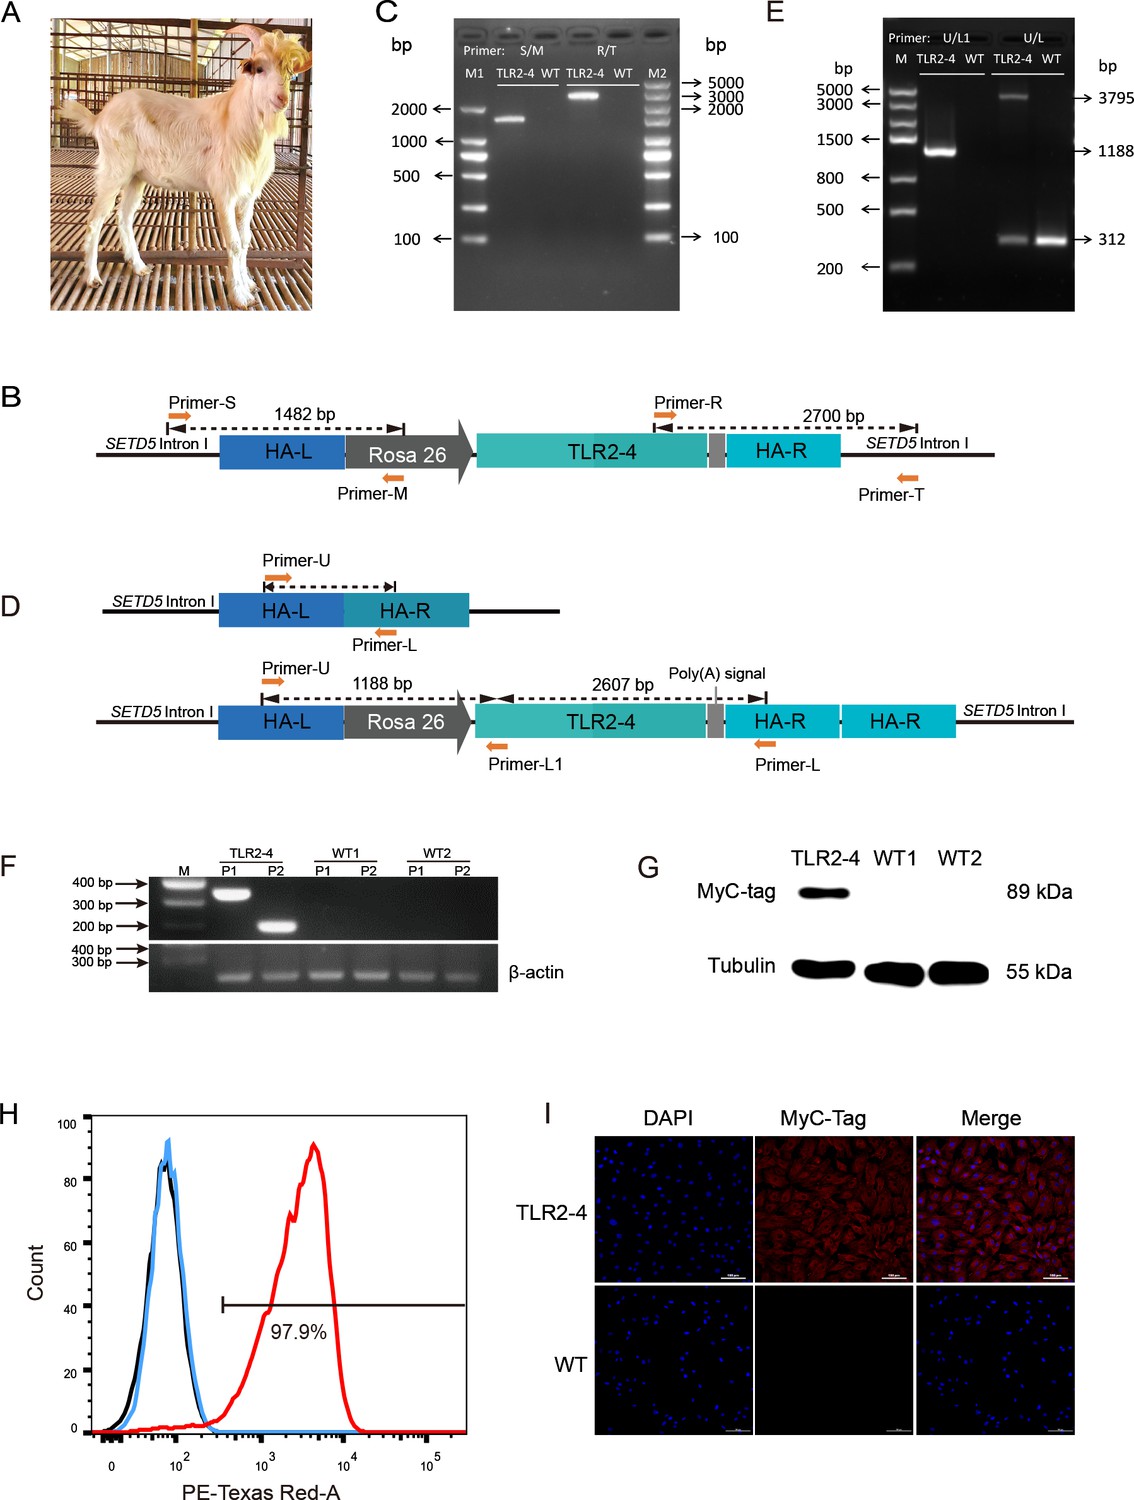
Generation of clone goat expressing Toll-like receptor 2-4 (TLR2-4).
(A) The clone goat expressing TLR2-4 was prepared by somatic cell nuclear transfer. (B) Schematic representation of the site-specific integration of primers S-M and T-R. (C) Genomic DNA of macrophages from transgenic and wild-type (WT) goat was extracted. The PCR products were amplified using primers S-M and T-R. The sequences of primers are listed in Supplementary file 2D. (D) Schematic representation of the primers U-L1 and U-L. The sequences of primers are listed in Supplementary file 2D. (E) Genomic DNA of macrophages from transgenic and WT goat was extracted. The products of PCR were amplified using primers U-L1 and U-L. (F) The mRNA expression of TLR2-4 in macrophages was detected by RT-PCR. 331 bp length fragments were amplified by Primer P1, and 188 bp length fragments were amplified by Primer P2. β-actin was used as housekeeping gene. (G) The protein level of TLR2-4 in macrophages was detected by Western blot using MyC-tag mouse monoclonal antibody. (H) The levels of TLR2-4 on macrophages membrane were analyzed by flow cytometry. Macrophages were labeled with MyC-tag monoclonal primary antibody at 4°C for 1 hr. Alexa Fluor 594 goat anti-mouse IgG was used as secondary antibody. The mean fluorescence intensity (MFI) of negative control (black), WT (blue), and TLR2-4 (red) in macrophages was estimated by FlowJo software, and then the percentage of positive TLR2-4 macrophages was calculated relative to the control sample. (I) The expression of TLR2-4 in macrophages was detected by immunofluorescence. Macrophages were labeled with MyC-tag monoclonal primary antibody at 4°C for 12 hr, and then goat anti-mouse secondary antibody IgG conjugated with Alexa Fluor 594-labeled was followed. The nucleus was stained with DAPI (blue). Scale bar: 100 μm.
-
Figure 2—source data 1
The original gels of Figure 2C.
- https://cdn.elifesciences.org/articles/78044/elife-78044-fig2-data1-v1.zip
-
Figure 2—source data 2
The original gels of Figure 2E.
- https://cdn.elifesciences.org/articles/78044/elife-78044-fig2-data2-v1.zip
-
Figure 2—source data 3
The original gels of Figure 2F.
- https://cdn.elifesciences.org/articles/78044/elife-78044-fig2-data3-v1.zip
-
Figure 2—source data 4
The original blots of Figure 2G.
- https://cdn.elifesciences.org/articles/78044/elife-78044-fig2-data4-v1.zip
Figure 2—figure supplement 1
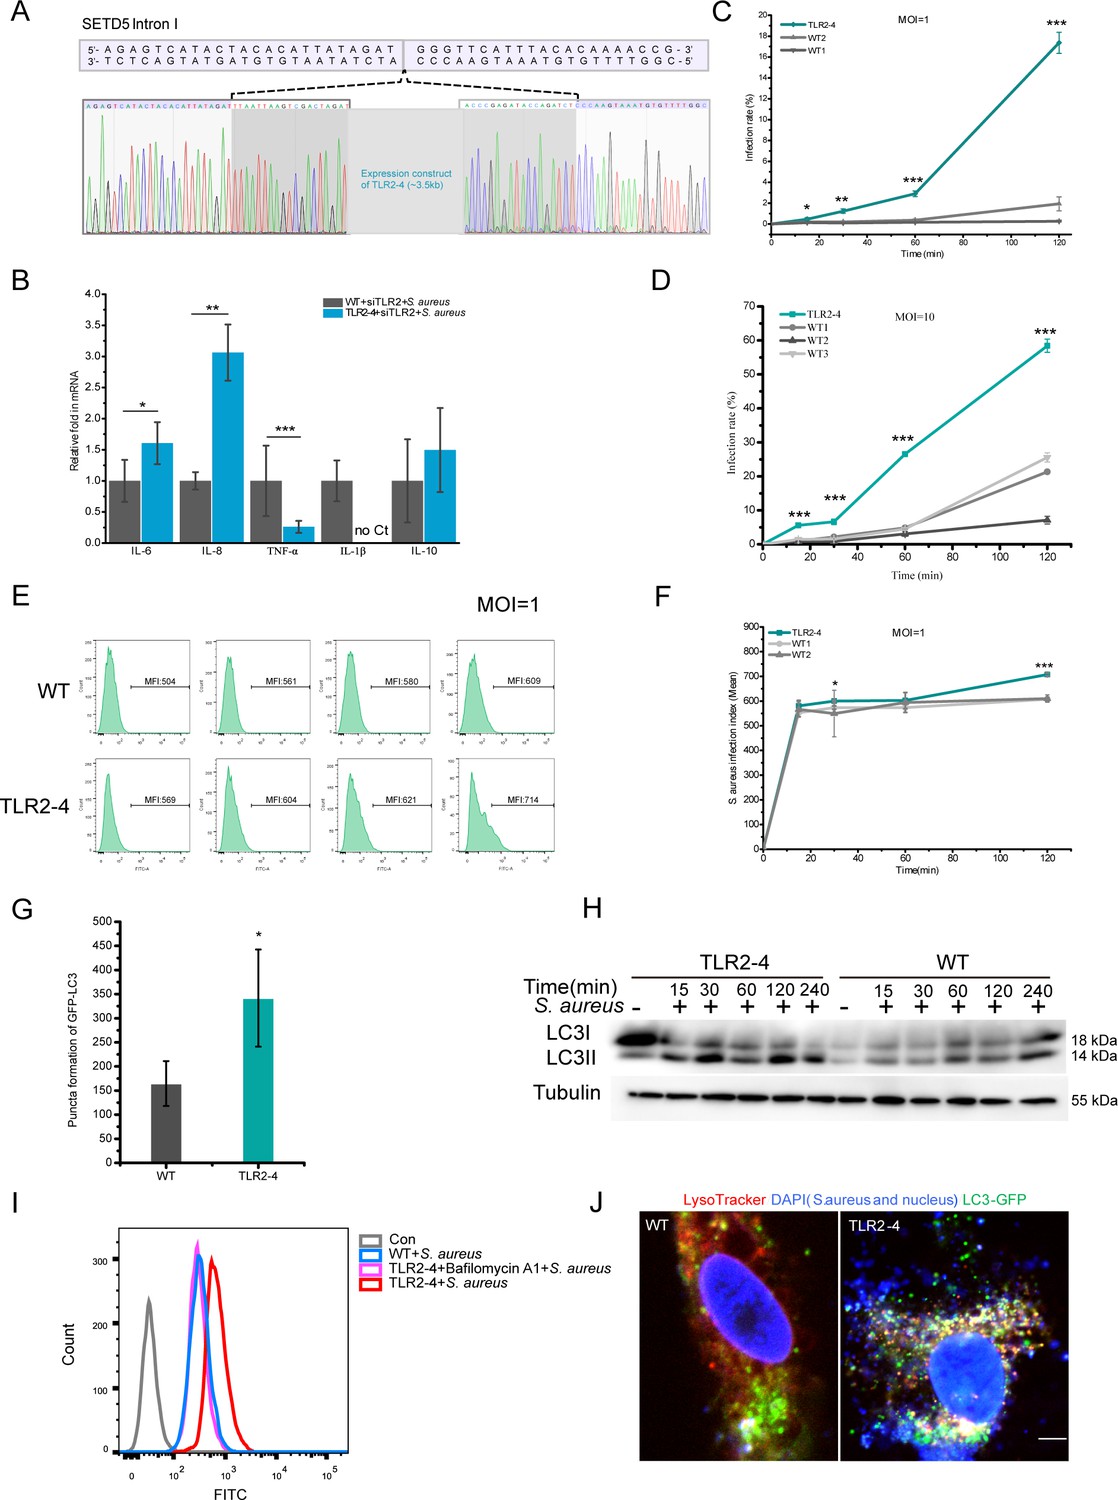
Identification of the insertion site and sequences of Toll-like receptor 2-4 (TLR2-4) in macrophages.
And the ligand recognition function of TLR2-4 receptor in macrophages was identified. The effect of TLR2-4 on the phagocytose of S. aureus in macrophages. (A) The PCR products of 3795 bp were subcloned into pTOPO-TA/Blunt cloning vector for Sanger sequencing analysis, demonstrating TLR2-4 was inserted into first intron of SETD5. (B) Macrophages were challenged with live S. aureus (multiplicity of infection [MOI] = 10) for 1 hr, and then harvested to detect the mRNA level of cytokines by qRT-PCR (n=3–4 biologically independent samples). (C and D) Macrophages were infected with fluorescein isothiocyanate (FITC)-labeled S. aureus for 15, 30, 60, 120 min, respectively. Cells were cultured with DMEM containing 200 µg/ml gentamicin for 1 hr. The percentage of macrophages that uptake S. aureus were calculated by flow cytometry (n=3 biologically independent samples). (E and F) Macrophages were treated with FITC-labeled S. aureus (MOI = 1) for 15, 30, 60, 120 min, respectively. Cells were incubated with DMEM containing 200 µg/ml gentamicin for 1 hr. S. aureus load in macrophages were analyzed by flow cytometry. The infection index of S. aureus in macrophages was evaluated by calculating mean fluorescence intensity (MFI) of FITC using flow cytometer and FlowJo software (n=3 biologically independent samples). (G) The LC3-punctas in S. aureus-infected macrophages were quantified by ImageJ (n=3–7 biologically independent samples). (H) Fibroblasts expressing TLR2-4, syngenic with original fibroblasts that used for gene editing, were stimulated with killed-S. aureus at the MOI of 10. The conversion of LC3I to LC3II in S. aureus-infected cells was analyzed by Western blotting. (I) The effect of autophagy on lysosomal activity in TLR2-4 macrophages. Macrophages were infected with S. aureus (MOI = 10) for 1 hr in the presence or absence of Bafilomycin A1. Cells were washed three times with PBS and cultured with DMEM medium containing gentamicin (200 µg/ml) and lysosomal substrate for 1 hr. The lysosomal intracellular activity in macrophages was measured by flow cytometry. Bafilomycin A1, a cell-permeable inhibitor of the lysosomal membrane V-ATPase proton pump. Con: untreated macrophages. (J) The analysis of co-localization S. aureus, LC3, and lysosome in macrophages. Macrophages were transfected with pGMLV-GFP-LC3-Puro lentivirus for 48 hr, and then treated with S. aureus for additional 4 hr. Cells were incubated with LysoTracker Red staining (Red) for 30 min. S. aureus and cell nucleus were stained with DAPI (blue) for 10 min. Macrophages were captured by confocal microscope (red: LysoTracker; green: GFP-LC3; blue: S. aureus and cell nucleus). Scale bar: 10 µm. Data are means ± SD. Student’s t tests were used for comparisons between two groups. ***p<0.001, **p<0.01, *p<0.05. Exact p-values are provided in Supplementary file 1.
-
Figure 2—figure supplement 1—source data 1
The original blots of Figure 2—figure supplement 1H.
- https://cdn.elifesciences.org/articles/78044/elife-78044-fig2-figsupp1-data1-v1.zip
Figure 3
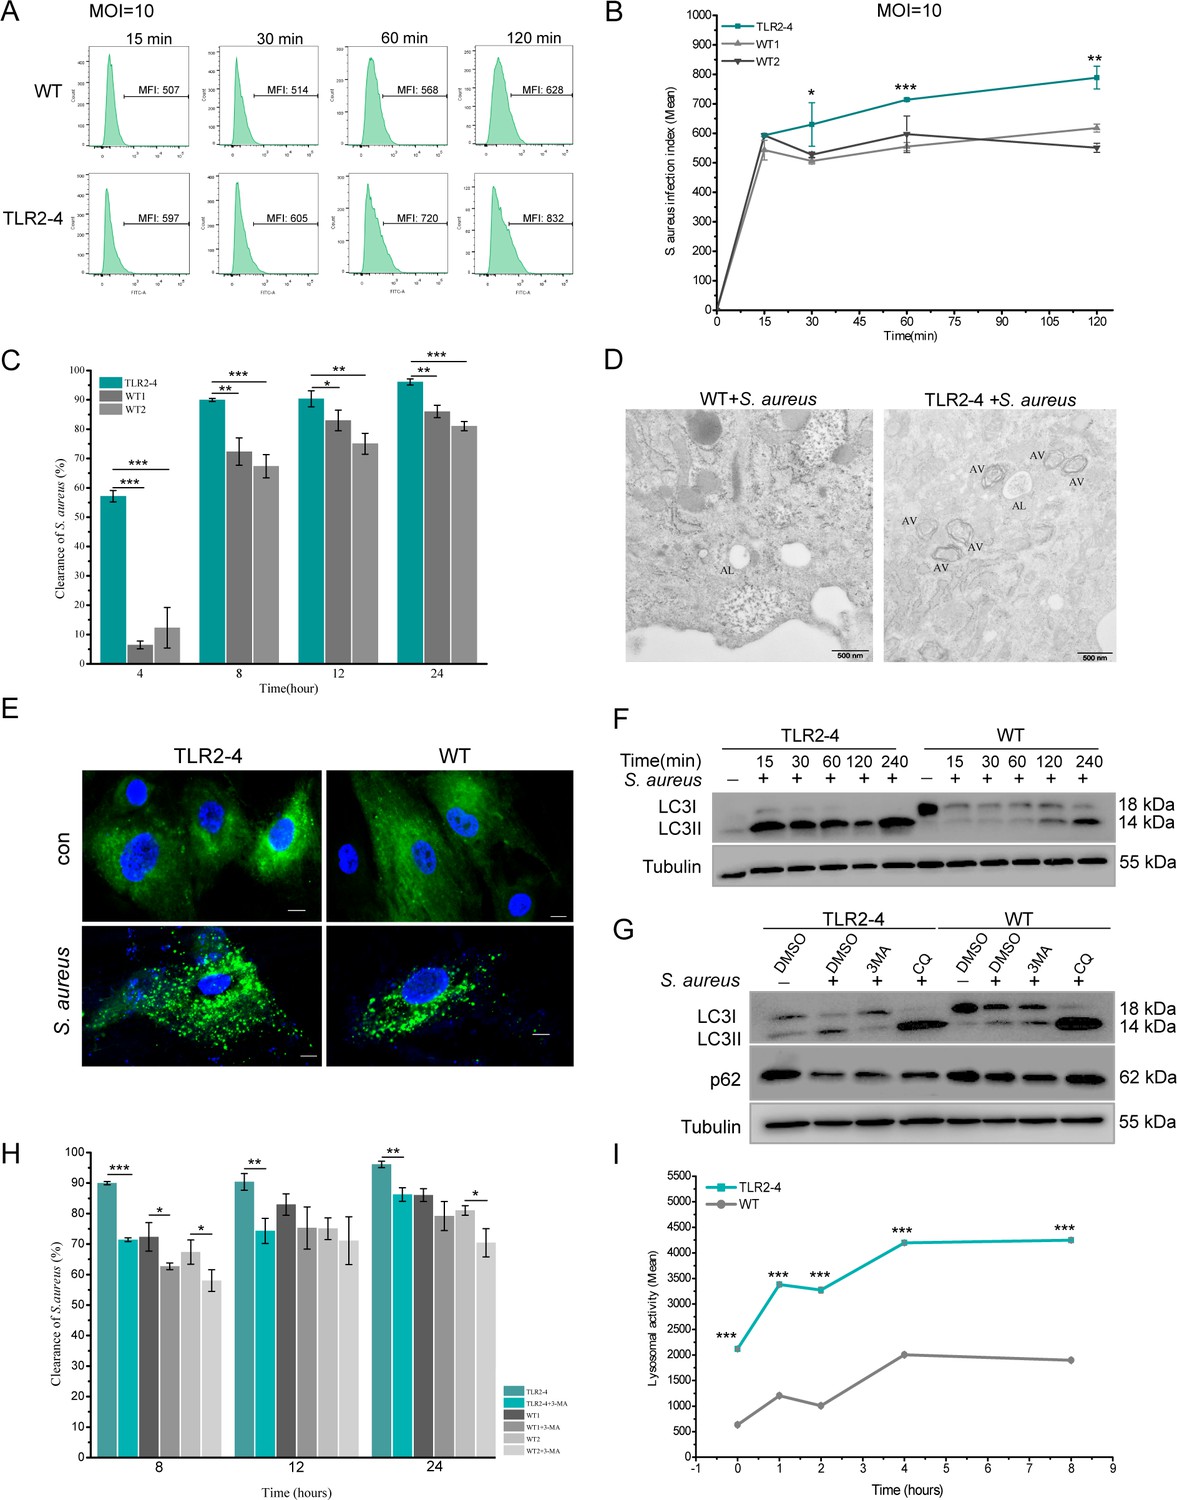
Toll-like receptor 2-4 (TLR2-4) promoted autophagy-dependent elimination of Staphylococcus aureus in macrophages.
(A) S. aureus burden in macrophages was estimated by the mean fluorescence intensity (MFI) of macrophages infected with fluorescein isothiocyanate (FITC)-labeled S. aureus using flow cytometry (multiplicity of infection [MOI] = 10). MFI of FITC in macrophages was calculated by FlowJo software. (B) S. aureus infection index in macrophages was compared according to the results of MFI (n=3 biologically independent samples). (C) The clearance of S. aureus in macrophages was assessed by colony-forming unit (CFU) method. Macrophages were treated with S. aureus (MOI = 10) for 1 hr. After 4, 8, 12, 24 hr, survived S. aureus in macrophages were counted by CFU plating (n=3 biologically independent samples). (D) Macrophages were treated with S. aureus (MOI = 10) for 4 hr. S. aureus-induced autophagy was analyzed by TEM. AV, autophagic vacuole; AL, autophagolysosome. Scale bar: 500 nm. (E) LC3-punctas in macrophages were detected after S. aureus challenge. Macrophages were transfected with pGMLV-GFP-LC3-Puro lentivirus for 48 hr, followed by S. aureus treatment for 4 hr (MOI = 10). Nucleus and S. aureus: blue (DAPI staining); scale bar: 10 μm. (F) Macrophages were stimulated with S. aureus at the MOI of 10. The conversion of LC3I to LC3II in S. aureus-infected macrophages was analyzed by Western blot. (G) The effect of autophagy inhibitor on the level of LC3II and p62 in S. aureus-infected macrophages. Macrophages were pretreated with DMSO (0.1%), 3-methyladenine (3MA) (20 mM), or chloroquine (CQ) (30 μM) for 12 hr, and subsequently treated with S. aureus (MOI = 10) for 4 hr. (H) Macrophages were pretreated with either DMSO or 3MA for 12 hr, and then stimulated with S. aureus (MOI = 10) for 1 hr. After 8, 12, 24 hr, survived S. aureus in macrophages were counted by CFU plating (n=3 biologically independent samples). (I) The lysosomal intracellular activity of macrophages was tested by flow cytometry. Macrophages were challenged with S. aureus for 1 hr (MOI = 10). After washing three times with PBS, cells were cultured in DMEM medium containing gentamicin for 0, 1, 2, 4, 8 hr. Cells were collected to measure lysosomal activity by Lysosomal Intracellular Activity Assay Kit (n=3 biologically independent samples). Data are means ± SD. Student’s t tests were used for comparisons between two groups. ***p<0.001, **p<0.01, *p<0.05. Exact p-values are provided in Supplementary file 1.
-
Figure 3—source data 1
The original blots of Figure 3F.
- https://cdn.elifesciences.org/articles/78044/elife-78044-fig3-data1-v1.zip
-
Figure 3—source data 2
The original blots of Figure 3G.
- https://cdn.elifesciences.org/articles/78044/elife-78044-fig3-data2-v1.zip
Figure 4 with 1 supplement
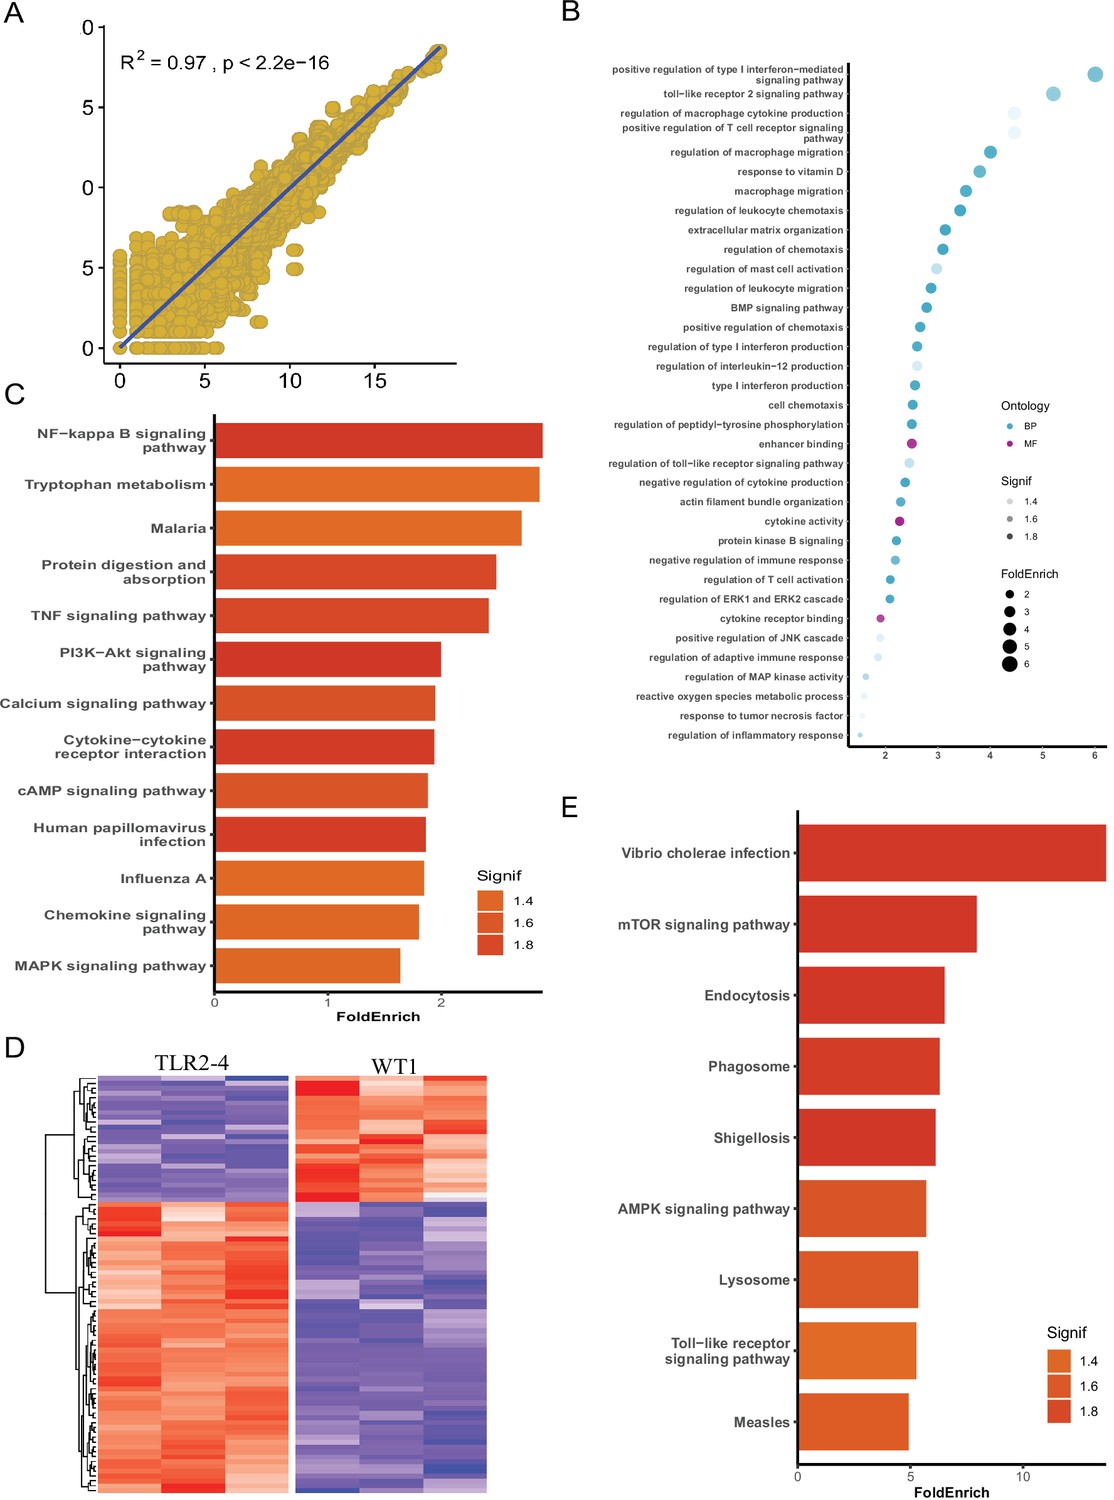
Identification of autophagy-related genes involved in clearance of Staphylococcus aureus in transgenic macrophages.
Macrophages from the Toll-like receptor 2-4 (TLR2-4) and two wild-type goats (WT1, WT2) were infected with S. aureus for 1 hr (multiplicity of infection [MOI] = 10), and then after washing three times with PBS, were cultured in DMEM containing gentamicin (200 μg/ml) for 1 hr. Subsequently, total RNA of macrophages was extracted to perform RNA-seq when macrophages were cultured with DMEM containing gentamicin (25 μg/ml) for 8 hr. (A) Spearsman’s correlation coefficient were calculated between the two wild-type macrophages on the basis of total transcripts. (B) Gene Ontology (GO) enrichment terms of differentially expressed genes (DEGs). (C) The enriched Kyoto Encyclopedia of Genes and Genomes (KEGG) pathways of DEGs. (D) Heatmap of 195 DEGs related to autophagy. (E) KEGG analysis of DEGs related to autophagy.
Figure 4—figure supplement 1
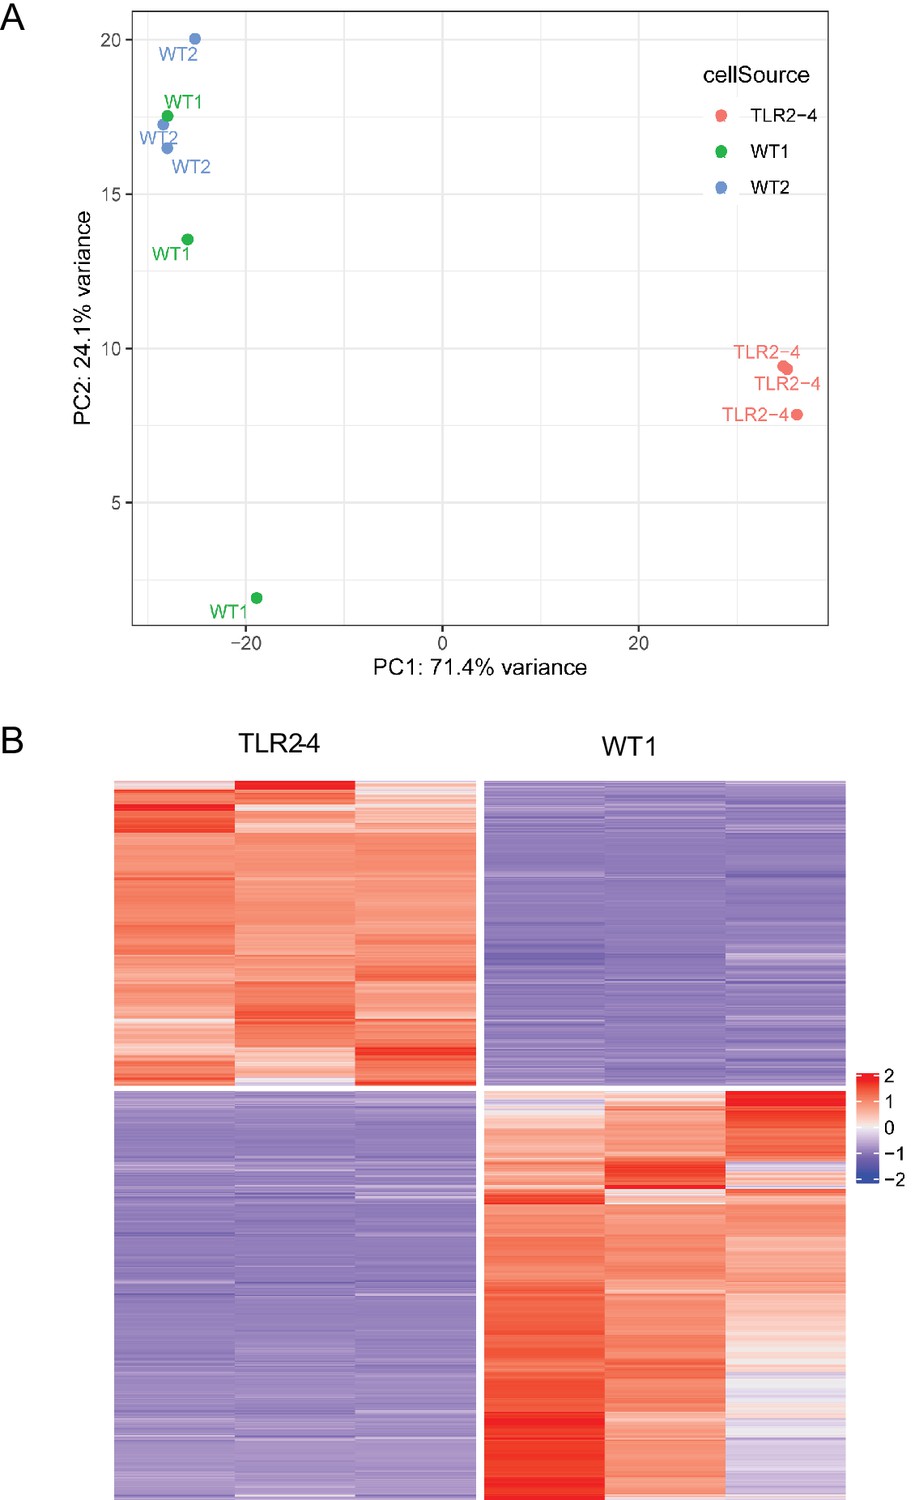
The principal component analysis (PCA) between two wild-type (WT) macrophages and the heatmap of the differentially expressed genes (DEGs) between TLR2-4 and WT macrophages after S. aureus infection.
RNA sequencing of S. aureus infected TLR2-4 and WT macrophages. Macrophages were infected with S. aureus for 1 hr (multiplicity of infection [MOI] = 10). Cells were washed three times using PBS, and cultured in DMEM medium containing gentamicin for 8 hr. Total RNA was extracted and carried out RNA sequencing. (A) The PCA algorithm in two groups (each group was three repeats) of transcripts was performed by R package to test whether the clustering was reliable. (B) Heatmap presented the screened 1310 DEGs between TLR2-4 and WT macrophages.
Figure 5 with 1 supplement

Toll-like receptor (TLR2-4) enhanced Staphylococcus aureus-induced autophagy via activating JNK/ERK signaling.
(A) The change in phosphorylation of JNK, ERK, and p38 in S. aureus-infected macrophages. Macrophages were pretreated with DMSO (carrier), Takinib (200 μM), or Amlexanox (100 μM) for 12 hr, then stimulated with S. aureus for 4 hr. Phosphorylation of JNK, ERK, and p38 was observed by Western blot. (B) The level of LC3-II was detected in macrophages after S. aureus challenge. Macrophages were pretreated with DMSO, Dynasore (50 μM), SP600125 (200 μM), PD98059 (200 μM), SB203580 (200 μM), or Amlexanox for 12 hr, respectively, then treated with S. aureus (multiplicity of infection [MOI] = 10) for 4 hr. Conversion of LC3-I to LC3-II was monitored by Western blot. GAPDH protein was used as a control. (C) The effect activating JNK and ERK1/2 on removal of S. aureus in macrophages. Macrophages were treated with DMSO, SP600125, or PD98059 for 12 hr prior to stimulation with fluorescein isothiocyanate (FITC)-labeled S. aureus (MOI = 10) for 4 hr. The mean fluorescence intensity (MFI) of FITC in macrophages was measured by flow cytometry. (D) The expression of TFEB and OPTN was analyzed in macrophages by Western blot. Macrophages were pretreated with DMSO, Dynasore, or Amlexanox for 12 hr, then challenged with S. aureus for 4 hr (MOI = 10). The nucleoprotein was extracted and analyzed by Western blotting to detect the translocation of TFEB. The expression of OPTN was detected by Western blot. LMNB2 and GAPDH were used to normalize samples.
-
Figure 5—source data 1
The original blots of Figure 5A, B and D.
- https://cdn.elifesciences.org/articles/78044/elife-78044-fig5-data1-v1.zip
-
Figure 5—source data 2
The original blots of Figure 5A,B,D.
- https://cdn.elifesciences.org/articles/78044/elife-78044-fig5-data2-v1.zip
-
Figure 5—source data 3
The original blots of Figure 5A,B,D.
- https://cdn.elifesciences.org/articles/78044/elife-78044-fig5-data3-v1.zip
Figure 5—figure supplement 1
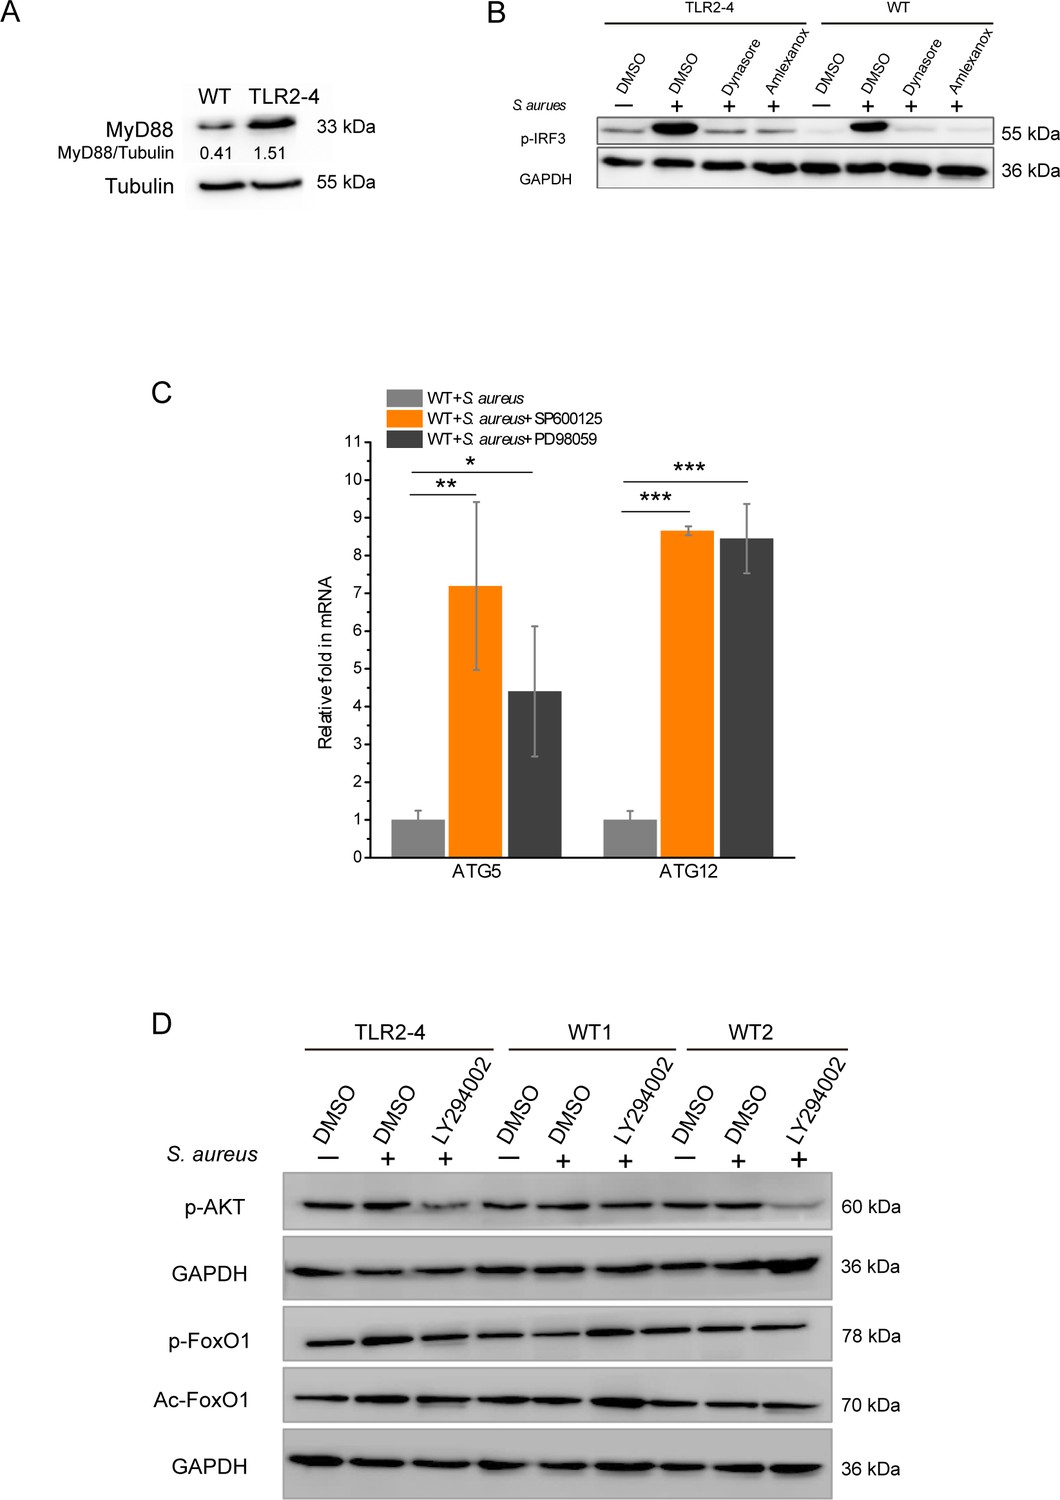
The phosphorylation of IRF3 was detected by Western blotting in Staphylococcus aureus-infected Toll-like receptor 2-4 (TLR2-4) macrophages.
Signaling pathways involved in S. aureus-infected TLR2-4 macrophages. (A) The protein level of MyD88 in macrophages was detected by Western blot. Tubulin was used to normalize the data of each sample. (B) Macrophages were pretreated with DMSO (0.1%), Dynasore (50 μM), or Amlexanox (100 μM) for 12 hr, and then stimulated with S. aureus for additional 4 hr. The phosphorylation of IRF3 was analyzed by Western blot. (C) Wild-type (WT) macrophages were pretreated with DMSO, SP600125 (200 μM), or PD98059 (200 μM) for 12 hr, and challenged with S. aureus for 4 hr. The mRNA expression of ATG5 and ATG12 was monitored by real-time reverse transcription PCR (qRT-PCR) (n=3 biologically independent samples). (D) The activation of AKT-FoxO1 pathways in macrophages was evaluated by Western blot. Cells were treated with either DMSO or LY294002 (100 μM) for 12 hr prior to stimulation with S. aureus (multiplicity of infection [MOI] = 10) for 4 hr. Phosphorylation of AKT and forkhead box transcription factor O1 (FoxO1) and the acetylation of FoxO1 was monitored by Western blot. Data are means ± SD. Student’s t tests were used for comparisons between two groups. ***p<0.001, **p<0.01, *p<0.05. Exact p-values are provided in Supplementary file 1.
-
Figure 5—figure supplement 1—source data 1
The original blots of Figure 5—figure supplement 1A.
- https://cdn.elifesciences.org/articles/78044/elife-78044-fig5-figsupp1-data1-v1.zip
-
Figure 5—figure supplement 1—source data 2
The original blots of Figure 5—figure supplement 1B.
- https://cdn.elifesciences.org/articles/78044/elife-78044-fig5-figsupp1-data2-v1.zip
-
Figure 5—figure supplement 1—source data 3
The original blots of Figure 5—figure supplement 1D.
- https://cdn.elifesciences.org/articles/78044/elife-78044-fig5-figsupp1-data3-v1.zip
Figure 6
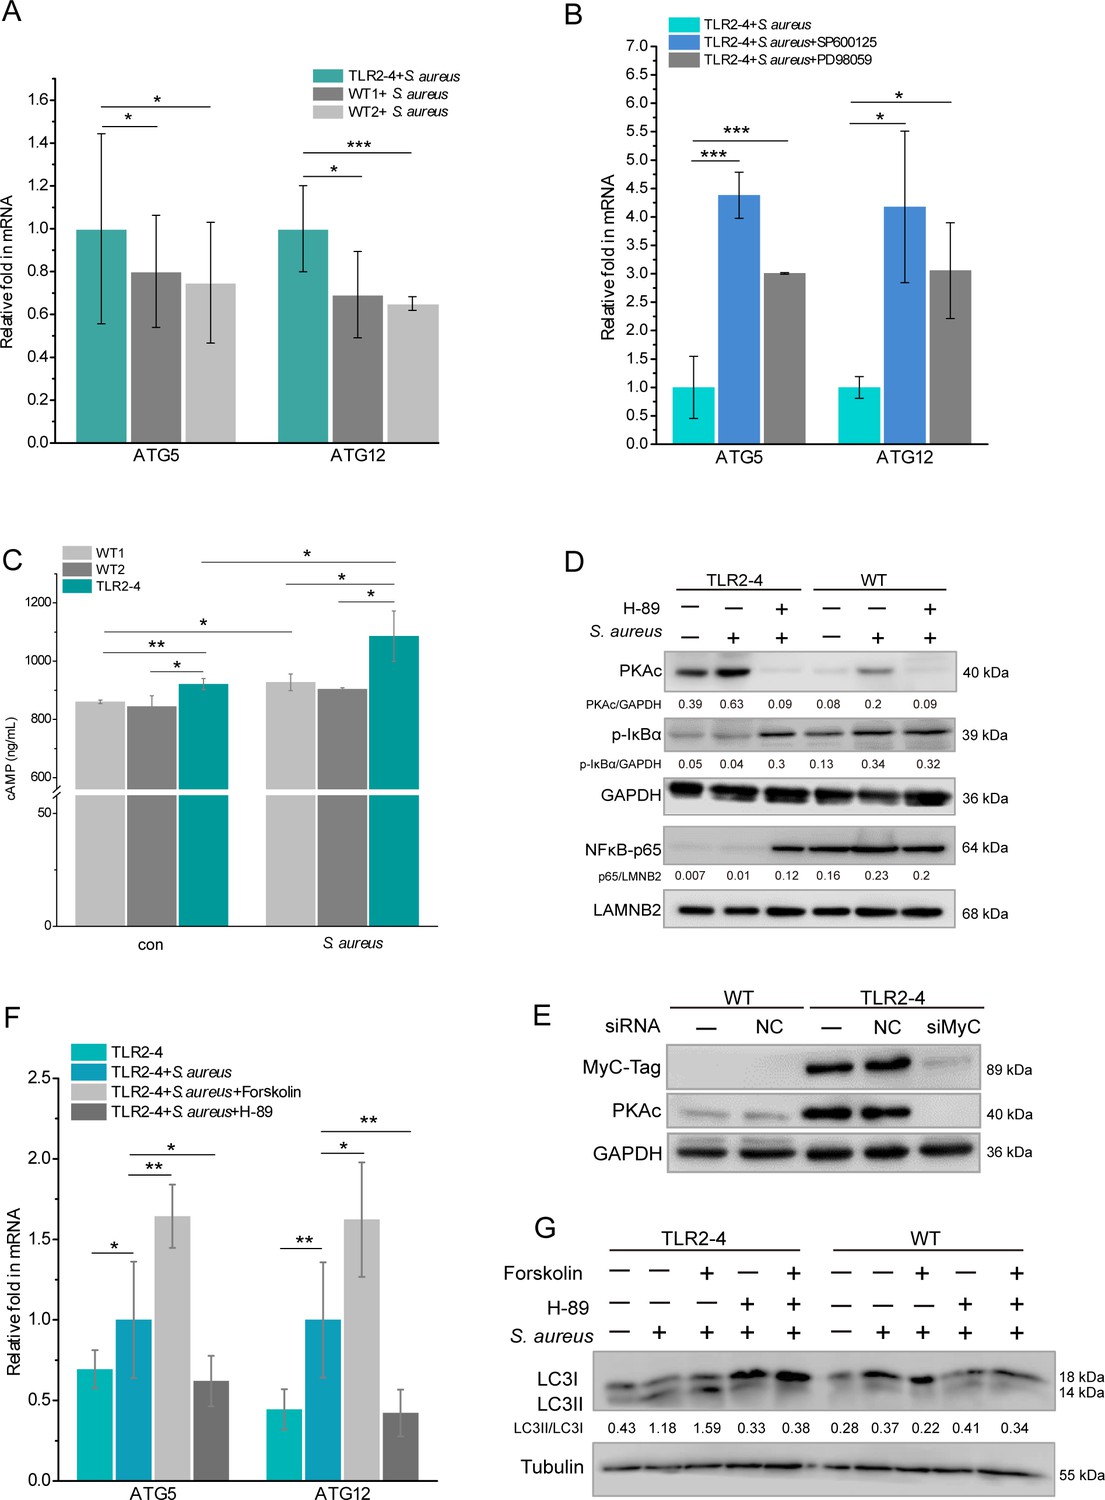
Toll-like receptor 2-4 (TLR2-4) induced autophagy flux through the cyclic adenosine phosphate (cAMP) pathway in Staphylococcus aureus-infected macrophages.
(A) TLR2-4 promoted the expression of ATG5 and ATG12 in macrophages after S. aureus infection. The mRNA relative expression of ATG5 and ATG12 was monitored by real-time reverse transcription PCR (qRT-PCR) when macrophages were stimulated with S. aureus (multiplicity of infection [MOI] = 10) for 4 hr (n=3 biologically independent samples). (B) Inhibiting JNK or ERK1/2 increased the mRNA level of ATG5 and ATG12 in TLR2-4 macrophages. TLR2-4 macrophages were pretreated with DMSO, SP600125 (200 mM), or PD98059 (200 mM) for 12 hr, and infected with S. aureus (MOI = 10) for 4 hr. qRT-PCR was performed to monitor the expression of ATG5 and ATG12 (n=3 biologically independent samples). (C) The levels of cytosolic cAMP were tested by enzyme-linked immunosorbent assay (ELISA) in macrophages. Macrophages were infected with S. aureus (MOI = 10) for 4 hr, and cytosolic cAMP was measured by ELISA kit. Con: un-treated cells (n=3 biologically independent samples). (D) The activation of PKA-NF-kB pathway was analyzed by Western blot (WB) in macrophages. After 12 hr pretreatment with either DMSO or H-89 (30 mM), macrophages were challenged for 4 hr with S. aureus (MOI = 10). The phosphorylation of IkB-a and the nuclear translocation of NF-kB p65 were analyzed by WB. (E) TLR2-4 macrophages were transfected with MyC-tag small interfering RNA (siRNA) or the negative control siRNA to knock down TLR2-4 expression. The expression of PKAc was analyzed by WB. (F) The effect of cAMP-PKA pathway on expression of ATG5 and ATG12 in TLR2-4 macrophages. Macrophages were incubated with DMSO, Forskolin (50 mM), or H-89 for 12 hr and then infected with S. aureus for 4 hr. The mRNA level of ATG5 and ATG12 were detected by qRT-PCR (n=3 biologically independent samples). (G) The effect of cAMP-PKA pathway on the level of LC3-II in macrophages. Macrophages were incubated with DMSO, Forskolin or/and, H-89 for 12 hr and then infected with S. aureus for 4 hr. The conversion of LC3-I to LC3-II were checked by WB. Data are means ± SD. Student’s t tests were used for comparisons between two groups. ***p<0.001, **p<0.01, *p<0.05. Exact p-values are provided in Supplementary file 1.
-
Figure 6—source data 1
The original blots of Figure 6D, E and G.
- https://cdn.elifesciences.org/articles/78044/elife-78044-fig6-data1-v1.zip
-
Figure 6—source data 2
The original blots of Figure 6D,E,G.
- https://cdn.elifesciences.org/articles/78044/elife-78044-fig6-data2-v1.zip
-
Figure 6—source data 3
The original blots of Figure 6D,E,G.
- https://cdn.elifesciences.org/articles/78044/elife-78044-fig6-data3-v1.zip
Figure 7
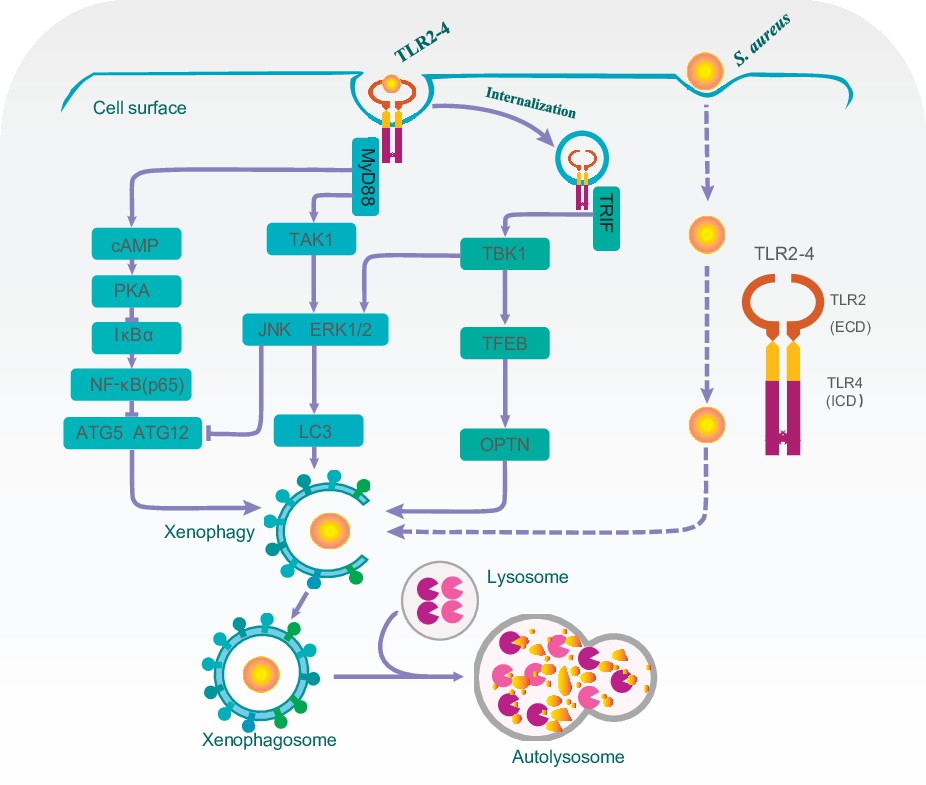
A proposed model for Toll-like receptor 2-4 (TLR2-4) enhancing autophagy-dependent clearance of Staphylococcus aureus.
Upon S. aureus stimulation, TLR2-4 on the surface of macrophages augmented LC3-promoted phagophore formation to enhance xenophagy through the MyD88-dependent TAK1-JNK/ERK signaling. Internalized TLR2-4 up-regulated the autophagy receptor OPTN to promote xenophagy by activating TRIF-dependent TBK1-TFEB signaling. Meanwhile, TLR2-4 heightened the level of ATG5 and ATG12 to increased S. aureus-induced autophagy via cAMP-PKA signaling inhibiting the activity of NF-κB. Consequently, TLR2-4 enhanced the autophagy-dependent elimination of S. aureus in goat macrophages via three signaling pathways, including TAK1/TBK1-JNK/ERK, TBK1-TFEB-OPTN, and cAMP-PKA-NF-κB-ATGs.
Tables
Key resources table
| Reagent type (species) or resource | Designation | Source or reference | Identifiers | Additional information |
|---|---|---|---|---|
| Gene (Capra hircus) | TLR2 | GenBank | NC_030824.1 | |
| Gene (Capra hircus) | TLR4 | GenBank | NC_030815.1 | |
| Strain, strain background (Staphylococcus aureus) | ATCC29213 | GenBank | U77328 | Bacteria cells |
| Transfected construct | PX458 (pSpCas9(BB)–2A-GFP) | Addgene | RRID: Addgene_48138 | PMID:24157548 |
| Transfected construct | pRosa26-promoter | Addgene | RRID: Addgene_21710 | PMID:9108056 |
| Transfected construct (Capra hircus) | siRNA to endogenous TLR2 | GenePharma | Sense: 5’-GCACUUCAACCCUCCCUUUTT-3’ | Antisense: 5’-AAAGGGAGGGUUGAAGUGCTT-3’ |
| Sequence-based reagent | siRNA: nontargetin control | GenePharma | Silencer Select | |
| Antibody | nti-MyC (Mouse monoclonal) | Proteintech | Cat# 60003–2-lg RRID: AB_2883088 | IF (1:100), WB (1:1000) |
| Antibody | Anti-NF-kB p65 antibody (Rabbit polyclonal) | Abcam | Cat# ab16502 RRID: AB_443394 | WB (1:1000) |
| Antibody | Anti-LMNB2 (Rabbit polyclonal) | Beyotime | Cat#: AF0219 | WB (1:1000) |
| Antibody | Phospho-p44/42 MAPK (Rabbit polyclonal) | CST | Cat#: 9,101 RRID: AB_331646 | WB (1:1000) |
| Antibody | Phospho-JNK1/2/3-T183/T183/T221 (Rabbit monoclonal) | ABclonal | Cat#: AP0631 RRID: AB_2771232 | WB (1:1000) |
| Antibody | Tubulin (Mouse monoclonal) | Beyotime | Cat#: AT819 | WB (1:1000) |
| Antibody | Anti-LC3 (Rabbit polyclonal) | Proteintech | Cat#: 14600–1-AP RRID: AB_2137737 | WB (1:1000) |
| Antibody | Anti-SQSTM1/p62 (Rabbit polyclonal) | Affinity | Cat#: AF5384 RRID: AB_2837869 | WB (1:1000) |
| Antibody | Phospho-p38 MAPK-T180 (Rabbit polyclonal) | ABclonal | Cat#: AP0238 RRID: AB_2771307 | WB (1:1000) |
| Antibody | Anti-GAPDH (Rabbit polyclonal) | Sangon Biotech | Cat#: D110016 RRID: AB_2904600 | WB (1:1000) |
| Antibody | Anti-TFEB (Rabbit polyclonal) | Proteintech | Cat#: 13372–1-AP RRID: AB_2199611 | WB (1:1000) |
| Antibody | Anti-Optineurin (Rabbit polyclonal) | Affinity | Cat#: DF6655 RRID: AB_2838617 | WB (1:1000) |
| Antibody | Phospho-pan-AKT1/2/3 (Rabbit polyclonal) | Affinity | Cat#: AF0908 RRID: AB_2834079 | WB (1:1000) |
| Antibody | Phospho-FOXO1A (Rabbit polyclonal) | Affinity | Cat#: AF3416 RRID: AB_2834858 | WB (1:1000) |
| Antibody | Acetyl-FOXO1A (Rabbit polyclonal) | Affinity | Cat#: AF2305 RRID: AB_2845319 | WB (1:1000) |
| Antibody | Anti-PRKACA (Rabbit polyclonal) | ABclonal | Cat#: A0798 RRID: AB_2757400 | WB (1:1000) |
| Antibody | Phospho-IKB alpha (Rabbit monoclonal) | CST | Cat#: 2,859 RRID: AB_561111 | WB (1:1000) |
| Antibody | Phospho-IRF3-S386 (Rabbit polyclonal) | ABclonal | Cat#: AP0857 RRID: AB_2771209 | WB (1:1000) |
| Antibody | Peroxidase-Conjugated Goat anti-Rabbit IgG | ZSGB-BIO | Cat#: ZB-2301 RRID: AB_2747412 | WB (1:5000) |
| Antibody | Peroxidase-Conjugated Goat anti-Mouse IgG | ZSGB-BIO | Cat#: ZB-2305 RRID: AB_2747415 | WB (1:5000) |
| Antibody | Alexa Fluor 594 goat anti-mouse IgG | ThermoFisher Scientific | Cat#: A11005 RRID: AB_2534073 | IF (1 μg/ml) |
| Commercial assay or kit | Nuclear Extraction Kits for Cells | Invent Biotechnologies | Cat#: SC-003 | |
| Chemical compound, drug | Dynasore | MCE | Cat#: HY-15304 | 50 μM |
| Chemical compound, drug | SP600125 | MCE | Cat#: HY-12041 | 200 μM |
| Chemical compound, drug | PD98059 | MCE | Cat#: HY-12028 | 200 μM |
| Chemical compound, drug | Takinib | MCE | Cat#: HY-103490 | 200 μM |
| Chemical compound, drug | Amlexanox | MCE | Cat#: HY-B0713 | 100 μM |
| Software | ImageJ | http://imagej.nih.gov/ij/ | RRID: SCR_003070 | |
| Software | Flowjo | https://www.flowjo.com/solutions/flowjo | RRID: SCR_008520 | |
| Software | Origin | http://www.originlab.com/index.aspx?go=PRODUCTS/Origin | RRID: SCR_014212 | |
| Other | DAPI stain | Solarbio | Cat#: C0065 | 10 μg/ml |
Additional files
-
Supplementary file 1
Quantification and statistical analysis.
- https://cdn.elifesciences.org/articles/78044/elife-78044-supp1-v1.docx
-
Supplementary file 2
The data for generation of clone goat and part primers used in this study.
(A) Table displaying the generation of clone goats by nuclear transfer. (B) Primers of crRNA-oligo. (C) Table displaying the sequences of primers in T7 endonuclease 1 (T7E1) assay. (D) All primers used for PCR. (E) Table displaying the primers for real-time reverse transcription PCR (qRT-PCR).
- https://cdn.elifesciences.org/articles/78044/elife-78044-supp2-v1.docx
-
Transparent reporting form
- https://cdn.elifesciences.org/articles/78044/elife-78044-transrepform1-v1.docx
Download links
A two-part list of links to download the article, or parts of the article, in various formats.
Downloads (link to download the article as PDF)
Open citations (links to open the citations from this article in various online reference manager services)
Cite this article (links to download the citations from this article in formats compatible with various reference manager tools)
Domain fusion TLR2-4 enhances the autophagy-dependent clearance of Staphylococcus aureus in the genetic engineering goat
eLife 11:e78044.
https://doi.org/10.7554/eLife.78044


