The generation of HepG2 transmitochondrial cybrids to reveal the role of mitochondrial genotype in idiosyncratic drug-induced liver injury
- Centre for Drug Safety Science, Department of Pharmacology and Therapeutics, University of Liverpool, United Kingdom
- GSK, BioStatistics, United Kingdom
- GSK, Safety Assessment, United Kingdom
- The Wolfson Centre for Personalised Medicine, Department Pharmacology and Therapeutics, University of Liverpool, United Kingdom
Figures
Figure 1
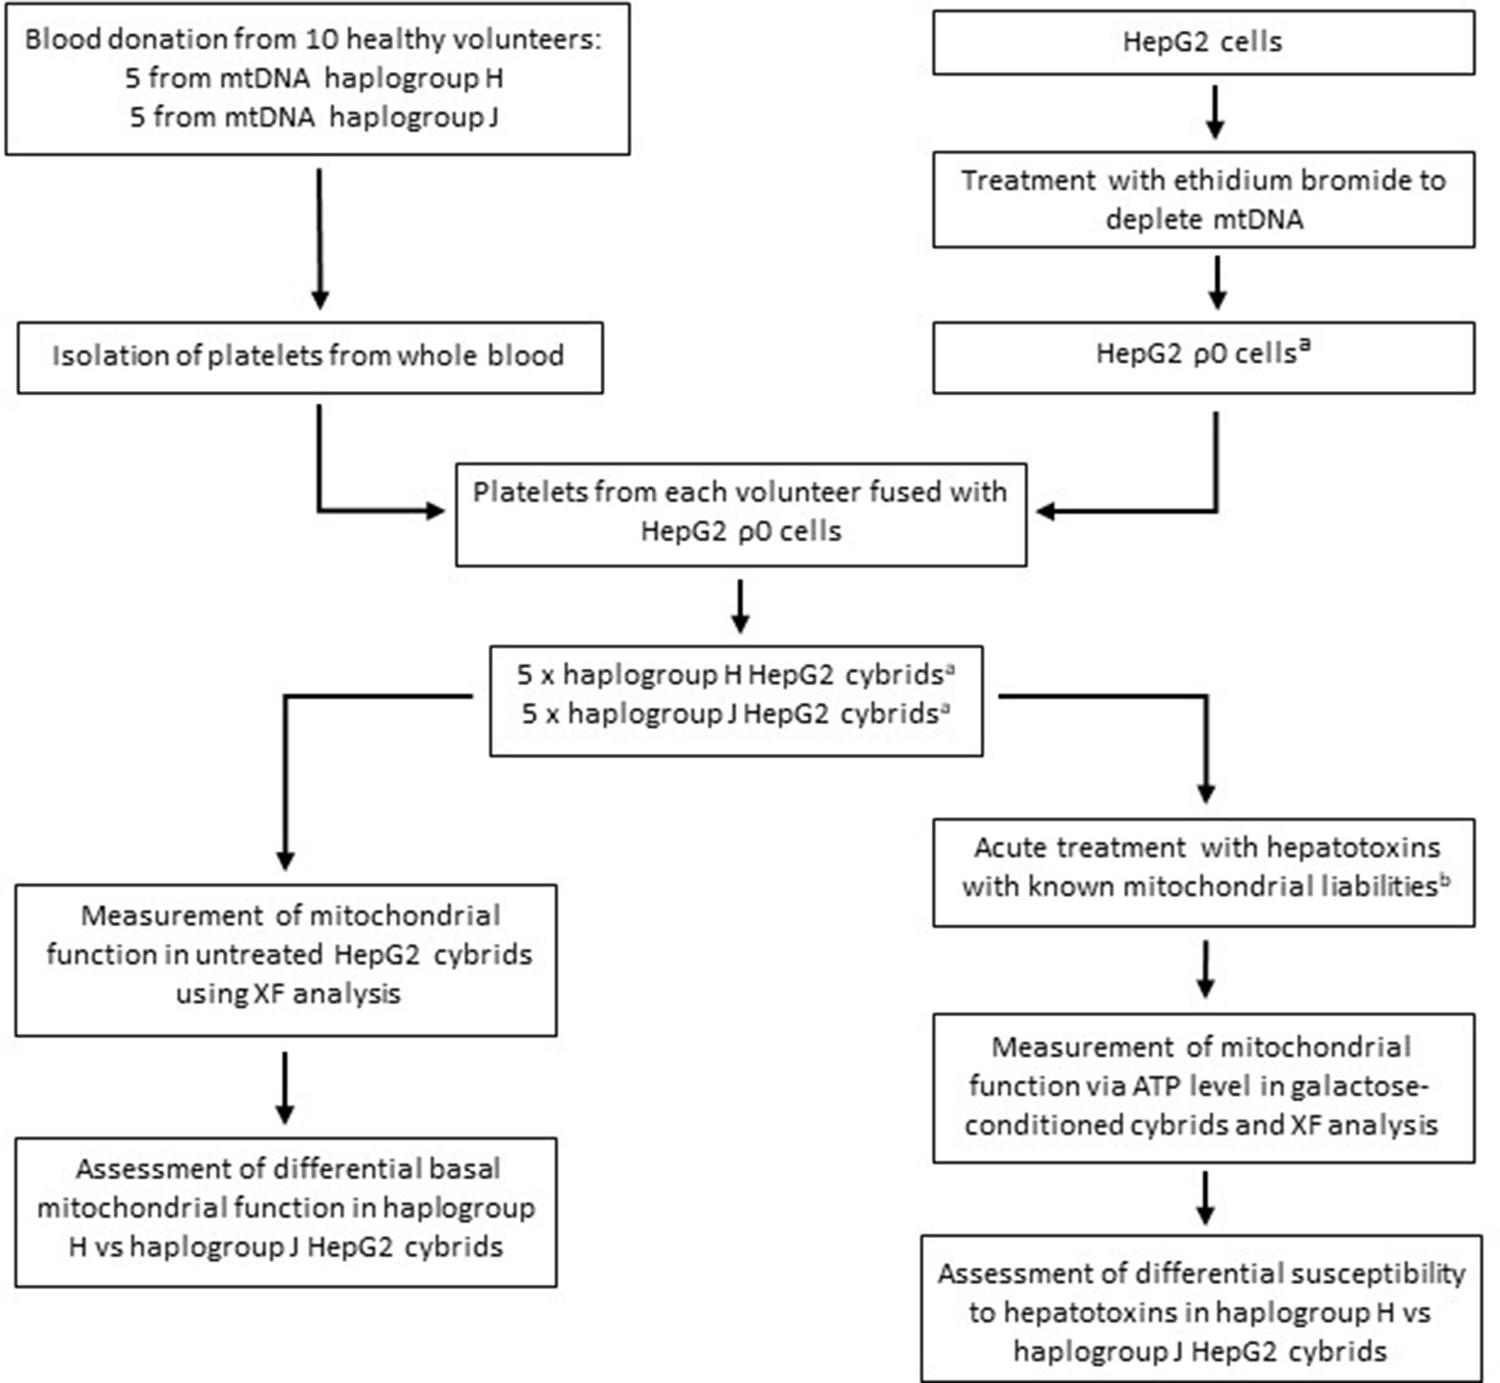
Study overview.
a HepG2 ρ0 cells were characterized to ensure the complete depletion of mtDNA and the expression of mtDNA-encoded proteins was confirmed in the HepG2 cybrids. Methods of characterization are described in the Supplementary information. b Flutamide, 2-hydroxyflutamide, and tolcapone, alongside non-hepatotoxic structural counterparts; bicalutamide and entacapone. Abbreviations: mtDNA, mitochondrial DNA; ρ0, rho zero; XF, extracellular flux.
Figure 2
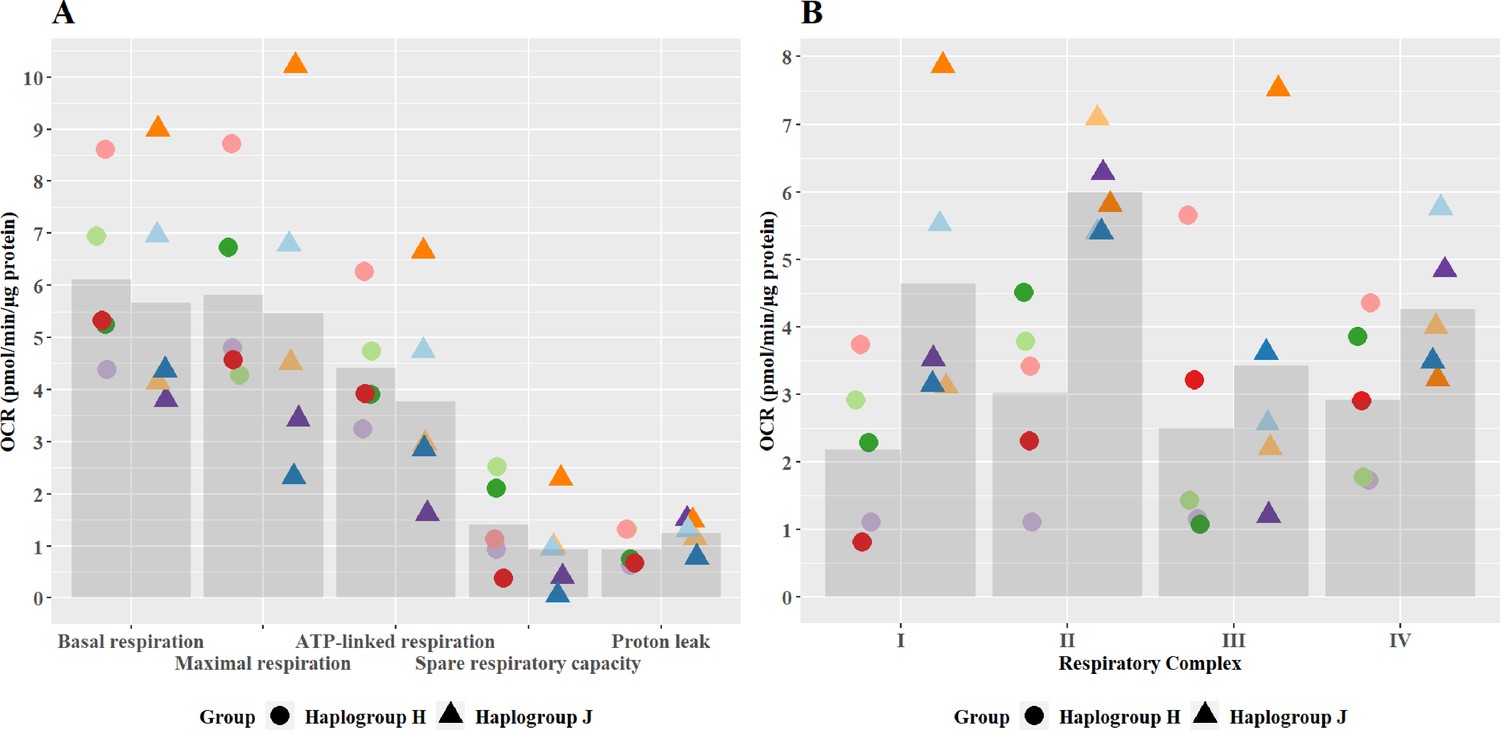
Basal mitochondrial function and respiratory complex activity in haplogroup H and J HepG2 cybrids.
(A) Untreated haplogroup H and J cybrids were assessed using extracellular flux analysis and a mitochondrial stress test to measure: basal respiration, maximal respiration, ATP-linked respiration, spare respiratory capacity, and proton leak. (B) Untreated haplogroup H and J cybrids were assessed using extracellular flux analysis and respiration was stimulated by the supply of respiratory complex-specific substrates. Complex I-IV activity was defined as complex I-IV-driven maximal respiration. Data are presented from five haplogroup H cybrid cell lines and five haplogroup J cell lines (n=5 experiments were performed on each cybrid cell line). Each color point represents a single cybrid cell line. Abbreviations: OCR, oxygen consumption rate. Source data: Figure 2—source data 1 file.xslx. The results of all statistical tests can be viewed in Supplementary file 2 – tab 2a.
-
Figure 2—source data 1
Source data of the basal mitochondrial function and respiratory complex activity of transmitochondrial cybrids displayed in Figure 2.
- https://cdn.elifesciences.org/articles/78187/elife-78187-fig2-data1-v2.xlsx
Figure 3
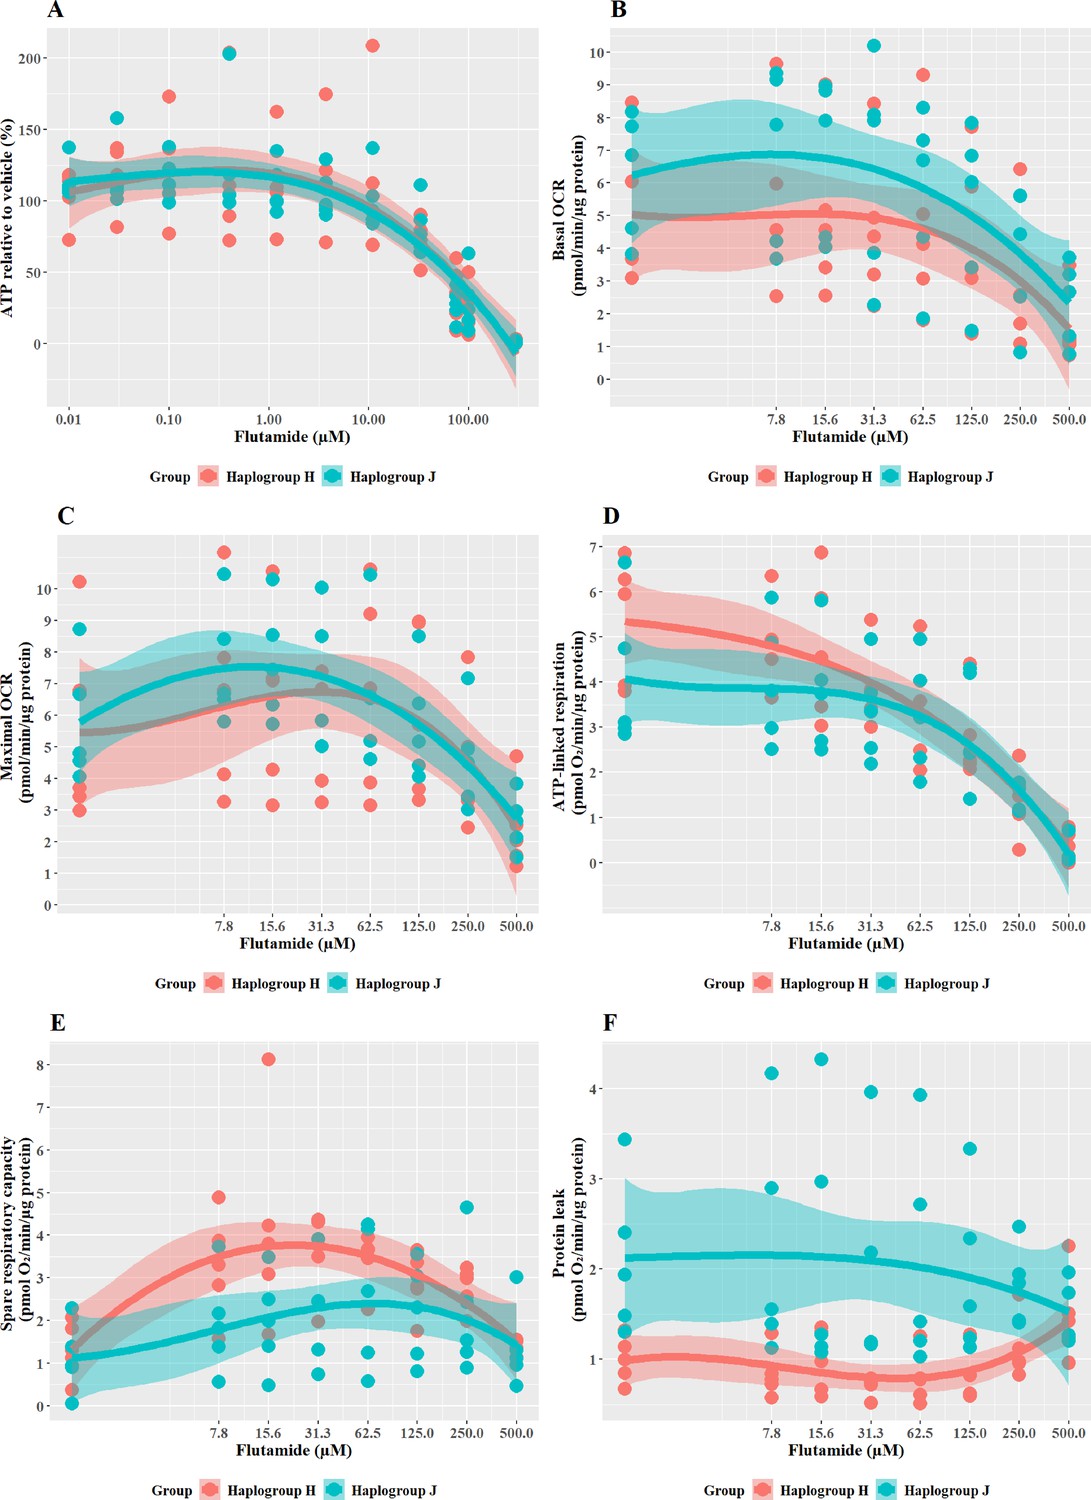
The effect of flutamide on ATP levels and mitochondrial respiratory function in haplogroup H and J HepG2 cybrids.
(A) Cybrids were treated (2 hr) with up to 300 µM flutamide in a galactose medium. ATP values are expressed as a percentage of the vehicle control. (B–F) Changes in basal respiration, maximal respiration, ATP-linked respiration, spare respiratory capacity, and proton leak following acute treatment with flutamide (up to 500 µM). Data are presented from five haplogroup H cybrid cell lines and five haplogroup J cell lines (n=5 experiments were performed on each cybrid cell line). Shaded areas represent a 95% confidence interval of the fitted curve. Abbreviations: OCR, oxygen consumption rate. Source data: Figure 3—source data 1 file.xslx. The results of all statistical tests can be viewed in Supplementary file 2 – tab 2b.
-
Figure 3—source data 1
Source data of the effect of flutamide on ATP levels and mitochondrial respiratory function of cybrids displayed in Figure 3.
- https://cdn.elifesciences.org/articles/78187/elife-78187-fig3-data1-v2.xlsx
Figure 4
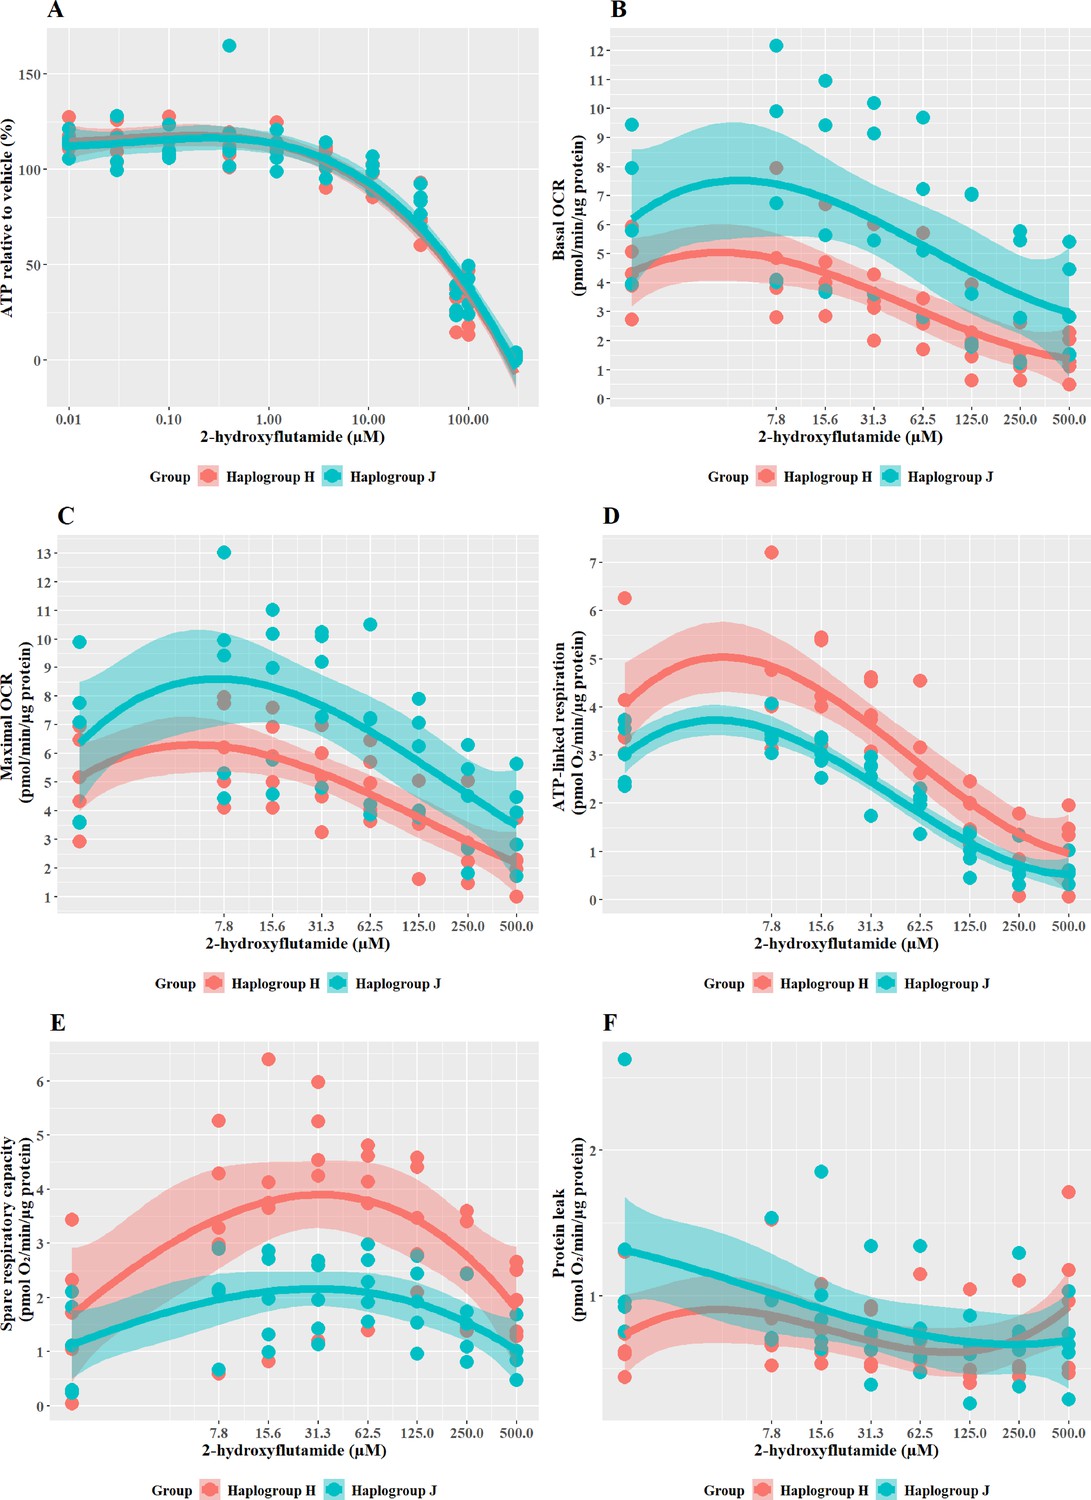
The effect of 2-hydroxyflutamide upon ATP levels and mitochondrial respiratory function in haplogroup H and J HepG2 cybrids.
(A) Cybrids were treated (2 hr) with up to 300 µM 2-hydroxyflutamide in a galactose medium. ATP values are expressed as a percentage of those of the vehicle control. (B–F) Changes in basal respiration, maximal respiration, ATP-linked respiration, spare respiratory capacity, and proton leak following acute treatment with 2-hydroxyflutamide (up to 500 µM). Data are presented from five haplogroup H cybrid cell lines and five haplogroup J cell lines (n=5 independent experiments were performed on each cybrid cell line). Shaded areas represent a 95% confidence interval of the fitted curve. Abbreviations: OCR, oxygen consumption rate. Source data: Figure 4—source data 1 file.xslx. The results of all statistical tests can be viewed in Supplementary file 2 – tab 2c.
-
Figure 4—source data 1
Source data of the effect of 2-hydroxyflutamide on ATP levels and mitochondrial respiratory function of cybrids displayed in Figure 4.
- https://cdn.elifesciences.org/articles/78187/elife-78187-fig4-data1-v2.xlsx
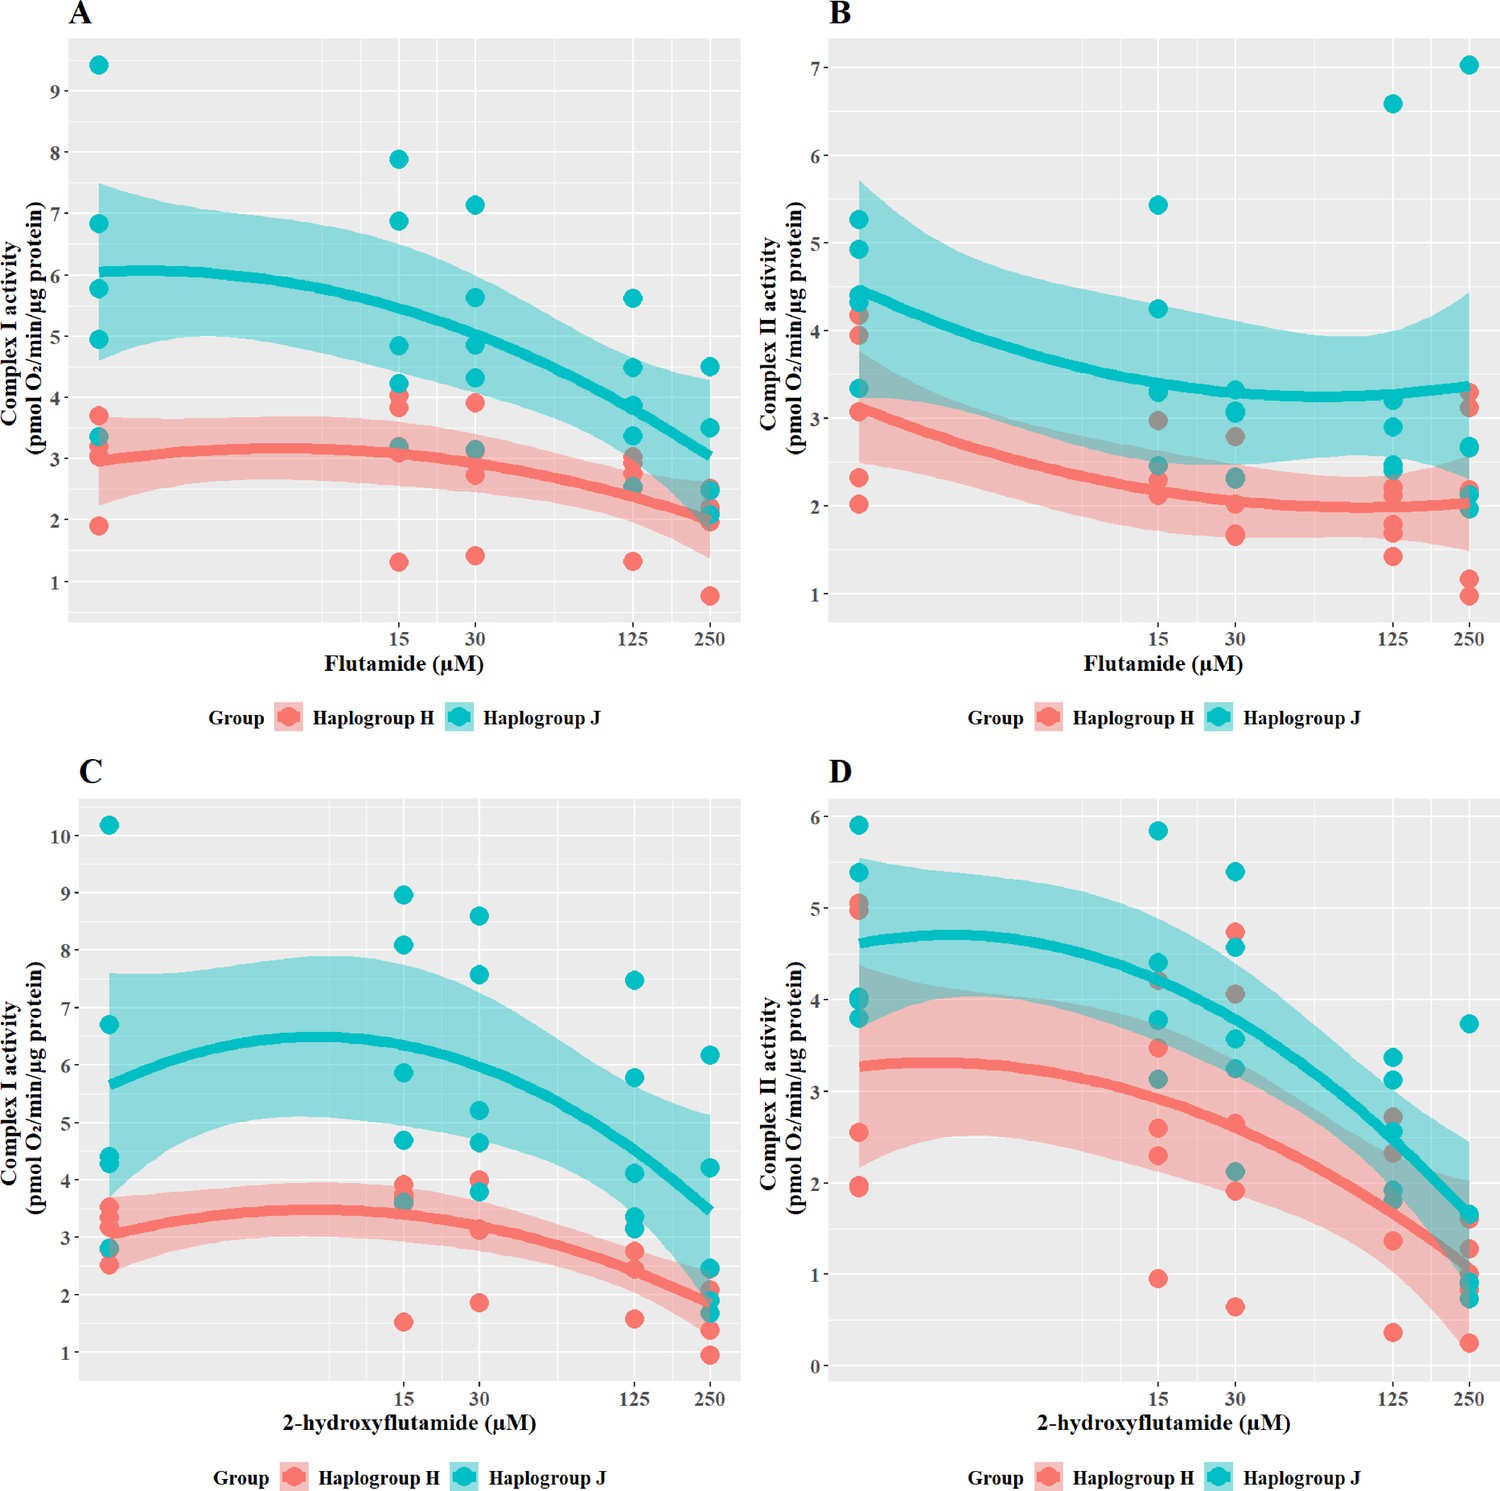
Figure 5
The effect of flutamide and 2-hydroxyflutamide upon respiratory complex I and II in haplogroup H and J HepG2 cybrids.
Permeabilized cybrids were acutely treated with flutamide (A, B) or 2-hydroxyflutamide (C, D) (up to 250 µM) before a mitochondrial stress test using extracellular flux analysis. Complex I/II activity was defined as complex I/II-driven maximal respiration. Data are presented from five haplogroup H cybrid cell lines and five haplogroup J cell lines (n=5 experiments were performed on each cybrid cell line). Shaded areas represent a 95% confidence interval of the fitted curve. Source data: Figure 5—source data 1 file.xslx. The results of all statistical tests can be viewed in Supplementary file 2 – tab 2d.
-
Figure 5—source data 1
Source data of the effect of flutamide and 2-hydroxyflutamide on the activity of respiratory complex I and II in cybrids displayed in Figure 5.
- https://cdn.elifesciences.org/articles/78187/elife-78187-fig5-data1-v2.xlsx
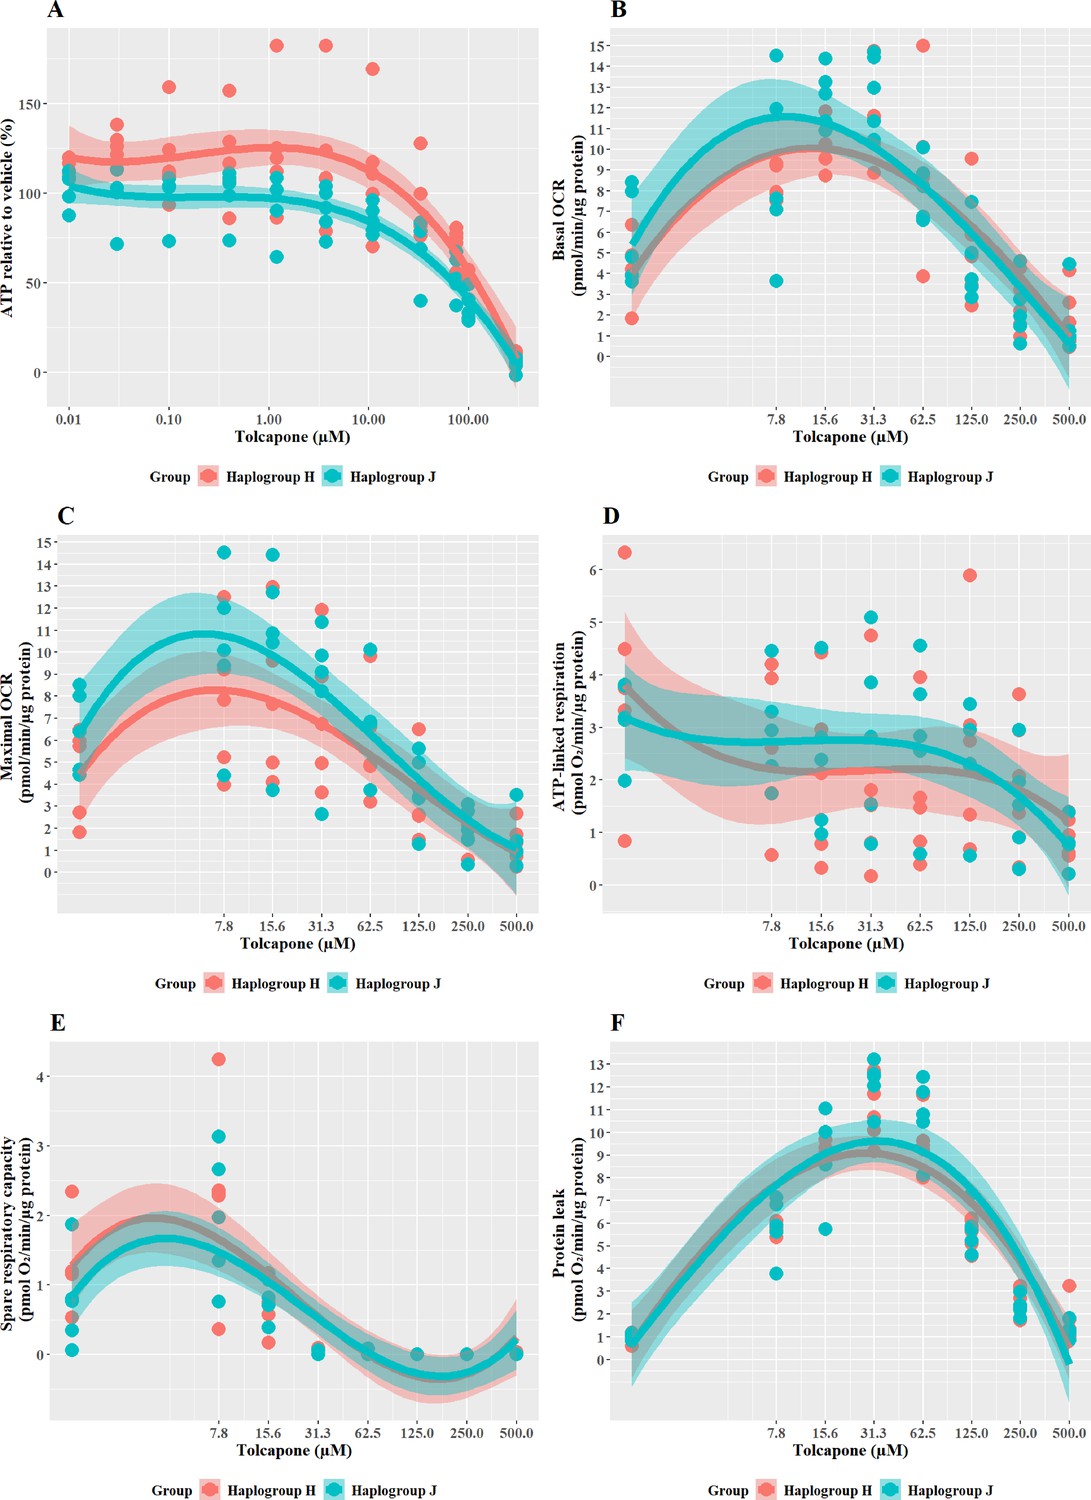
Figure 6
The effect of tolcapone on ATP levels and mitochondrial respiratory function in haplogroup H and J HepG2 cybrids.
(A) Cybrids were treated (2 hr) with up to 500 µM tolcapone in a galactose medium. ATP values are expressed as a percentage of those of the vehicle control. (B–F) Changes in basal respiration, maximal respiration, ATP-linked respiration, spare respiratory capacity, and proton leak following acute treatment with tolcapone (up to 500 µM). Data are presented from five haplogroup H cybrid cell lines and five haplogroup J cell lines (n=5 experiments were performed on each cybrid cell line). Shaded areas represent a 95% confidence interval of the fitted curve Abbreviations: OCR, oxygen consumption rate. Source data: Figure 6—source data 1 file.xslx. The results of all statistical tests can be viewed in Supplementary file 2 – Table 2e.
-
Figure 6—source data 1
Source data of the effect of tolcapone on ATP levels and mitochondrial respiratory function of cybrids displayed in Figure 6.
- https://cdn.elifesciences.org/articles/78187/elife-78187-fig6-data1-v2.xlsx
Figure 7
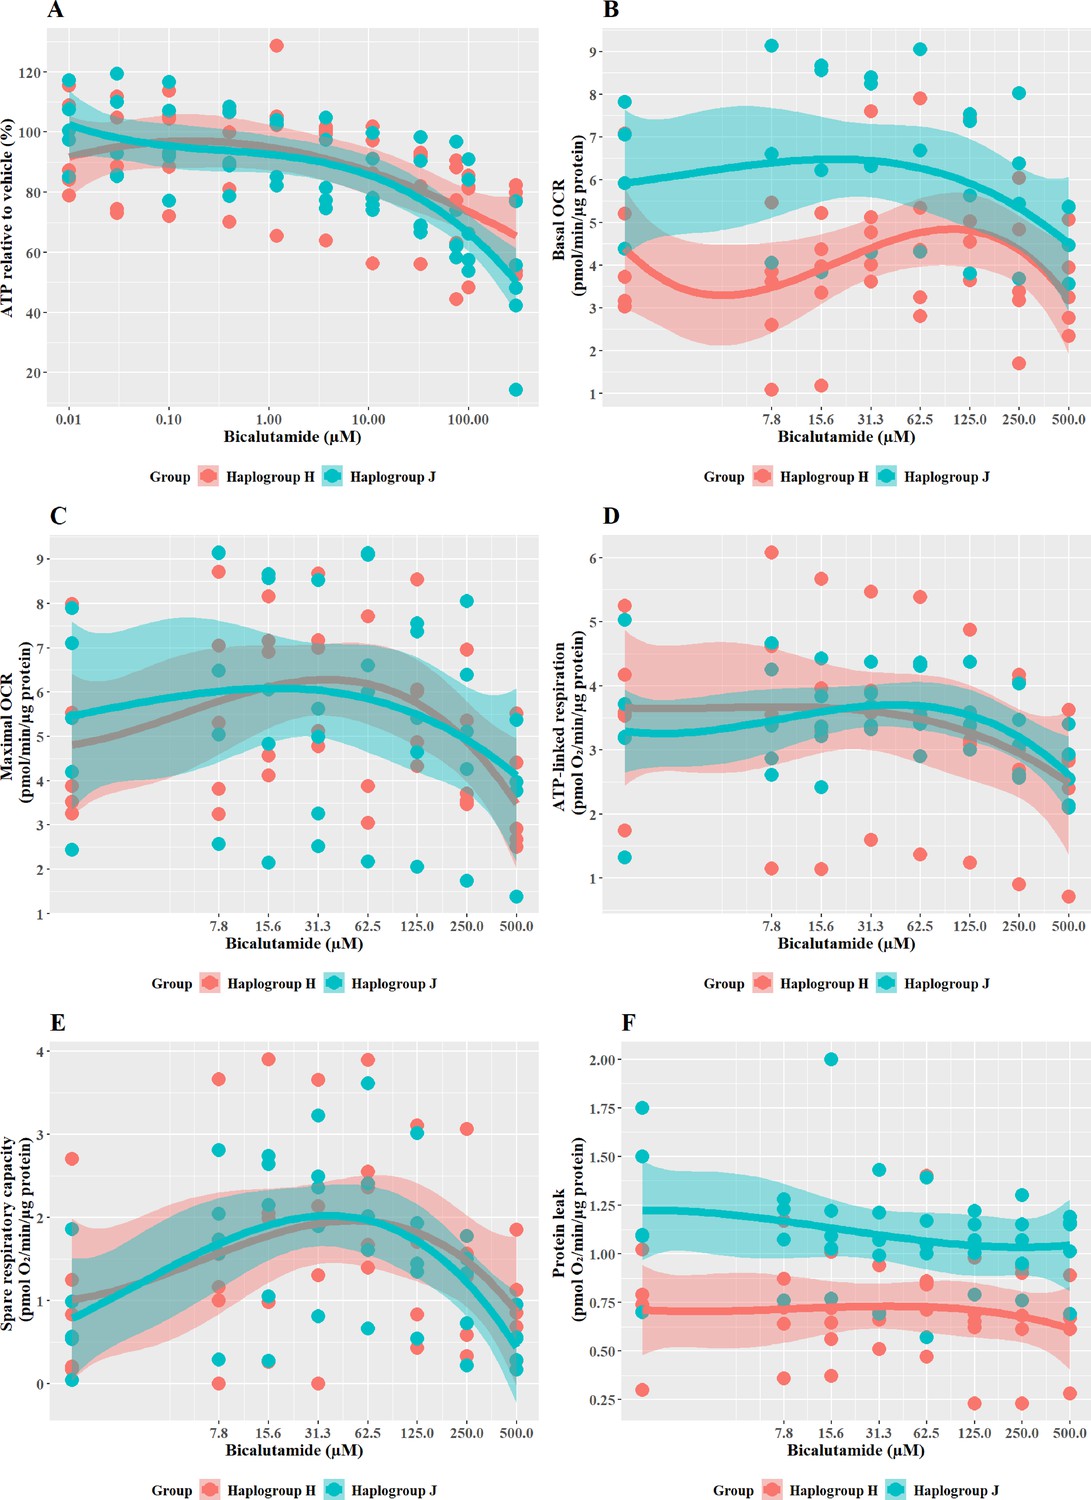
The effect of bicalutamide upon ATP levels and mitochondrial respiratory function in haplogroup H and J HepG2 cybrids.
(A) Cybrids were treated (2 hr) with up to 500 µM bicalutamide in a galactose medium. ATP values are expressed as a percentage of those of the vehicle control. (B–F) Changes in basal respiration, maximal respiration, ATP-linked respiration, spare respiratory capacity, and proton leak following acute treatment with bicalutamide (up to 500 µM). Data are presented fromfive haplogroup H cybrid cell lines and five haplogroup J cell lines (n=5 independent experiments were performed on each cybrid cell line). Shaded areas represent a 95% confidence interval of the fitted curve. Abbreviations: OCR, oxygen consumption rate. Source data: Figure 7—source data 1 file.xslx. The results of all statistical tests can be viewed in Supplementary file 2 – Table 2f.
-
Figure 7—source data 1
Source data of the effect of bicalutamide on ATP levels and mitochondrial respiratory function of cybrids displayed in Figure 7.
- https://cdn.elifesciences.org/articles/78187/elife-78187-fig7-data1-v2.xlsx
Figure 8
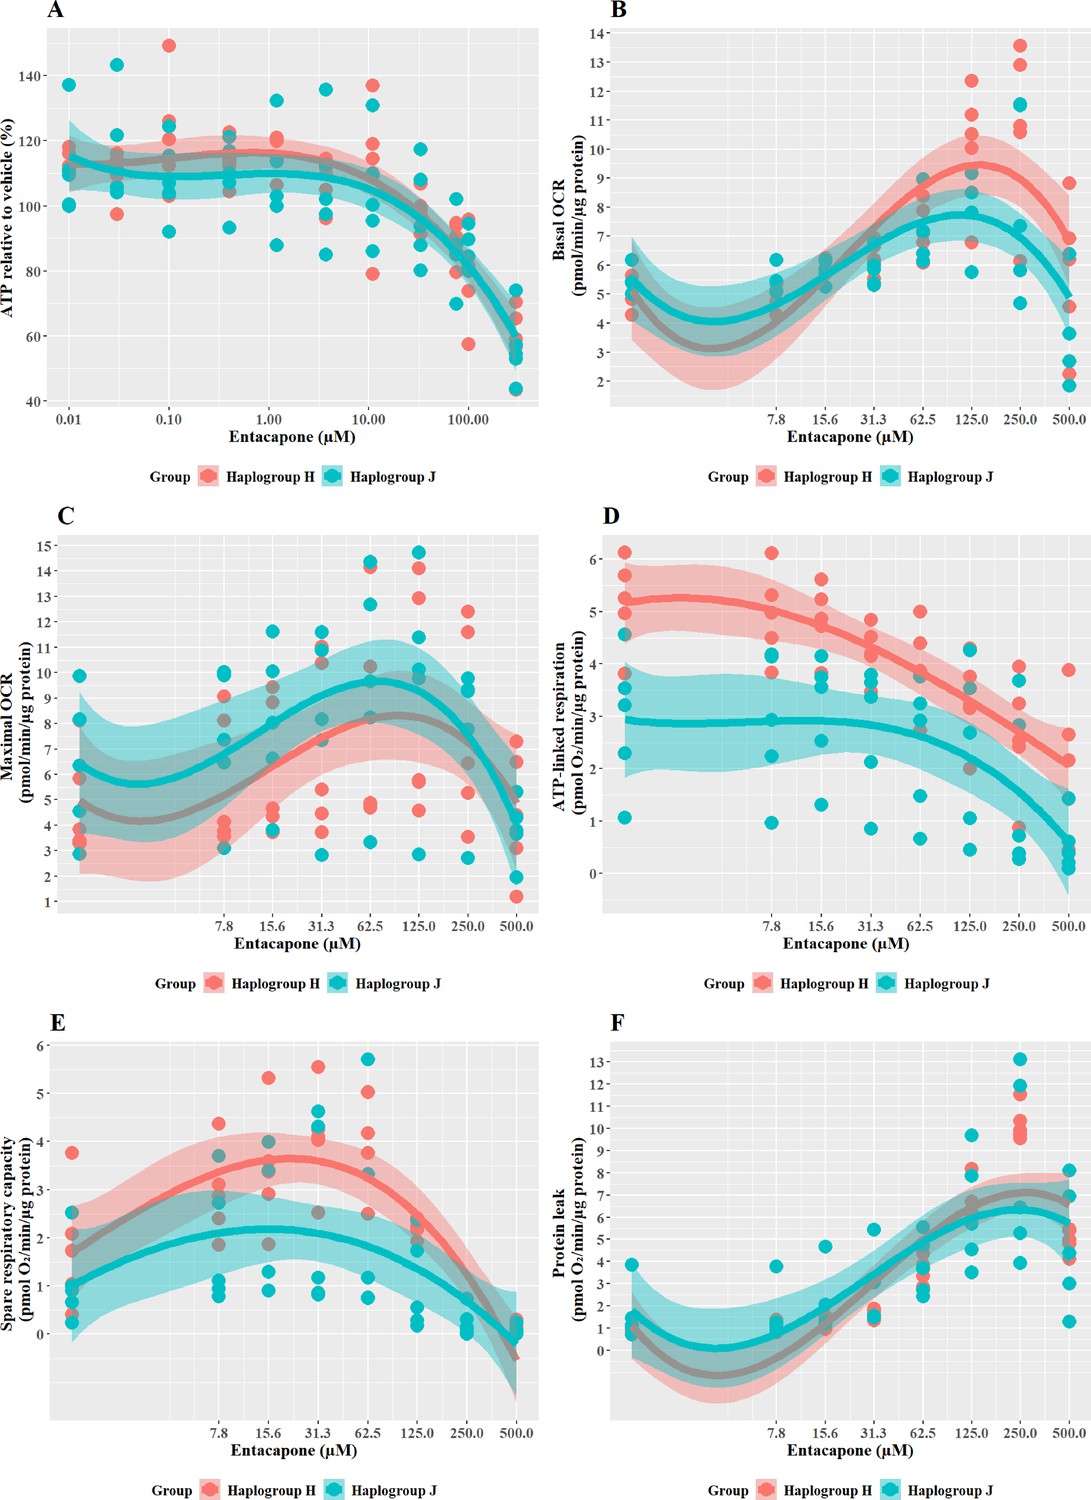
The effect of entacapone upon ATP levels and mitochondrial respiratory function in haplogroup H and J HepG2 transmitochondrial cybrids.
(A) Cybrids were treated (2 hr) with up to 500 µM entacapone in a galactose medium. ATP values are expressed as a percentage of those of the vehicle control. (B–F) Changes in basal respiration, maximal respiration, ATP-linked respiration, spare respiratory capacity, and proton leak following acute treatment with entacapone (up to 500 µM). Data are presented from five haplogroup H cybrid cell lines and five haplogroup J cell lines (n=5 independent experiments were performed on each cybrid cell line). Shaded areas represent a 95% confidence interval of the fitted curve. Abbreviations: OCR, oxygen consumption rate. Source data: Figure 8—source data 1 file.xslx. The results of all statistical tests can be viewed in Supplementary file 2 – tab 2g.
-
Figure 8—source data 1
Source data of the effect of entacapone on ATP levels and mitochondrial respiratory function of cybrids displayed in Figure 8.
- https://cdn.elifesciences.org/articles/78187/elife-78187-fig8-data1-v2.xlsx
Figure 9 with 2 supplements
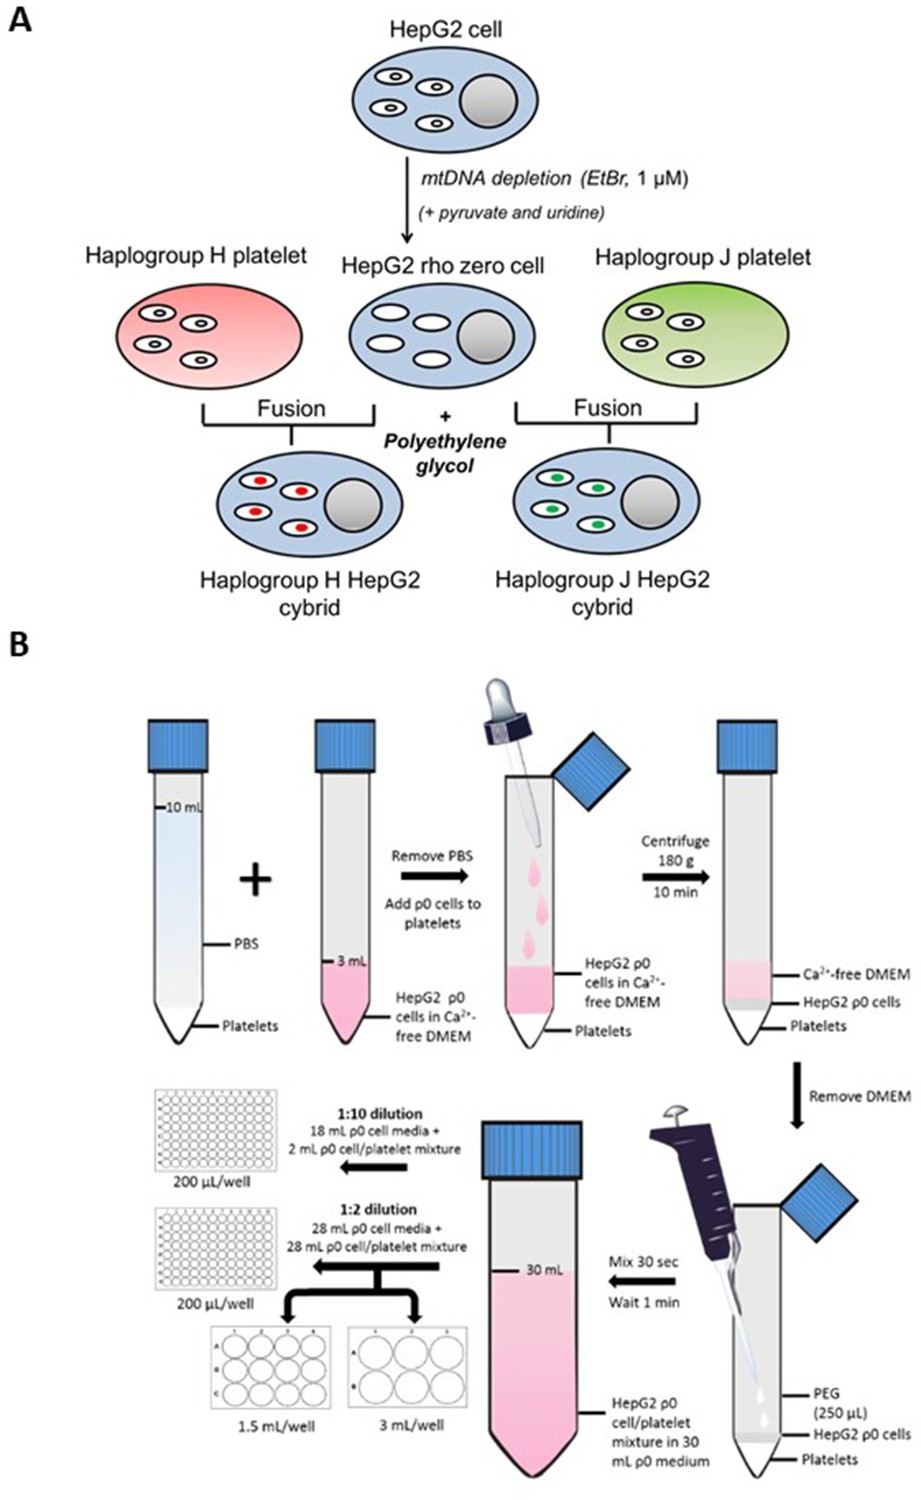
Generation of HepG2 transmitochondrial cybrids.
(A) Schematic overview of HepG2 transmitochondrial cybrid generation. (B) Experimental procedure for the fusion of HepG2 ρ0 cells and platelets to generate HepG2 transmitochondrial cybrids.
Figure 9—figure supplement 1
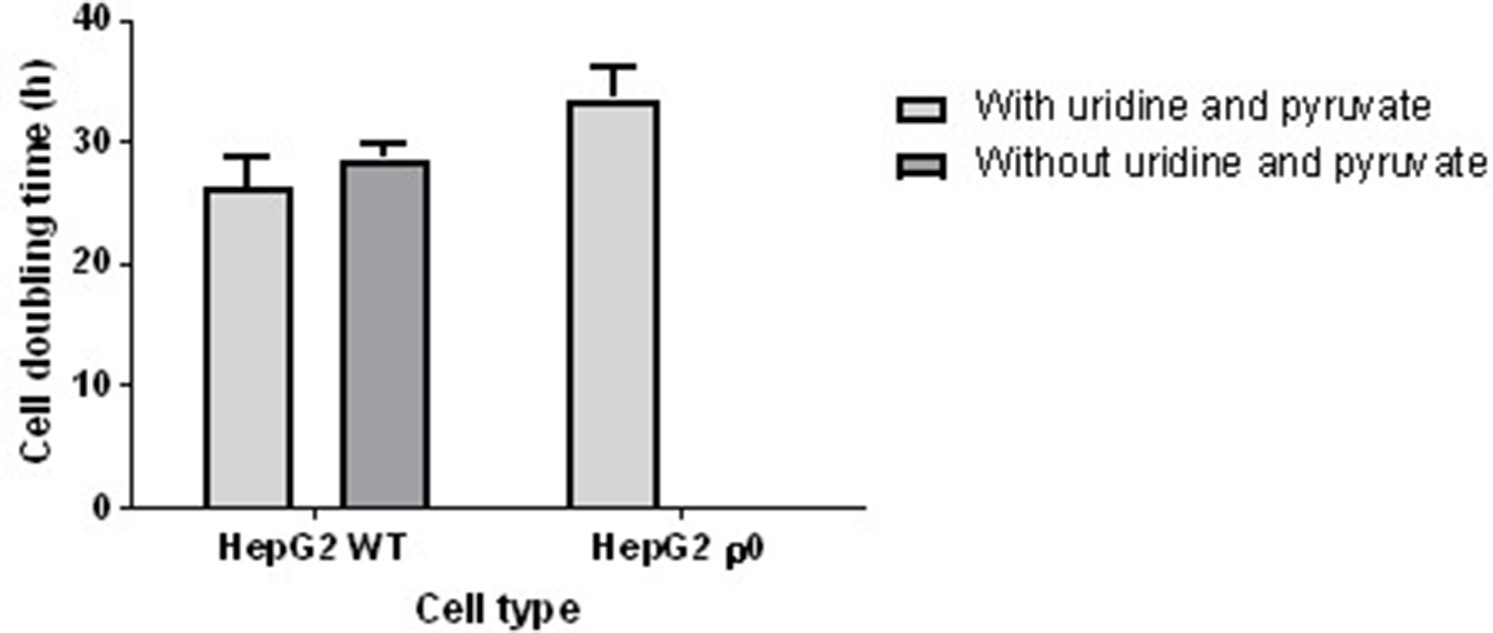
Cell doubling time of HepG2 wild-type (WT) and HepG2 rho zero (ρ0) cells.
The two cell types were cultured in media with or without uridine and pyruvate and the growth rate was calculated. The dependence of HepG2 ρ0 cells on pyruvate and uridine meant that culture media devoid of these constituents was able to select for the successful depletion of mitochondrial DNA (mtDNA) and the resultant non-functional electron transport chain in ethidium bromide (EtBr)-treated cells. Concordantly, HepG2 WT cells had a similar doubling time in media with or without these additives, averaging 26.2 hr. In contrast, HepG2 ρ0 cells exhibited no growth without uridine and pyruvate and an average doubling time of 27.6 hr when in media containing these two constituents. Data are presented as mean SEM of n=3 experiments. Source data: Figure 9—figure supplement 1—source data 1file.xslx.
-
Figure 9—figure supplement 1—source data 1
Source data of the cell doubling time of cells displayed in Figure 9—figure supplement 1.
- https://cdn.elifesciences.org/articles/78187/elife-78187-fig9-figsupp1-data1-v2.xlsx
Figure 9—figure supplement 2
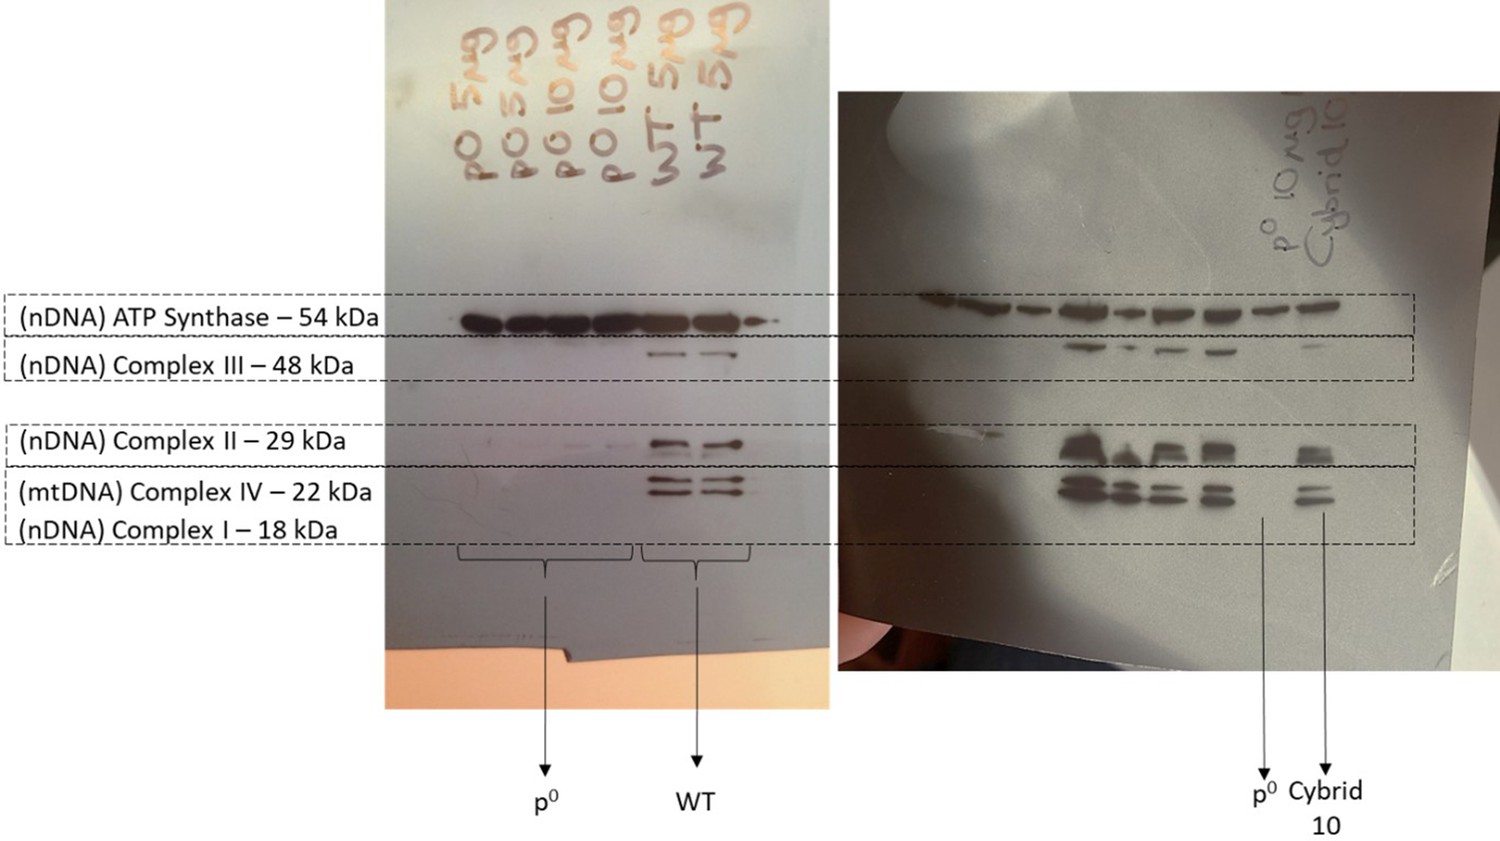
Representative western blots of HepG2 wild-type (WT), rho zero, and cybrid cell lysates.
10 µg of lysate protein was resolved by SDS-PAGE and probed for subunits of complexes I (NDUFB8), II (Iron-sulphur protein (IP) 30 KDa), III (Core 2), IV (II), V (alpha). All nuclear DNA and mtDNA-encoded subunits of the electron transport chain which were probed for were present in HepG2 WT and cybrid cells. However, ρ0 cells did not express the mtDNA-encoded subunit of complex IV. Notably, despite all the other subunits being encoded in the nuclear DNA, it was only the alpha subunit of ATP synthase that was retained in the ρ0 cells. Abbreviations: mtDNA, mitochondrial DNA; nDNA, nuclear DNA. Source data: Figure 9—figure supplement 2—source data 1 – raw image.pptx.
-
Figure 9—figure supplement 2—source data 1
Table detailing the mitochondrial DNA (mtDNA) variation of the 10 healthy volunteers whose platelets were used to generate cybrids.
- https://cdn.elifesciences.org/articles/78187/elife-78187-fig9-figsupp2-data1-v2.pptx
-
Figure 9—figure supplement 2—source data 2
Table detailing the results of all statistical analysis for figures 2, 3, 4, 5, 6, 7 and 8.
- https://cdn.elifesciences.org/articles/78187/elife-78187-fig9-figsupp2-data2-v2.zip
Tables
Table 1
Real-time PCR primers used to amplify regions of mitochondrial and nuclear DNA.
| Gene | Dye/probe | Additional information |
|---|---|---|
| RNase P (nDNA) | VICdye-labeled TAMRA probe | Location: chromosome 14, cytoband 14q11.2 |
| TERT (nDNA) | VICdye-labeled TAMRA probe | Location: chromosome 5, cytoband 5p15.33 |
| N/A Custom sequence (mtDNA) | FAMdye-labeled MGB probe | Oligonucleotide sequences: hmito F5 CTTCTGGCCACAGCACTTAAAC hmito R5 GCTGGTGTTAGGGTTCTTTGTTTT |
| ND-1 (mtDNA) | FAMdye-labeled MGB probe | Location: mtDNA 3307–4262 |
-
FAM, carboxyfluorescein; MGB, minor groove binder; ND-1, NADH dehydrogenase-1; mtDNA, mitochondrial DNA; N/A, not applicable; TAMRA, 6-carboxytetramethyl-rhodamine; TERT, telomerase reverse transcriptase; VIC, 2′-chloro-7′phenyl-1,4-dichloro-6-carboxy-fluorescein.
Table 2
Assessment of mtDNA content in HepG2 wild-type (WT), HepG2 rho zero (ρ0), and HepG2 cybrids.
*Custom mtDNA sequence: Oligonucleotide sequences: hmito F5 CTTCTGGCCACAGCACTTAAAC, hmito R5 GCTGGTGTTAGGGTTCTTTGTTTT. The Ct value of both mtDNA primers increased dramatically in ρ0 compared to WT cells whilst nuclear DNA Ct values remained consistent across all three cell lines. Similarly, both HepG2 WT and cybrid cells had thousands of mtDNA copies/cell in contrast to the ρ0 cells which had less than one copy/cell. Abbreviations: Ct, cycle threshold; ND-1, NADH dehydrogenase-1; RNase, ribonuclease P RNA component H1; TERT, telomerase reverse transcriptase; WT, wild-type; ρ0, rho zero. Ct values are displayed as the mean (SEM) of n=3 experiments.
| Sample | Primer Ct value | mtDNA copies/cell | ||||||
|---|---|---|---|---|---|---|---|---|
| TERT | RNase P | ND-1 | Custom* | TERT/ ND-1 | TERT/ custom | RNase P/ND-1 | RNase P/custom | |
| HepG2 WT | 30.6 (1.00) | 31.3 (1.11) | 18.5 (0.120) | 18.9 (0.140) | 9280 | 6985 | 14563 | 10960 |
| HepG2 ρ0 | 27.7 (0.0600) | 27.2 (0.0700) | 34.7 (0.740) | 32.0 (0.180) | 0.00400 | 0.0240 | 0.00300 | 0.0170 |
| HepG2 cybrid | 29.8 (1.10) | 30.4 (0.550) | 18.9 (0.730) | 19.0 (0.0900) | 3875 | 3590 | 5673 | 5256 |
Table 3
Differences in parameters of mitochondrial function in HepG2 wild-type (WT), rho zero (ρ0), and cybrid cells.
| HepG2 cell type | Basal OCR (pmol/min/µg protein) | PPRgly/OCR | % Non-mitochondrial respiration |
|---|---|---|---|
| WT | 6.52 (0.350) | 0.354 (0.0900) | 28.4 (0.310) |
| Rho zero | 0.450 (0.100) | 55.5 (0.930) | 102 (4.33) |
| Cybrid | 6.53 (0.400) | 0.466 (0.660) | 24.3 (0.510) |
-
Table 3—source data 1
Source data of the bioenergetic analysis of cells displayed in Table 3.
- https://cdn.elifesciences.org/articles/78187/elife-78187-table3-data1-v2.xlsx
Additional files
-
Supplementary file 1
Table detailing the mitochondrial DNA (mtDNA) variation of the 10 healthy volunteers whose platelets were used to generate cybrids.
Full details of the bioinformatics analysis and haplogroup assignment of these donors can be found in Ball et al., 2021. Briefly, variant calling was performed using the Genome Analysis Toolkit (GATK; v3.2.2) before these results were input into HaploGrep2 (v2.1.0) for the determination of mtDNA haplogroup. Additional SNPs refer to SNPs that were present in the sample but were not characteristic of the assigned haplogroup. Abbreviations: SNP, single nucleotide polymorphism.
- https://cdn.elifesciences.org/articles/78187/elife-78187-supp1-v2.xlsx
-
Supplementary file 2
Results of statistical analysis of the effect of haplogroup on drug-induced changes in bioenergetic parameters in an excel spreadsheet format.
Each dataset was analyzed using a linear mixed model with the subject fitted as a random effect and the haplogroup fitted as a fixed effect as described in the statistical analysis section. Key to the data presented in each tab: 2 a - accompanying analysis for Figure 2; Basal mitochondrial function and respiratory complex activity in haplogroup H and J HepG2 cybrids. 2b - accompanying analysis for Figure 3; The effect of flutamide on ATP levels and mitochondrial respiratory function in haplogroup H and J HepG2 cybrids. 2 c - accompanying analysis for Figure 4; The effect of 2-hydroxyflutamide upon ATP levels and mitochondrial respiratory function in haplogroup H and J HepG2 cybrids. 2d - accompanying analysis for Figure 5; The effect of flutamide and 2-hydroxyflutamide upon respiratory complex I and II in haplogroup H and J HepG2 cybrids. 2e - accompanying analysis for Figure 6; The effect of tolcapone on ATP levels and mitochondrial respiratory function in haplogroup H and J HepG2 cybrids. 2 f - accompanying analysis for Figure 7; The effect of bicalutamide upon ATP levels and mitochondrial respiratory function in haplogroup H and J HepG2 cybrids. 2 g - accompanying analysis for Figure 8; Figure 8 The effect of entacapone upon ATP levels and mitochondrial respiratory function in haplogroup H and J HepG2 transmitochondrial cybrids. * denotes unit of %.
- https://cdn.elifesciences.org/articles/78187/elife-78187-supp2-v2.xlsx
-
Transparent reporting form
- https://cdn.elifesciences.org/articles/78187/elife-78187-transrepform1-v2.docx
Download links
A two-part list of links to download the article, or parts of the article, in various formats.
Downloads (link to download the article as PDF)
Open citations (links to open the citations from this article in various online reference manager services)
Cite this article (links to download the citations from this article in formats compatible with various reference manager tools)
The generation of HepG2 transmitochondrial cybrids to reveal the role of mitochondrial genotype in idiosyncratic drug-induced liver injury
eLife 12:e78187.
https://doi.org/10.7554/eLife.78187


