Germline/soma distinction in Drosophila embryos requires regulators of zygotic genome activation
- Department of Molecular Biology, Princeton University, United States
Figures
Figure 1 with 1 supplement
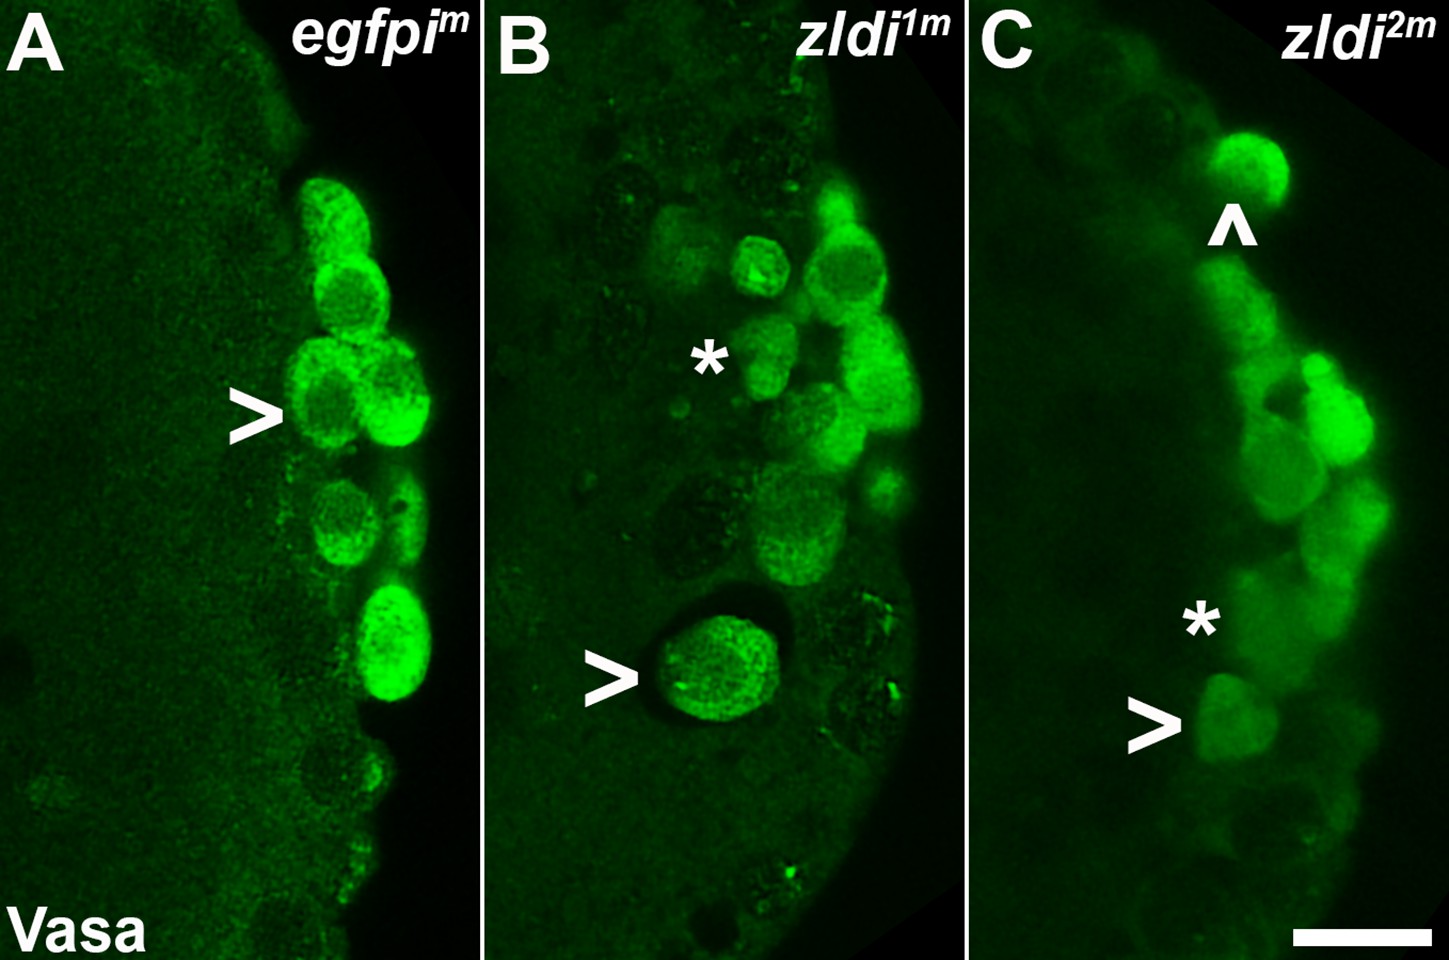
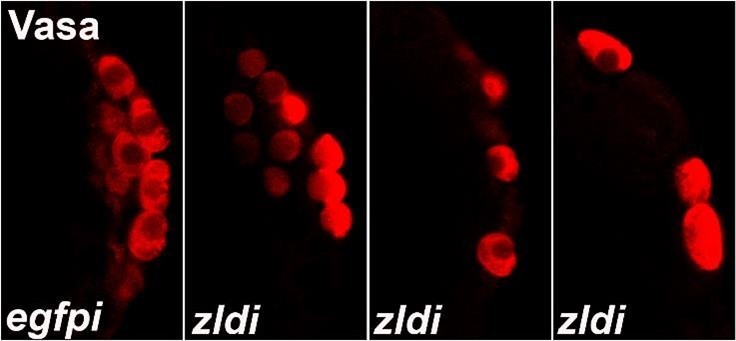
zld knockdown embryos display variable Vasa levels and abnormal primordial germ cell (PGC) behavior.
Zero- to four-hr-old paraformaldehyde-fixed embryos were stained with anti-Vasa antibodies (green) to assess PGC integrity. Shown are representative embryos at nuclear cycle (NC)13 (late syncytial blastoderm stage) of respective genotypes. (A) egfpim embryos have PGCs with uniformly high levels of Vasa (arrowhead, green), but (B) zldi1m and (C) zldi2m embryos have low levels of Vasa (panel C, asterisk and arrowhead) in PGCs and these PGCs often spread away from the posterior pole in the interior of the embryo (panel B, two such PGCs are marked with an asterisk and an arrowhead). Scale bar represents 10 µm. Images shown are maximum intensity projections through an embryo to capture all PGCs through the Z plane.
Figure 1—figure supplement 1
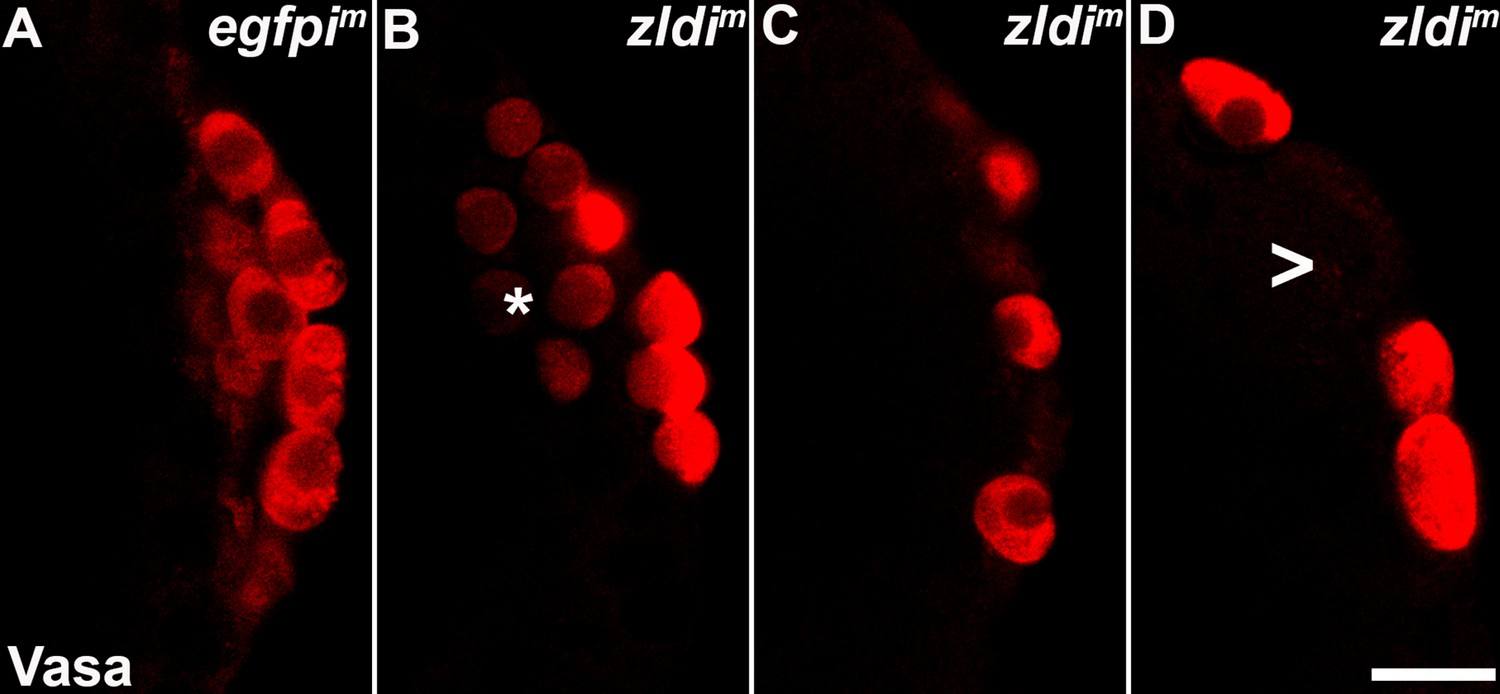
zld knockdown embryos display a variety of defects in primordial germ cell (PGC) formation.
Zero- to four-hr-old paraformaldehyde-fixed embryos were stained with anti-Vasa antibodies (red) to assess PGC formation and cellularization. Shown are a few examples of embryos at nuclear cycle (NC)12/13 (late syncytial blastoderm stage) of respective genotypes. (A) egfpim embryos have PGCs with uniformly high levels of Vasa but zldi1m embryos show cells with low levels of Vasa in PGCs (panel B, asterisk), or fewer PGCs (panel C). On rare occasions PGCs are formed away from each other (empty space marked with an arrowhead) unlike wild type where they are in a continuous monolayer. Scale bar represents 10 µm. Images shown are maximum intensity projections through an embryo to capture all PGCs through the Z plane.
Figure 2
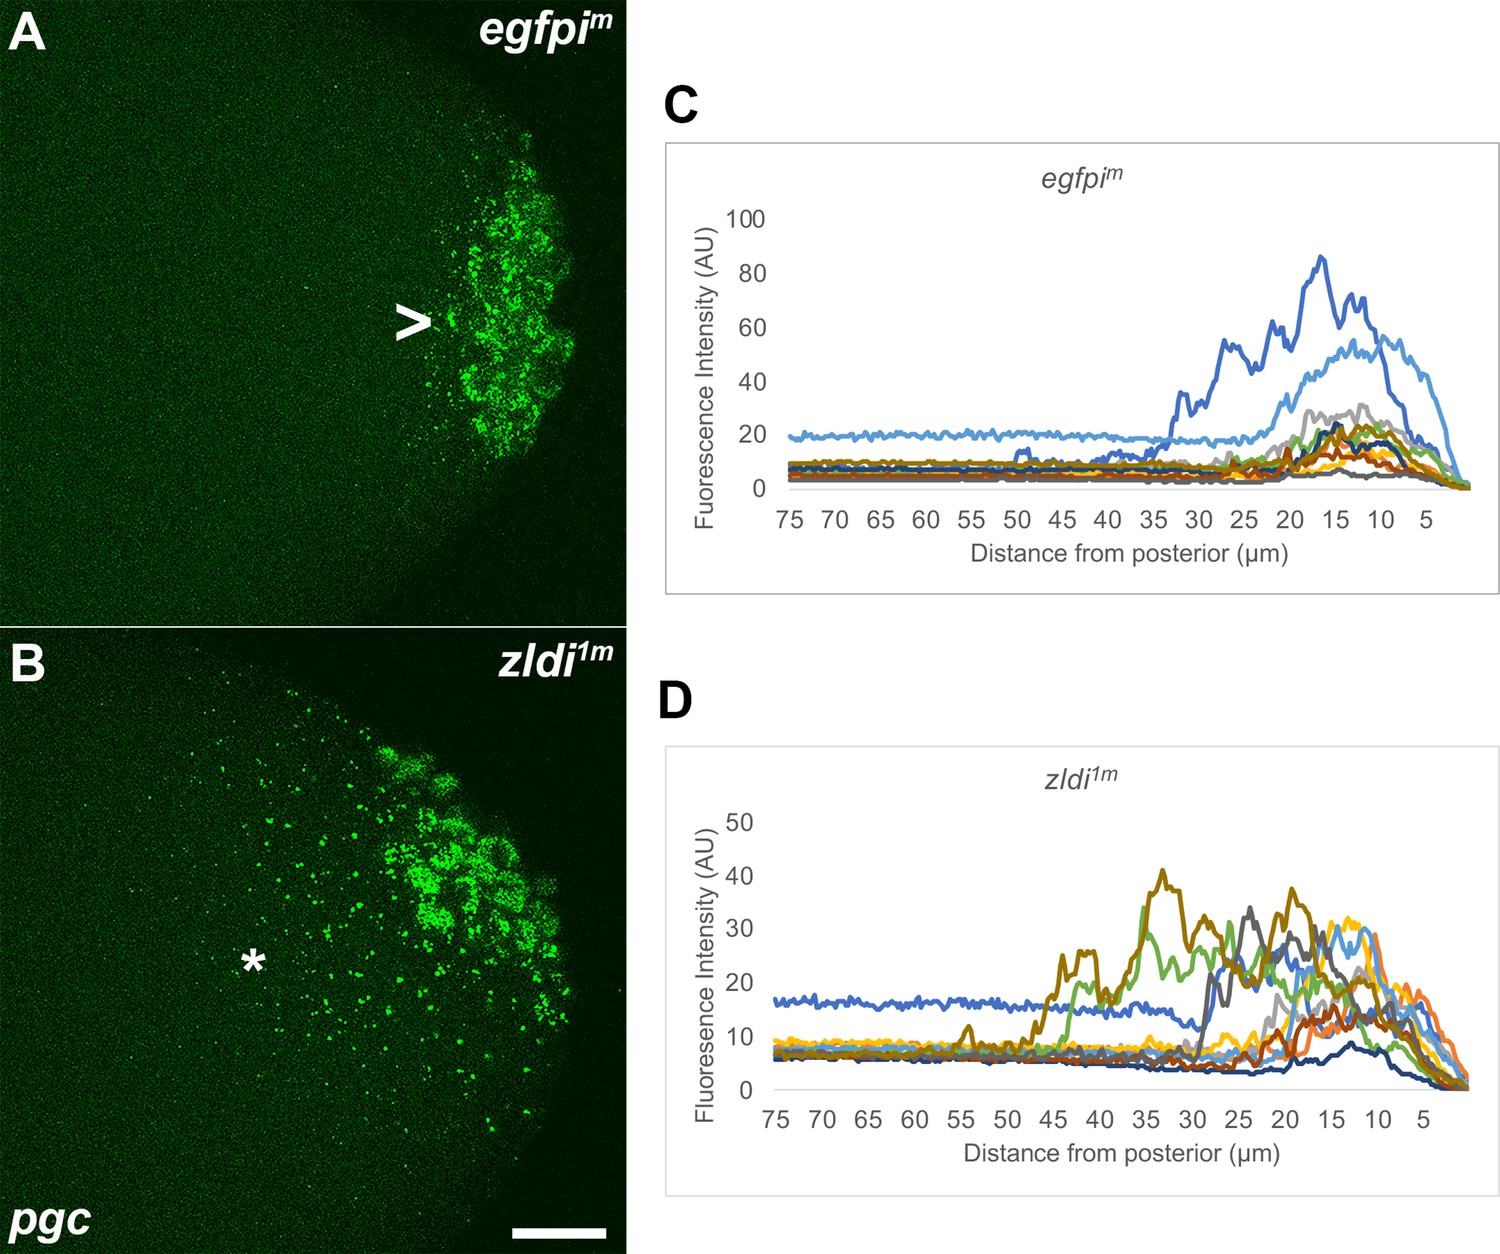
Ectopic localization of polar granule component (pgc) RNA away from the posterior pole in syncytial and cellular blastoderm zld knockdown embryos.
Single molecule fluorescence in situ hybridization (smFISH) was performed using probes specific for pgc (green) on 0- to 4-hr-old paraformaldehyde-fixed (A) egfpim and (B) zldi1m embryos to assess germ plasm localization. Scale bar represents 10 µm. Images shown are representative maximum intensity projections through nuclear cycle (NC)13 (late syncytial blastoderm) embryos to capture total germ plasm localization in Z. Sequestration to the posterior cap is shown with an arrowhead while germ plasm spread into the soma is indicated with an asterisk. The degree of germ plasm spread was measured by fluorescence intensity from maximum projections (visualized using pgc) in the posterior 75 µm of (C) egfpim and (D) zldi1m embryos. Each plot shows a representative experiment, with each line depicting germ plasm distribution of an individual embryo (see Materials and methods for details of quantification).
Figure 3 with 1 supplement
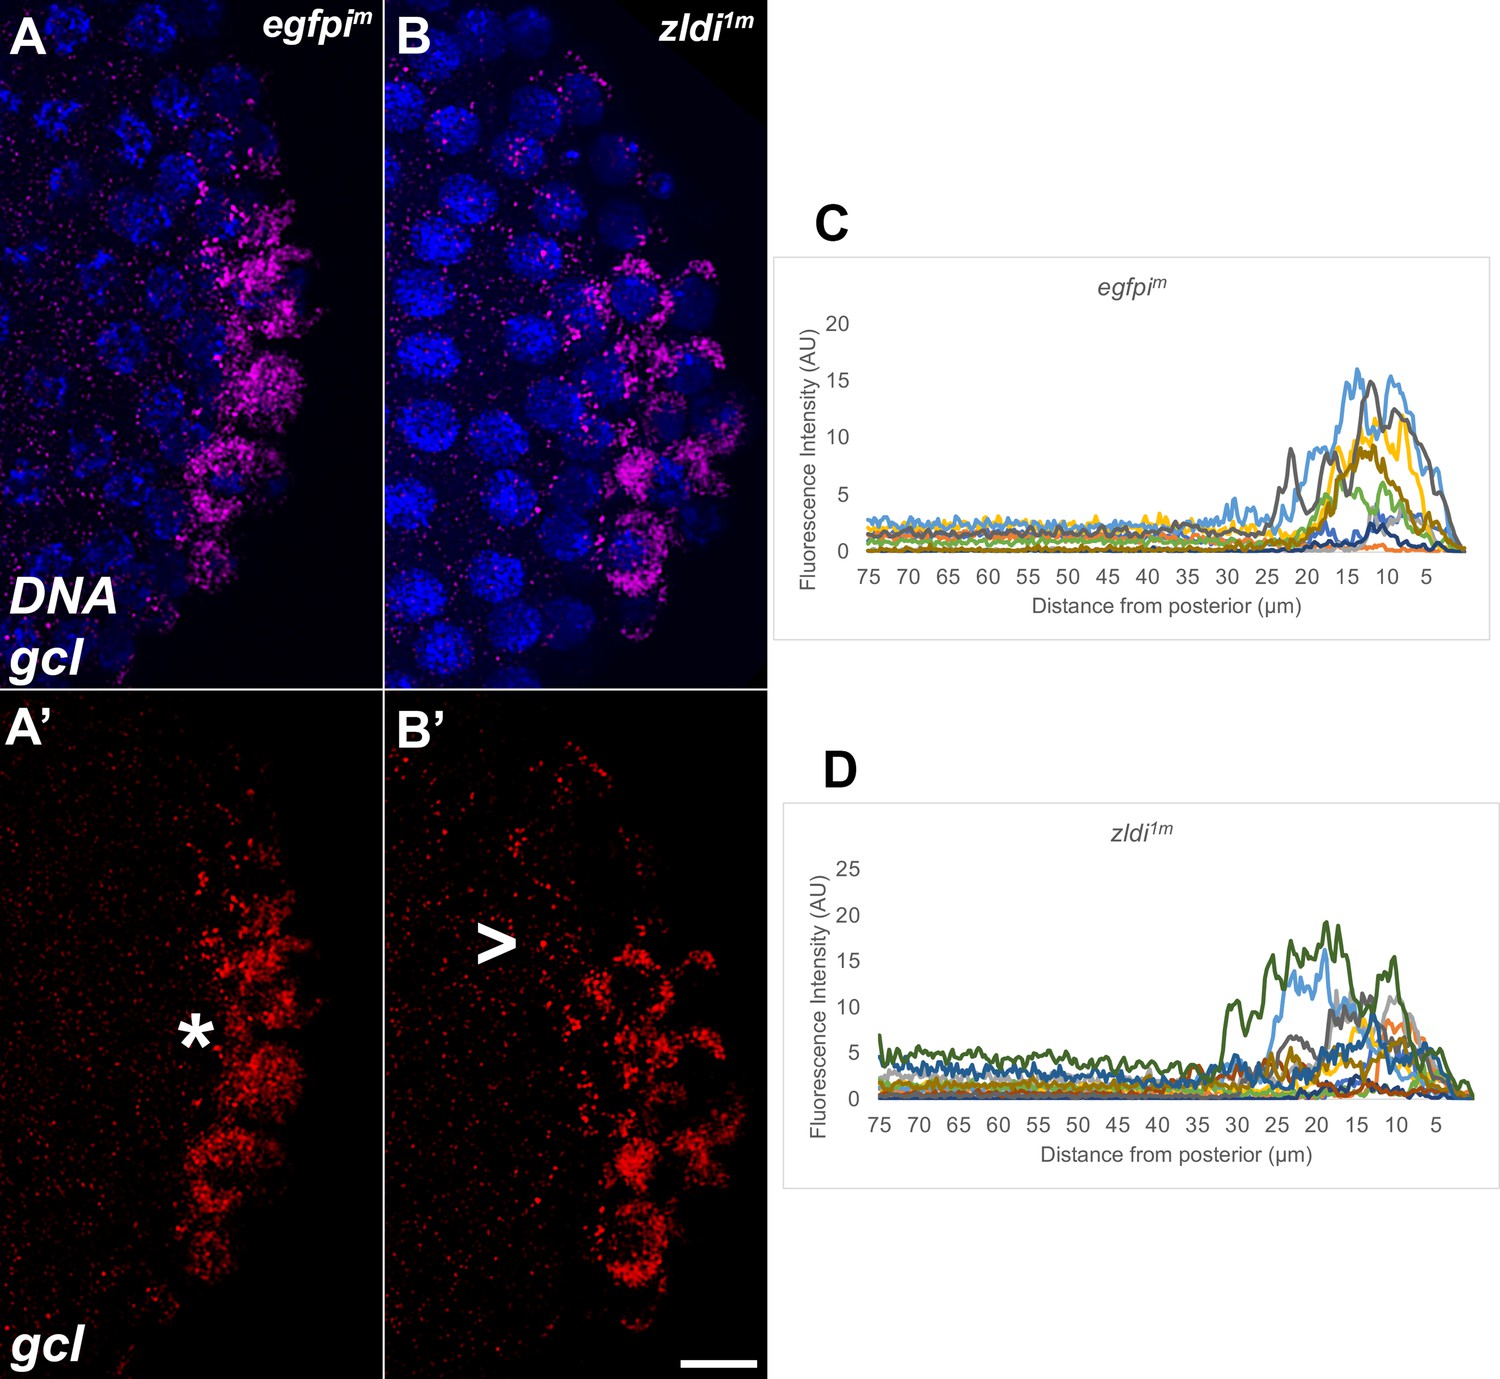
Syncytial and cellular blastoderm zld knockdown embryos display partially mislocalized gcl RNA.
Single molecule fluorescence in situ hybridization (smFISH) was performed using probes specific for gcl (red) on 0- to 4-hr-old paraformaldehyde-fixed (A,A’) egfpim (nuclear cycle [NC]12) and (B,B’) zldi1m (NC12) embryos to assess gcl RNA localization. Scale bar represents 10 µm. Images shown are representative maximum intensity projections through NC12 (late syncytial blastoderm) embryos to capture total germ plasm localization in Z. Sequestration to the posterior cap is shown with an asterisk while germ plasm spread into the soma is indicated with an arrowhead. The degree of germ plasm spread was measured by fluorescence intensity from maximum projections (visualized using gcl-specific signal) in the posterior 75 µm of (C) egfpim and (D) zldi1m embryos. Each plot shows a representative experiment, with each line depicting germ plasm distribution of an individual embryo (see Materials and methods for details of quantification).
Figure 3—figure supplement 1
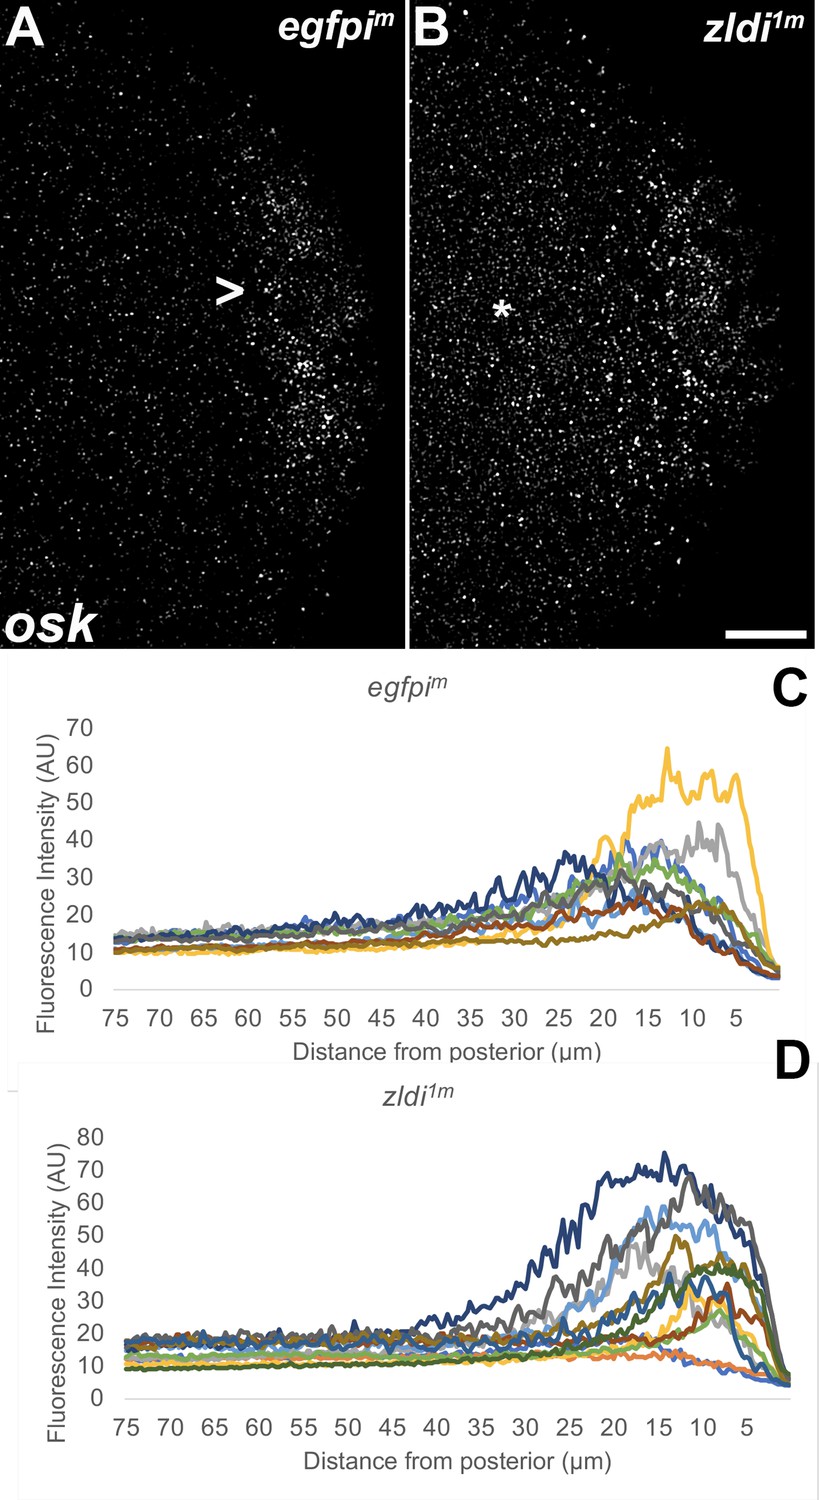
Ectopic localization of osk RNA in syncytial blastoderm zld knockdown embryos.
Single molecule fluorescence in situ hybridization (smFISH) was performed using probes specific for osk on 0- to 4-hr-old paraformaldehyde-fixed (A) egfpim and (B) zldi1m embryos to assess osk RNA localization. Scale bar represents 10 µm. Images shown are representative maximum intensity projections through nuclear cycle (NC)10 (early syncytial blastoderm) embryos to capture total germ plasm localization in Z. In egfpim embryos, a large fraction of osk RNA is seen associated with the posterior cortex (marked with an arrowhead) whereas in zldi1m embryos, osk RNA is relatively uniformly distributed away from the posterior cortex (marked with an asterisk). The degree of germ plasm spread was measured by fluorescence intensity from maximum projections (visualized using osk-specific signal) in the posterior 75 µm of (C) egfpim and (D) zldi1m embryos. Each plot shows a representative experiment, with each line depicting germ plasm distribution of an individual embryo (see Materials and methods for details of quantification).
Figure 4 with 2 supplements
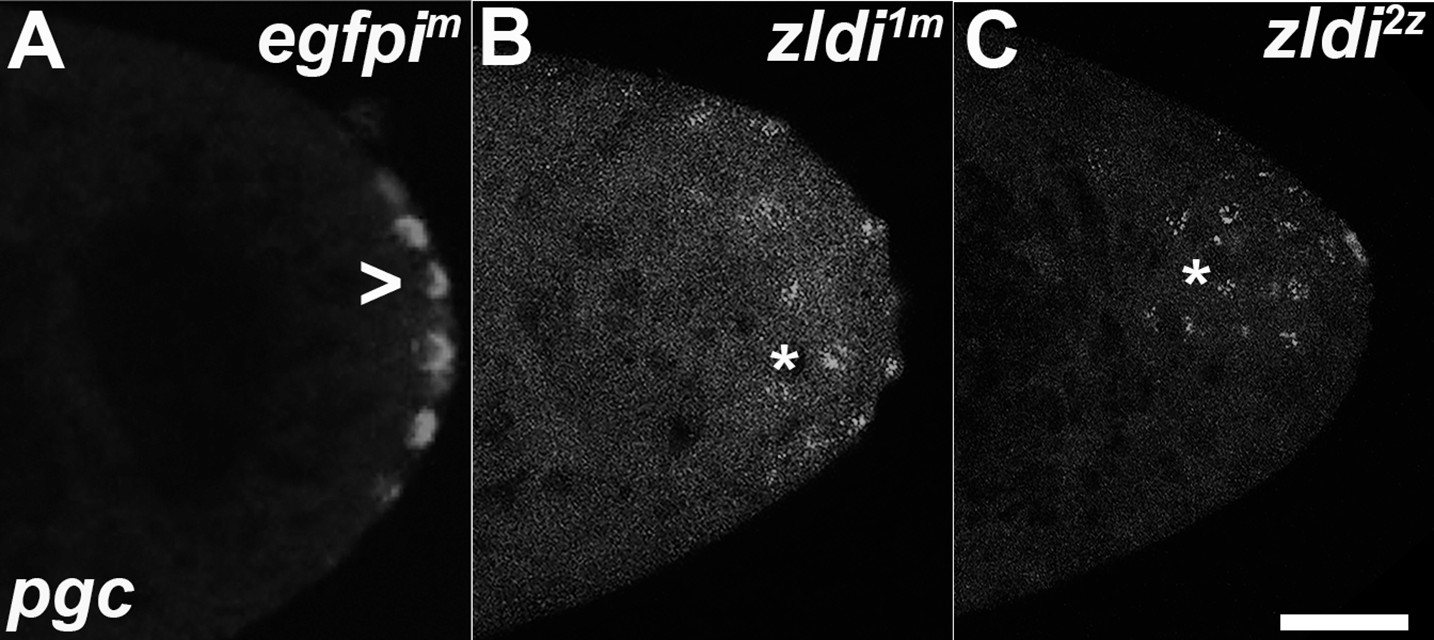
Zygotic knockdown of zld recapitulates the ectopic localization of polar granule component (pgc) transcripts induced upon its maternal loss.
Single molecule fluorescence in situ hybridization (smFISH) was performed using probes specific for pgc on 0- to 3-hr-old paraformaldehyde-fixed (A) egfpim, (B) zldi1m, and (C) zldi2z embryos to assess germ plasm localization. Scale bar represents 10 µm. pgc RNA is seen at the posterior cortex in an nuclear cycle (NC)11 (early syncytial blastoderm) egfpim embryo (marked with an arrowhead) whereas both zldi1m and zldi2z embryos at NC10/11 (early syncytial blastoderm) show similar mislocalization of pgc RNA (marked with an asterisk in both panels).
Figure 4—figure supplement 1
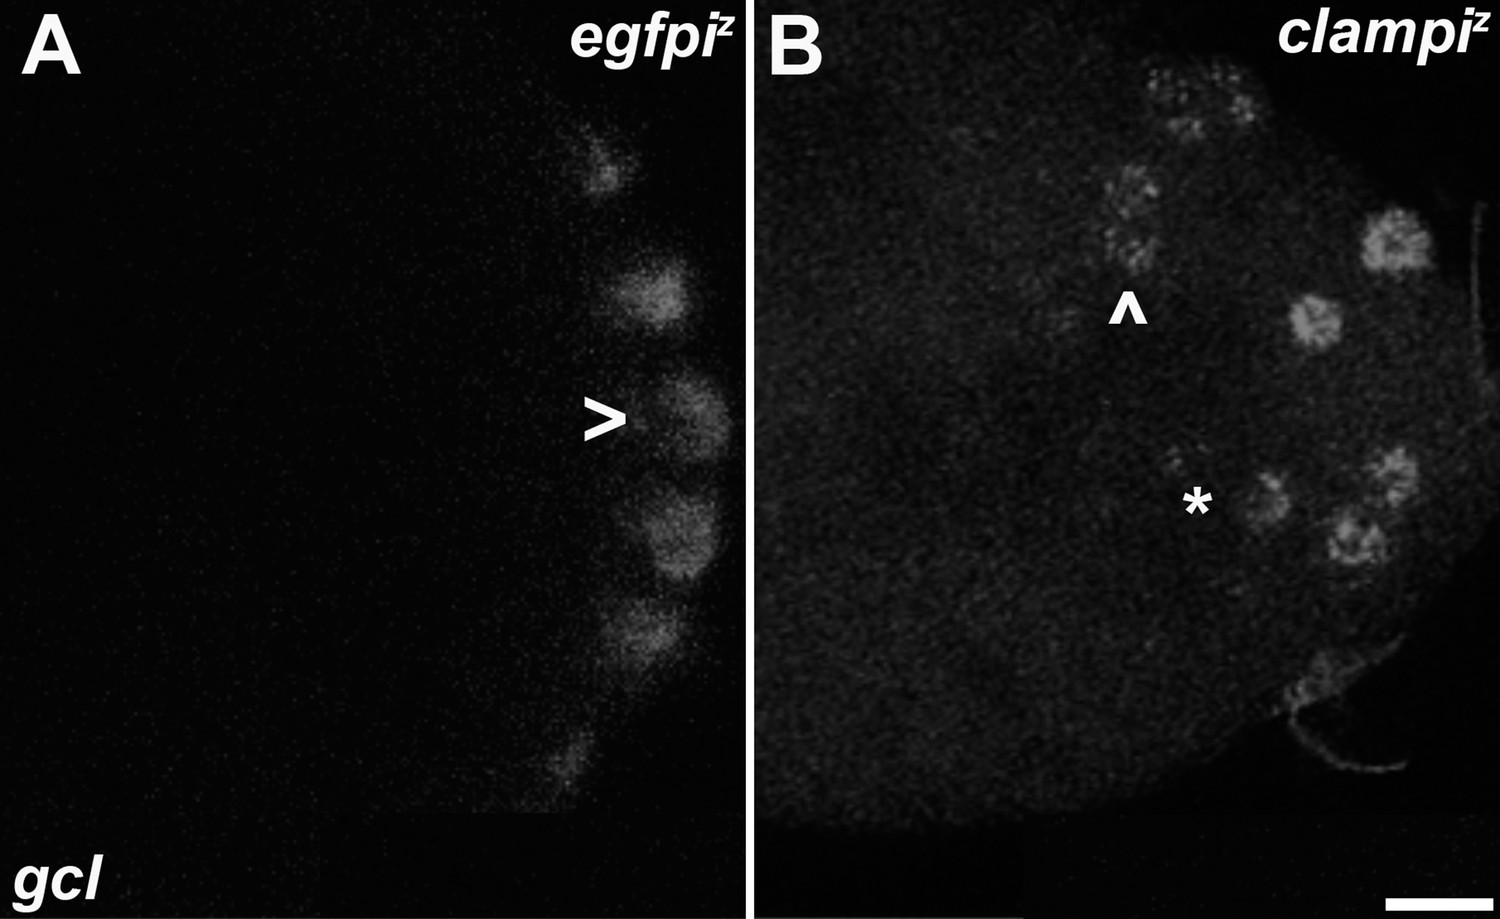
Zygotic knockdown of CLAMP recapitulates the germ plasm mislocalization phenotype.
Single molecule fluorescence in situ hybridization (smFISH) was performed using probes specific for gcl. On 0- to 3-hr-old paraformaldehyde-fixed (A) egfpiz and (B) clampiz embryos to assess germ plasm localization. Scale bar represents 10 µm. egfpiz embryo at nuclear cycle (NC)11 (early syncytial blastoderm) shows posteriorly localized gcl RNA whereas gcl RNA is ectopically localized away from the posterior cortex in an NC11 (early syncytial blastoderm) clampiz embryo marked with an asterisk and arrowhead.
Figure 4—figure supplement 2
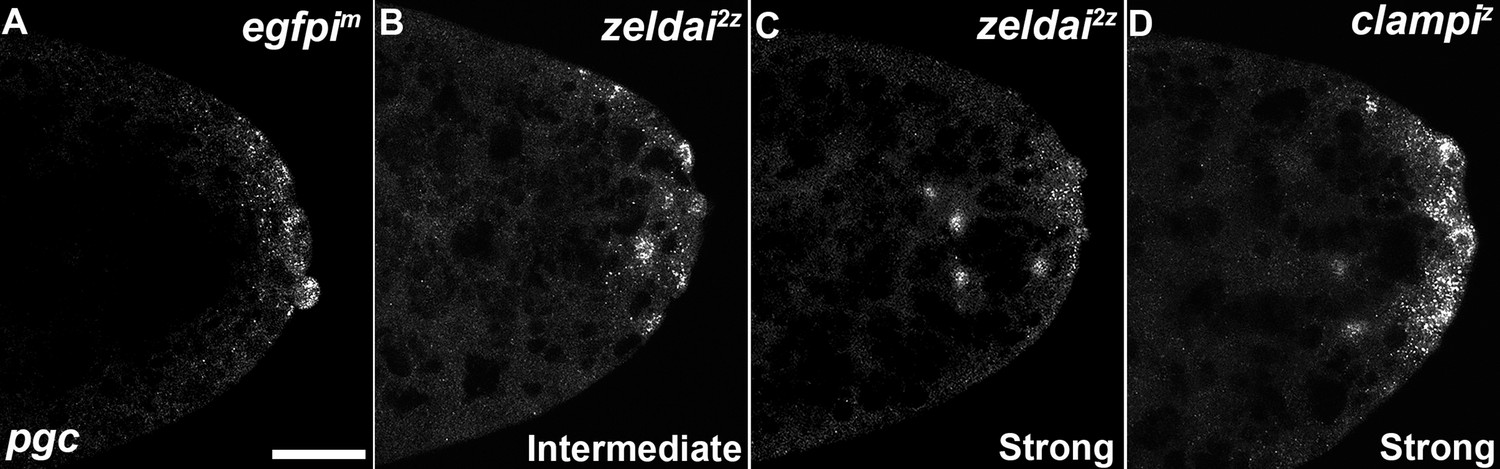
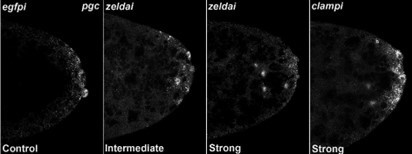
zld and clamp knockdown embryos display variable spreading of germ plasm RNAs.
Defects in germ plasm localization were classified as "None", "Intermediate", or "Strong", as shown in examples.
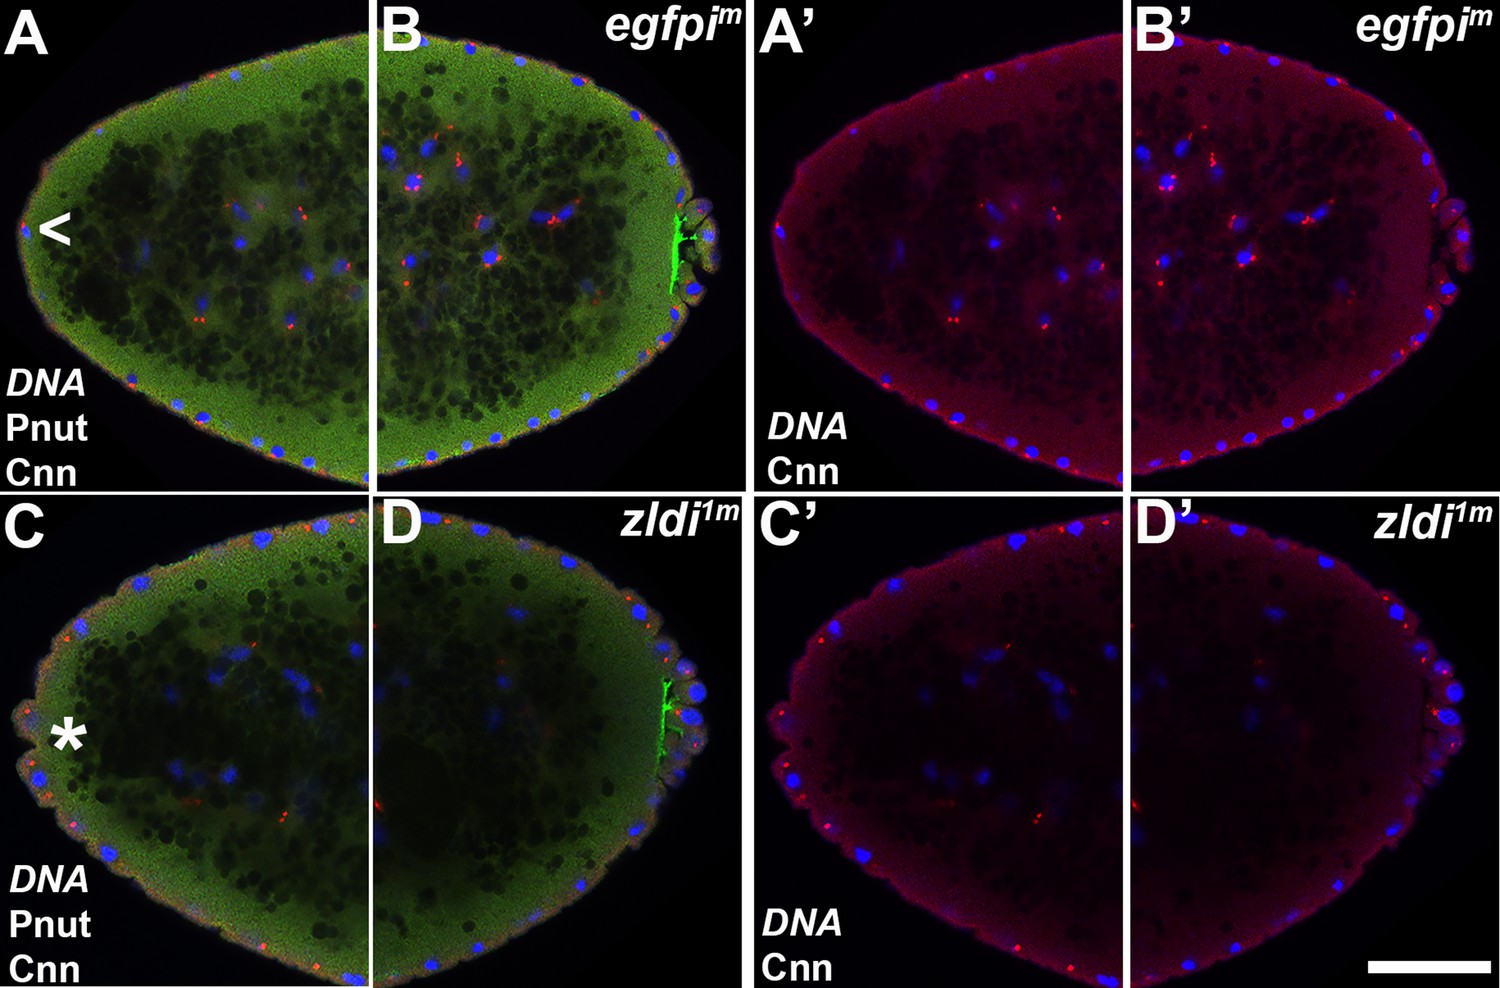
Figure 5
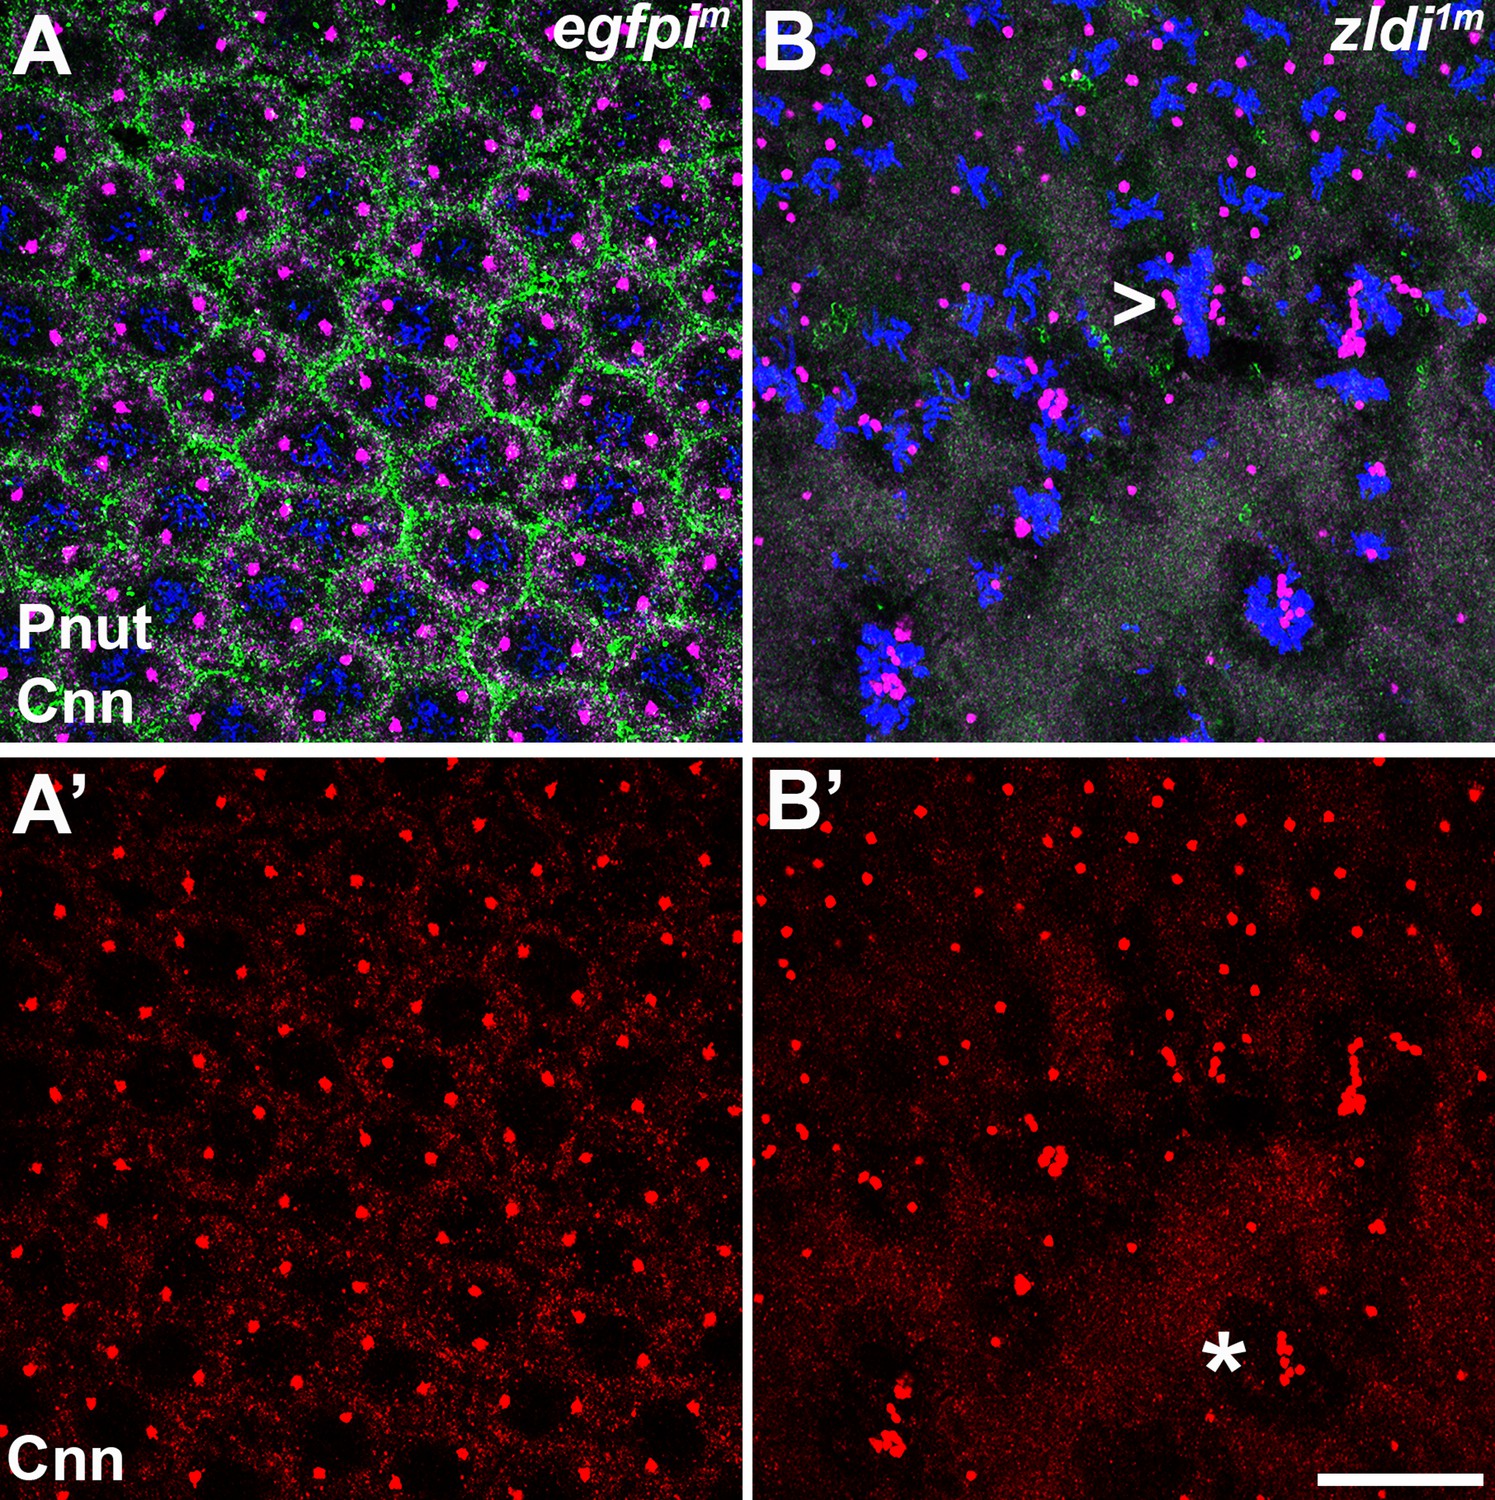
Centrosomes display numerous aberrations in soma of zld-compromised embryos.
Zero- to four-hr old paraformaldehyde-fixed embryos were stained with anti-Centrosomin (anti-Cnn) and anti-Peanut (anti-Pnut) antibodies to assess centrosome behavior in the soma of zldi1m embryos. (A) egfpim embryo at nuclear cycle (NC)12 (late syncytial blastoderm) has regularly spaced nuclei with two centrosomes (A’, red) at opposite poles surrounded by a ring of Pnut (green). (B) zld1m embryo at a comparable stage displays numerous defects, including duplicated but not separated centrosomes (arrowhead, B’, red) and disrupted accumulation of the cytoskeletal protein Pnut. Embryos were co-stained with Hoescht to visualize nuclei (blue). Scale bar represents 10 µm.
Figure 6
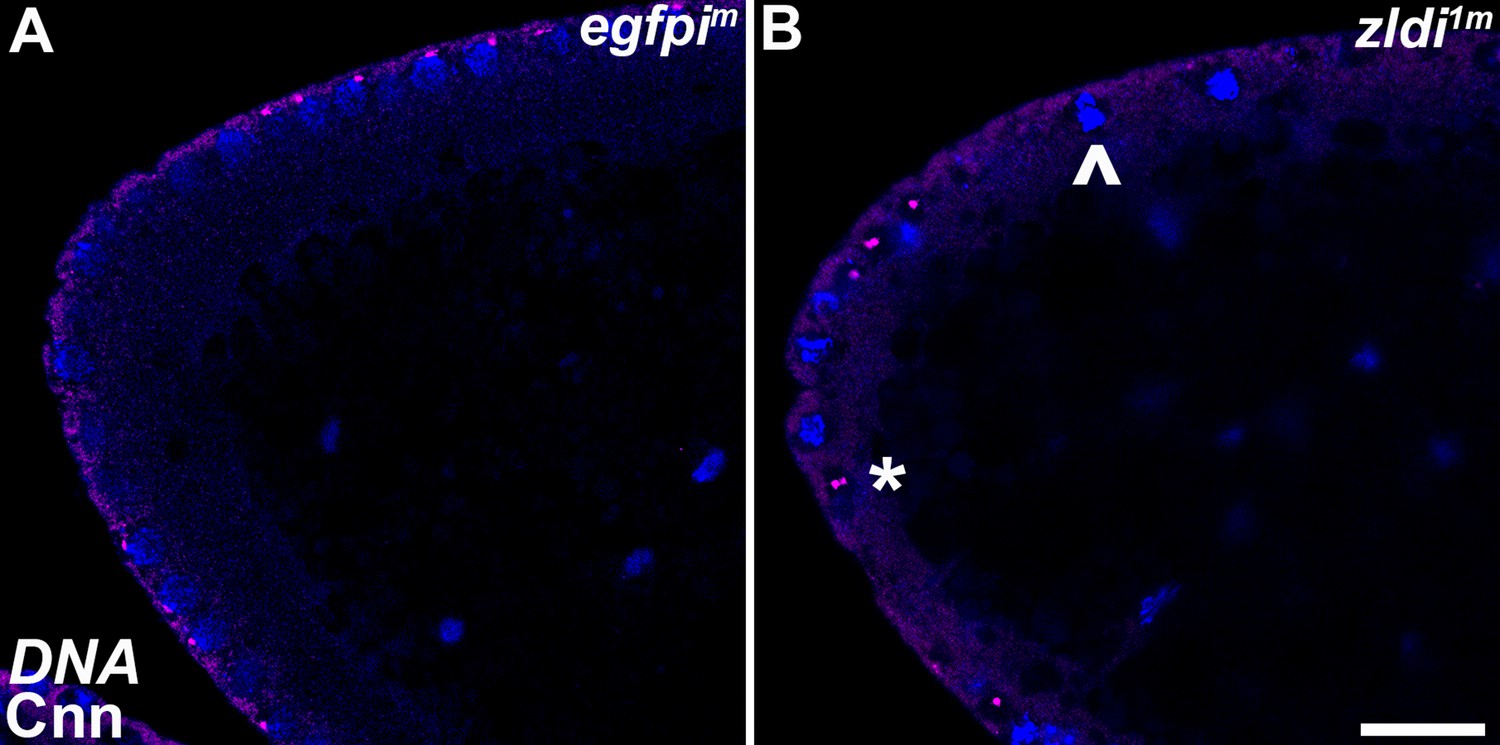
Centrosome aberrations are observed in early syncytial blastoderm embryos maternally compromised for zld.
Zero- to 3-hr-old paraformaldehyde-fixed embryos were stained with anti-Centrosomin (anti-Cnn) (magenta) to assess centrosome behavior in zldi1m embryos. Embryos were co-stained with Hoechst to visualize nuclei (blue). Both panels show the anterior terminus of a nuclear cycle (NC)11 (early syncytial blastoderm) embryo. (A) egfpim embryos have regularly spaced nuclei with correctly segregated centrosomes. (B) zld1m embryos display ineffectively separated centrosomes (asterisk) and fused nuclei (arrowhead). Scale bar represents 10 µm.
Figure 7
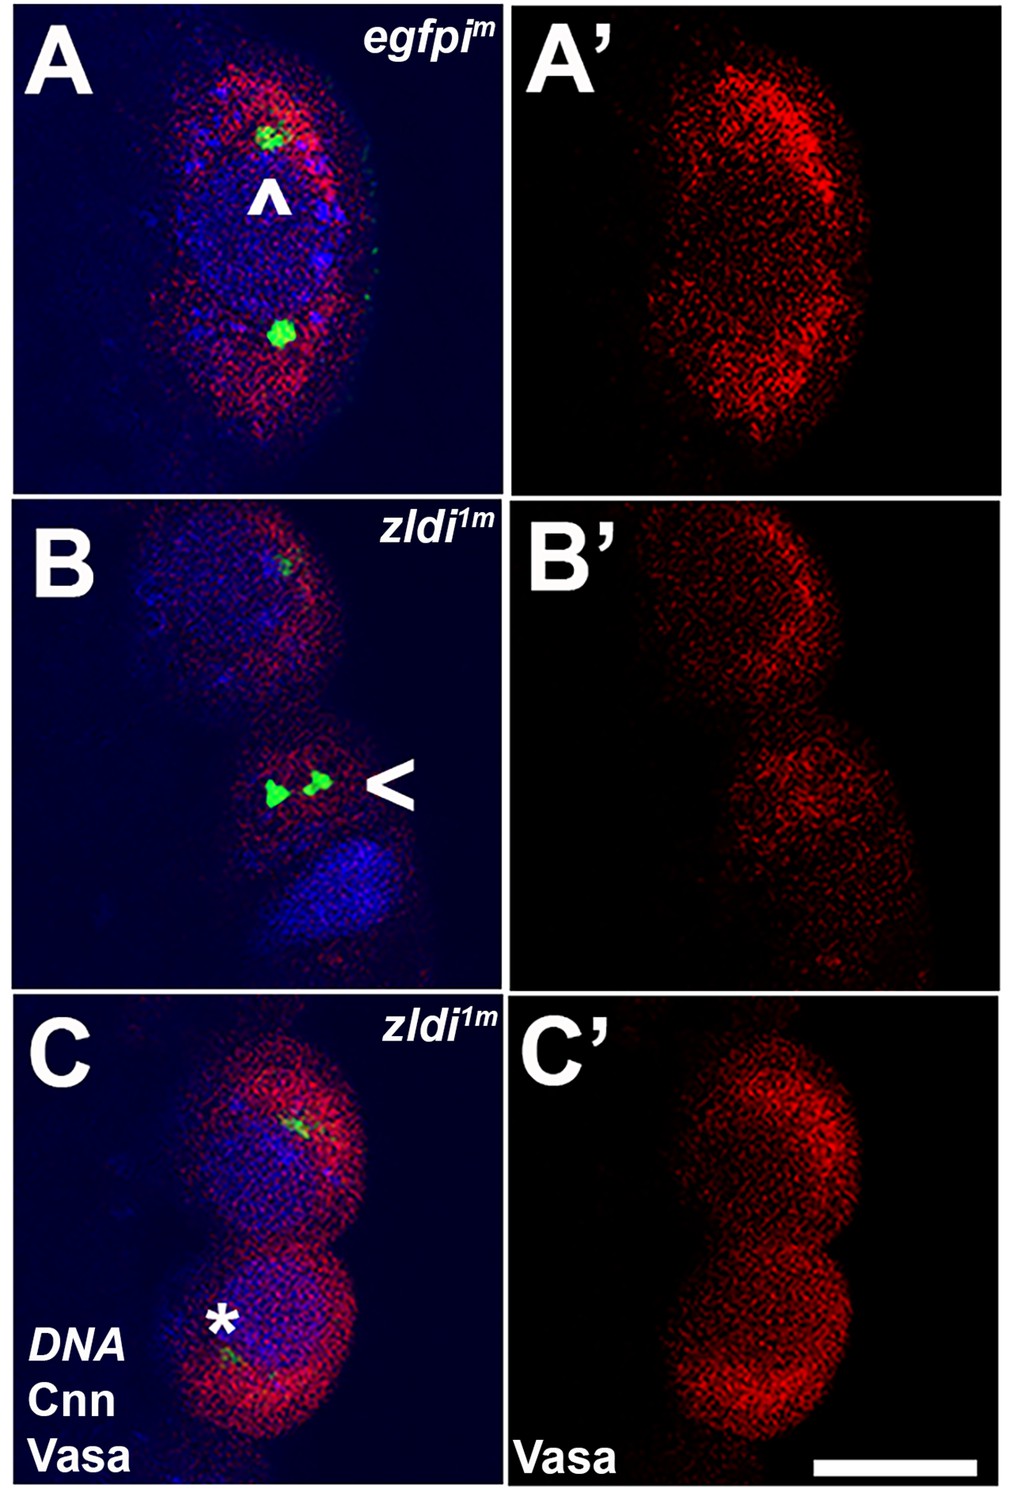
zld-compromised embryos have defects in centrosome duplication and separation in newly formed primordial germ cells (PGCs).
Zero- to three-hr-old paraformaldehyde-fixed embryos were stained with anti-Centrosomin (anti-Cnn) and anti-Vasa antibodies to assess centrosome behavior in the pole buds of zldi1m embryos. (A) egfpim embryos have high levels of Vasa (A’, red) in PGCs with centrosomes marked by Cnn (green) at opposite poles of each cell (A, caret). (B) zld1m embryos display non-segregated centrosomes (B, arrowhead), variable levels of Vasa in PGCs (B’, red) and reduced level of Cnn (C, asterisk, green). Embryos at NC10-11 (early syncytial blastoderm) were co-stained with Hoescht to visualize nuclei (blue). Scale bar represents 10 µm.
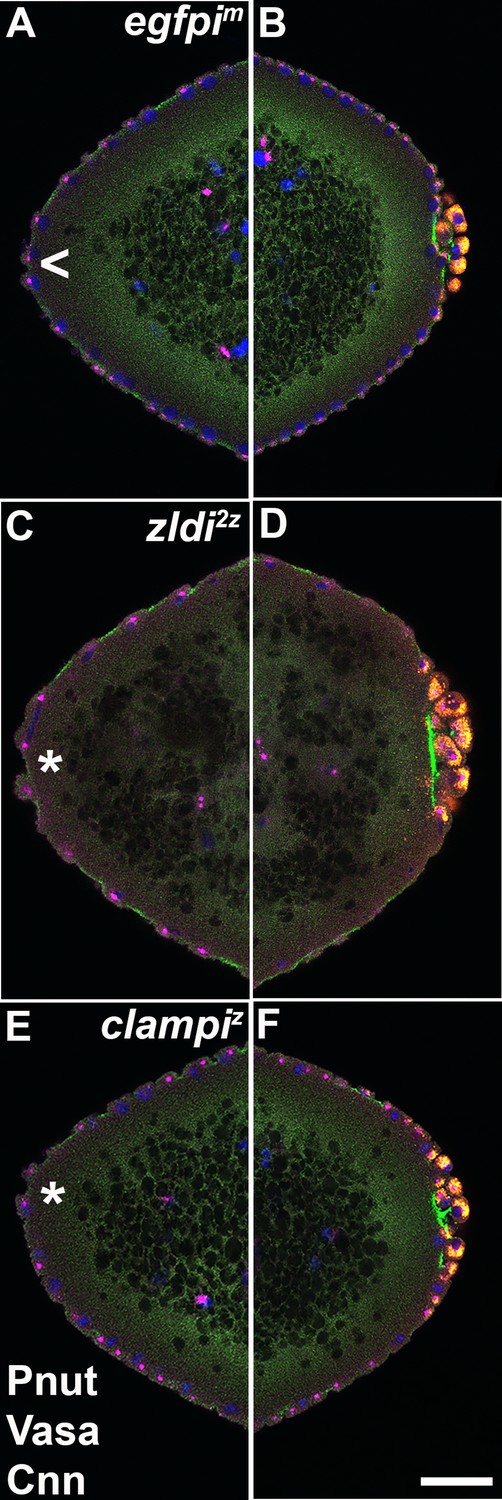
Figure 8
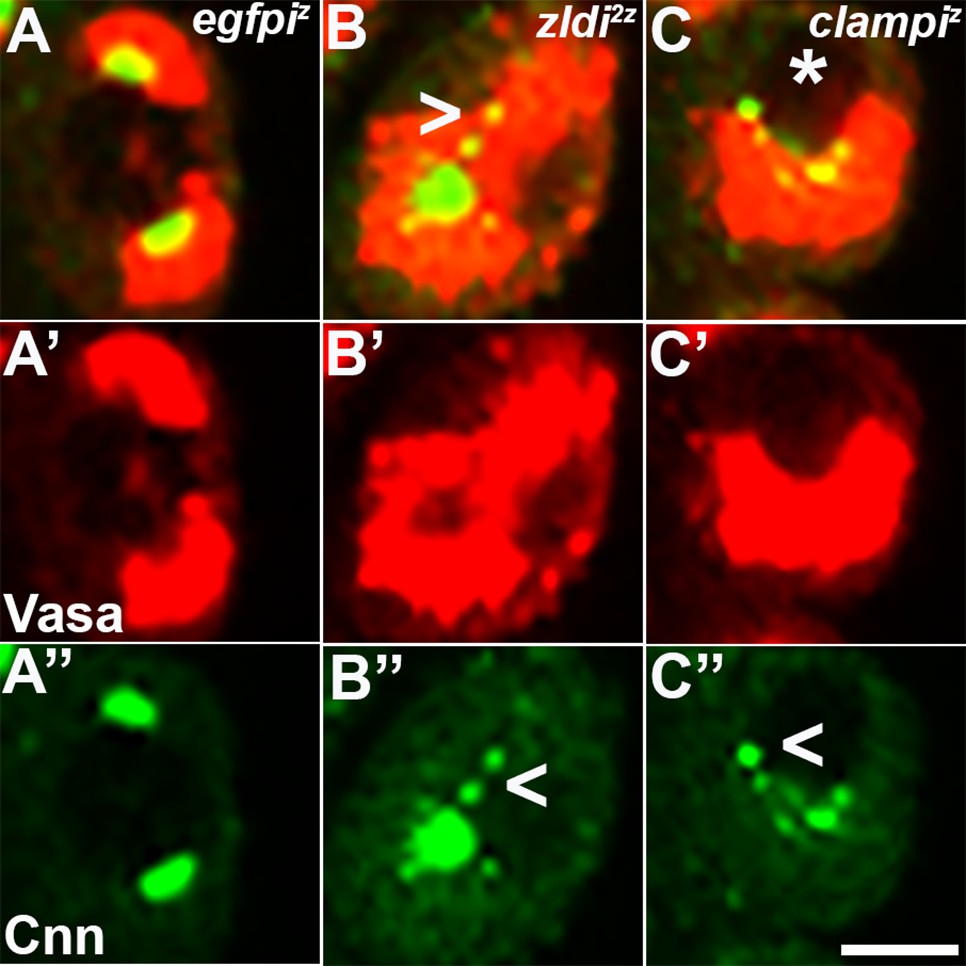
Embryos compromised for either zld or clamp display improperly duplicated and separated centrosomes in newly formed primordial germ cells (PGCs).
Zero- to 2.5-hr-old paraformaldehyde-fixed embryos were stained with anti-Centrosomin (anti-Cnn) and anti-Vasa antibodies to assess centrosome behavior in the pole buds of zld or clamp zygotic knockdown embryos. (A) egfpiz embryo at nuclear cycle (NC)10 (early syncytial blastoderm) displays high levels of Vasa (A’, red) in PGCs with centrosomes at opposite poles of each cell (A’’, green). Both zld2z (B) and clampiz (C) embryos also at NC10 (early syncytial blastoderm) exhibit defects including duplicated but attached or improperly separated centrosomes (B’’/C’’, arrowheads) as well as an aberrant pattern of anti-Cnn staining (green). Vasa seems to be unevenly distributed between daughter cells (red, B’ and C’). Scale bar represents 10 µm.
Figure 9
Appearance of ectopic protrusions at the anterior pole of maternal zld knockdown embryos.
Zero- to four-hr-old paraformaldehyde-fixed embryos were stained with anti-Centrosomin (anti-Cnn) and anti-Peanut (anti-Pnut) antibodies to assess morphology at the poles. Anterior (A,A’,C,C’) and posterior (B,B’/D,D’) views of a single representative egfpim (A,A’/B,B’) or zldi1m (C,C’/D,D’) embryos at nuclear cycle (NC)12 (late syncytial blastoderm) are shown with nuclei (Hoescht, blue), centrosomes (Cnn, red), and cytoskeleton (Pnut, green). Though nuclei and their associated centrosomes reach the anterior terminus of control embryos, they do not bulge outward (arrowhead, A). In some zldi1m embryos, nuclei and their associated centrosomes protrude outward, mirroring pole bud behavior (asterisk, C) Scale bar represents 10 µm.
Figure 10
At the anterior pole of zygotic zld and clamp knockdown embryos, protrusions appear shortly after the formation of primordial germ cells (PGCs) at the posterior pole.
Zero- to four-hr-old paraformaldehyde-fixed embryos were stained with anti-Peanut (anti-Pnut), anti-Vas, and anti-Centrosomin (anti-Cnn) antibodies to assess morphology at the poles. Anterior (A/C/E) and posterior (B/D/F) views of a single representative egfpim (A/B), zldi2z (C/D), or clampiz (E/F) embryo are shown with nuclei (Hoescht, blue), centrosomes (Cnn, magenta), cytoskeleton (Pnut, green), and PGCs (Vasa, red). (All three embryos are nuclear cycle [NC]12, late syncytial blastoderm stage.) Though nuclei and their associated centrosomes reach the anterior terminus of control embryos, they do not bulge outward (arrowhead, A). In some zld2z embryos, nuclei and their associated centrosomes protrude outward, mirroring pole bud behavior (asterisk, C). clampiz embryos also form anterior bulges (asterisk, E). Scale bar represents 10 µm.
Figure 11 with 1 supplement
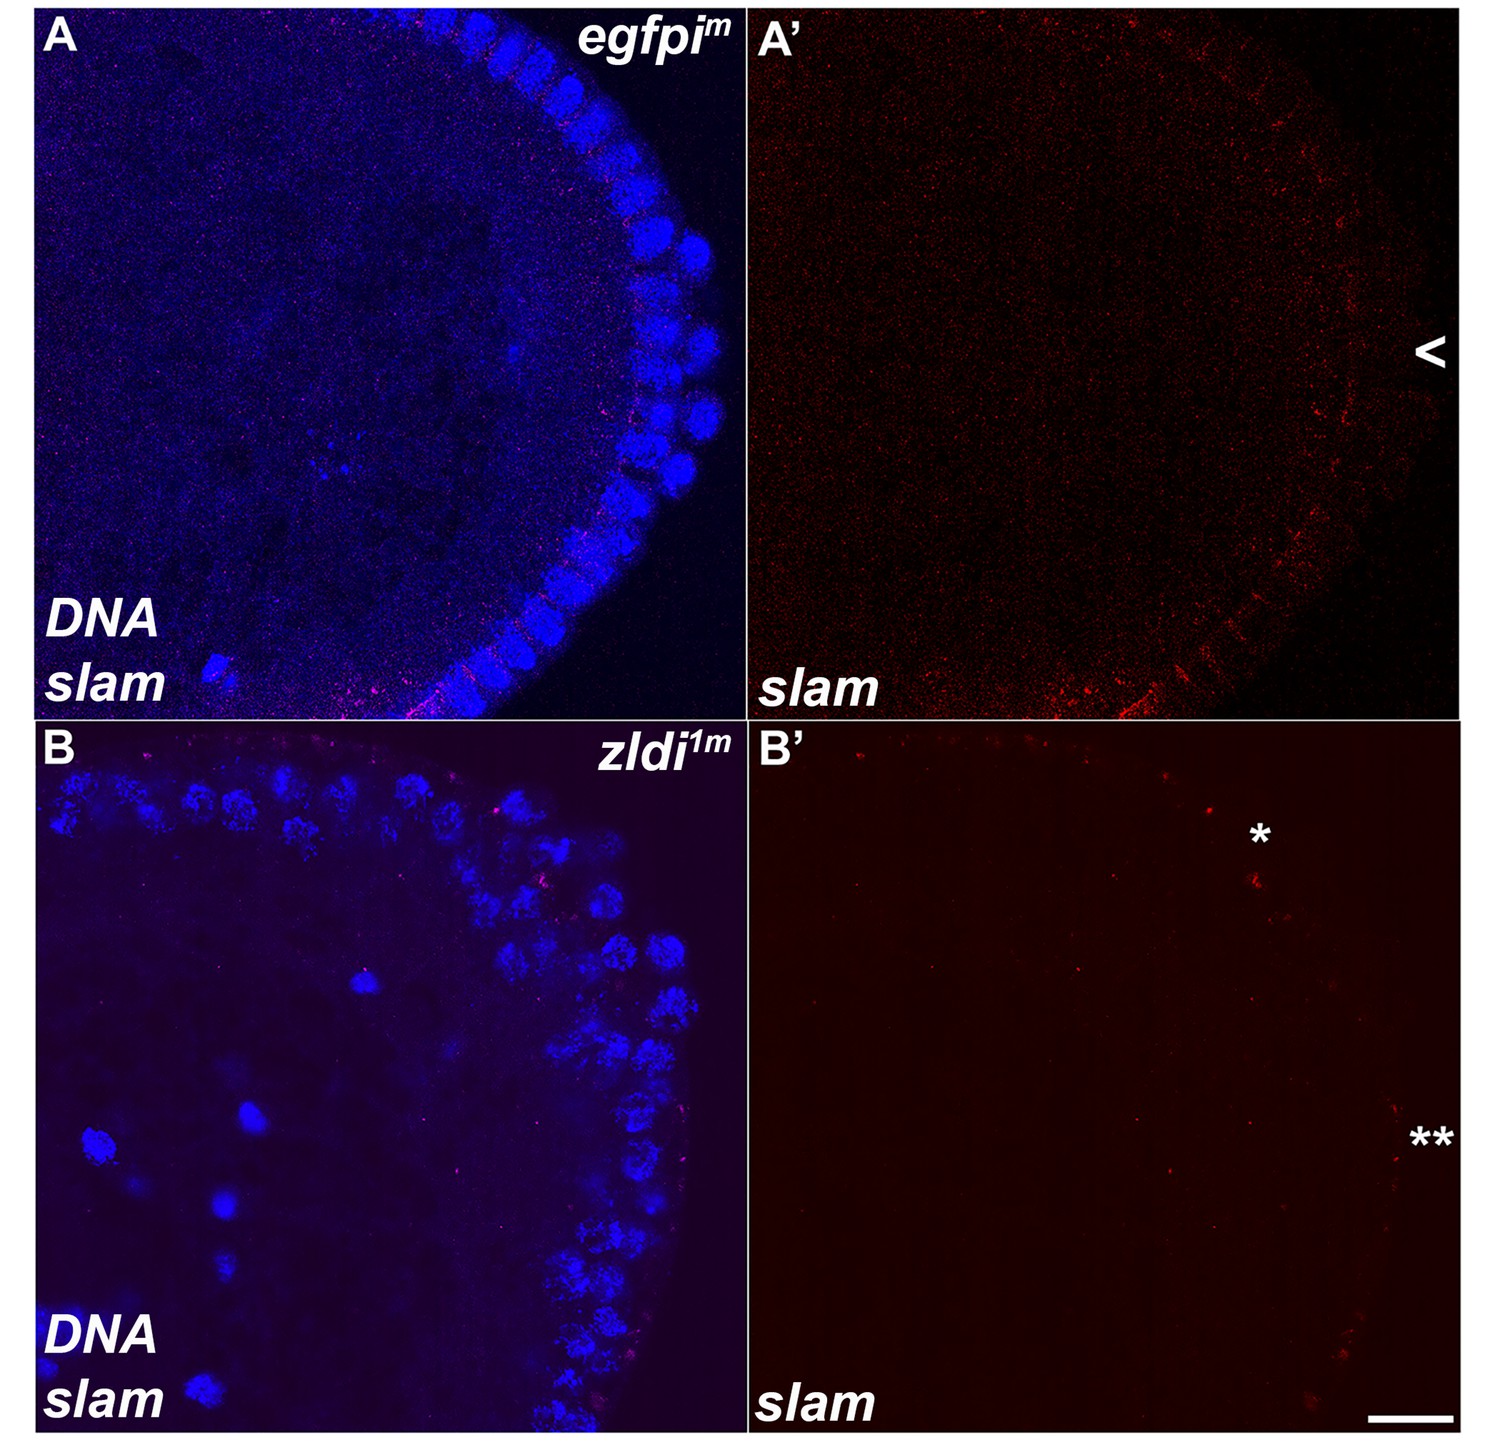
Unlike wild type, a subset of embryonic primordial germ cells (PGCs) from zld-compromised embryos displays slam transcripts.
Single molecule fluorescence in situ hybridization (smFISH) was performed using probes specific for slam on 0- to 4-hr-old embryos to assess the status of transcription in PGCs. While slam is never expressed in (A) egfpim control PGCs, some (B) zldi1m PGCs display ectopic slam transcription (asterisk). Posterior poles of representative syncytial blastoderm embryos (nuclear cycle [NC]13, late syncytial blastoderm) are shown with slam RNA visualized in magenta and Hoescht DNA dye in blue. Scale bar represents 10 µm.
Figure 11—figure supplement 1
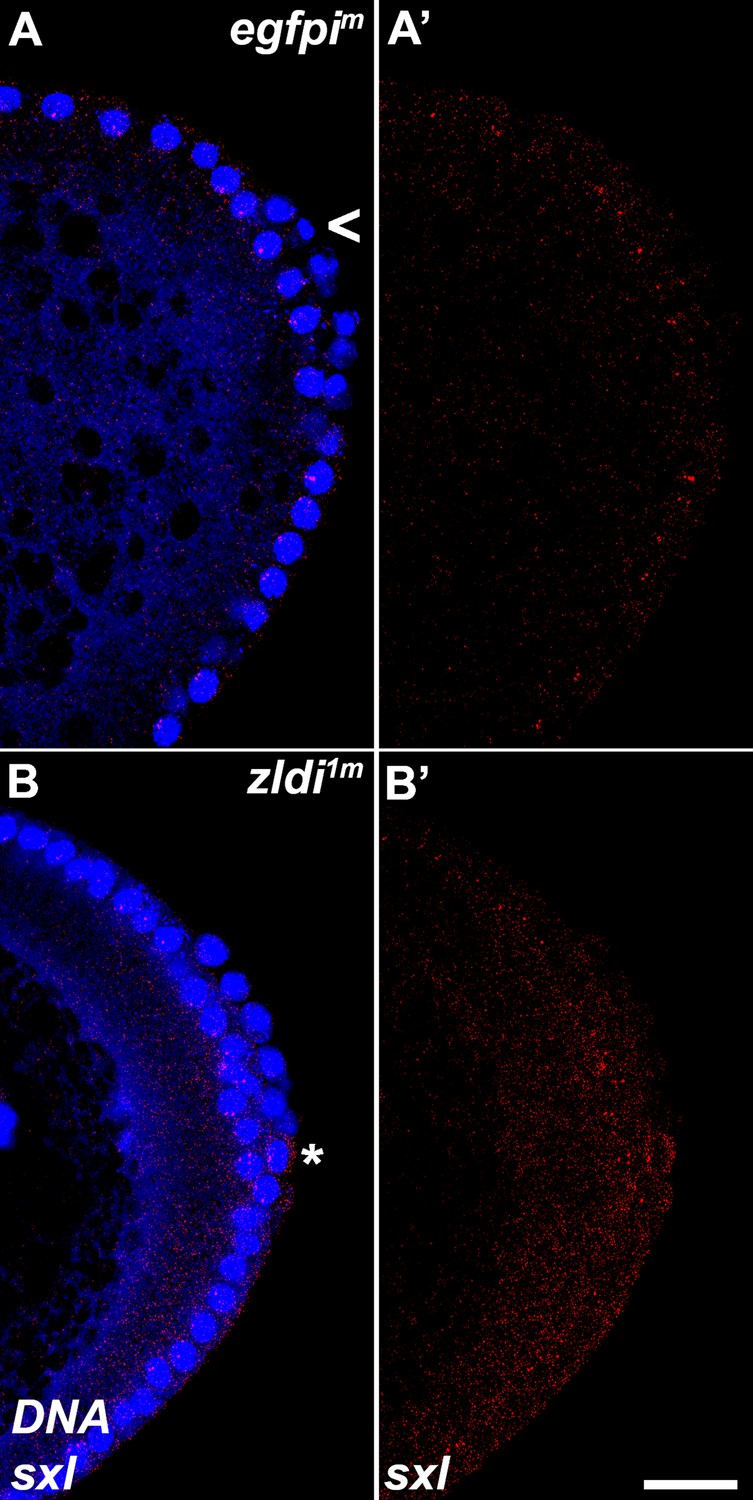
zld-compromised embryos ectopically express Sxl-Pe in embryonic primordial germ cells (PGCs).
Single molecule fluorescence in situ hybridization (smFISH) was performed using probes specific for Sxl-Pe on 0- to 4-hr-old embryos to assess the status of transcription in PGCs. While Sxl is never transcribed in (A) egfpim control PGCs, some (B) zldi1m PGCs activate Sxl-Pe (asterisk). Posterior poles of representative nuclear cycle (NC)12 (late syncytial blastoderm) embryos are shown with Sxl RNA visualized in red and Hoescht DNA dye in blue. Scale bar represents 10 µm.
Figure 12
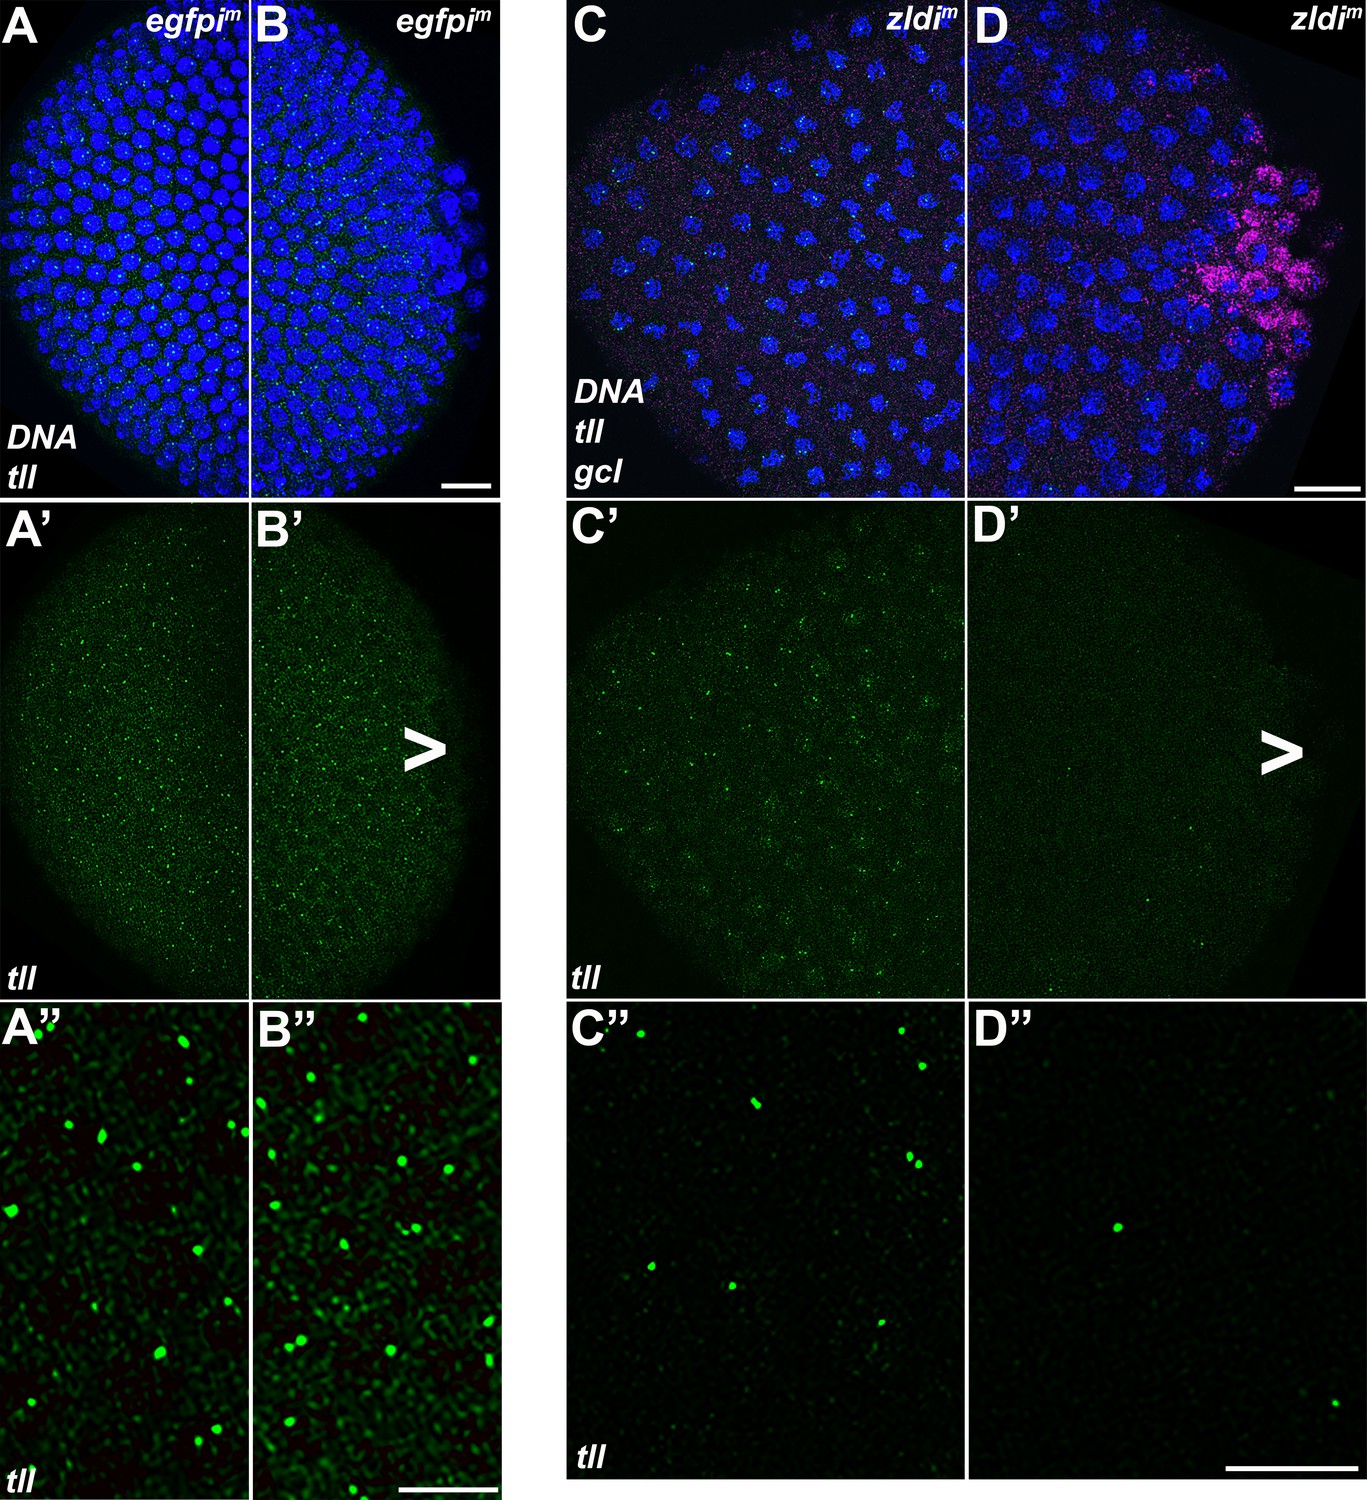
tll somatic transcription is notably decreased in the embryonic posterior upon zld knockdown.
Single molecule fluorescence in situ hybridization (smFISH) was performed using probes specific for tll (green) and gcl (magenta) on 0- to 4-hr-old egfpim (A/B) and zldi1m (C/D) embryos to assess the status of somatic transcription at the anterior and posterior poles. Maximum intensity projections of anterior (A–A”,C–C”) and posterior (B–B”,D–D”) poles of representative late syncytial blastoderm (nuclear cycle [NC]13) embryos are shown with tll RNA visualized in green, gcl RNA in magenta, and Hoescht DNA dye in blue. Scale bar represents 10 µm. While tll transcription is comparable between anterior (A’ and A”) and posterior (B’ and B”) termini of egfpim embryos, transcript levels are reduced in zldi1m embryos, to a greater extent at the posterior pole (D’ and D”) as compared to the anterior (C’ and C”) tll is not expressed in primordial germ cells (PGCs) (arrowhead).
Figure 13
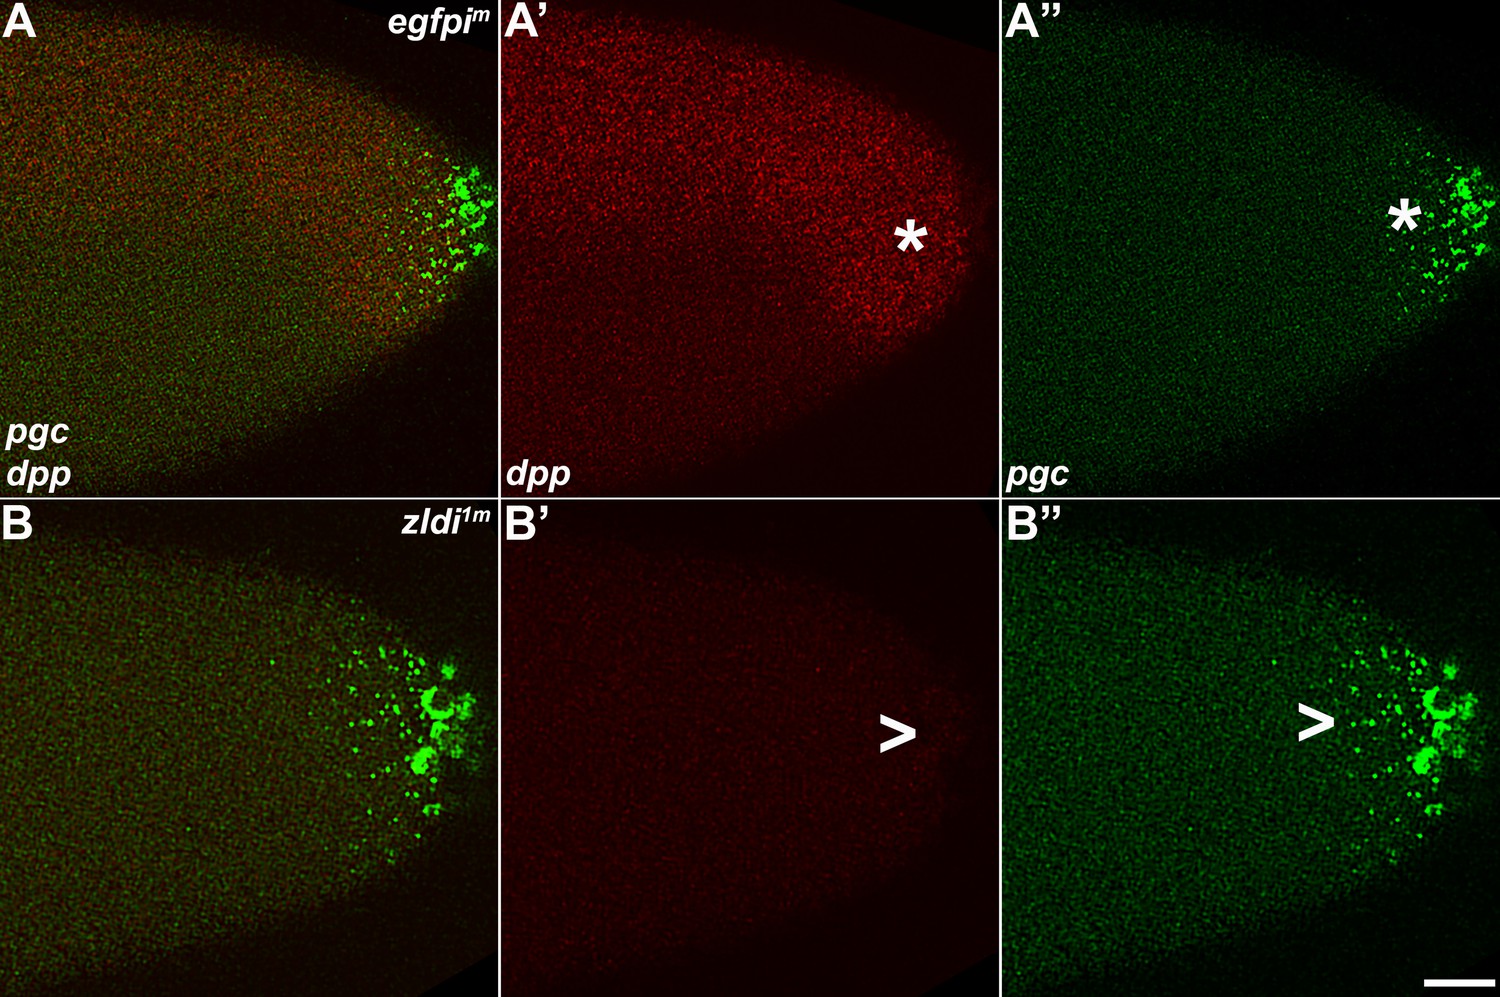
As the germ plasm RNAs spread into the posterior soma, somatic transcription of decapentaplegic (dpp) decreases in zld-compromised embryos.
Single molecule fluorescence in situ hybridization (smFISH) was performed using probes specific for dpp (A’ and B’) and polar granule component (pgc) (A” and B”) on 0- to 4-hr-old embryos to assess the status of somatic transcription at the posterior pole. egfpim embryos (A–A”) express dpp dorsally (red, B, asterisk), but these expression levels are compromised in zldi1m embryos (B–B”,B’, arrowhead), particularly those displaying more severe germ plasm spread as shown by pgc (green, marked with an arrowhead in panel B”). Scale bar represents 10 µm. Images shown are maximum intensity projections through embryos at nuclear cycle (NC)13 (late syncytial blastoderm) to capture total germ plasm localization and dpp expression throughout relevant focal planes (in Z).
Figure 14

Spreading of germ plasm RNAs correlates with enhanced reduction in decapentaplegic (dpp) transcripts in the posterior half.
Single molecule fluorescence in situ hybridization (smFISH) was performed using probes specific for dpp (red, A–A” and B–B”) and polar granule component (pgc) (green, A and B) on 0- to 4-hr-old zldi1m embryos to assess the status of somatic transcription at the anterior and posterior poles. While zldi1m embryos express dpp (red) at the anterior (A–A”), these expression levels are compromised in the posterior half (B–B”) as seen by comparison between A’ (anterior half, arrowhead) and B’ (posterior half, arrowhead). A” (anterior) and B” (posterior) show magnified versions. (Note the difference in signal intensities between nuclei marked with a single asterisk in panel A” with a double asterisk in B”, respectively.) Scale bar represents 10 µm. Images shown are maximum intensity projections through an embryo at nuclear cycle (NC)13 (late syncytial blastoderm) to capture total germ plasm localization and dpp expression throughout relevant focal planes (in Z).
Author response image 1
Author response image 2
Tables
Table 1
Primordial germ cell (PGC) counts decrease with zld or clamp knockdown.
| Genotype | Mean PGCs | SD | N |
|---|---|---|---|
| egfpim | 19.2 | 3.67 | 12 |
| zldi1m | 13.7 | 6.13 | 15 |
| egfpiz | 19.7 | 1.95 | 10 |
| zldi2z | 12.9 | 3.94 | 8 |
| clampiz | 12.6 | 5.48 | 8 |
-
Table 1—source data 1
Raw data summarized in Table 1: Primordial germ cell (PGC) counts for individual embryos.
- https://cdn.elifesciences.org/articles/78188/elife-78188-table1-data1-v1.xlsx
Table 2
Mislocalization of germ plasm increases in zld-compromised embryos as embryogenesis progresses.
| Defects | |||||
|---|---|---|---|---|---|
| Genotype | Stage | None | Moderate | Severe | Total |
| egfpim | 66 (84.6%) | 12 (15.4%) | 0 (0%) | 78 | |
| ESB | 24 (85.7%) | 4 (14.3%) | 0 (0%) | 28 | |
| LSB | 42 (84%) | 8 (16%) | 0 (0%) | 50 | |
| zldi1m | 24 (27.9%) | 49 (57%) | 13 (15.1%) | 86 | |
| ESB | 11 (34.3%) | 15 (46.9%) | 6 (18.8%) | 32 | |
| LSB | 13 (24%) | 34 (63%) | 7 (13%) | 54 | |
-
Table 2—source data 1
Raw data summarized in Table 2: Embryonic stage and pole plasm spreading phenotype for individual embryos.
- https://cdn.elifesciences.org/articles/78188/elife-78188-table2-data1-v1.xlsx
Table 3
Summary of aberrant germline/somatic developmental phenotypes observed in zld knockdown embryos.
| Phenotype | Unit classified | Phenotypic frequency in each genotype | ||
|---|---|---|---|---|
| egfpim | zldi1m | zldi2m | ||
| Germ plasm spread | Embryos | 12/99 (12.1%) | 63/110 (57.3%) | 13/23 (56.5%) |
| Pre-syncytial blastoderm somatic centrosome defects | Nuclei | 3/51 (5.9%) | 13/37 (35.1%) | ND |
| Syncytial blastoderm somatic centrosome defects | Embryos | 2/15 (13.3%) | 15/18 (8.3%) | ND |
| Pole bud/PGC centrosome defects | Nuclei | 4/31 (12.9%) | 16/30 (53.3%) | ND |
| Anterior protrusions | Embryos | 1/12 (8.3%) | 11/18 (61.1%) | ND |
| slam expression in PGCs | Embryos | 0/30 (0%) | 2/15 (13.3%) | 1/14 (7.1%) |
| Sxl-Pe expression in PGCs | Embryos | 0/30 (0%) | 5/31 (16.1%) | 0/14 (0%) |
| tll somatic transcription levels | Embryos | 0/10 (0%) | 8/11 (72.7%) | ND |
| dpp somatic transcription levels | Embryos | 0/11 (0%) | 10/13 (76.9%) | ND |
Key resources table
| Reagent type (species) or resource | Designation | Source or reference | Identifiers | Additional information |
|---|---|---|---|---|
| Genetic reagent (Drosophila melanogaster) | Maternal-tubulin-GAL4 (67.15) | Eric Wieschaus | ||
| Genetic reagent (Drosophila melanogaster) | UAS-egfp RNAi | Bloomington Drosophila Stock Center | BDSC: 41552; RRID:BDSC_41552 | |
| Genetic reagent (Drosophila melanogaster) | UAS-zld-shRNA (zldi1) | Christine Rushlow | Maintained in the lab of C Rushlow | |
| Genetic reagent (Drosophila melanogaster) | UAS-zld RNAi (zldi2) | Bloomington Drosophila Stock Center | BDSC: 42016; RRID:BDSC_42016 | |
| Genetic reagent (Drosophila melanogaster) | UAS-clamp RNAi | Bloomington Drosophila Stock Center | BDSC: 27080; RRID:BDSC_27080 | |
| Antibody | Anti-Vasa (rat polyclonal) | Paul Lasko | RRID:AB_2568498 | Used 1:1000 |
| Antibody | Anti-Vasa (mouse monoclonal) | Developmental Studies Hybridoma Bank | DSHB: 46F11; RRID:AB_10571464 | Used 1:10 |
| Antibody | Anti-Cnn (rabbit polyclonal) | Thomas Kaufman | Used 1:500 | |
| Antibody | Anti-Pnut (mouse monoclonal) | Developmental Studies Hybridoma Bank | DSHB: 4C9H4; RRID: AB_528429 | Used 1:10 |
| Sequence-based reagent | pgc | Eagle et al., 2018 | smFISH probe set | Exonic probes |
| Sequence-based reagent | gcl | Eagle et al., 2018 | smFISH probe set | Exonic probes |
| Sequence-based reagent | osk | Little et al., 2015 | smFISH probe set | Exonic probes |
| Sequence-based reagent | Sxl-Pe | Thomas Gregor | smFISH probe set | Intronic probes |
| Sequence-based reagent | slam | Colonnetta et al., 2022 | smFISH probe set | Exonic probes |
| Sequence-based reagent | tll | Colonnetta et al., 2021b; Colonnetta et al., 2022 | smFISH probe set | Exonic probes |
| Sequence-based reagent | dpp | This paper; Biosearch Technologies | smFISH probe set | Exonic probes; sequences available in Supplementary file 1 |
| Other | Hoescht | Invitrogen | Thermo Fisher Scientific: H3570 | Nuclear dye |
Additional files
-
Supplementary file 1
Decapentaplegic (dpp) exonic single molecule fluorescence in situ hybridization (smFISH) probe sequences.
- https://cdn.elifesciences.org/articles/78188/elife-78188-supp1-v1.xlsx
-
Transparent reporting form
- https://cdn.elifesciences.org/articles/78188/elife-78188-transrepform1-v1.docx
Download links
A two-part list of links to download the article, or parts of the article, in various formats.
Downloads (link to download the article as PDF)
Open citations (links to open the citations from this article in various online reference manager services)
Cite this article (links to download the citations from this article in formats compatible with various reference manager tools)
Germline/soma distinction in Drosophila embryos requires regulators of zygotic genome activation
eLife 12:e78188.
https://doi.org/10.7554/eLife.78188


