Timely coupling of sleep spindles and slow waves linked to early amyloid-β burden and predicts memory decline
- GIGA-Cyclotron Research Centre-In Vivo Imaging, University of Liège, Belgium
- Psychology and Cognitive Neuroscience Research Unit, University of Liège, Belgium
- Physip SA, France
- Department of Neurology, University Hospital of Liège, Belgium
- GIGA-In Silico Medicine, University of Liège, Belgium
- Centre for Advanced Research in Sleep Medicine, Université de Montréal, Canada
Figures
Figure 1
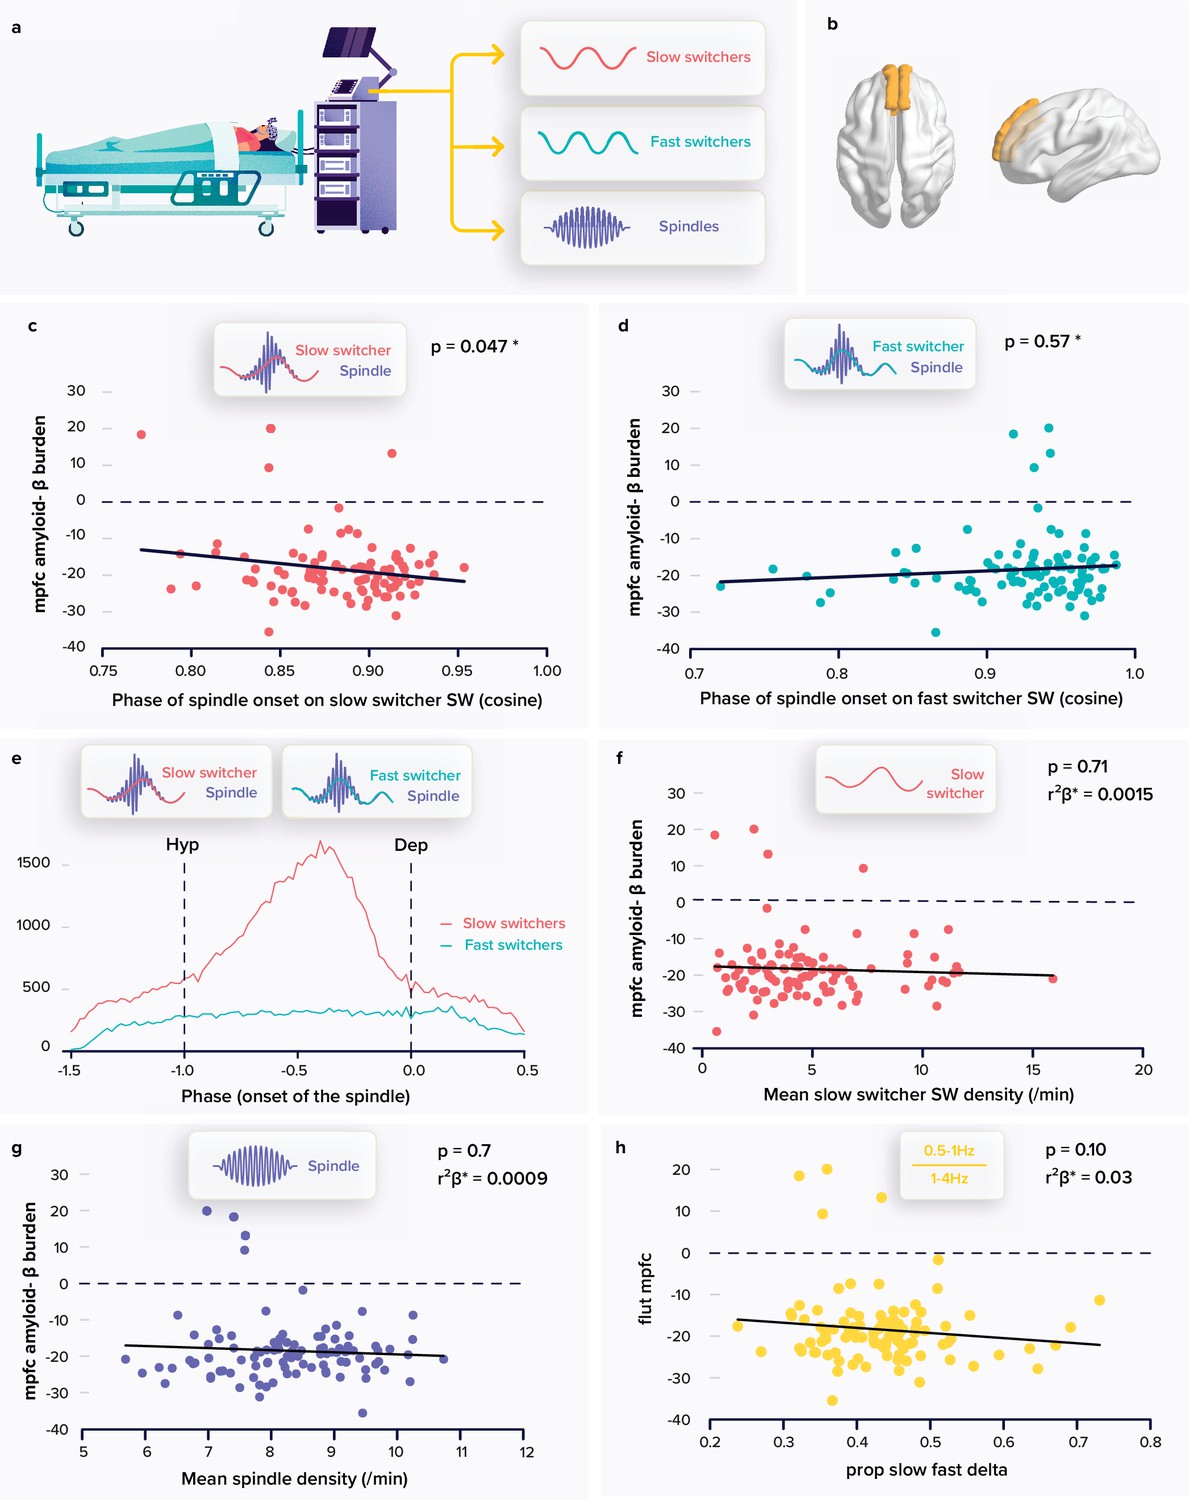
Relationships between spindle and slow wave (SW) metrics and the amyloid-β (Aβ) burden.
(a) Following a screening night and a regular sleep-wake schedule for 1 week, the participants (N=100; 59.4±5.3 years; 68 women) slept in the lab at their habitual times under electroencephalography (EEG) recording. We extracted the density and coupling of spindles and fast and slow switcher SWs over frontal derivations during N2 and N3 sleep stage from EEG recordings. (b) PET signal uptake was measured over the medial prefrontal cortex (MPFC) depicted in yellow. (c) Significant negative association between the MPFC Aβ burden and spindle-slow switcher SW coupling. (d) No association between the MPFC Aβ burden and spindle-fast switcher SW coupling. (e) Analysis of the anchoring of the spindles onto the SWs yielded a difference in preferential coupling phase of slow (red) and fast switcher SWs (light blue) (the y axis represents the number of spindles starting at a specific SW phase). (f) No association between the MPFC Aβ burden and slow switcher SW density. (g) No association between the MPFC Aβ burden and spindle density. (h) No association between the MPFC Aβ burden and the ratio between .5-to-1 Hz over 1-to-4 Hz overnight cumulated EEG power. Except for *, p-values and r²β* were computed from generalised linear mixed models (GLMMs) referred to in the text. Simple regressions were used only for a visual display and do not substitute the GLMM outputs. *Post-hoc test p-value is reported while Aβ burden-by-SW type interaction yielded p=0.009; r²β*=0.07 (see text). We used the cosine value of the phase of coupling in the GLMMs (see Materials and Methods).
Figure 2
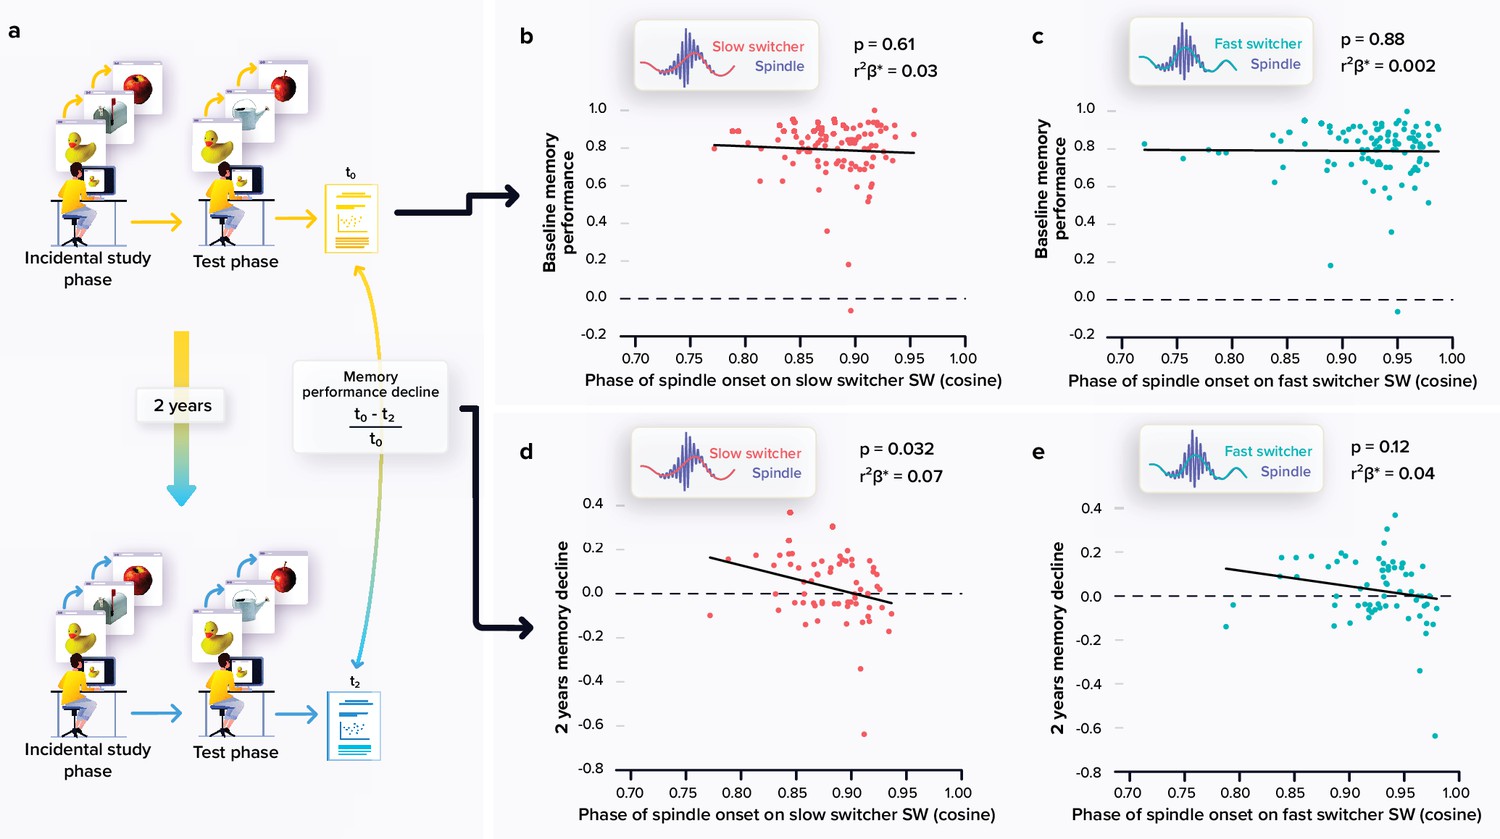
Relationships between memory performance and coupling between spindles and slow waves (SWs).
(a) Memory performance was assessed through the Mnemonic Similarity Task (MST) where participants have to recognise previously encoded images in series of new or lure images (see Materials and methods). (b) No association between the baseline MST performance and spindle-slow switcher SW coupling. (c) No association between the baseline MST performance and spindle-fast switcher SW coupling. (d) Significant negative association between the 2 years relative change in MST performance and spindle-slow switcher SW coupling. (e) No association between the 2 years relative changes in MST performance and spindle-fast switcher SW coupling. p-values and r²β* were computed from generalised linear mixed models (GLMMs) referred to in the text. Simple regressions were used only for a visual display and do not substitute the GLMM outputs. We used the cosine value of the phase of coupling in the GLMMs (see Materials and methods).
Figure 3
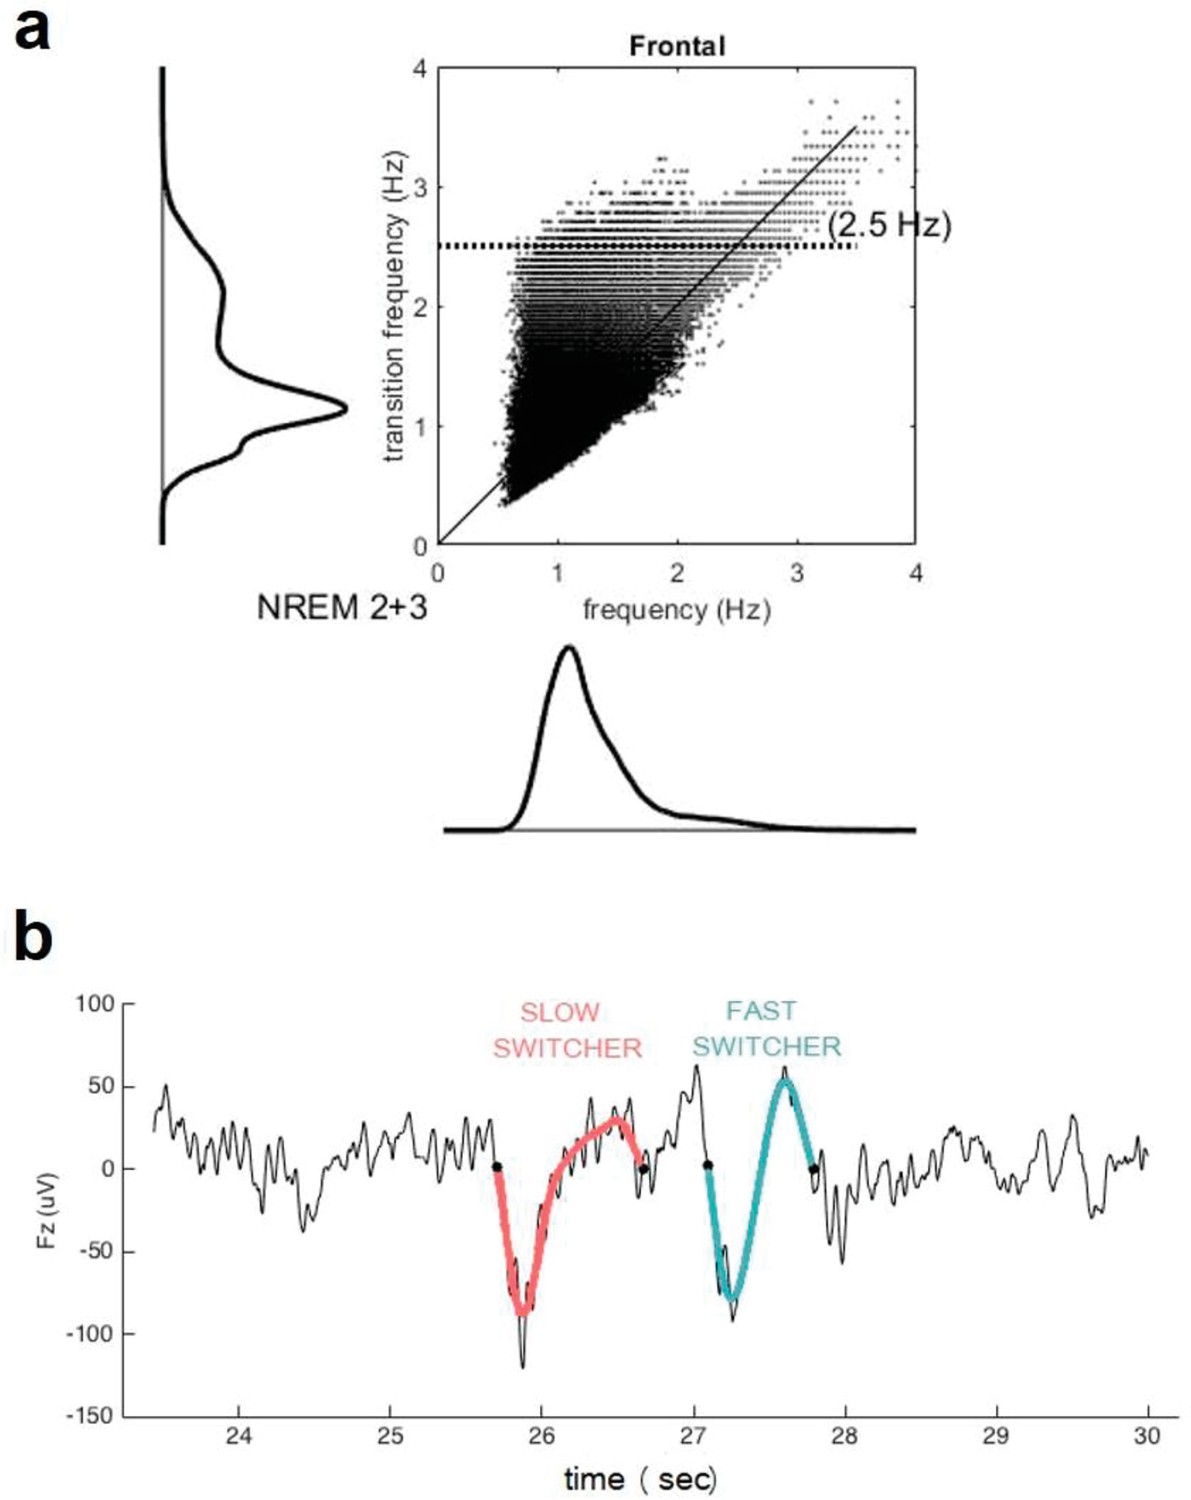
Transition frequency and mean frequency of slow waves (SWs).
(a) Distribution of the mean frequency of the SWs (x axis) versus their transition frequency (y axis) for both NREM2 and NREM3 sleep stages in the entire study sample. One can observe a double distribution of the frequency of transition but not in the overall frequency. This shows that a faster or slower frequency of transition does not necessarily translate to an overall faster or slower SW. Table 1 indicates, however, that duration of SW is significantly different between slow and fast switcher SWs. (b) Examples of slow switcher (red) and fast switcher SW (light blue) extracted from the electroencephalography signal for illustration purposes.
Tables
Table 1
Sample characteristics.
| Baseline (N=100) | Follow up (N=66) | |
|---|---|---|
| Sex | 68 ♀ / 32 ♂ | 44 ♀ / 22 ♂ |
| Age (years) | 59.4±5.3 (50–69) | 59.9±5.4 (50–69) |
| Education (years) | 15.2±3.0 (9–25) | 14.9±3.3 (9–25) |
| Total sleep time (TST) (minutes, electroenchephalography [EEG]) | 392.8±45.9 (229–495.5) | 390.4±45.9 (264.0–495.5) |
| Time spent in N1 sleep stage (% of TST, EEG) | 6.2±2.8 (0.6–15.6) | 6.4±3.0 (0.6–15.6) |
| Time spent in N2 sleep stage (% of TST, EEG) | 51.6±8.9 (31.4–75.7) | 50.3±8.5 (32.8–75.7) |
| Time spent in N3 sleep stage (% of TST, EEG) | 19.2±6.4 (7.2–38.3) | 19.7±6.5 (8.2–38.3) |
| Time spent in Rapid Eye Movement (REM) sleep (% of TST, EEG) | 23.1±6.8 (6.5–39.8) | 23.6±7.4 (6.5–39.8) |
| Mean slow waves (SW) density (number/minute of N2/N3) | 7.1±4.3 (0.8–19.2) | 6.9±4.0 (1.0–19.2) |
| Slow switchers | 4.9±3.1 (0.6–15.9)*** | 4.9±3.1 (0.6–15.9)*** |
| Fast switchers | 2.1±1.6 (0.1–8.8) | 2.0±1.3 (0.3–5.7) |
| Mean SW amplitude (µV) | 101.5±12.4 (76.0–128.2) | 101.0±12.3 (76.0–125.2) |
| Slow switchers | 104.5±13.7 (77.7–131.3)*** | 104.0±13.5 (77.7–130.5)*** |
| Fast switchers | 94.0±11.0 (73.0–130.1) | 93.0±10.1 (73.5–113.7) |
| Mean SW duration (1/frequency) (ms) | 822±66 (619–966) | 821±63 (642–948) |
| Slow switchers | 906±46 (759–1,023)*** | 904±43 (807–1,003)*** |
| Fast switchers | 671±46 (552–794) | 670±45 (559–783) |
| Mean SW transition frequency | 1.4±0.1 (1.1–1.8) | 1.4±0.1 (1.1–1.8) |
| Slow switchers | 1.1±0.0 (1.0–1.2)*** | 1.1±0.0 (1.0–1.2)*** |
| Fast switchers | 2.0±0.1 (1.9–2.2) | 2.0±0.1 (1.9–2.2) |
| Mean spindle density (number/minute of N2/N3) | 8.3±1.1 (5.7–10.7) | 8.1±1.0 (6.0–10.2) |
-
BMI, alcohol consumption, anxiety, and depression scores as well as sleepiness levels of the sample can be found in Chylinski et al., 2021. TST: total sleep time. Average values ± SD [range: min–max values]. ***A significant difference between slow and fast switcher SW at a p<0.001.
Additional files
Download links
A two-part list of links to download the article, or parts of the article, in various formats.
Downloads (link to download the article as PDF)
Open citations (links to open the citations from this article in various online reference manager services)
Cite this article (links to download the citations from this article in formats compatible with various reference manager tools)
Timely coupling of sleep spindles and slow waves linked to early amyloid-β burden and predicts memory decline
eLife 11:e78191.
https://doi.org/10.7554/eLife.78191


