Trisomy 21 induces pericentrosomal crowding delaying primary ciliogenesis and mouse cerebellar development
- Department of Cell and Developmental Biology, University of Colorado Anschutz Medical Campus, United States
- Linda Crnic Institute for Down Syndrome, University of Colorado Anschutz Medical Campus, United States
- Molecular, Cellular, and Developmental Biology, University of Colorado Boulder, United States
- Jackson Laboratory, United States
- Department of Pharmacology, University of Colorado Anschutz Medical Campus, United States
- Department of Pediatrics, Section of Developmental Biology, University of Colorado Anschutz Medical Campus, United States
Figures
Figure 1 with 1 supplement
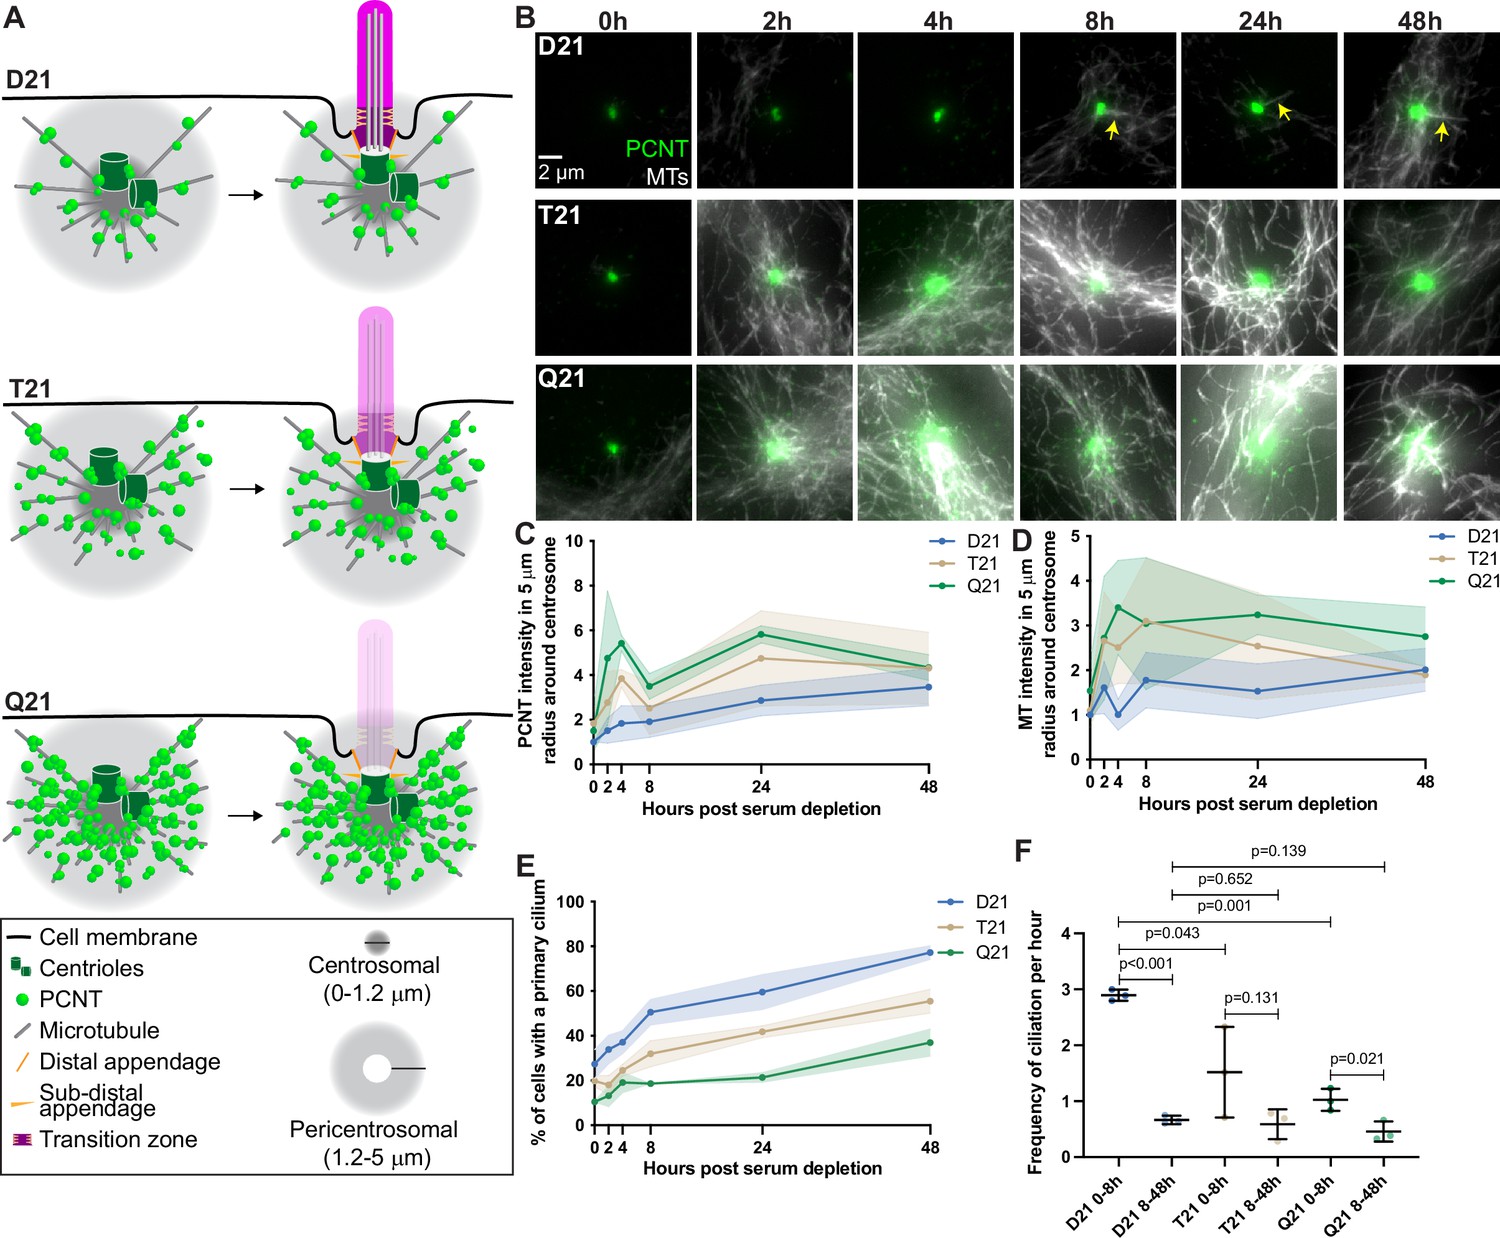
Rapid PCNT and microtubule reorganization upon G0 arrest increases with HSA21 dosage.
(A) Model figure showing the three main consequences of elevated PCNT in trisomy 21 (T21) and tetrasomy 21 (Q21) compared to disomy 21 (D21) cells: (1) PCNT nucleates more microtubules; (2) PCNT forms large protein aggregates on microtubules; and (3) PCNT nucleates microtubules further away from the centrosome. These changes occur predominantly in the pericentrosomal region defined as 1.2–5 µm from the centroid of the centrosome. (B) Representative confocal images from time course experiments of RPE1 D21, T21, and Q21 cells grown on coverslips and serum depleted for 0, 2, 4, 8, 24, and 48 hr. Cells were stained with DM1a to label microtubules (MTs) and PCNT. Arrows point to cilium labeled by DM1a staining. (C) Quantitation of PCNT intensities in a 5 µm radial circle around the centrosome throughout the time course normalized to D21 average at 0 hr. Graph shows mean ± SD. N=3. (D) Quantitation of microtubule intensities in a 5 µm radial circle around the centrosome throughout the time course normalized to D21 average at 0 hr. Graph shows mean ± SD. N=3. (E) Quantitation of ciliation frequency throughout the time course using DM1a as a marker for cilia. Graph shows mean ± SD. N=3. (F) Quantitation of ciliation frequency per hour calculated by subtracting the percentage of ciliated cells at the starting time point from the percentage of ciliated cells at the ending time point and dividing the result by the total number of hours. Graph shows mean ± SD. N=3. Two-tailed unpaired t-test.
-
Figure 1—source data 1
Values for biological and technical replicates for graphs in Figure 1 and Figure 1—figure supplement 1.
- https://cdn.elifesciences.org/articles/78202/elife-78202-fig1-data1-v1.xlsx
Figure 1—figure supplement 1
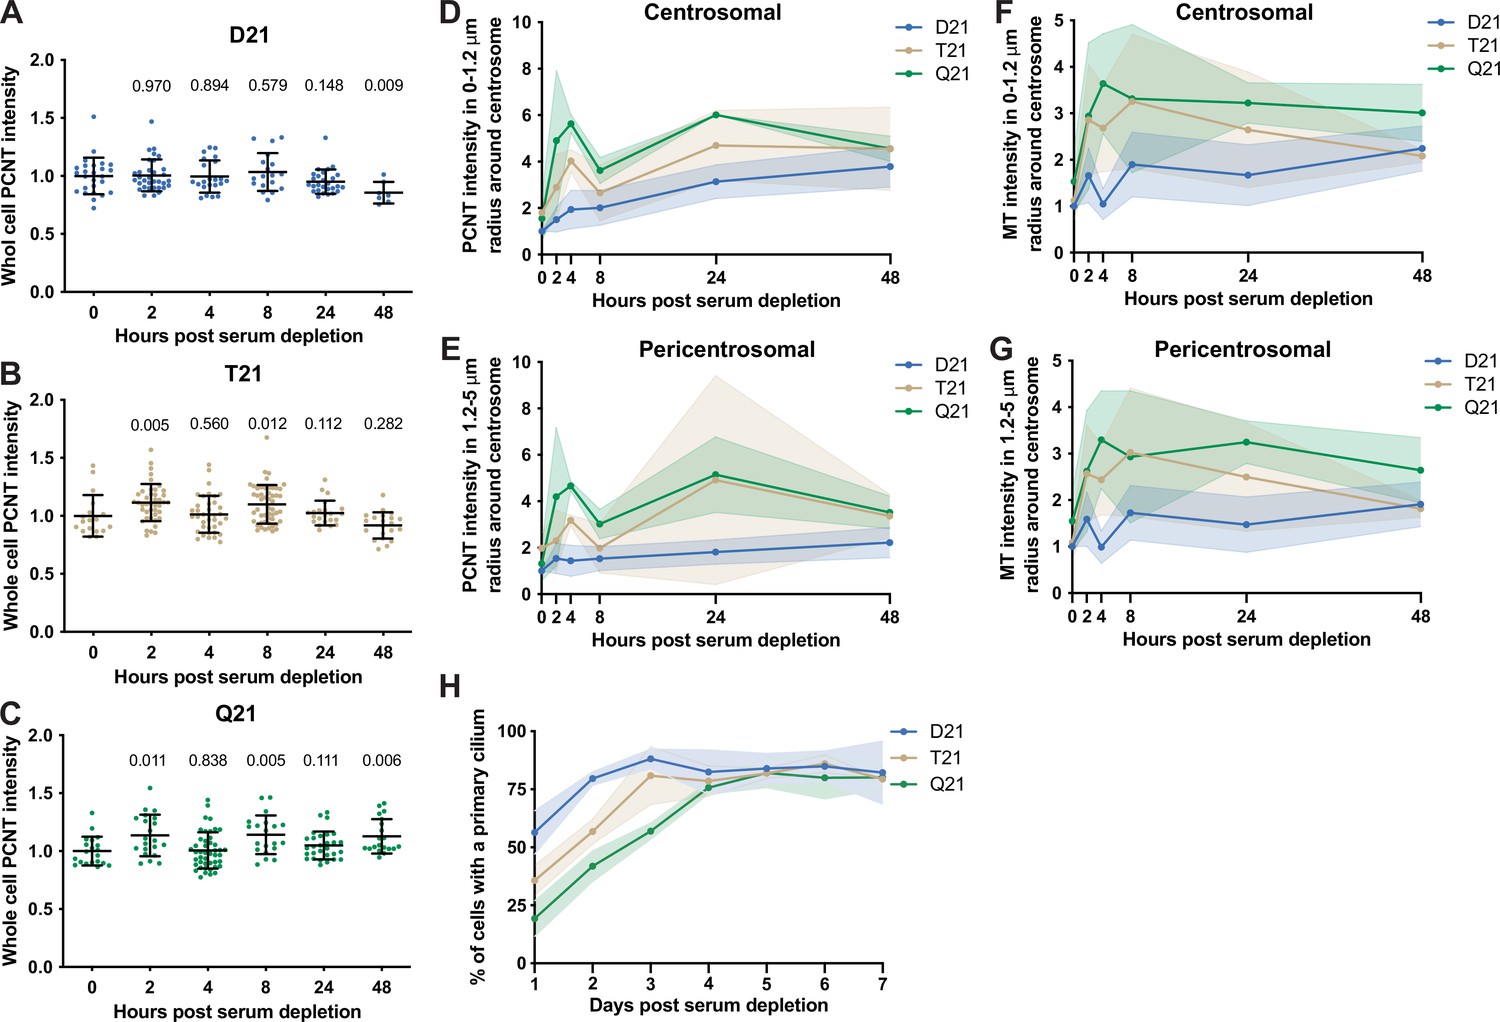
Rapid PCNT and microtubule reorganization upon G0 arrest increases with HSA21 dosage.
(A–C) Quantitation of whole cell PCNT intensities for D21 (A), T21 (B), and Q21 (C) cells throughout the time course normalized to average at 0 hr. Graphs show mean ± SD. N=3. Mann-Whitney U test. (D) Quantitation of centrosomal PCNT intensities in a 0–1.2 µm radial circle around the centrosome throughout the time course normalized to D21 average at 0 hr. Graph shows mean ± SD. N=3. (E) Quantitation of pericentrosomal PCNT intensities in a 1.2–5 µm radial circle around the centrosome throughout the time course normalized to D21 average at 0 hr. Graph shows mean ± SD. N=3. (F) Quantitation of centrosomal microtubule intensities in a 0–1.2 µm radial circle around the centrosome throughout the time course normalized to D21 average at 0 hr. Graph shows mean ± SD. N=3. (G) Quantitation of pericentrosomal microtubule intensities in a 1.2–5 µm radial circle around the centrosome throughout the time course normalized to D21 average at 0 hr. Graph shows mean ± SD. N=3. (H) Percentage of cells with a primary cilium over a 7-day time course. Graph shows mean ± SD. N=3.
Figure 2 with 4 supplements
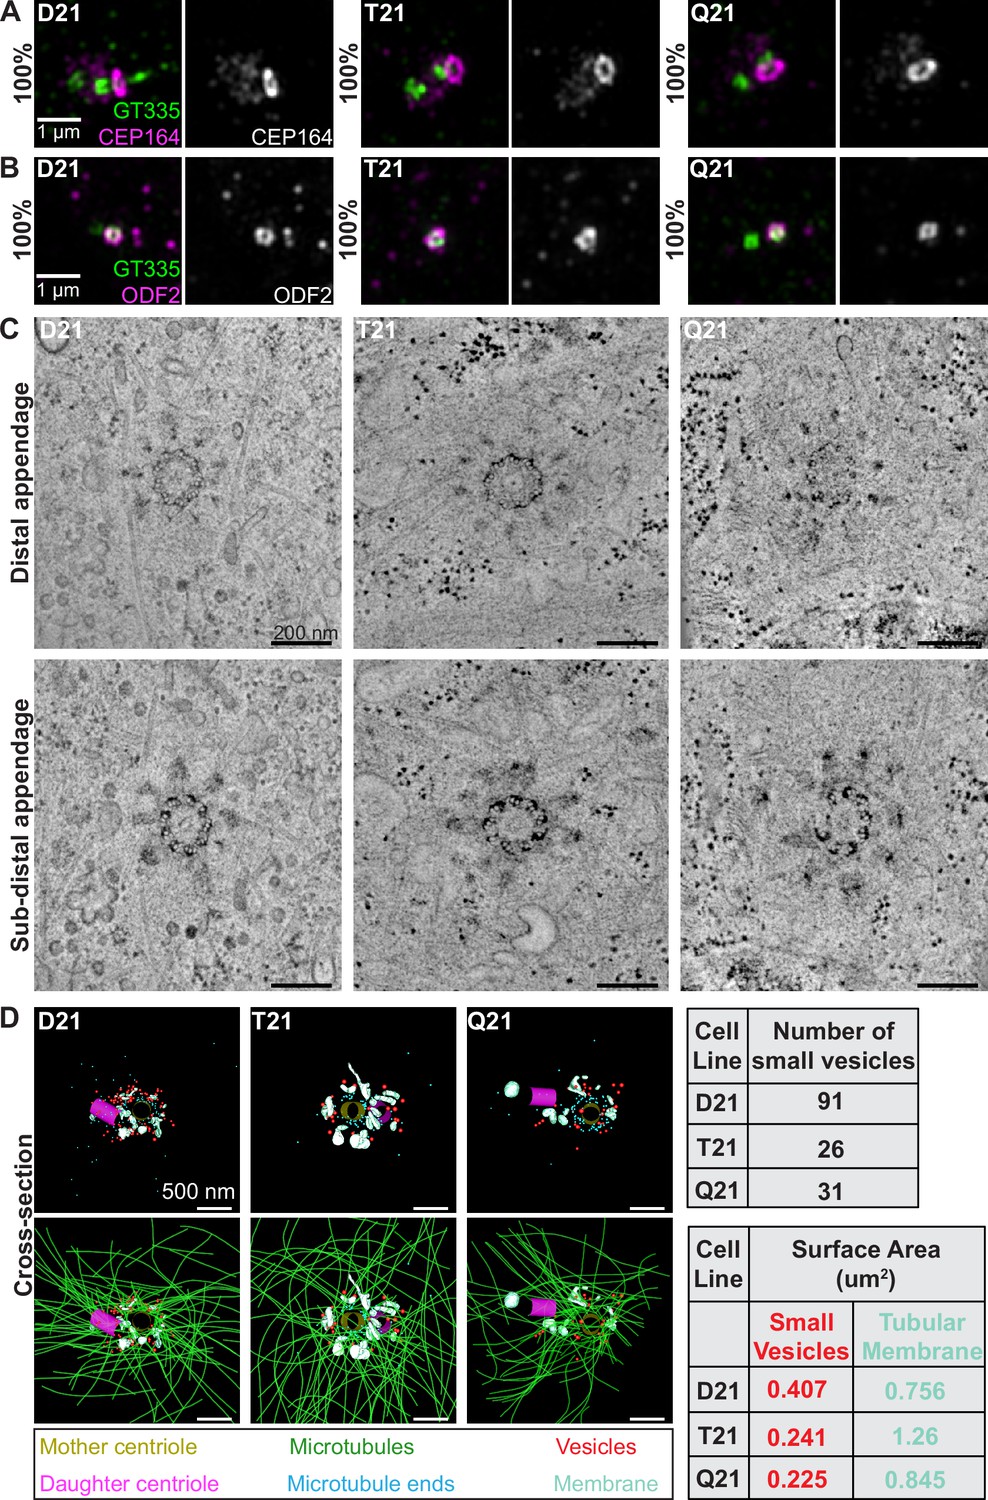
HSA21 ploidy does not affect centriole appendages but decreases vesicles at the mother centriole.
(A–B) Representative structured illumination microscopy images of RPE1 D21, T21, and Q21 cells grown on coverslips and serum depleted for 24 hr. Cells were stained with GT335 (centriole and cilia marker) and the distal appendage marker CEP164 (A) or the subdistal appendage marker ODF2 (B). Percentages represent cells with indicated marker at the mother centriole for 3 N’s. (C) Selected tomographic slices of RPE1 D21, T21, and Q21 cells serum depleted for 24 hr showing microtubule triplets and distal appendages (top panel) and subdistal appendages (bottom panel). (D) 3D models of structures at the centrosome in electron tomograms. Top row shows mother centriole (yellow), daughter centriole (magenta), microtubule minus ends (cyan spheres), vesicles (red), and smooth tubular membranes (blue-green). Bottom row shows microtubules (green), vesicles (red), and smooth membranes (blue-green) surrounding the centriole pair. Tomograms and models shown are of cells prior to ciliary vesicle formation. Tables on right display quantitation of the number of small red vesicles and smooth tubular membrane surface area measurements for D21, T21, and Q21 cells. N=2 reconstructed cells per cell line. Scale bars are 500 nm. Movies of the complete volume and rotating models can be found in Figure 2—videos 1–3.
Figure 2—figure supplement 1
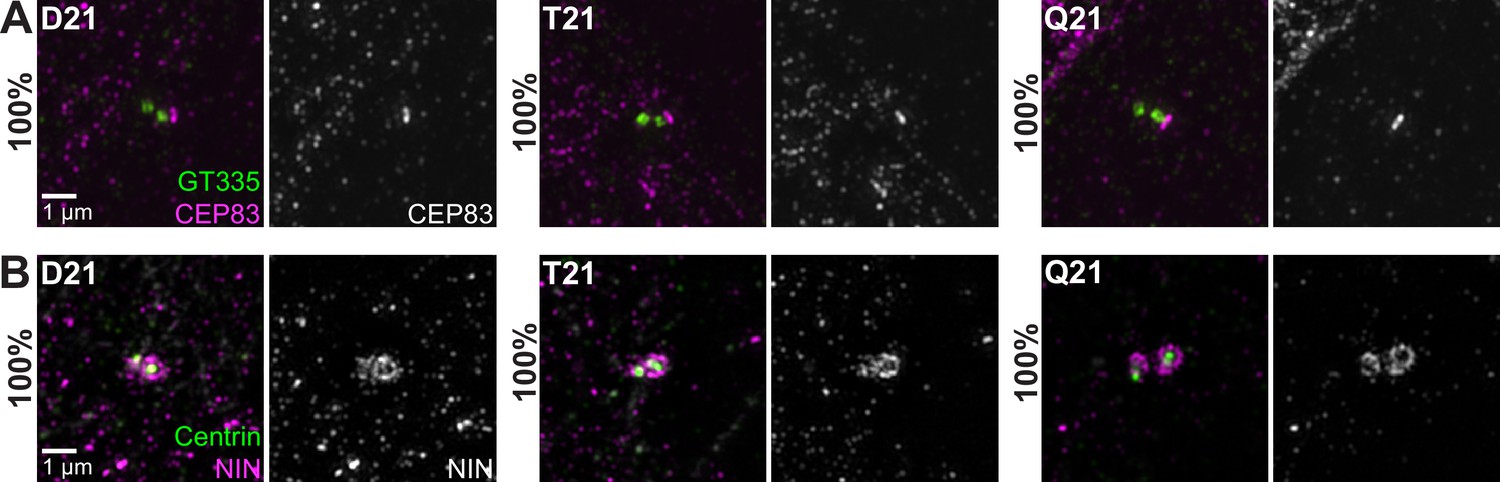
HSA21 ploidy does not affect centriole appendages.
(A, B) Representative structured illumination microscopy images of RPE1 D21, T21, and Q21 cells grown on coverslips and serum depleted for 24 hr. Cells were stained with GT335 and the distal appendage marker CEP83 (A) or centrin and the subdistal appendage marker Ninein (NIN) (B). Percentages represent cells with indicated marker for 3 N’s.
Figure 2—video 1
Movie of D21 cell from Figure 2 showing the electron tomogram volume, then model projecting from the image, then the model turning without image.
Mother centriole (yellow), daughter centriole (magenta), microtubule minus ends (cyan spheres), microtubules (green), vesicles (red spheres), and smooth tubular membrane (blue-green). Note the proximity of vesicles to microtubules.
Figure 2—video 2
Movie of T21 cell from Figure 2 showing the electron tomogram volume, then model projecting from the image, then the model turning without image.
Mother centriole (yellow), daughter centriole (magenta), microtubule minus ends (cyan spheres), microtubules (green), vesicles (red spheres), and smooth tubular membrane (blue-green). Note the proximity of vesicles to microtubules.
Figure 2—video 3
Movie of Q21 cell from Figure 2 showing the electron tomogram volume, then model projecting from the image, then the model turning without image.
Mother centriole (yellow), daughter centriole (magenta), microtubule minus ends (cyan spheres), microtubules (green), vesicles (red spheres), and smooth tubular membrane (blue-green). Note the proximity of vesicles to microtubules.
Figure 3 with 1 supplement
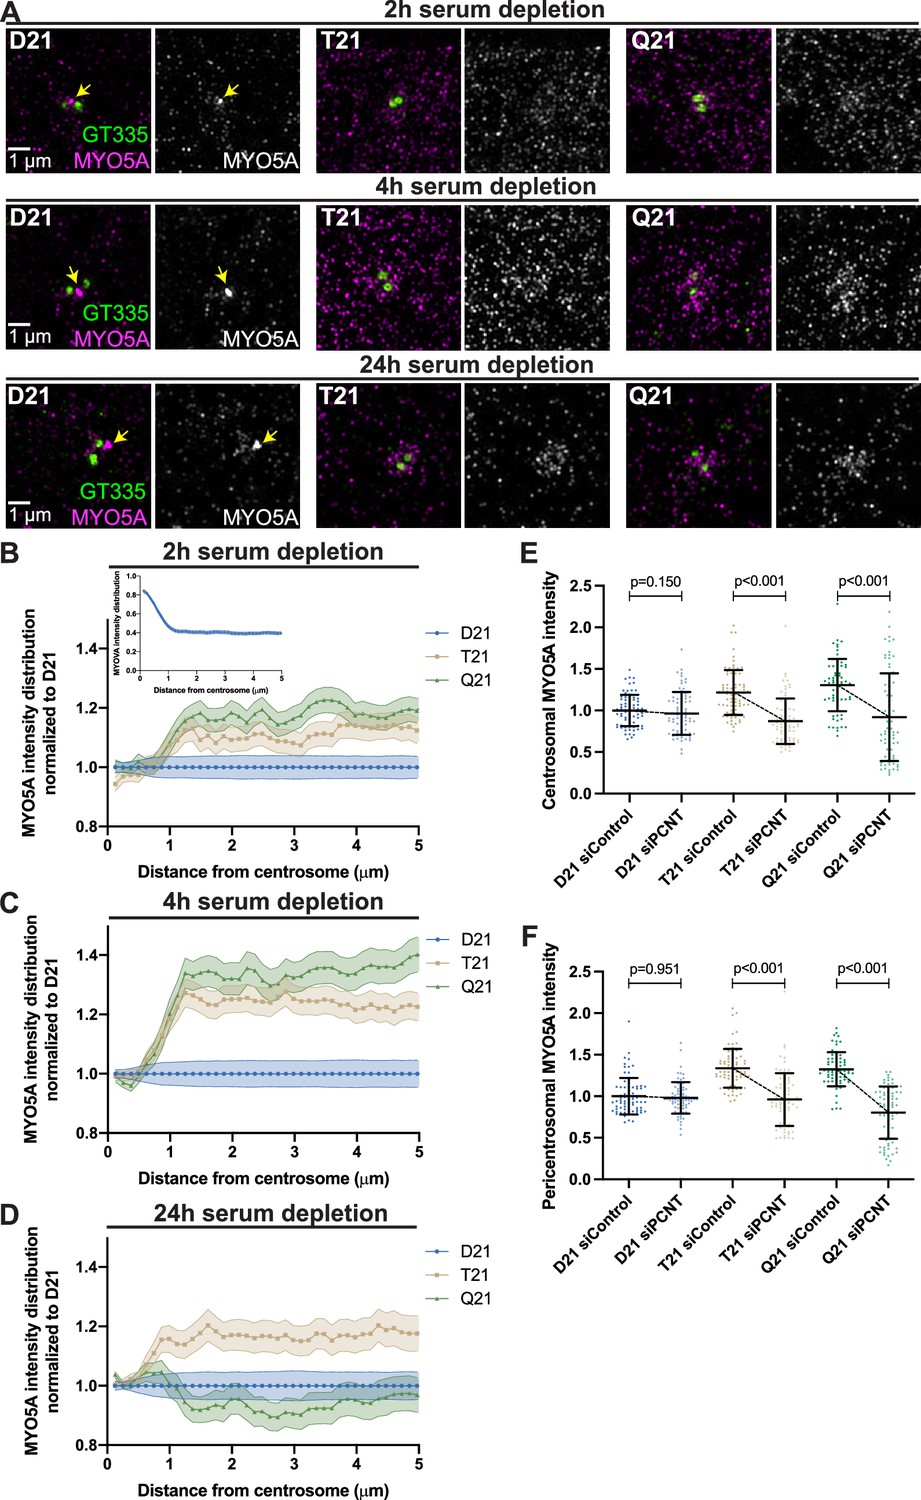
Preciliary vesicle components contribute to PCNT-induced pericentrosomal crowding.
(A) Representative structured illumination microscopy images from time course experiments of RPE1 D21, T21, and Q21 cells grown on coverslips and serum depleted for 2, 4, and 24 hr. Cells were stained with GT335 to label centrioles and MYO5A. (B–D) Distribution of MYO5A intensities around the centrosome for 2 (B), 4 (C), and 24 (D) hr timepoints. All values were normalized to D21 at 0 µm. Inset in (B) shows MYO5A intensity distribution in D21 cells prior to normalization. Graphs show mean ± SD. N=3. (E) Quantitation of centrosomal MYO5A intensity in 0–1.2 µm region around the centrosome for control and siPCNT treated D21, T21, and Q21 cells. Cells were treated with siControl or siPCNT for 24 hr concurrent with serum depletion. All values were normalized to the D21 siControl average. Graph show mean ± SD. N=3. Mann-Whitney U test. (F) Quantitation of pericentrosomal MYO5A intensity in 1.2–5 µm region around centrosome for control and siPCNT treated D21, T21, and Q21 cells. Cells were treated with siControl or siPCNT for 24 hr concurrent with serum depletion. All values were normalized to the D21 siControl average. Elevated MYO5A levels are distinct from the reduction observed in the distribution analyses (D) and are likely the result of the unique conditions for each experiment. Graph show mean ± SD. N=3. Mann-Whitney U test.
-
Figure 3—source data 1
Values for biological and technical replicates for graphs Figure 3 and Figure 3—figure supplement 1.
- https://cdn.elifesciences.org/articles/78202/elife-78202-fig3-data1-v1.xlsx
Figure 3—figure supplement 1
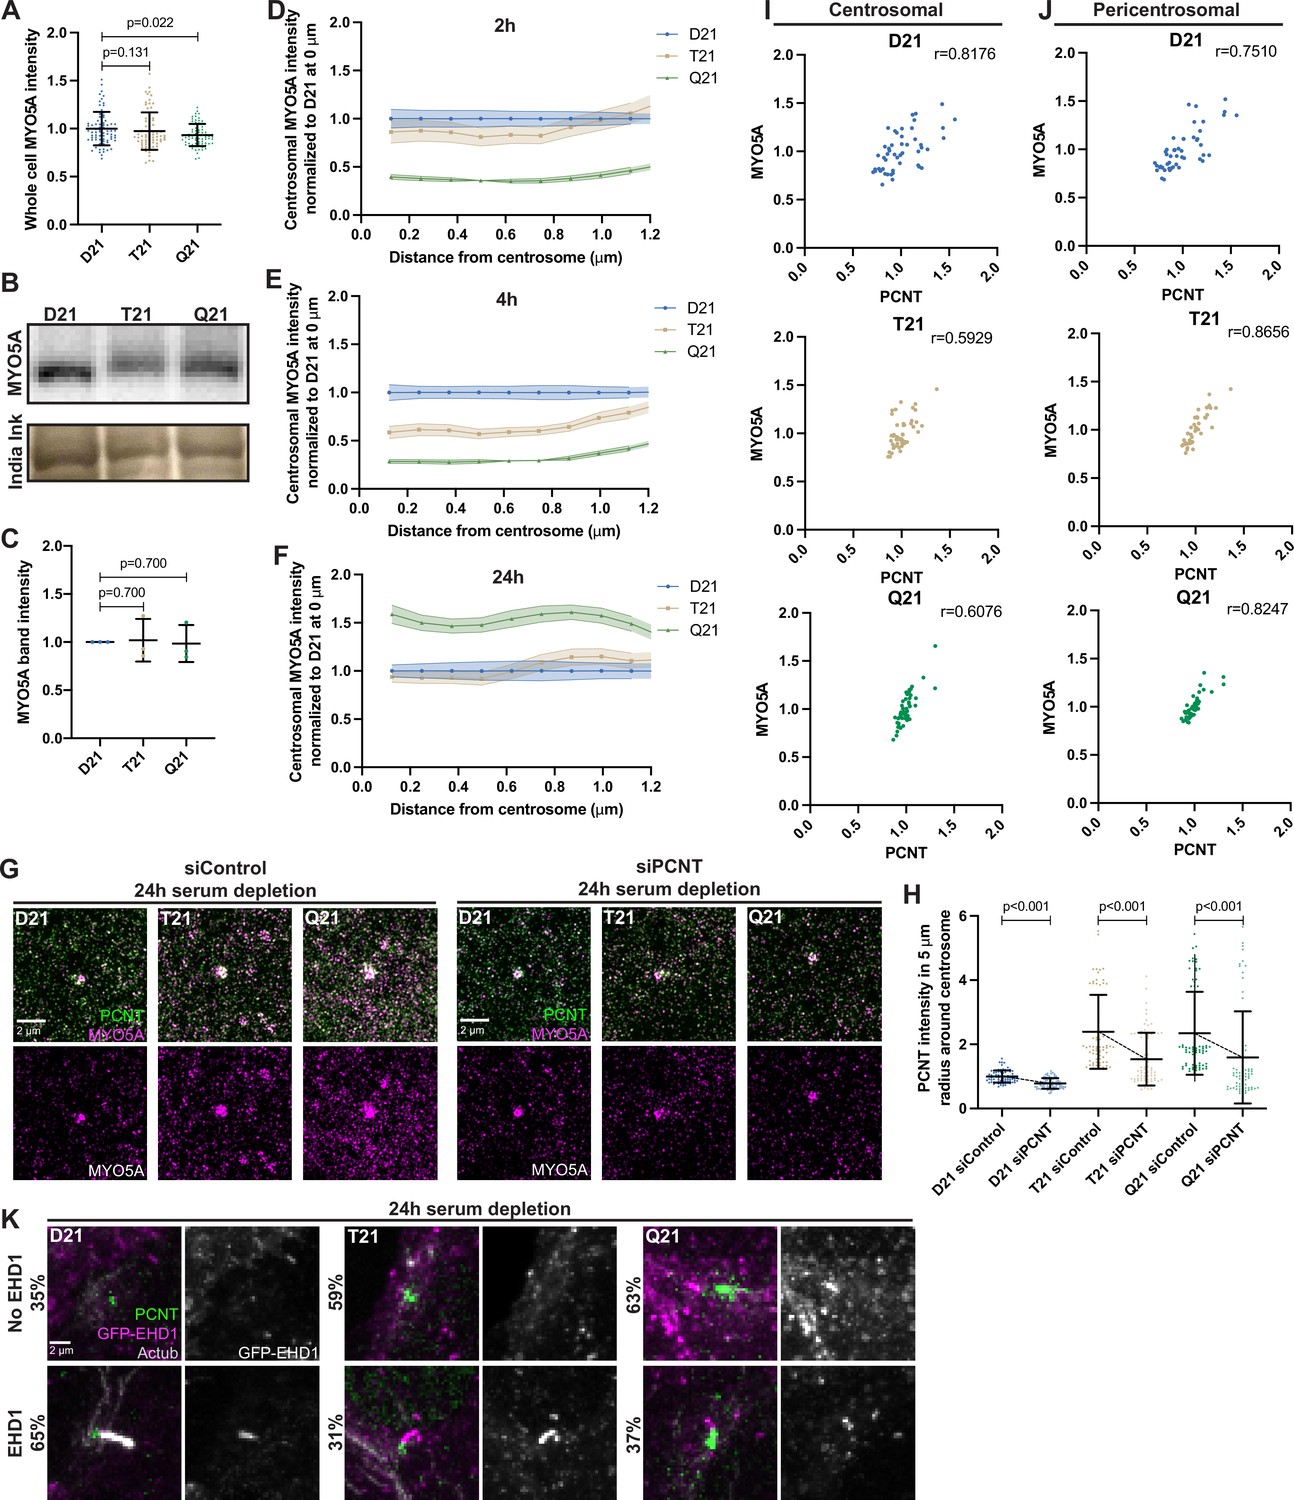
Preciliary vesicle components contribute to PCNT-induced pericentrosomal crowding.
(A) Quantitation of whole cell MYO5A intensity for D21, T21, and Q21 cells. Graph shows mean ± SD. N=3. Mann-Whitney U test. (B) Western Blot probing for MYO5A (top panel) and India Ink stain for loading control (bottom panel) on D21, T21, and Q21 whole cell lysates. (C) Quantitation of MYO5A Western Blot band intensities normalized to D21. Graph shows mean ± SD. N=3. Mann-Whitney U test. (D–F) Distribution of centrosomal MYO5A intensities moving away from the centrosome for 2 (D), 4 (E), and 24 (F) h timepoints. Values were normalized to the D21 average. Note that the FIJI radial analysis plugin does not plot the intensity at the centroid, thus the first point on the graph is the average intensity within the first concentric circle from the centroid. Graph shows mean ± SD. N=3. (G) Representative structured illumination microscopy images of RPE1 D21, T21, and Q21 cells grown on coverslips and serum depleted for 24 hr. Cells were either treated with control or PCNT siRNA during the 24 hr serum depletion. Cells were stained with GT335 and MYO5A. (H) Quantitation of PCNT intensities in a 5 µm radial circle around the centrosome in control and PCNT siRNA treated cells normalized to the D21 siControl average. Graph shows mean ± SD. N=3. Mann-Whitney U test. (I, J) Correlation analysis between PCNT and MYO5A levels in 5 μm radius for D21, T21, and Q21 cells 24 hr after serum depletion. N=3. Pearson r value is shown. (K) Representative confocal images of RPE1 D21, T21, and Q21 cells stably expressing GFP-EHD1 grown on coverslips and serum depleted for 24 hr. Cells were stained for PCNT and Actub. Percentages represent cells with indicated phenotype across 3 N’s.
-
Figure 3—figure supplement 1—source data 1
Uncropped blots and protein gels related to Figure 3—figure supplement 1B.
- https://cdn.elifesciences.org/articles/78202/elife-78202-fig3-figsupp1-data1-v1.pdf
Figure 4 with 4 supplements
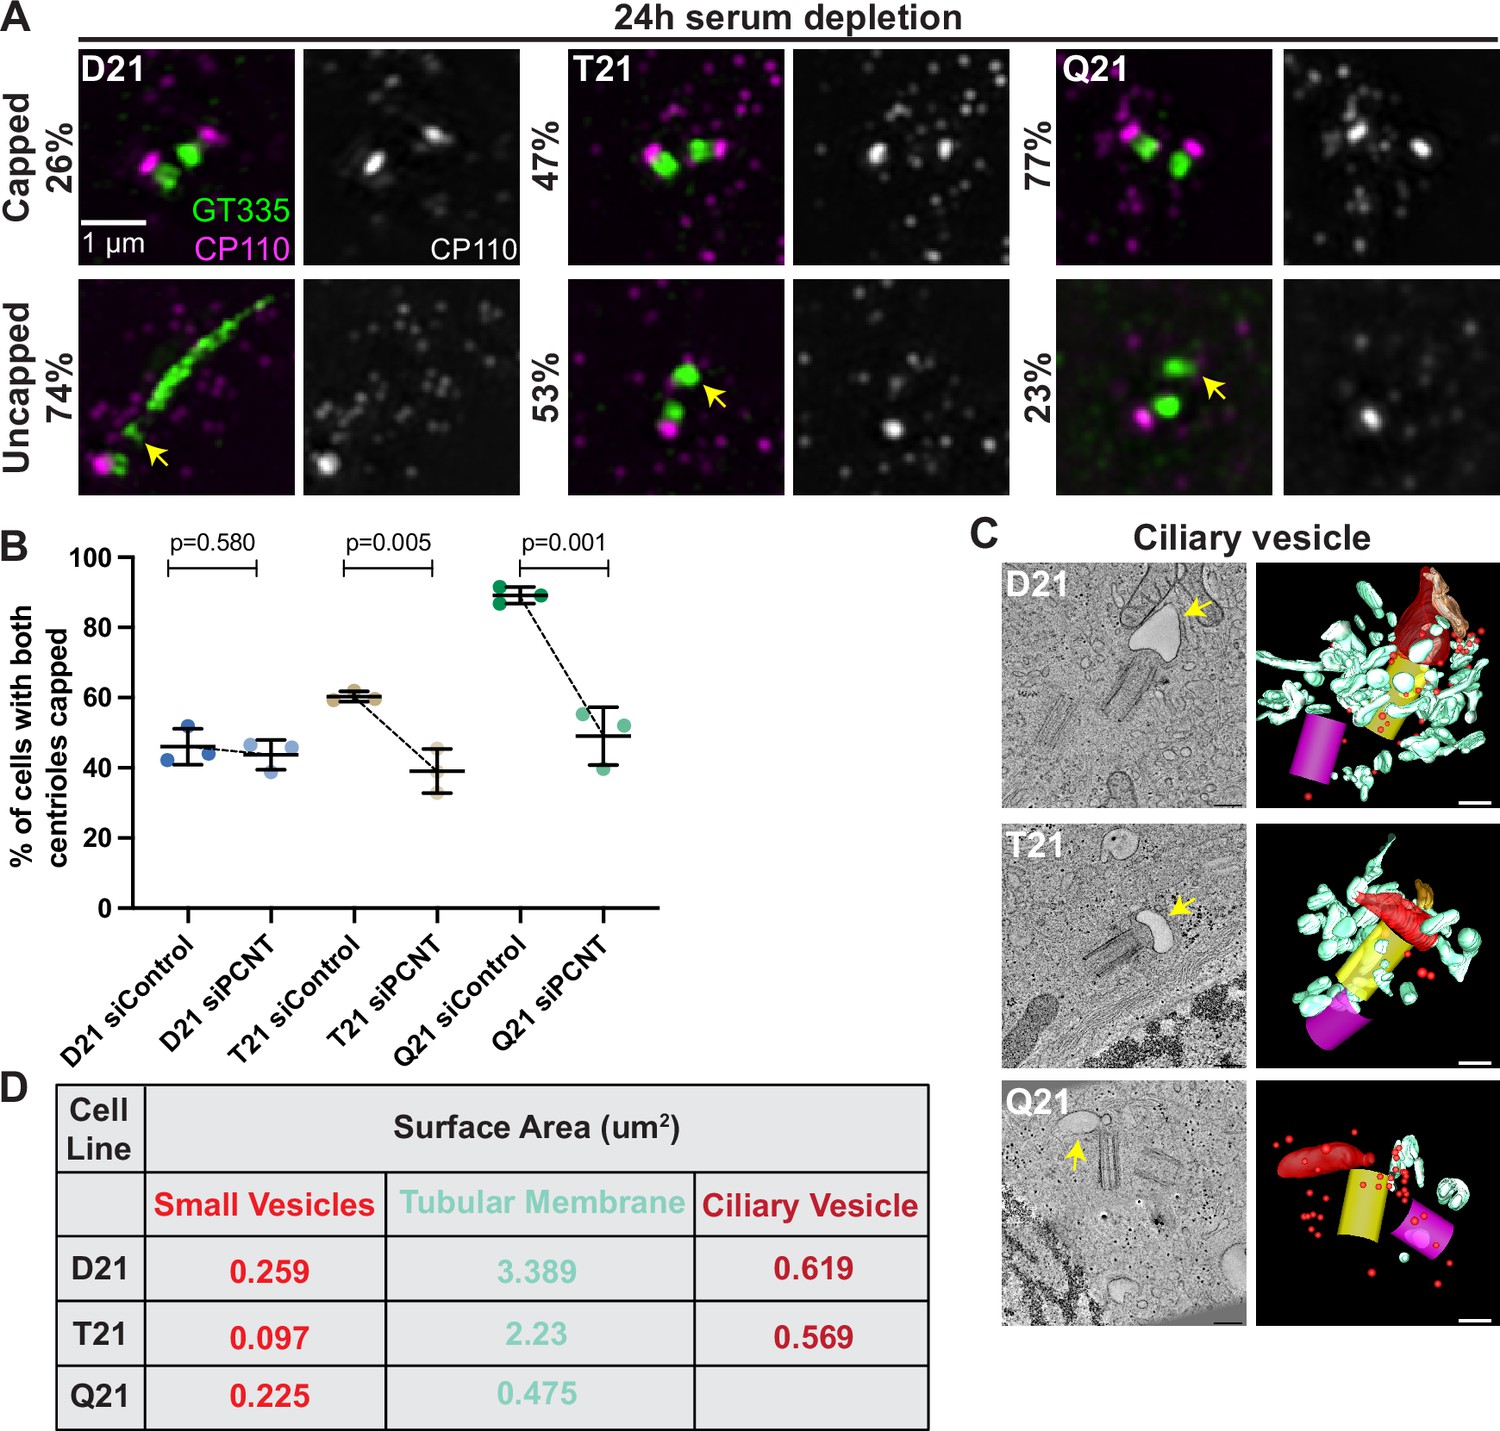
Increased HSA21 ploidy disrupts mother centriole uncapping in a PCNT-dosage-dependent manner.
(A) Representative structured illumination microscopy images of RPE1 D21, T21, and Q21 cells grown on coverslips and serum depleted for 24 hr. Cells were stained with GT335 and the centriole capping protein CP110. Percentages represent cells with indicated phenotype across 3 N’s. (B) Quantitation of CP110 centriole capping for control and siPCNT treated D21, T21, and Q21 cells. Graph show mean ± SD. N=3. Two-tailed unpaired t-test. (C) Selected tomographic slices and 3D models showing ciliary vesicle formation in D21, T21, and Q21 cells. T21 and Q21 have smaller ciliary vesicles (arrows) and the ciliary vesicle in Q21 cell is offset from the center of the mother centriole. Models show mother centriole (yellow), daughter centriole (magenta) ciliary vesicle (large red structure at the distal end of the mother centriole), smaller vesicles (red spheres), and smooth tubular membranes (blue-green). (D) Quantitation of membrane surface area at the centrosome in electron tomograms for D21, T21, and Q21 cells. D21 cells showed increased small vesicles (red spheres), smooth membranes (blue-green), and ciliary vesicle membrane (red structures) compared to T21 and Q21 cells. Ciliary vesicles in Q21 cells were not quantified due to low frequency (n of 1) and unusual offset of that ciliary vesicle. N=2 reconstructed cells per cell line. Scale bars are 200 nm. Movies of the complete volume and rotating models can be found in Figure 4—videos 1–3.
-
Figure 4—source data 1
Values for biological and technical replicates for graphs in Figure 4 and Figure 4—figure supplement 1.
- https://cdn.elifesciences.org/articles/78202/elife-78202-fig4-data1-v1.xlsx
Figure 4—figure supplement 1
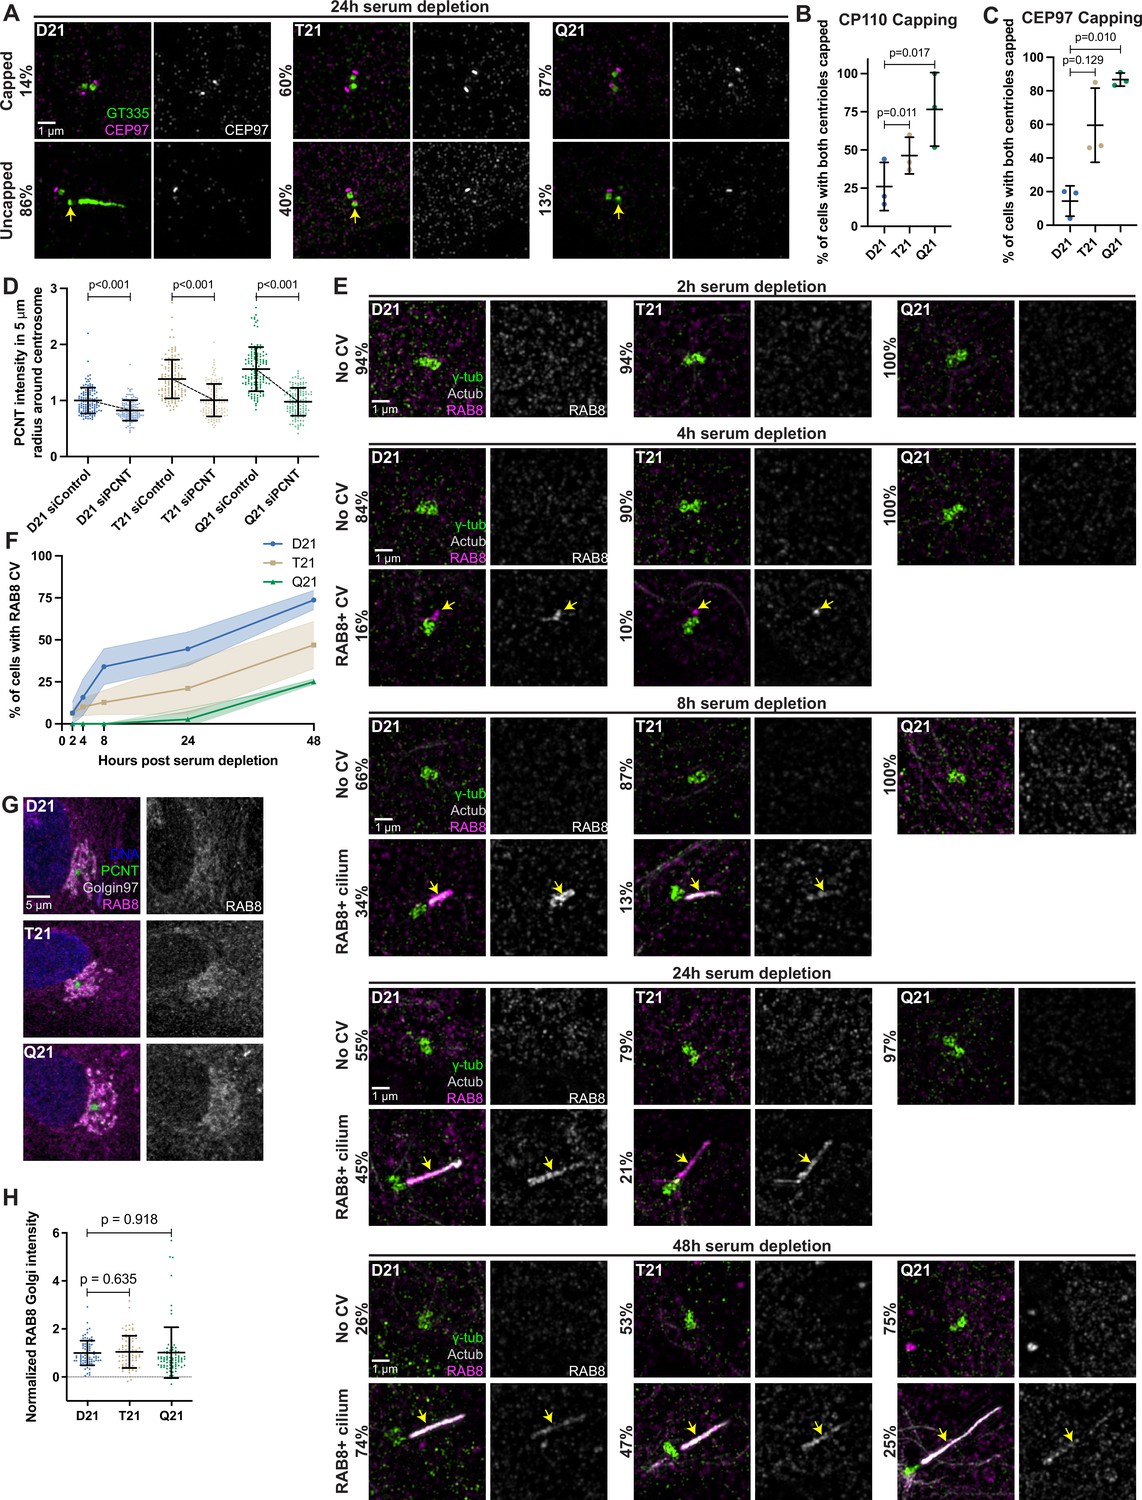
Increased HSA21 ploidy disrupts mother centriole uncapping, but not general membrane trafficking.
(A) Representative structured illumination microscopy images of RPE1 D21, T21, and Q21 cells grown on coverslips and serum depleted for 24 hr. Cells were stained with GT335 and the centriole capping protein CEP97. Percentages represent cells with indicated phenotype across 3 N’s. (B) Quantitation of CP110 centriole capping for D21, T21, and Q21 cells 24 hr after serum depletion. Graph shows mean ± SD. N=3. Two-tailed paired t-test. (C) Quantitation of CEP97 centriole capping for D21, T21, and Q21 cells. Graph shows mean ± SD. N=3. Two-tailed paired t-test. (D) Quantitation of PCNT intensities in a 5 µm radial circle around the centrosome in control and PCNT siRNA treated cells normalized to the D21 average. Graph shows mean ± SD. N=3. Mann-Whitney U test. (E) Representative structured illumination microscopy images of RPE1 D21, T21, and Q21 cells grown on coverslips and serum depleted for 2, 4, 8, 24, and 48 hr. Cells were stained with γ-tubulin, Actub, and RAB8. Percentages represent cells with indicated phenotype across 3 N’s. (F) Quantitation of cells with RAB8 ciliary vesicle throughout the time course. Graph shows mean ± SD. N=3. (G) Representative confocal images of RPE1 D21, T21, and Q21 cells grown on coverslips and serum depleted for 24 hr. Cells were stained with Hoechst 33342, PCNT, Golgin97, and RAB8. (H) Quantitation of RAB8 Golgi intensity normalized to the D21 average. Graph shows mean ± SD. N=3. Mann-Whitney U test.
Figure 4—video 1
Movie of D21 cell from Figure 4 showing the electron tomogram volume, then model projecting from the image, then the model turning without image.
Mother centriole (yellow), daughter centriole (magenta), vesicles (red spheres), smooth tubular membrane (blue-green), and ciliary vesicle (red structure at distal end of mother centriole).
Figure 4—video 2
Movie of T21 cell from Figure 4 showing the electron tomogram volume, then model projecting from the image, then the model turning without image.
Mother centriole (yellow), daughter centriole (magenta), vesicles (red spheres), smooth tubular membrane (blue-green), and ciliary vesicle (red structure at distal end of mother centriole).
Figure 4—video 3
Movie of Q21 cell from Figure 4 showing the electron tomogram volume, then model projecting from the image, then the model turning without image.
Mother centriole (yellow), daughter centriole (magenta), vesicles (red spheres), smooth tubular membrane (blue-green), and ciliary vesicle (red structure at distal end of mother centriole). In the Q21 cell, the ciliary vesicle is slightly offset from the end of the mother centriole.
Figure 5 with 3 supplements
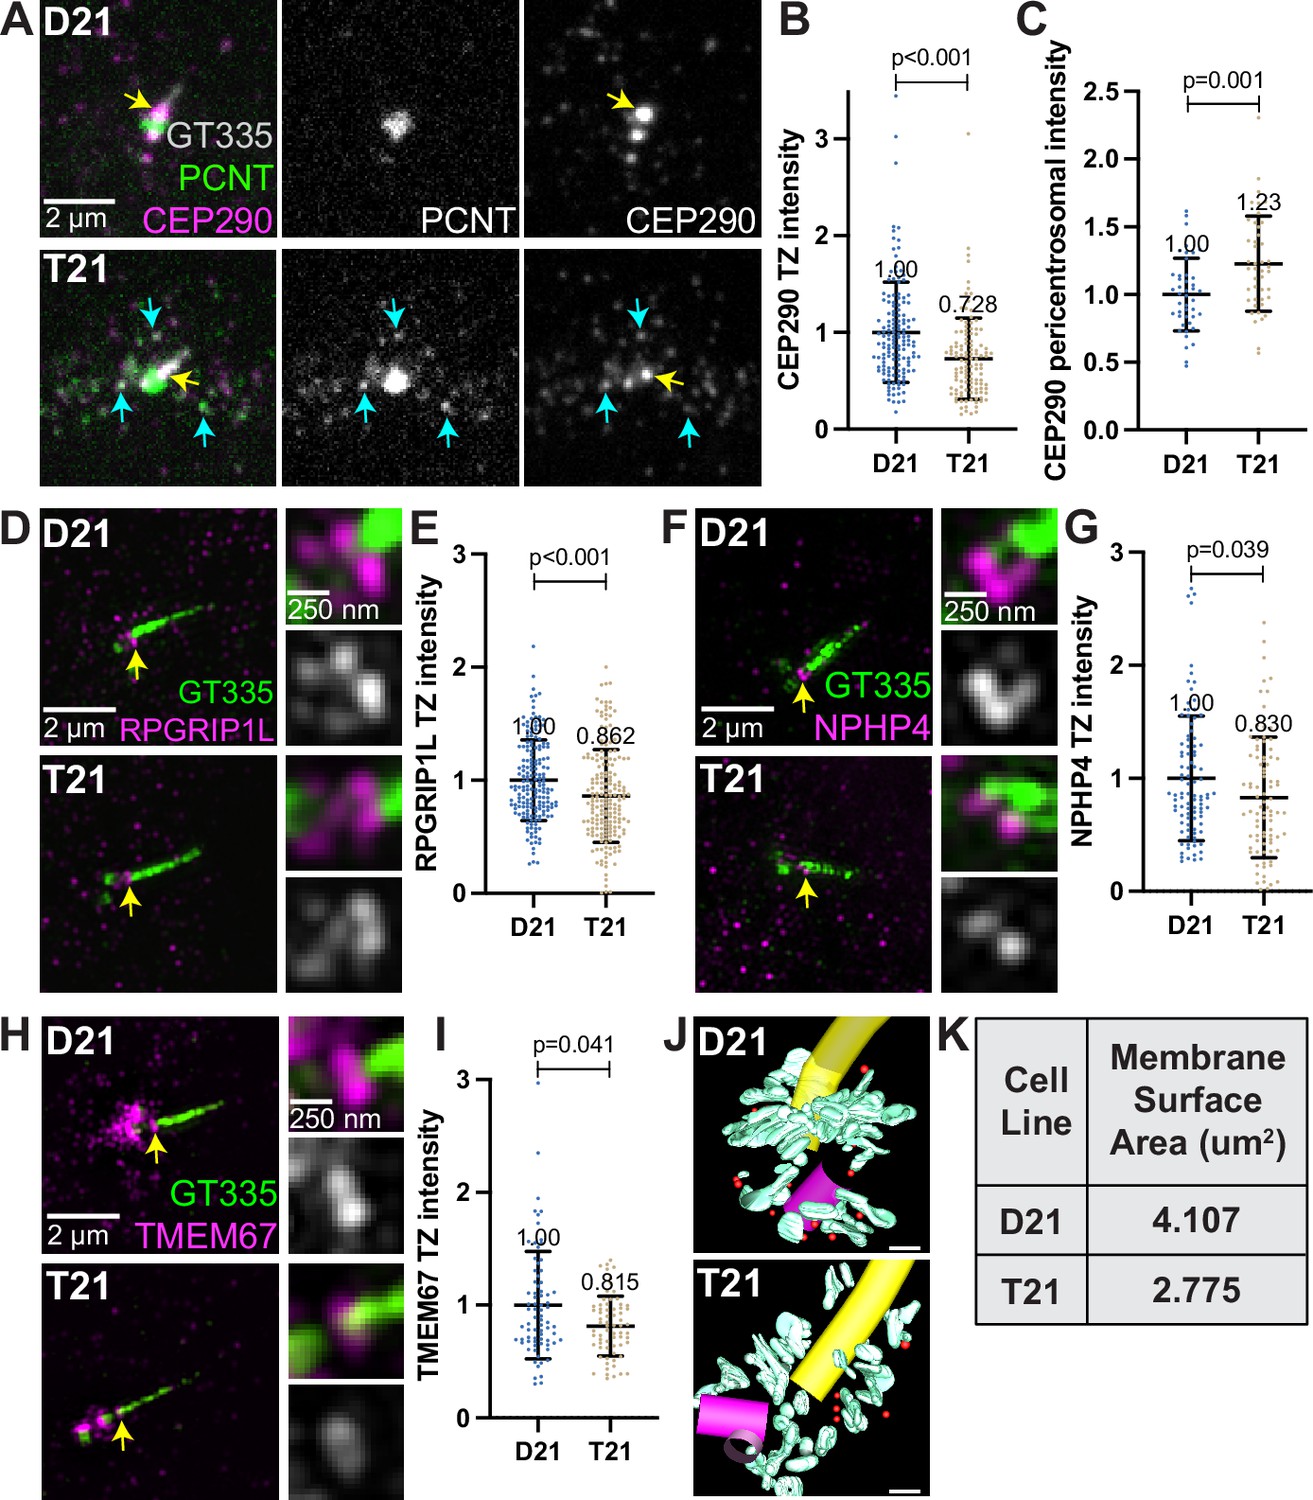
Decreased transition zone protein localization in ciliated trisomy 21 cells.
(A) Representative confocal images of RPE1 D21 and T21 cells grown on coverslips and serum depleted for 24 hr. Cells were stained with GT335, PCNT, and the transition zone protein CEP290. Yellow arrows point to the CEP290 transition zone population and cyan arrows point to CEP290 satellites that colocalize with PCNT. (B) Quantitation of CEP290 transition zone intensity. Graph show mean ± SD. N=3. Mann-Whitney U test. (C) Quantitation of pericentrosomal CEP290 intensity in the 1.2–5 µm region around the centrosome. Graph show mean ± SD. N=3. Mann-Whitney U test. (D, F, H) Representative structured illumination microscopy images of RPE1 D21 and T21 cells grown on coverslips and serum depleted for 24 hr. Cells were stained with GT335 and the transition zone proteins RPGRIP1L (D), NPHP4 (F), or TMEM67 (H). (E, G, I) Quantitation of indicated transition zone protein intensities from confocal images. All values were normalized to the D21 average. Mean intensity values are indicated on graphs. Graphs show mean ± SD. N=3. Mann-Whitney U test. (J) 3D models from D21 and T21 cells that contained a primary cilium. An increase in vesicles (red spheres) and tubular membranes (blue-green) at the distal end of the mother centriole is evident in the D21 cell. A procentriole was observed at the T21 daughter centriole (violet). Scale bars are 200 nm. Movies of the complete volume and rotating models can be found in Figure 5—videos 1 and 2. (K) Quantitation of total membrane surface area at the centrosome in electron tomograms for D21 and T21 cells. N=1 reconstructed cell per cell line.
-
Figure 5—source data 1
Values for biological and technical replicates for graphs in Figure 5 and Figure 5—figure supplement 1.
- https://cdn.elifesciences.org/articles/78202/elife-78202-fig5-data1-v1.xlsx
Figure 5—figure supplement 1
General membrane trafficking and ciliary protrusion are not affected by trisomy 21.
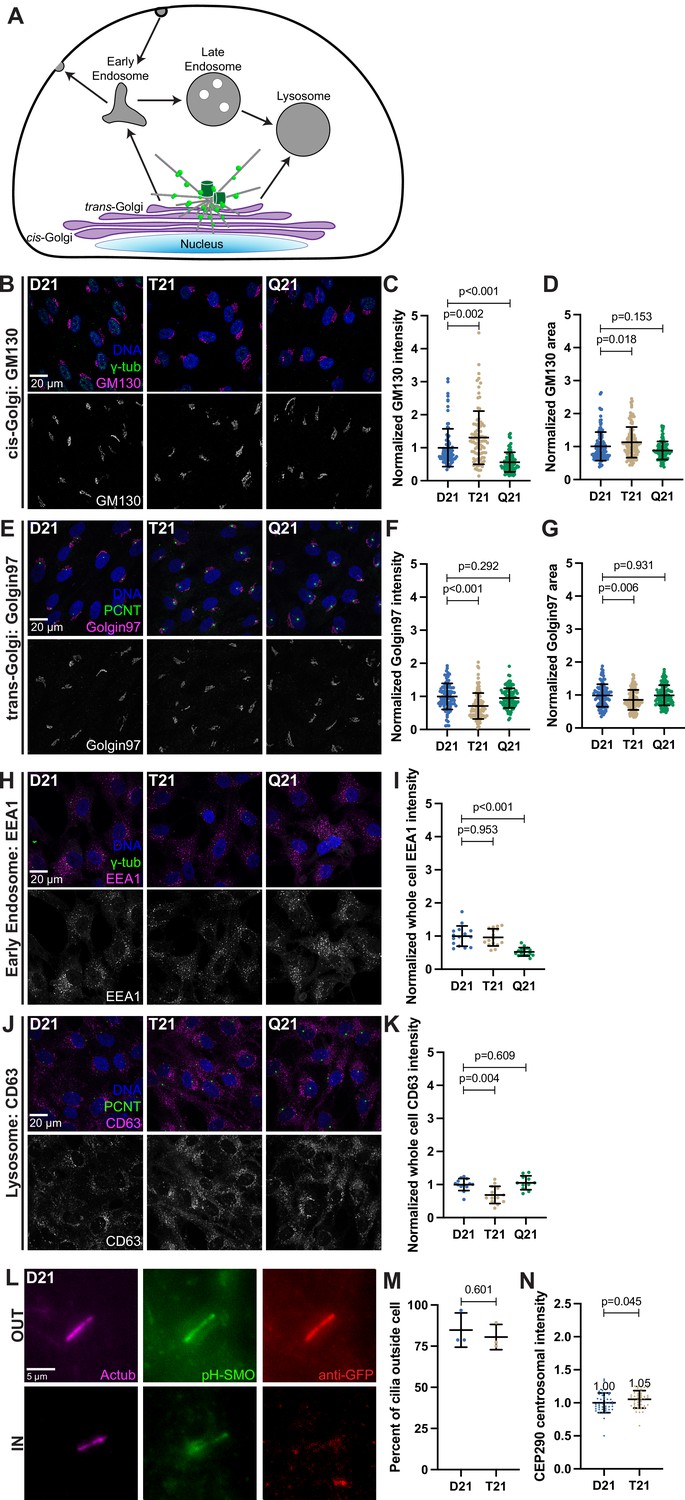
(A) Cartoon model depicting intracellular trafficking pathways. (B) Representative confocal images of RPE1 D21, T21, and Q21 cells grown on coverslips and serum depleted for 24 h. Cells were stained with Hoechst 33342, γ-tubulin, and the cis-Golgi marker GM130. (C–D) Quantitation of GM130 intensity (C) and GM130-labeled Golgi area (D) normalized to the D21 average. Graphs show mean ± SD. N=3. Mann-Whitney U test. (E) Representative confocal images of RPE1 D21, T21, and Q21 cells grown on coverslips and serum depleted for 24 hr. Cells were stained with Hoechst 33342, PCNT, and the trans-Golgi marker Golgin97. (F–G) Quantitation of Golgin97 intensity (F) and Golgin97-labeled Golgi area (G) normalized to the D21 average. Graphs show mean ± SD. N=3. Mann-Whitney U test. (H) Representative confocal images of RPE1 D21, T21, and Q21 cells grown on coverslips and serum depleted for 24 hr. Cells were stained with Hoechst 33342, γ-tubulin, and the early endosome marker EEA1. (I) Quantitation of EEA1 intensity normalized to the D21 average. Graph shows mean ± SD. N=3. Mann-Whitney U test. (J) Representative confocal images of RPE1 D21, T21, and Q21 cells grown on coverslips and serum depleted for 24 hr. Cells were stained with Hoechst 33342, PCNT, and the lysosome marker CD63. (K) Quantitation of CD63 intensity normalized to the D21 average. Graph shows mean ± SD. N=3. Mann-Whitney U test. (L) Representative confocal images of RPE1 D21 and T21 cells stably expressing pH-Smoothened (pH-SMO) grown on coverslips and serum depleted for 24 hr. The IN/OUT assay was performed, and cells were stained with an anti-GFP antibody pre-permeabilization and Actub after. Anti-GFP labeled cilia are extracellular. (M) Quantitation of extracellular cilia in D21 and T21 cells. (N) Quantitation of centrosomal CEP290 intensity in 0–1.2 µm region around centrosome. Graphs shows mean ± SD. N=3. Mann-Whitney U test.
Figure 5—video 1
Movie of D21 cell with a primary cilium from Figure 5 showing the electron tomogram volume, then model projecting from the image, then the model turning without image.
Mother centriole and ciliary axoneme (yellow), daughter centriole (magenta), vesicles (red spheres), smooth tubular membrane (blue-green).
Figure 5—video 2
Movie of T21 cell with a primary cilium from Figure 5 showing the electron tomogram volume, then model projecting from the image, then the model turning without image.
Mother centriole and ciliary axoneme (yellow), daughter centriole (magenta), vesicles (red spheres), smooth tubular membrane (blue-green). In the T21 cell, there is a procentriole (violet) coming from the daughter centriole.
Figure 6 with 1 supplement
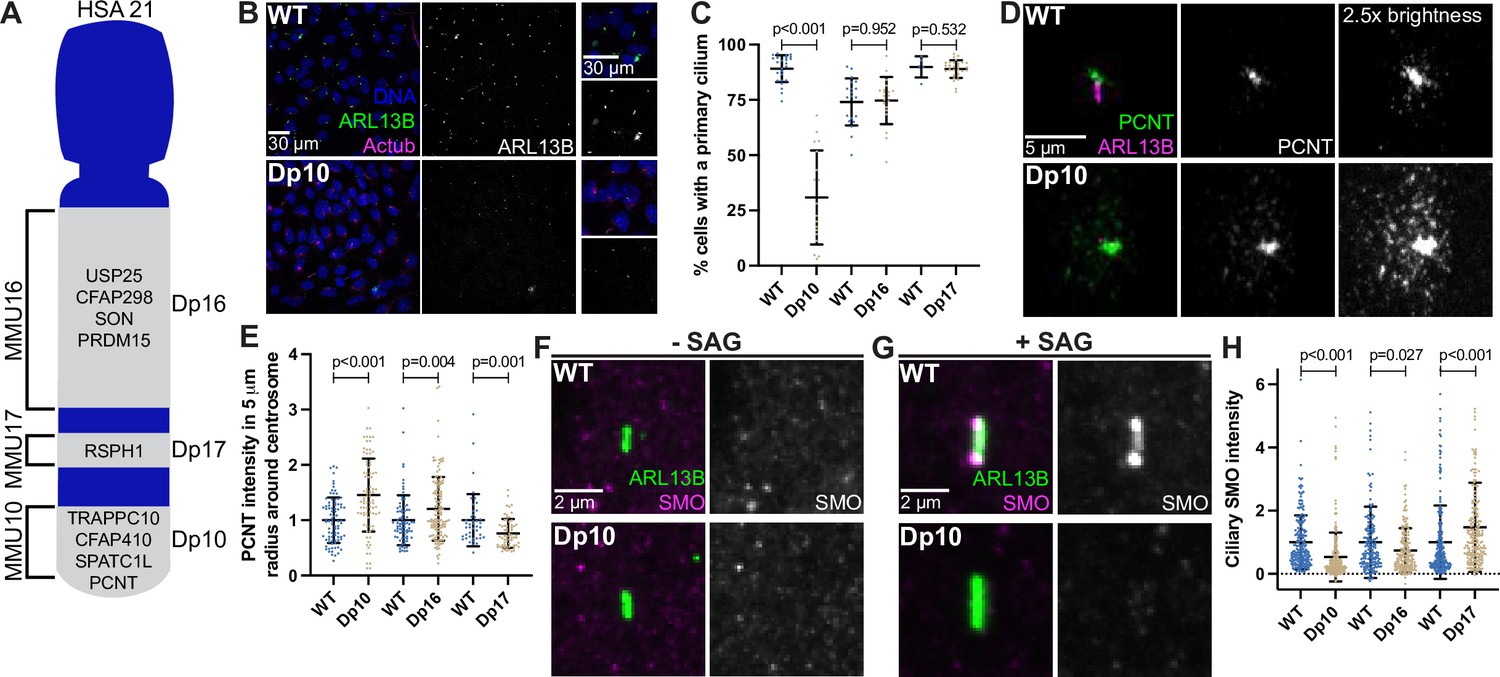
Shh signaling is defective in primary mouse fibroblasts with elevated PCNT.
(A) Cartoon model depicting mouse syntenic regions with HSA21 and corresponding Dp10, Dp16, and Dp17 mouse models. PCNT is located on MMU10. Other cilia and centrosome proteins are also listed. For all following experiments, WT and Dp primary MEFs were isolated from E12.5 pregnant females, grown on coverslips, and serum depleted for 24 hr. (B) Representative confocal images of WT and Dp10 MEFs. Cells were stained with Hoechst 33342, the ciliary marker ARL13B, and Actub. (C) Quantitation of the number of cells with a primary cilium in WT and Dp MEFs. Graph shows mean ± SD. N=3. Mann-Whitney U test. (D) Representative confocal images of WT and Dp10 MEFs. Cells were stained with PCNT and ARL13B. (E) Quantitation of PCNT intensities in a 5 µm radial circle around the centrosome in WT and Dp MEFs. Values were normalized to the WT average. Graph shows mean ± SD. N=3. Mann-Whitney U test. (F, G) Representative confocal images of WT and Dp10 MEFs untreated (F) or treated with 100 nM SAG for the last 4 hr of 24 hr serum depletion (G). Cells were stained with SMO and ARL13B. (H) Quantitation of ciliary SMO levels in SAG-treated cells for WT and Dp MEFs. Graph shows mean ± SD. N=3. Mann-Whitney U test.
-
Figure 6—source data 1
Values for biological and technical replicates for graphs and uncropped gel images in Figure 6 and Figure 6—figure supplement 1.
- https://cdn.elifesciences.org/articles/78202/elife-78202-fig6-data1-v1.xlsx
Figure 6—figure supplement 1
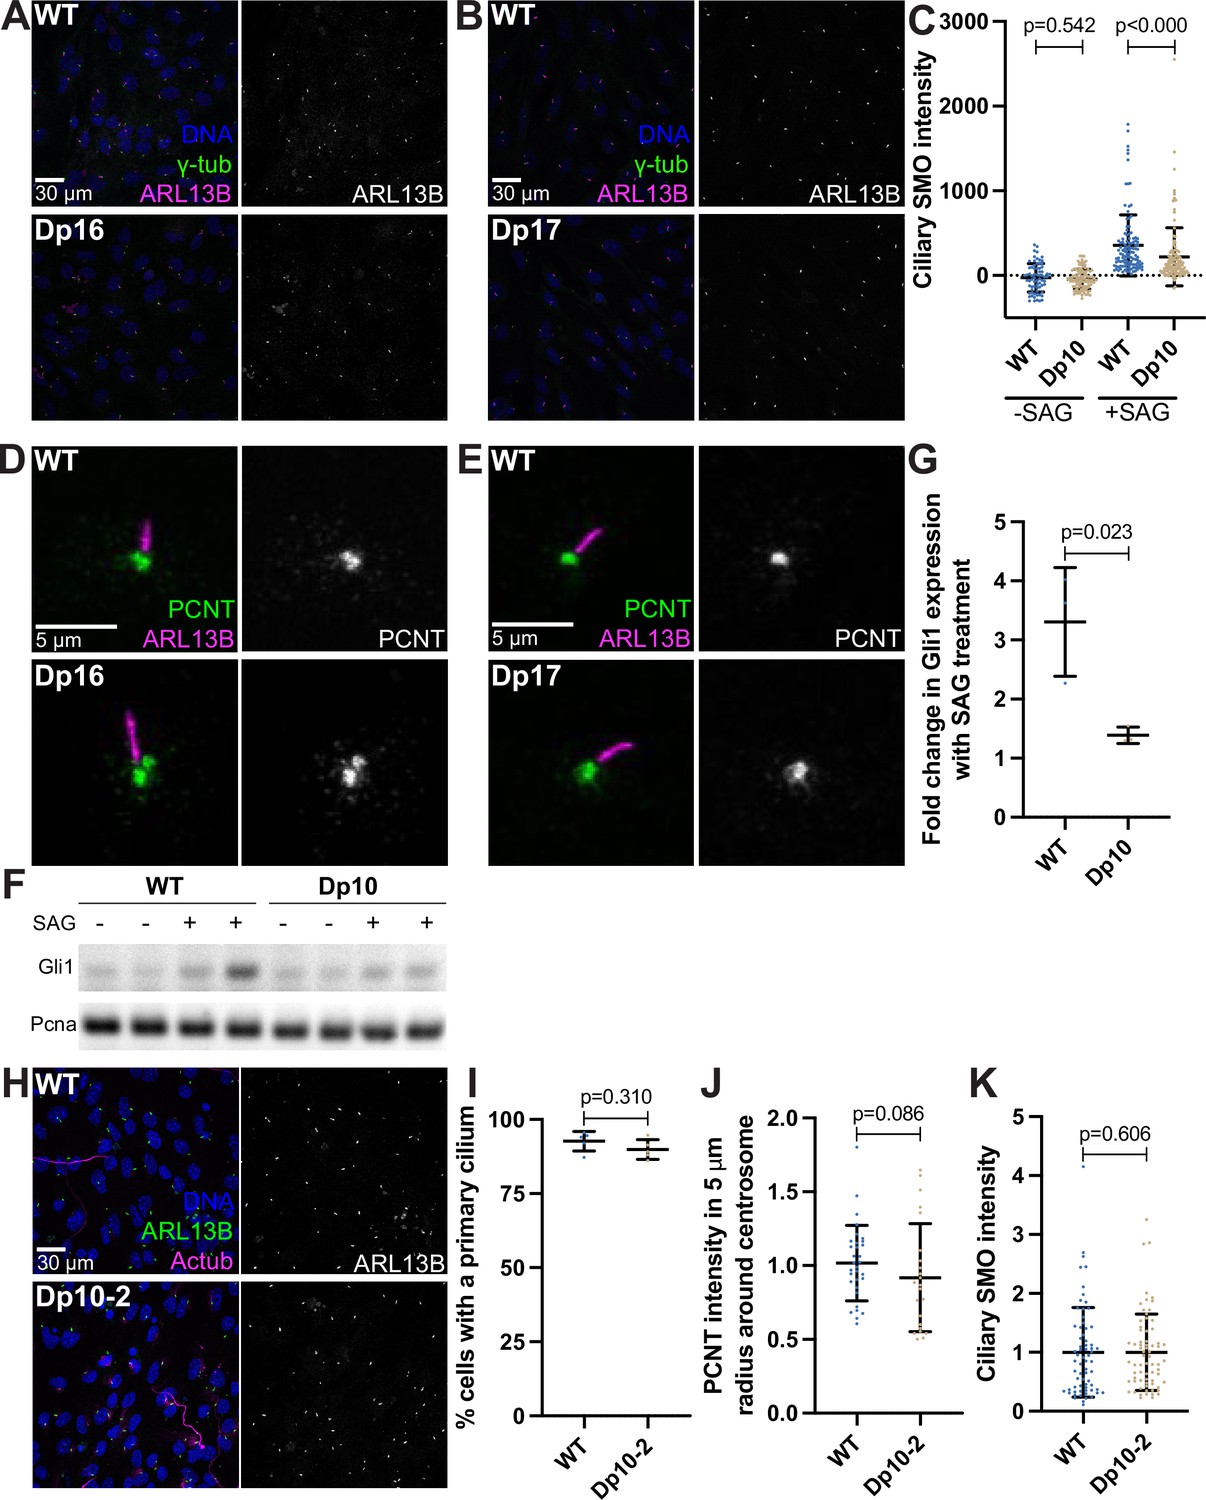
For all following experiments, WT and Dp primary MEFs were isolated from E12.5 pregnant females, grown on coverslips, and serum depleted for 24 hr.
(A, B) Representative confocal images of WT and Dp16 (A) or Dp17 (B) MEFs. Cells were stained with Hoechst 33342, the ciliary marker ARL13B, and γ-tubulin. (C) Quantitation of ciliary SMO levels in untreated and 100 nm SAG-treated cells for WT and Dp10 MEFs. Graphs show mean ± SD. N=3. Mann-Whitney U test. (D, E) Representative confocal images of WT and Dp16 (D) or Dp17 (E) MEFs. Cells were stained with PCNT and ARL13B. (F) RT-PCR of Gli1 and Pcna (control) in untreated and 100 nm SAG-treated cells for WT and Dp10 MEFs. (G) Quantitation of fold-change in Gli1 expression with SAG treatment from RT-PCR. Graphs show mean ± SD. N=2 biological and 2 technical replicates. Two-tailed unpaired t-test. (H) Representative confocal images of WT and the Dp10-2 MEF line that does not have decreased cilia. Cells were stained with Hoechst 33342, the ciliary marker ARL13B, and Actub. (I) Quantitation of the number of cells with a primary cilium in WT and Dp10-2 MEFs. Graph shows mean ± SD. N=3. Mann-Whitney U test. (J) Quantitation of PCNT intensities in a 5 µm radial circle around the centrosome in WT and Dp10-2 MEFs. Values were normalized to the WT average. Graph shows mean ± SD. N=3. Mann-Whitney U test. (K) Quantitation of ciliary SMO levels in SAG-treated cells for WT and Dp10-2 MEFs. Values were normalized to the WT average. Graph shows mean ± SD. N=3. Mann-Whitney U test.
-
Figure 6—figure supplement 1—source data 1
Uncropped gels from RT-PCR related to Figure 6—figure supplement 1F.
- https://cdn.elifesciences.org/articles/78202/elife-78202-fig6-figsupp1-data1-v1.pdf
Figure 7 with 1 supplement
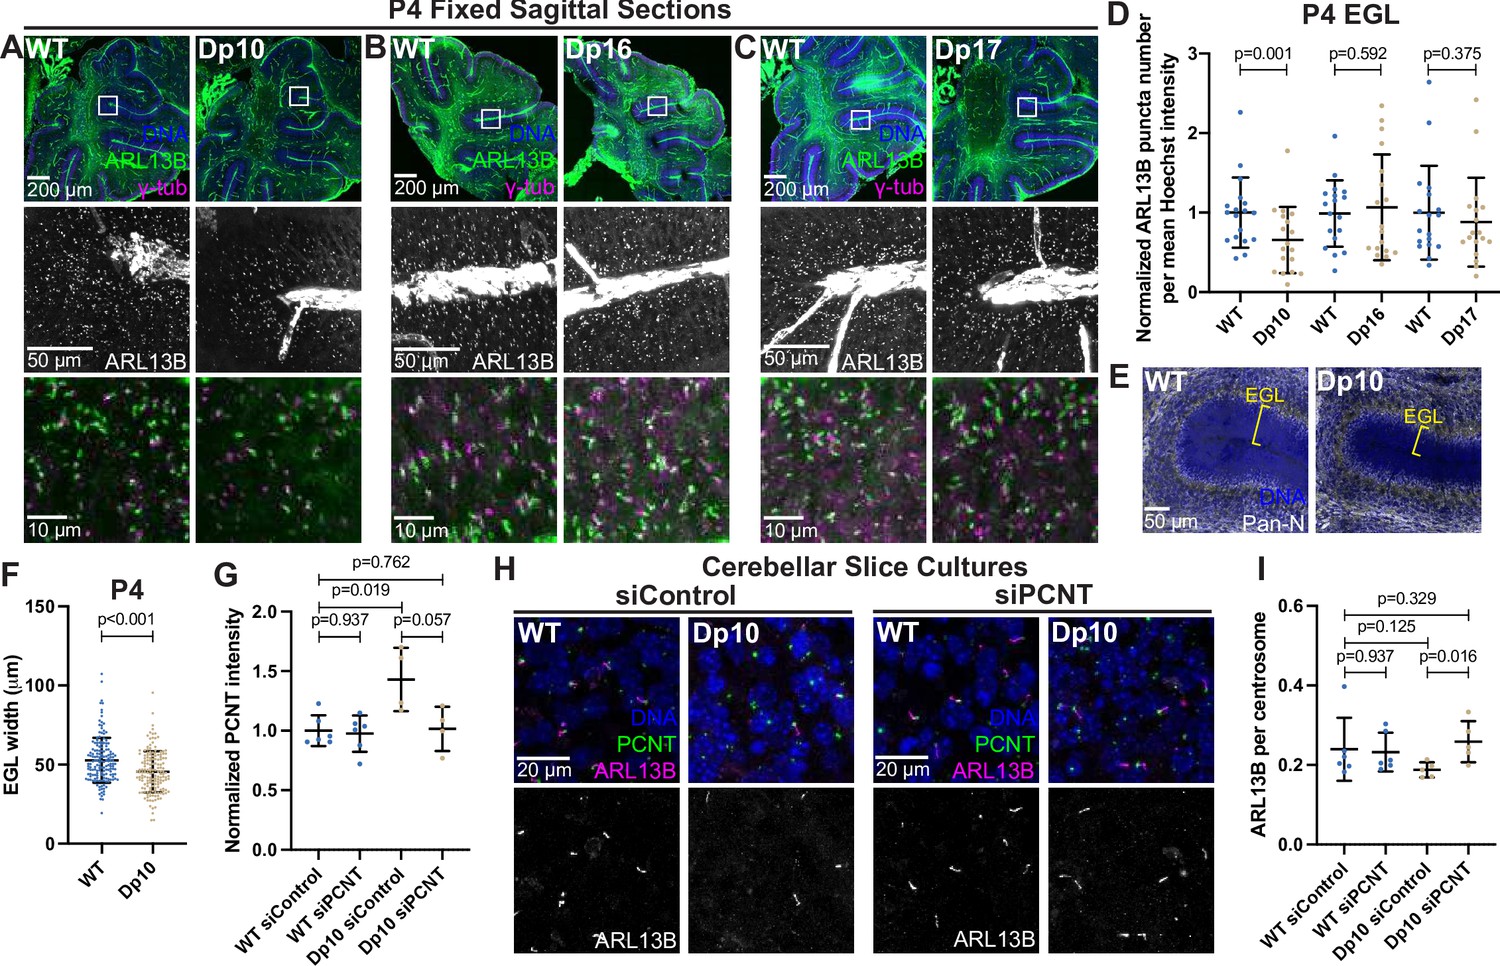
Elevated PCNT in a DS mouse model results in decreased primary cilia and cerebellar dysmorphology.
(A–C) Representative tiled confocal images of the cerebellum from P4 wild-type (WT) and Dp10 (A), Dp16 (B), and Dp17 (C) animals. Brain sections were stained with Hoechst 33342, ARL13B, and γ-tubulin. Insets show progressively zoomed in regions corresponding to the same folia in each animal. (D) Quantitation of primary cilia frequency in WT and Dp animals normalized to WT. Graph shows mean ± SD. N=3. Paired t-test. (E) Representative tiled confocal images of WT and Dp10 P4 animals corresponding to the same cerebellar folia in each animal. Brain sections were stained with Hoechst 33342 and a Pan-neuronal marker. Yellow bracket denotes external granular layer. (F) Quantitation of the external granular layer width in WT and Dp10 animals. Graph shows mean ± SD. N=3. Two-tailed unpaired t-test. (G) Quantitation of PCNT intensity in WT and Dp10 cerebellar slice cultures treated with control or PCNT siRNA. Values were normalized to WT siControl averages. Graph shows mean ± SD. N=3. Mann-Whitney U test. (H) Representative confocal images of WT and Dp10 cerebellar slice cultures isolated from P4 pups and treated with control or PCNT siRNA for 48 h in serum free media. Slices were stained with Hoechst 33342, ARL13B, PCNT. (I) Quantitation of primary cilia frequency in WT and Dp10 cerebellar slice cultures treated with control or PCNT siRNA. Graph shows mean ± SD. N=3. Mann-Whitney U test.
-
Figure 7—source data 1
Values for biological and technical replicates for graphs in Figure 7 and Figure 7—figure supplement 1.
- https://cdn.elifesciences.org/articles/78202/elife-78202-fig7-data1-v1.xlsx
Figure 7—figure supplement 1
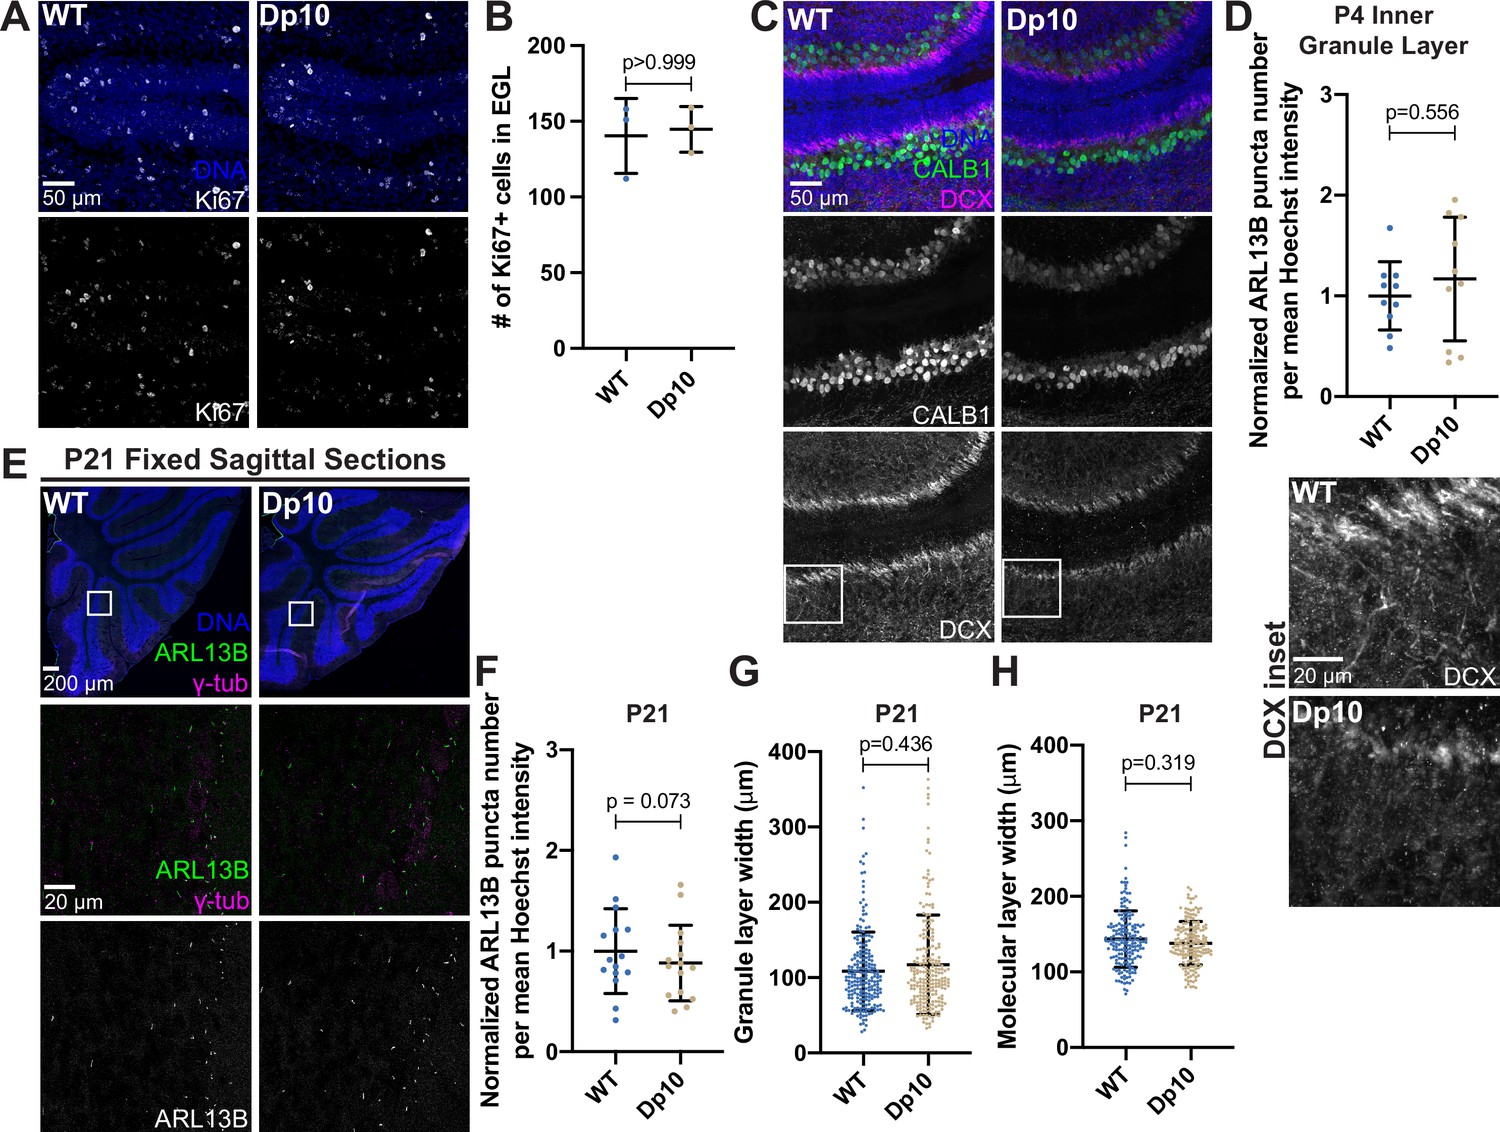
Normal proliferation and P21 mouse cerebella morphology and defective Doublecortin labeled microtubule extensions.
(A) Representative tiled confocal images of WT and Dp10 P4 animals corresponding to the same cerebellar folia in each animal. Brain sections were stained with Hoechst 33342 and the cell proliferation marker Ki67. (B) Quantitation of the number of Ki67-positive cells in the external granular layer of WT and Dp10 animals. Graph shows mean ± SD. N=3. Mann-Whitney U test. (C) Representative tiled confocal images of WT and Dp10 P4 animals corresponding to the same cerebellar folia in each animal. Brain sections were stained with Hoechst 33342 and the Purkinje cell marker calbindin (CALB1) and the microtubule binding protein doublecortin (DCX). The far-right panel shows insets of DCX staining. (D) Quantitation of primary cilia frequency in the inner granule layer of WT and Dp10 animals normalized to WT. Graph shows mean ± SD. N=3. Wilcoxon matched-pairs test. (E) Representative tiled confocal images of the cerebellum from P21 wild-type (WT) and Dp10 animals. Brain sections were stained with Hoechst 33342, ARL13B, and γ-tubulin. Insets show zoomed in regions corresponding to the same folia in each animal. (F) Quantitation of primary cilia frequency in WT and Dp animals at P21 normalized to WT at P21. Graph shows mean ± SD. N=3. Wilcoxon matched-pairs test. (G–H) Quantitation of the granular layer (G) and molecular layer (H) widths in WT and Dp10 animals at P21. Graphs show mean ± SD. N=3. Mann-Whitney U test.
Tables
Appendix 1—key resources table
| Reagent type (species) or resource | Designation | Source or reference | Identifiers | Additional information |
|---|---|---|---|---|
| Genetic reagent (M. musculus) | Dp16 | Jackson Laboratory | stock# 013530 B6.129S7-Dp(16Lipi-Zbtb21)1Yey/J | PMID:17412756 |
| Genetic reagent (M. musculus) | Dp10 | Jackson Laboratory | stock# 013529 B6;129-Dp(10Prmt2-Pdxk)2Yey/J | PMID:20442137 |
| Genetic reagent (M. musculus) | Dp17 | Jackson Laboratory | stock# 013531 B6;129-Dp(17Abcg1-Rrp1b)3Yey/J | PMID:20442137 |
| Cell line (Homo-sapiens) | RPE1 D21 | Gift from Andrew Lane | PMID:24747640 | |
| Cell line (Homo-sapiens) | RPE1 T21 | Gift from Andrew Lane | PMID:24747640 | |
| Cell line (Homo-sapiens) | RPE1 Q21 | Gift from Andrew Lane | PMID:24747640 | |
| Antibody | PCNT (Rabbit polyclonal) | Abcam | Cat# AB4448, RRID:AB_304461 | IF (1:2000) |
| Antibody | DM1A (mouse monoclonal) | Sigma | Cat# T6199, RRID:AB_477583 | IF (1:300) |
| Antibody | GT335 (mouse monoclonal) | Adipogen | Cat# AG-20B-0020-C100, RRID:AB_2490210 | IF (1:500) |
| Antibody | MYO5A (rabbit polyclonal) | Novus Biologicals | Cat# NBP1-92156, RRID:AB_11017070 | IF (1:500) WB (1:1000) |
| Antibody | CEP164 (rabbit polyclonal) | Protein Tech | Cat# 22227–1-AP, RRID:AB_2651175 | IF (1:500) |
| Antibody | ODF2 (rabbit polyclonal) | Sigma | Cat# HPA001874 RRID:AB_1079522 | IF (1:200) |
| Antibody | Centrin (mouse monoclonal) | Sigma | Cat# 04–1624, RRID:AB_10563501 | IF (1:500) |
| Antibody | Ninein (rabbit polyclonal) | Protein Tech | Cat# 67132–1-Ig, RRID:AB_2882431 | IF (1:200) |
| Antibody | Actub (mouse monoclonal) | Sigma | Cat# T7451, RRID:AB_609894 | IF (1:1000) |
| Antibody | CP110 (rabbit polyclonal) | Protein Tech | Cat# 12780–1-AP, RRID:AB_10638480 | IF (1:500) |
| Antibody | γ-tubulin (DQ19) (rabbit polyclonal) | Sigma | Cat# T3195, RRID:AB_261651 | IF (1:500) |
| Antibody | RAB8 (mouse monoclonal) | BD Transduction Laboratories | Cat# 610844, RRID:AB_398163 | IF (1:100) |
| Antibody | CEP97 (rabbit polyclonal) | Protein Tech | Cat# 22050–1-AP, RRID:AB_11182378 | IF (1:1000) |
| Antibody | GM130 (mouse monoclonal) | BD Transduction Laboratories | Cat# 610822, RRID:AB_398141 | IF (1:100) |
| Antibody | Golgin97 (mouse monoclonal) | Invitrogen | Cat# A21270, RRID:AB_221447 | IF (1:100) |
| Antibody | EEA1 (rabbit polyclonal) | Gift from A. Peden | IF (1:100) | |
| Antibody | CD63 (mouse monoclonal) | Gift from A. Peden | IF (1:100) | |
| Antibody | CEP290 (rabbit polyclonal) | Bethyl | Cat# A301-659A, RRID:AB_1210910 | IF (1:500) |
| Antibody | RPGRIP1L (rabbit polyclonal) | Protein Tech | Cat# 55160–1-AP, RRID:AB_10860269 | IF (1:200) |
| Antibody | NPHP4 (rabbit polyclonal) | Protein Tech | Cat# 13812–1-AP, RRID:AB_10640302 | IF (1:200) |
| Antibody | TMEM67 (rabbit polyclonal) | Protein Tech | Cat# 13975–1-AP, RRID:AB_10638441 | IF (1:200) |
| Antibody | GFP (mouse monoclonal) | Life Technologies | Cat# A11120, RRID:AB_221568 | IF (1:1000) |
| Antibody | ARL13B (mouse monoclonal) | NeuroMab | Cat# N295B/66, RRID:AB_2877361 | IF (1:500) |
| Antibody | Actub (rabbit polyclonal) | Cell Signaling | Cat# 5335, RRID:AB_10544694 | IF (1:1000) |
| Antibody | PCNT (mouse monoclonal) | BD Transduction Laboratories | Cat# 611814, RRID:AB_399294 | IF (1:200) |
| Antibody | SMO (rabbit polyclonal) | Gift from R. Rohatgi | IF (1:500) | |
| Antibody | Ki67 (rabbit polyclonal) | Abcam | Cat# AB15580, RRID:AB_443209 | IF (1:500) |
| Antibody | CALB1 (chicken) | Neuromics | Cat# CH22118, RRID:AB_2737107 | IF (1:1000) |
| Antibody | DCX (rabbit polyclonal) | Abcam | Cat# AB18723, RRID:AB_732011 | IF (1:500) |
| Antibody | Pan-neuronal marker (rabbit polyclonal) | Sigma | Cat# ABN2300C3, RRID:AB_10953180 | IF (1:100) |
| Antibody | Alexa 488 Anti-Rabbit secondary | Jackson ImmunoResearch | Cat#711-545-152 | IF (1:500) |
| Antibody | Alexa 594 Anti-Rabbit secondary | Jackson ImmunoResearch | Cat#711-585-152 | IF (1:500) |
| Antibody | Alexa 488 Anti-Mouse secondary | Jackson ImmunoResearch | Cat#711-545-150 | IF (1:500) |
| Antibody | Alexa 594 Anti-Mouse secondary | Jackson ImmunoResearch | Cat#711-585-150 | IF (1:500) |
| Antibody | Alexa 488 Anti-Mouse IgG2a secondary | Invitrogen | Cat#A-21131 | IF (1:500) |
| Antibody | Alexa 488 Anti-Mouse IgG1 secondary | Invitrogen | Cat#A-21121 | IF (1:500) |
| Antibody | Alexa 568 Anti-Mouse IgG1 secondary | Invitrogen | Cat#A-21124 | IF (1:500) |
| Antibody | Alexa 568 Anti-Mouse IgG2b secondary | Invitrogen | Cat#A-21144 | IF (1:500) |
| Antibody | Alexa 647 Anti-Rabbit secondary | Invitrogen | Cat#A-21245 | IF (1:500) |
| Chemical compound | Hoechst 33342 | ThermoFisher Scientific | Cat#62249 | IF (1:2000) |
| Transfected construct | GFP-EHD1 (lentiviral plasmid) | Gift from C. Westlake | PMID:25686250 | |
| Transfected construct | pH-Smoothened (lentiviral plasmid) | Gift from D. Toomre | PMID:27493724 | |
| Sequence-based reagent | Dp10For: | Jackson Laboratory | Genotyping PCR primers | GGCGAACGTGGCGAGAAA |
| Sequence-based reagent | Dp10Rev | Jackson Laboratory | Genotyping PCR primers | CCTGCTGCCAAGCCATCAG |
| Sequence-based reagent | Dp16For | Jackson Laboratory | Genotyping PCR primers | CTGCCAGCCACTCTAGCTCT |
| Sequence-based reagent | Dp16Rev | Jackson Laboratory | Genotyping PCR primers | AATTTCTGTGGGGCAAAATG |
| Sequence-based reagent | Dp17For | Jackson Laboratory | Genotyping PCR primers | GGAGCCAGGGCTGATGGT |
| Sequence-based reagent | Dp17Rev | Jackson Laboratory | Genotyping PCR primers | CAACGCGGCCTTTTTACG |
| Sequence-based reagent | Cux2For | This paper | Genotyping PCR primers | GGGACATCACCCACCGGTAATCTC |
| Sequence-based reagent | Cux2Rev | This paper | Genotyping PCR primers | GACCACTGAGTCTGGCAACACG |
| Sequence-based reagent | Gli1 F | This paper | RT-PCR primers | GAATTCGTGTGCCATTGGGG |
| Sequence-based reagent | Gli1 R | This paper | RT-PCR primers | TGGGATCTGTGTAGCGCTTG |
| Sequence-based reagent | Pcna F | This paper | RT-PCR primers | GCACGTATATGCCGAGACCT |
| Sequence-based reagent | Pcna R | This paper | RT-PCR primers | GTAGGAGACAGTGGAGTGGC |
| Sequence-based reagent | siControl | Sigma | Cat #: SIC001-1NMOL | siRNA: human universal negative control #1 |
| Sequence-based reagent | siPCNT | Dharmacon | Cat #: M-012172-01-0005 | siRNA: human PCNT siRNA Smart Pool |
| Sequence-based reagent | siControl | Sigma | Cat #: SIC001-1NMOL | siRNA: mouse Accell Non-targeting Pool |
| Sequence-based reagent | siPCNT | Dharmacon | Cat #: 18541 | siRNA: mouse Accell Pcnt SMARTpool |
| Commercial assay or kit | Lipofectamine RNAi MAX | ThermoFisher Scientific | Cat. #: 13778100 | For RNAi |
| Commercial assay or kit | Lipofectamine 2000 | Invitrogen | Cat. #: 11668–027 | For lentivirus transductions |
| Commercial assay or kit | Antibody labeling kit | Invitrogen | Cat. #: A20181 | For directly conjugating PCNT to Alexa 488 |
Additional files
Download links
A two-part list of links to download the article, or parts of the article, in various formats.
Downloads (link to download the article as PDF)
Open citations (links to open the citations from this article in various online reference manager services)
Cite this article (links to download the citations from this article in formats compatible with various reference manager tools)
Trisomy 21 induces pericentrosomal crowding delaying primary ciliogenesis and mouse cerebellar development
eLife 12:e78202.
https://doi.org/10.7554/eLife.78202


