Aberrant cortical development is driven by impaired cell cycle and translational control in a DDX3X syndrome model
- Department of Molecular Genetics and Microbiology, Duke University Medical Center, United States
- Centre for Functional Genomics, Human Technopole, Italy
- Centre for Computational Biology, Human Technopole, Italy
- Department of Cell Biology, Duke University Medical Center, United States
- Duke Regeneration Center, Duke University Medical Center, United States
- Department of Cell and Tissue Biology, UCSF, United States
- Helen Diller Family Comprehensive Cancer Center, United States
- Department of Neurobiology, Duke University Medical Center, United States
- Duke Institute for Brain Sciences, Duke University Medical Center, United States
Figures
Figure 1 with 1 supplement

Conditional knockout of Ddx3x in neural progenitors using Emx1-Cre leads to microcephaly in female mice.
(A) Schematic of DDX3X protein with human missense and nonsense mutations noted, along with helicase/RNA binding domains (red, blue). Nonsense mutations, highlighted in yellow, are predicted to act in a LoF manner. (B) (Left) DDX3X protein bound to an mRNA undergoing translation. (Right) Mouse embryo and corticogenesis showing neuroepithelial cells (light green), radial glial cells (RGCs, orange), intermediate progenitors (IPs, light blue), and neurons (multi-colored); Figure 1B adapted from Figure 1A and B from Hoye and Silver, 2021. This study asks how does Ddx3x LoF impair mouse embryonic cortical development at a cellular and molecular level? (C) Representative sections of smFISH for Ddx3x in control, cHet female, and cKO male and female E12.5 cortices. (D) Quantification of Ddx3x smFISH signal in respective genotypes at E12.5. n=2–3 embryos/condition (E, F) Validation of Ddx3x mRNA knockdown in Tdtomato + cells from female (F) (control, cHet, cKO) and male (M) (control, cKO) brains sorted via FACS at E11.5 (E) and E14.5 (F). n=3–7 embryos/condition. (G) Quantification of Ddx3x levels in Tdtomato + cells from control female and male brains. n=8–10 embryos/condition. (H) Representative whole mount images of control, cHet female, and cKO male and female brains at P0. (I) Quantification of cortical area at P0. n=5–12 embryos/condition. (J) Representative sections of E14.5 brains stained with Sox2 (green), CC3 (magenta) and Hoechst (blue) showing low-magnification on left panel, and high magnification on 4 panels to the right. (K) Quantification of CC3 + cells in E14.5 control and cKO female cortices. n=4–5 embryos/condition. Scale bars, indicated. Error bars, S.D. *p<0.05, **p<0.01, ***p<0.001, ****p<0.0001. One-way ANOVA with Tukey’s (D, E, F, I), Student’s unpaired, two-tailed t-test (G, K).
Figure 1—figure supplement 1
Ddx3x loss from neural progenitors, but not neurons leads to microcephaly and apoptosis.
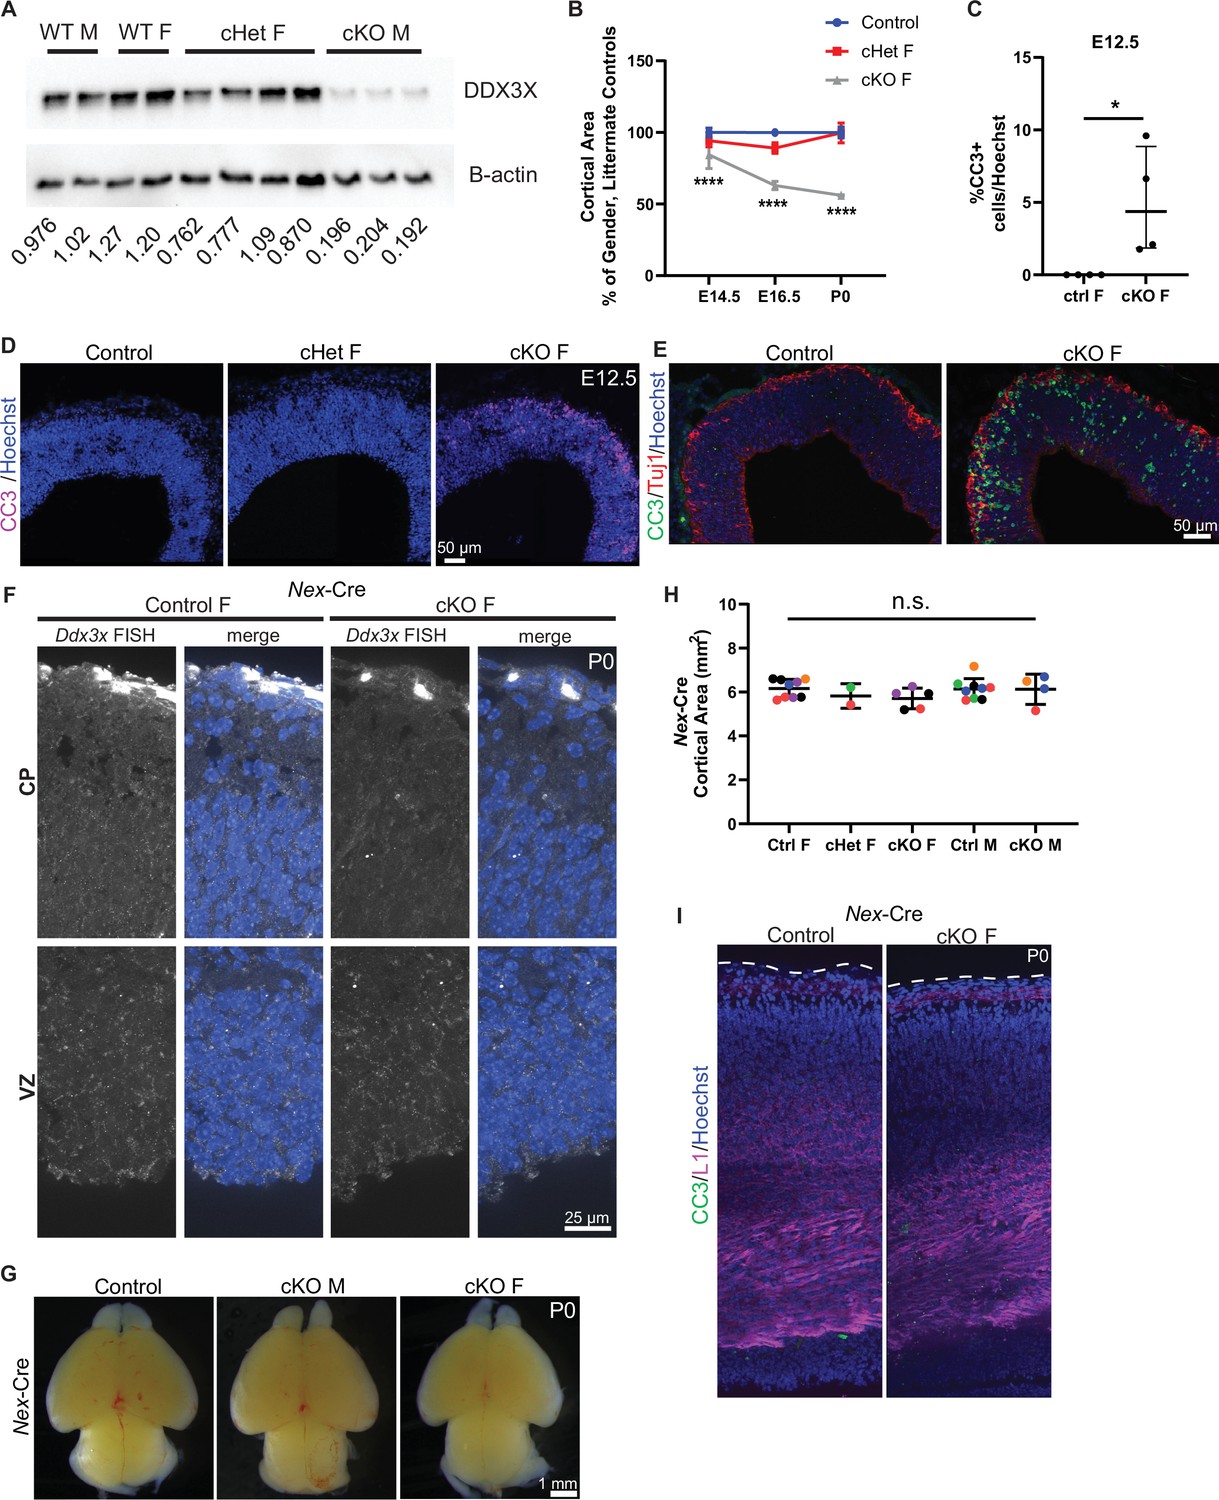
(A) Representative western blot of indicated genotypes probed for DDX3X (top) and β-actin loading control (bottom). Densitometric quantification of bands is shown below each lane. These data also indicate this antibody is specific to DDX3X and does not cross react with DDX3Y. n=2–4 embryos/condition. (B) Temporal quantification of cortical area in control, cHet F, and cKO F at E14.5, E16.5 and P0. n=3–12 embryos/condition. (C) Quantification of CC3 + cells in control and cKO F at E12.5. n=4 embryos/condition. (D) Representative coronal sections from control, cHet F, and cKO F at E12.5 immunostained with CC3 (magenta) and Hoechst. (E) Representative coronal sections from control and cKO F at E12.5 immunostained with CC3 (green), Tuj1 (red) and Hoechst. (F) Representative coronal sections of smiFISH for Ddx3x mRNA in Nex-Cre control and cKO female cortices at P0 showing the ventricular zone (VZ) and cortical plate (CP). (G) Representative whole mount images of Nex-Cre control and cKO male and female brains at P0. (H) Quantification of Nex-Cre cortical area at P0. n=2–9 embryos/condition. (I) Representative coronal sections from Nex-Cre control and cKO F at P0 immunostained with CC3 (green), L1 (magenta) and Hoechst. One-way ANOVA with Tukey’s (B, H), Student’s unpaired, two-tailed t-test (C).
-
Figure 1—figure supplement 1—source data 1
Western blot anlaysis of DDX3X in embryonic brain samples.
- https://cdn.elifesciences.org/articles/78203/elife-78203-fig1-figsupp1-data1-v1.zip
Figure 2
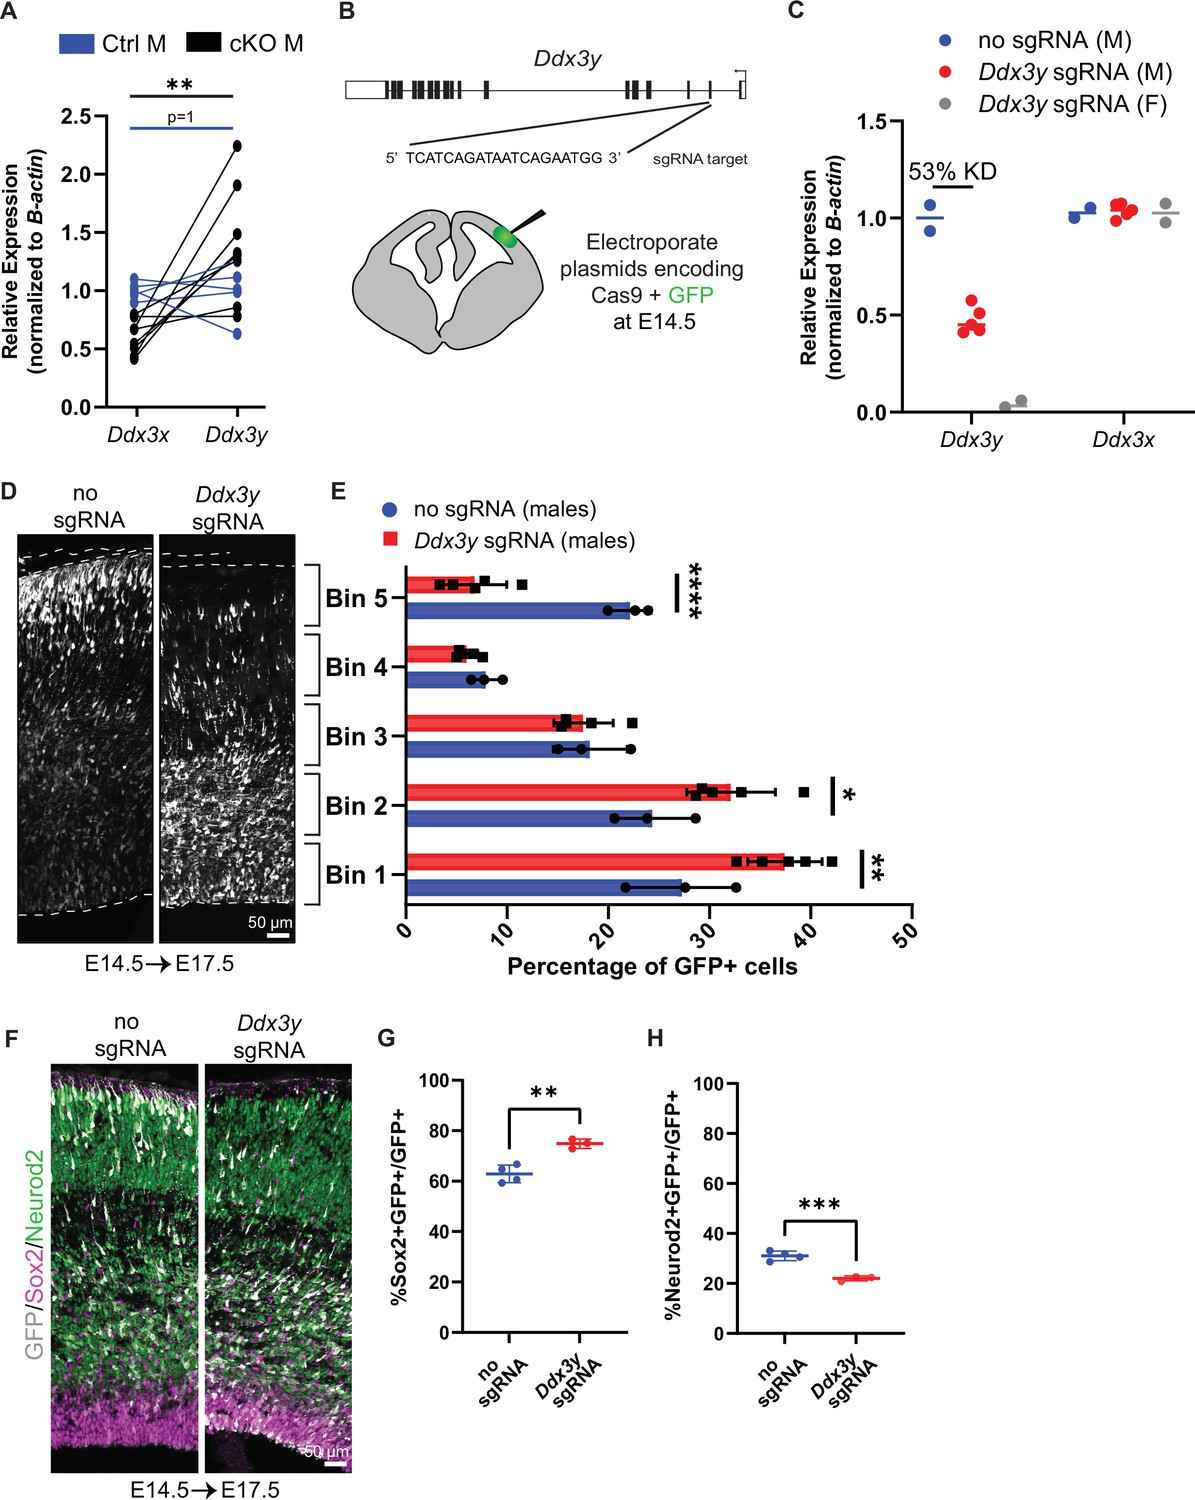
Ddx3x knockout is sexually dimorphic and Ddx3y phenocopies Ddx3x loss.
(A) RT-qPCR quantification of Ddx3x and Ddx3y mRNA levels in FACS-isolated Tdtomato + cells from cKO male E11.5 cortices. n=5–8 embryos/condition. (B) Schematic of Ddx3y CRISPR sgRNA electroporation of E14.5 brain. (C) RT-qPCR quantification of Ddx3y and Ddx3x levels in GFP +FACS-isolated cells from E17.5 male and female mice electroporated with pCAG-GFP and either no sgRNA or Ddx3y sgRNA. n=2–5 embryos/condition. (D) Representative sections of E17.5 male brains electroporated at E14.5 with pCAG-GFP and either no sgRNA or Ddx3y sgRNA and stained with anti-GFP (grey). Dotted lines, ventricular and pial surfaces; brackets delineate equivalently sized bins. (E) Quantification of distribution of GFP + cells. n=3–5 embryos/condition. (F) Same as (D), but sections were stained with anti-GFP (grey), Sox2 (magenta), and Neurod2 (green). (G, H) Quantification of GFP co-localization with Sox2 (G) or Neurod2 (H). n=3–5 embryos/condition. Scale bars, indicated. Error bars, S.D. *p<0.05, **p<0.01, ***p<0.001, ****p<0.0001. Student’s paired, two-tailed t-test (A), Two-way ANOVA with Sidak’s (E), Student’s unpaired, two-tailed t-test (G, H).
Figure 3 with 1 supplement
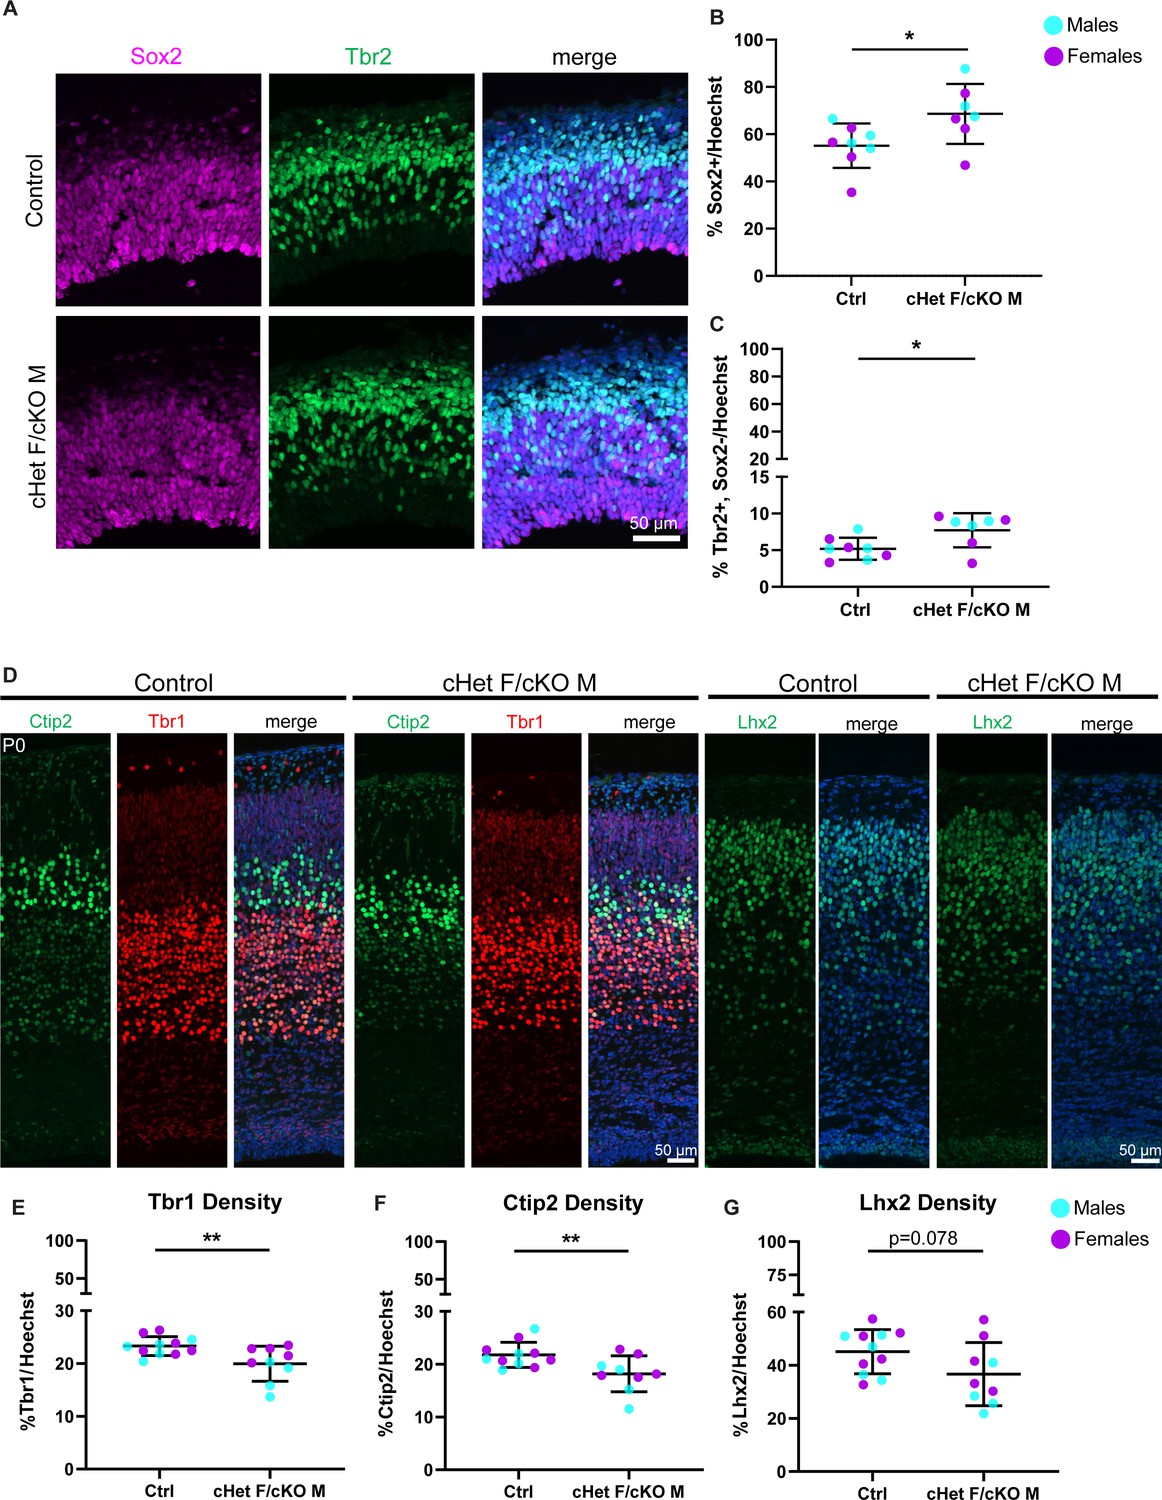
Ddx3x depletion leads to more RGCs and mature IPs, and fewer excitatory neurons across laminar layers.
(A) Representative sections from E14.5 cortices stained with Sox2 (magenta) and Tbr2 (green) (control M and cKO M shown). (B, C) Quantification of density of Sox2+ (RGCs) (B) and Tbr2 +Sox2- (mature IPs) (C) cells relative to all cells (Hoechst) at E14.5. n=7–8 embryos/condition. (D) Representative sections stained with Ctip2 (green), Tbr1 (red), and Lhx2 (green) from P0 control and cHet F/cKO M cortices (control M and cKO M shown). (E–G) Quantification of laminar marker density for Tbr1 (E), Ctip2 (F), and Lhx2 (G) relative to all cells (Hoechst). n=8–10 embryos/condition. Scale bars, indicated. Error bars, S.D. *p<0.05, **p<0.01. Student’s unpaired, two-tailed t-test (B, C, E–G).
Figure 3—figure supplement 1
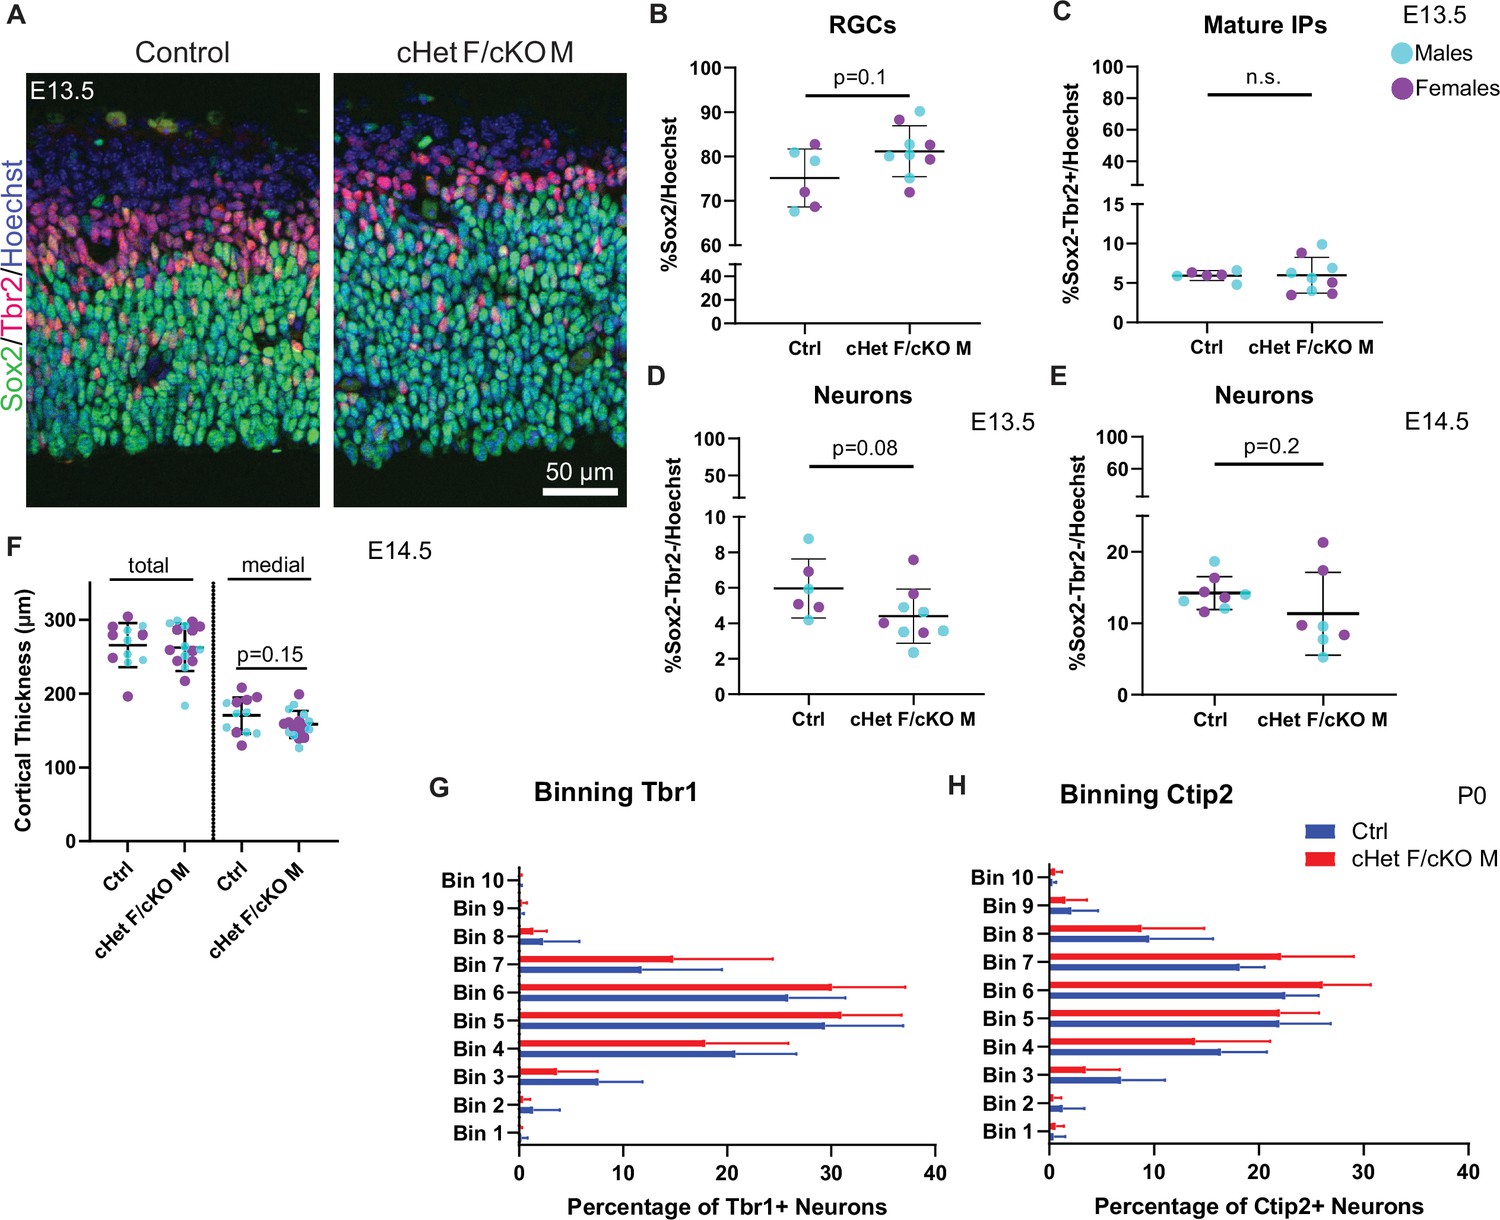
Ddx3x depletion leads to more progenitors and less neurons at E13.5, but does not affect cortical thickness or laminar position of neurons.
(A) Representative coronal sections from control and cHet F/cKO M at E13.5 immunostained with Sox2 (green), Tbr2 (magenta) and Hoechst (control M and cKO M shown). (B–E) Quantification of RGCs (Sox2+) (B), mature IPs (Sox2-,Tbr2+) (C), putative neurons (Sox2-Tbr2-), density relative to Hoechst in control and cHet F/cKO M at E13.5 (D). n=6–9 embryos/condition. Sox2-Tbr2- density relative to Hoechst in control and cHet F/cKO M at E14.5. n=7–8 embryos/condition (E). (F) Quantification of cortical thickness at E14.5 in control and cHet F/cKO M measured medially and laterally (total) or just medially. n=12–17 embryos/condition. (G, H) Quantification of the distribution of Tbr1+ (G) and Ctip2+ (H) cells in control and cHet F/cKO M at P0. Student’s unpaired, two-tailed t-test (B–F), Two-way ANOVA with Sidak’s (G, H).
Figure 4 with 1 supplement
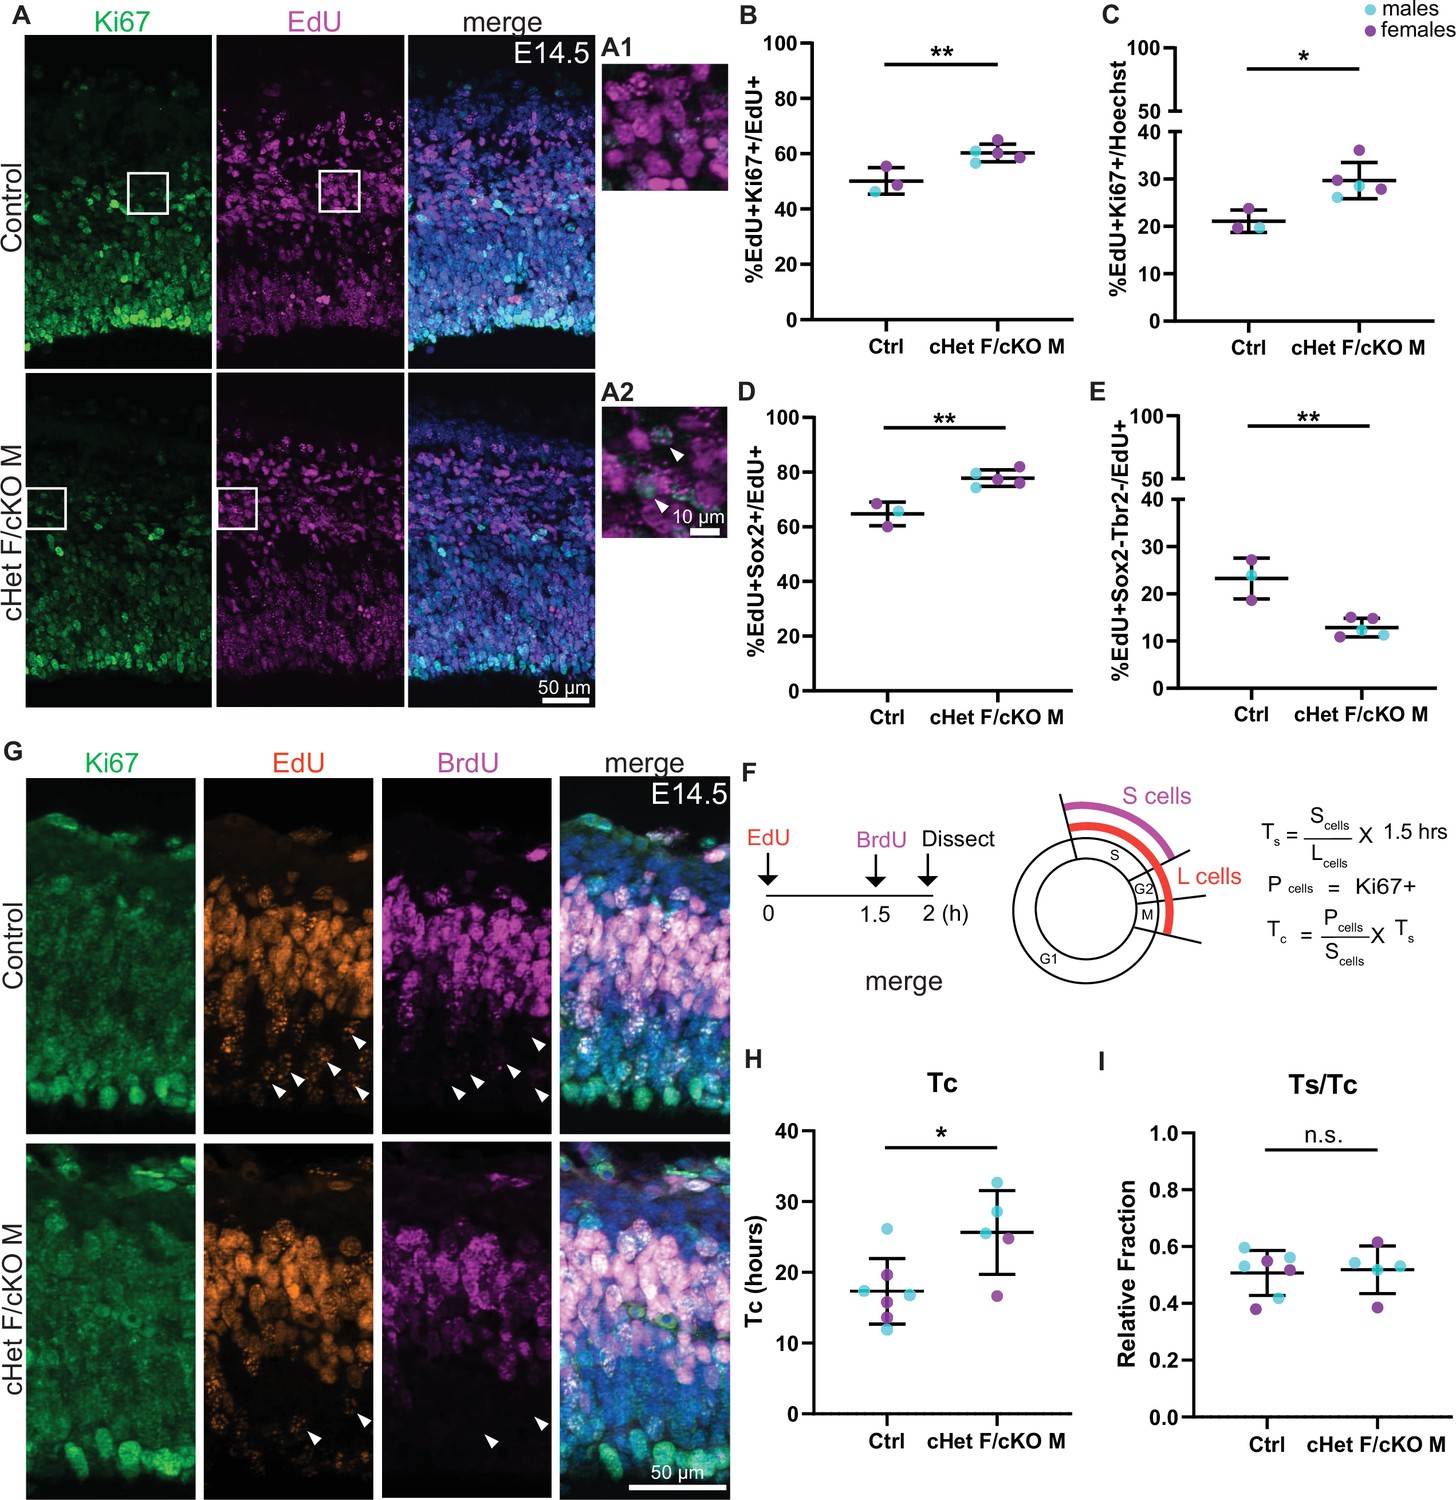
Ddx3x depletion impairs progenitor cell cycle exit and prolongs cell cycle duration.
(A) Representative sections stained with Ki67 (green) and EdU (magenta) from E14.5 control and cHet F/cKO M mice (control F and cHet F shown) pulsed with EdU at E13.5, and higher magnification insets (A1, A2). (B, C) Quantification of Ki67 +EdU + relative to EdU + cells (B) and all cells (Hoechst, C). n=3–5 embryos/condition. (D, E) Quantification of EdU +Sox2+ (D) and EdU +Sox2-Tbr2- cells (E) relative to all EdU + cells. n=3–5 embryos/condition. (F) Schematic illustrating the semi-cumulative labeling paradigm and cell cycle formulas. Figure 4F has been adapted from Figure 4J from Boyd et al., 2015. (G) Representative medial sections of E14.5 control and cHet F/cKO M brains stained with Ki67 (green), EdU (red) and BrdU (magenta) and pulsed with EdU and BrdU (control M and cKO M shown). Arrows indicate EdU +BrdU cells (i.e: leaving cells). (H) Quantification of cell cycle duration (Tc) in control and cHet F/cKO M. n=5–7 embryos/condition. (I) Quantification of Ts/Tc in control and cHet F/cKO M. n=5–7 embryos/condition. Scale bars, indicated. Error bars, S.D. *p<0.05, **p<0.01. Student’s unpaired, two-tailed t-test (B–E, H, I).
Figure 4—figure supplement 1
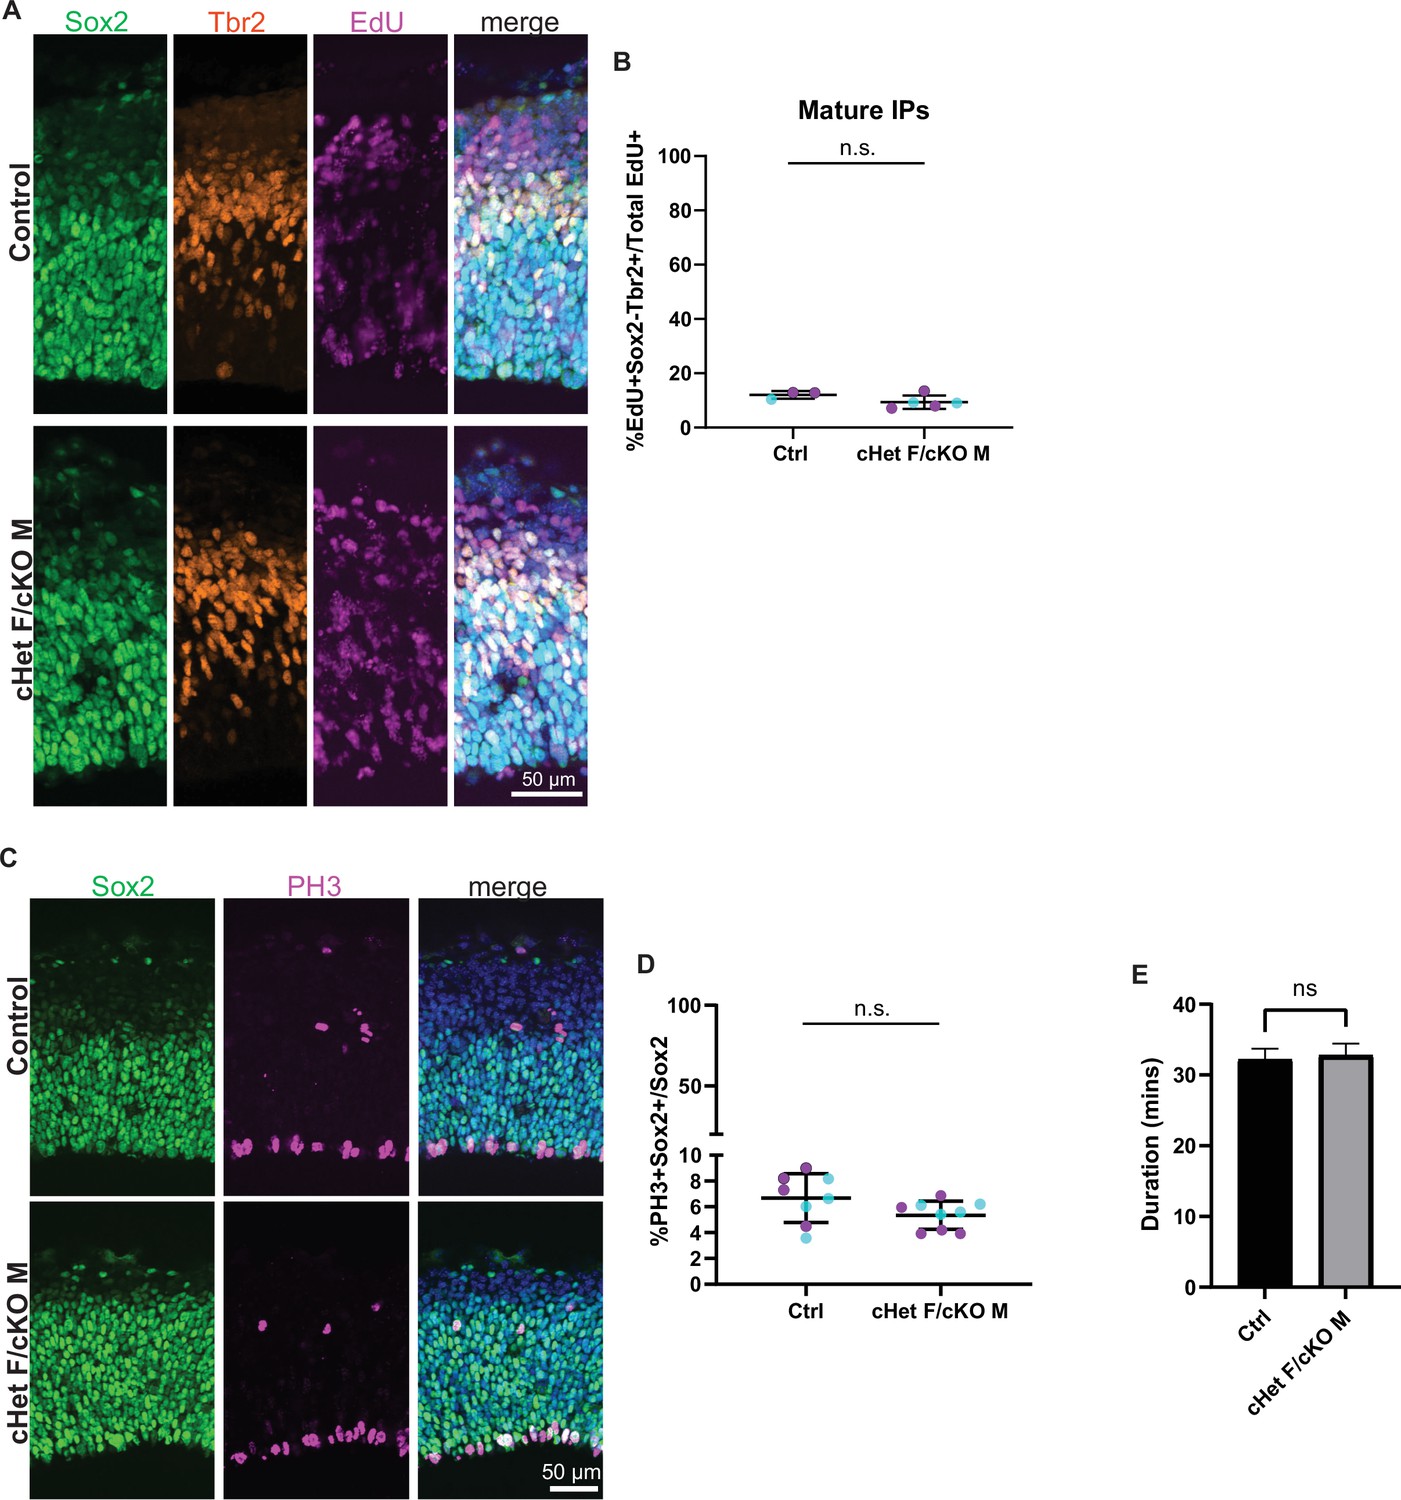
Ddx3x depletion prolongs cell cycle duration in RGCs and immature IPs but does not affect mitosis duration.
(A) Representative coronal sections from control and cHet F/cKO M at E14.5 immunostained with Sox2 (green), Tbr2 (red), EdU (magenta) and Hoechst (control F and cHet F shown). (B) Quantification of density of mature IPs (EdU+Sox2-Tbr2+) relative to total EdU in control and cHet F/cKO M at E14.5. n=3–5 embryos/condition. (C) Representative coronal sections from control and cHet F/cKO M at E14.5 immunostained with Sox2 (green), PH3 (magenta), and Hoechst (control M and cKO M shown). (D) Quantification of PH3+Sox2+/Sox2+ in control and cHet F/cKO M. n=8–9 embryos/condition. (E) Quantification of mitosis duration in control and cHet F/cKO M at E14.5 from live imaging analysis. n=>100 cells/condition/trial with three trials. Student’s unpaired, two-tailed t-test (B, D, E).
Figure 5
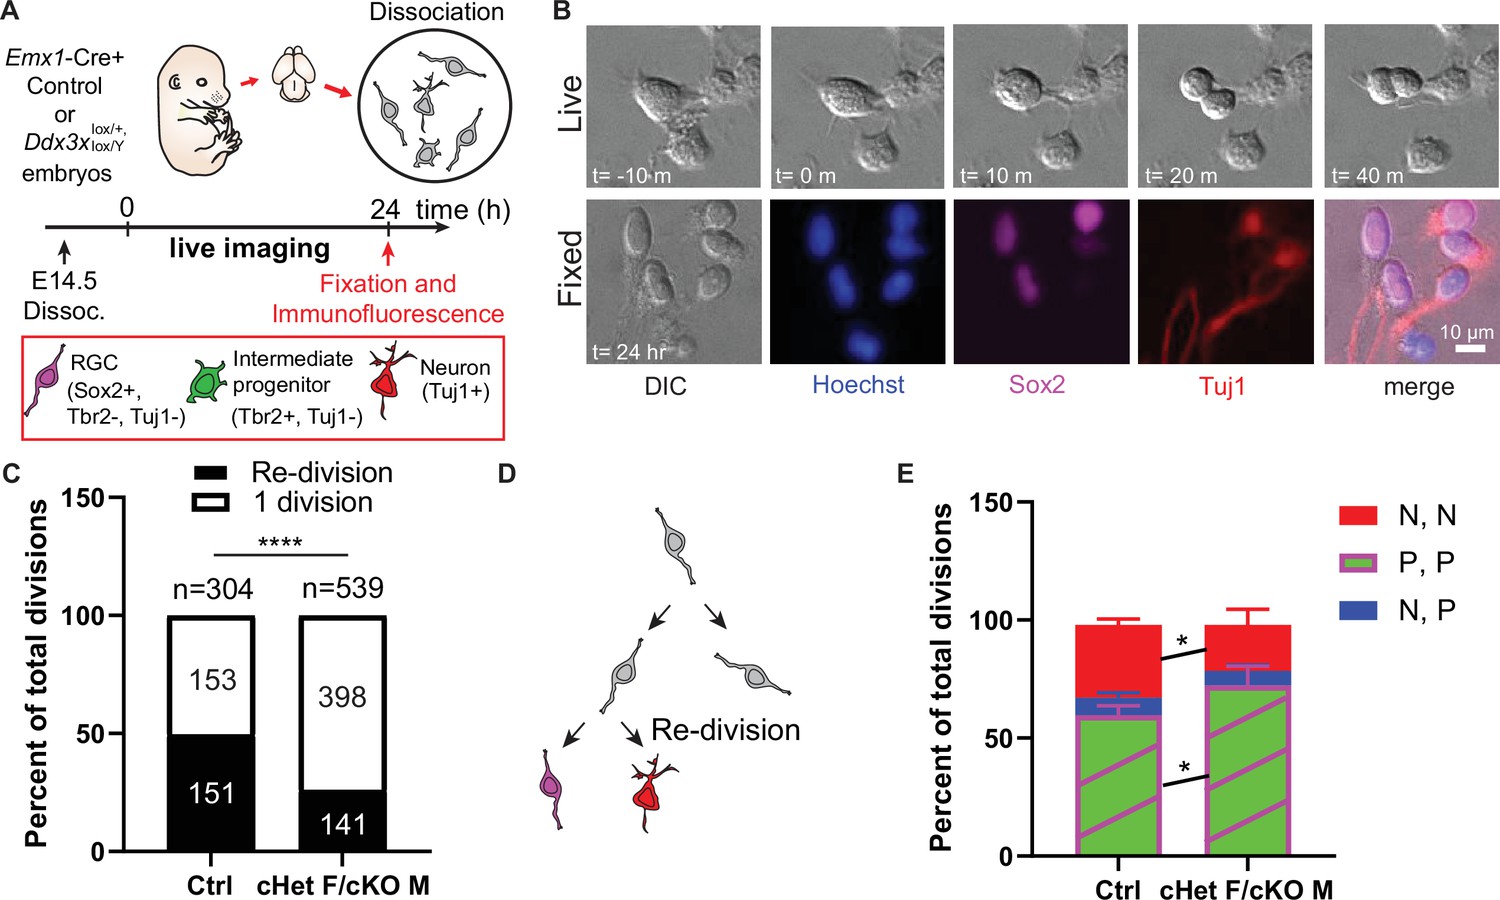
Ddx3x-depleted progenitors exhibit prolonged cell division and more proliferative divisions at the expense of neurogenic divisions.
(A) Live imaging paradigm for monitoring cell fate. Figure 5A has been adapted from Figure 3A and E from Pilaz et al., 2016. (B) Live imaging DIC snapshots at indicated t=minutes or hours, and fixed images stained with indicated markers. (C) Quantification of re-divisions (black) and 1 division (white) in control and cHet F/cKO M. n=304 (control) and 539 (cHet F/cKO M) total cells. (D) Schematic illustrating an example of a re-division. (E) Quantification of cell fate for P,P divisions (2 Sox2+ RGCs, or 2 Tbr2+ IPs, or 1 Sox2+ RGC and 1 Tbr2+Tuj1- IP); P, N divisions (1 Tuj1+ neuron and either 1 Sox2+ RGC or 1 Tbr2+ IP); N, N divisions (2 Tuj1+ neurons). n=>70 cells/condition/trial with three trials. Scale bars, indicated. Error bars, S.D. *p<0.05, ****p<0.0001. Two-tailed Fisher’s exact test (C), Two-way ANOVA with Sidak’s correction (E).
Figure 6 with 2 supplements
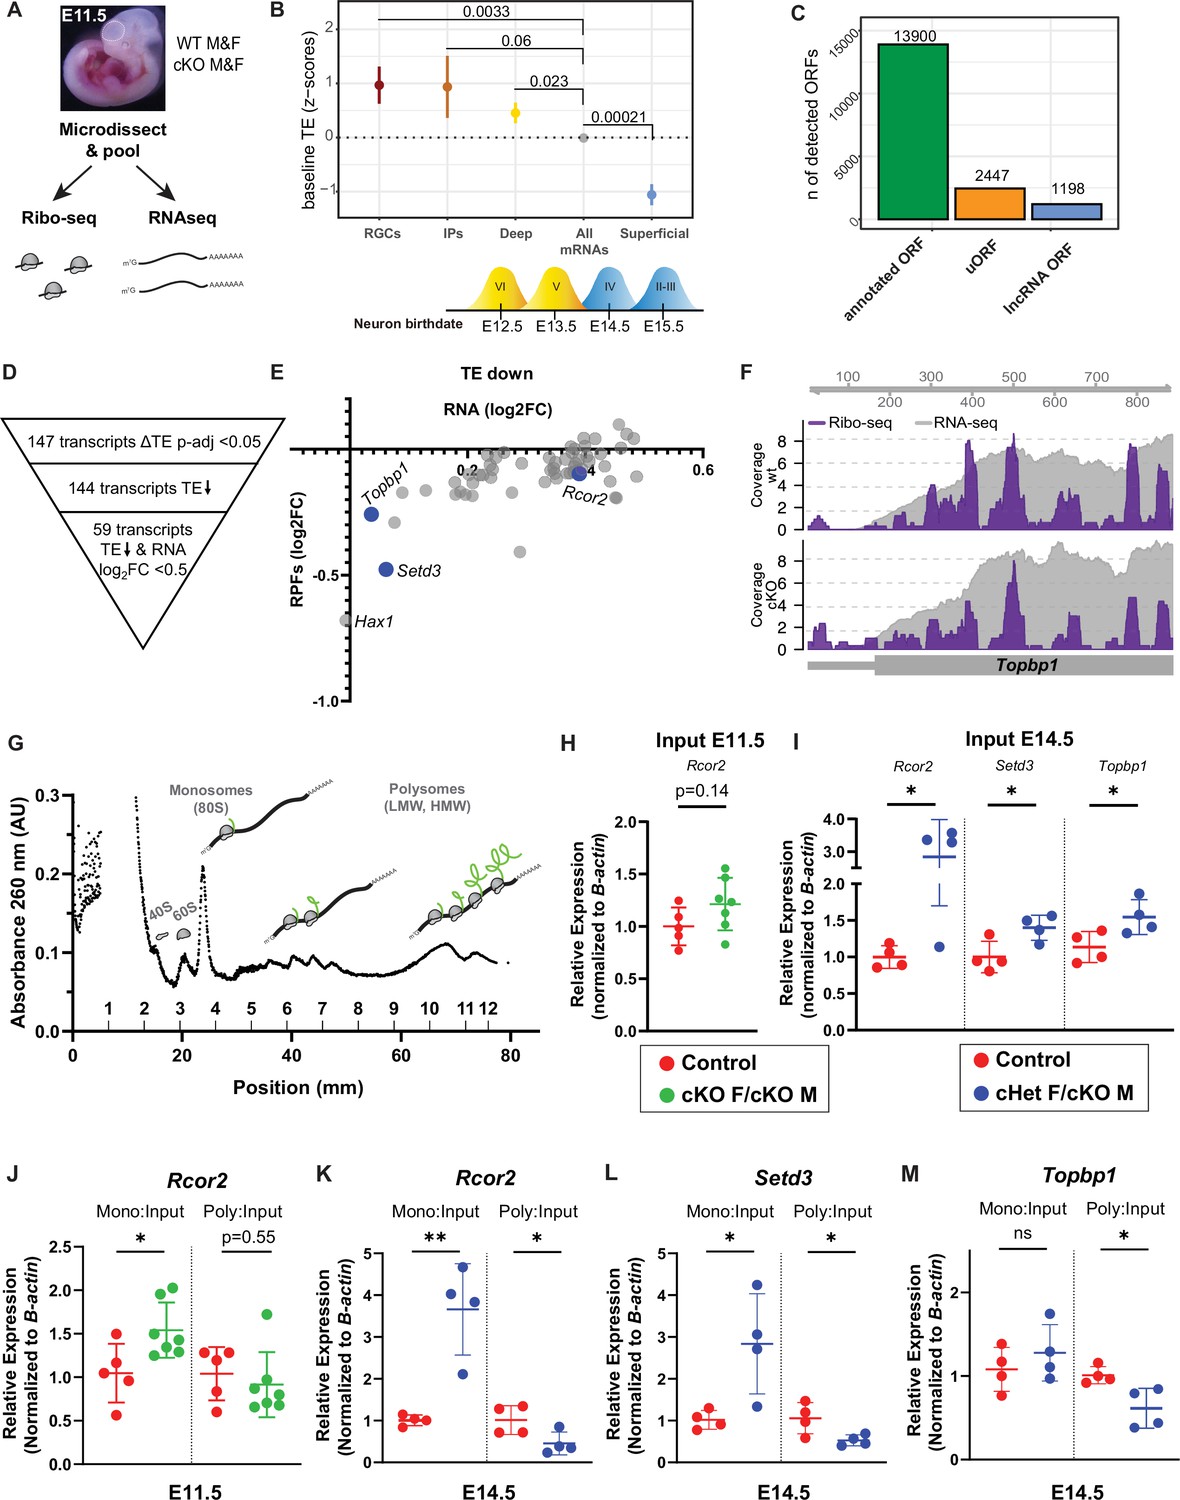
Ribosome Profiling in embryonic brains uncovers the E11.5 translatome including DDX3X-dependent translation targets.
(A) Experimental paradigm for Ribo-seq and RNAseq of E11.5 cortices from control and cKO mice. n=3/sex/condition with four embryos pooled per n. (B) TE of transcripts enriched in RGCs, IPs, deep layer neurons (VI-V) and superficial layer neurons (IV-II) relative to all other mRNAs (TPM >10). Birthdates for laminar layers are indicated below. See Supplementary file 3 for exact transcripts. (C) ORFquant analysis of wildtype Ribo-seq data showing identification of annotated ORFs and uORFs in protein-coding and non-coding isoforms. (D) Schematic illustrating how DDX3X-dependent targets were prioritized. (E) Scatter plot of RPFs log2FC versus RNA log2FC for 59 DDX3X-dependent targets with significantly lower TE. Putative Ribo-seq targets selected for validation are highlighted in blue. (F) IGV screenshots illustrating RNAseq reads (gray) and RPFs (Ribo-seq; purple) for Topbp1 in cKO mice relative to control. (G) Representative trace from polysome fractionation of E14.5 cortical lysate. (H–M) RT-qPCR quantification of mRNA levels for Ribo-seq candidates in input samples at E11.5 (H) and at E14.5 (I), and monosome and polysome fractions at E11.5 (J) and E14.5 (K–M). n=5–7/condition (H, J) and 4/condition (I, K–M) with two embryos pooled per n. Error bars, S.D. *p<0.05, **p<0.01. Two-sided Wilcoxon test (B), Student’s unpaired, two-tailed t-test (H–M).
Figure 6—figure supplement 1
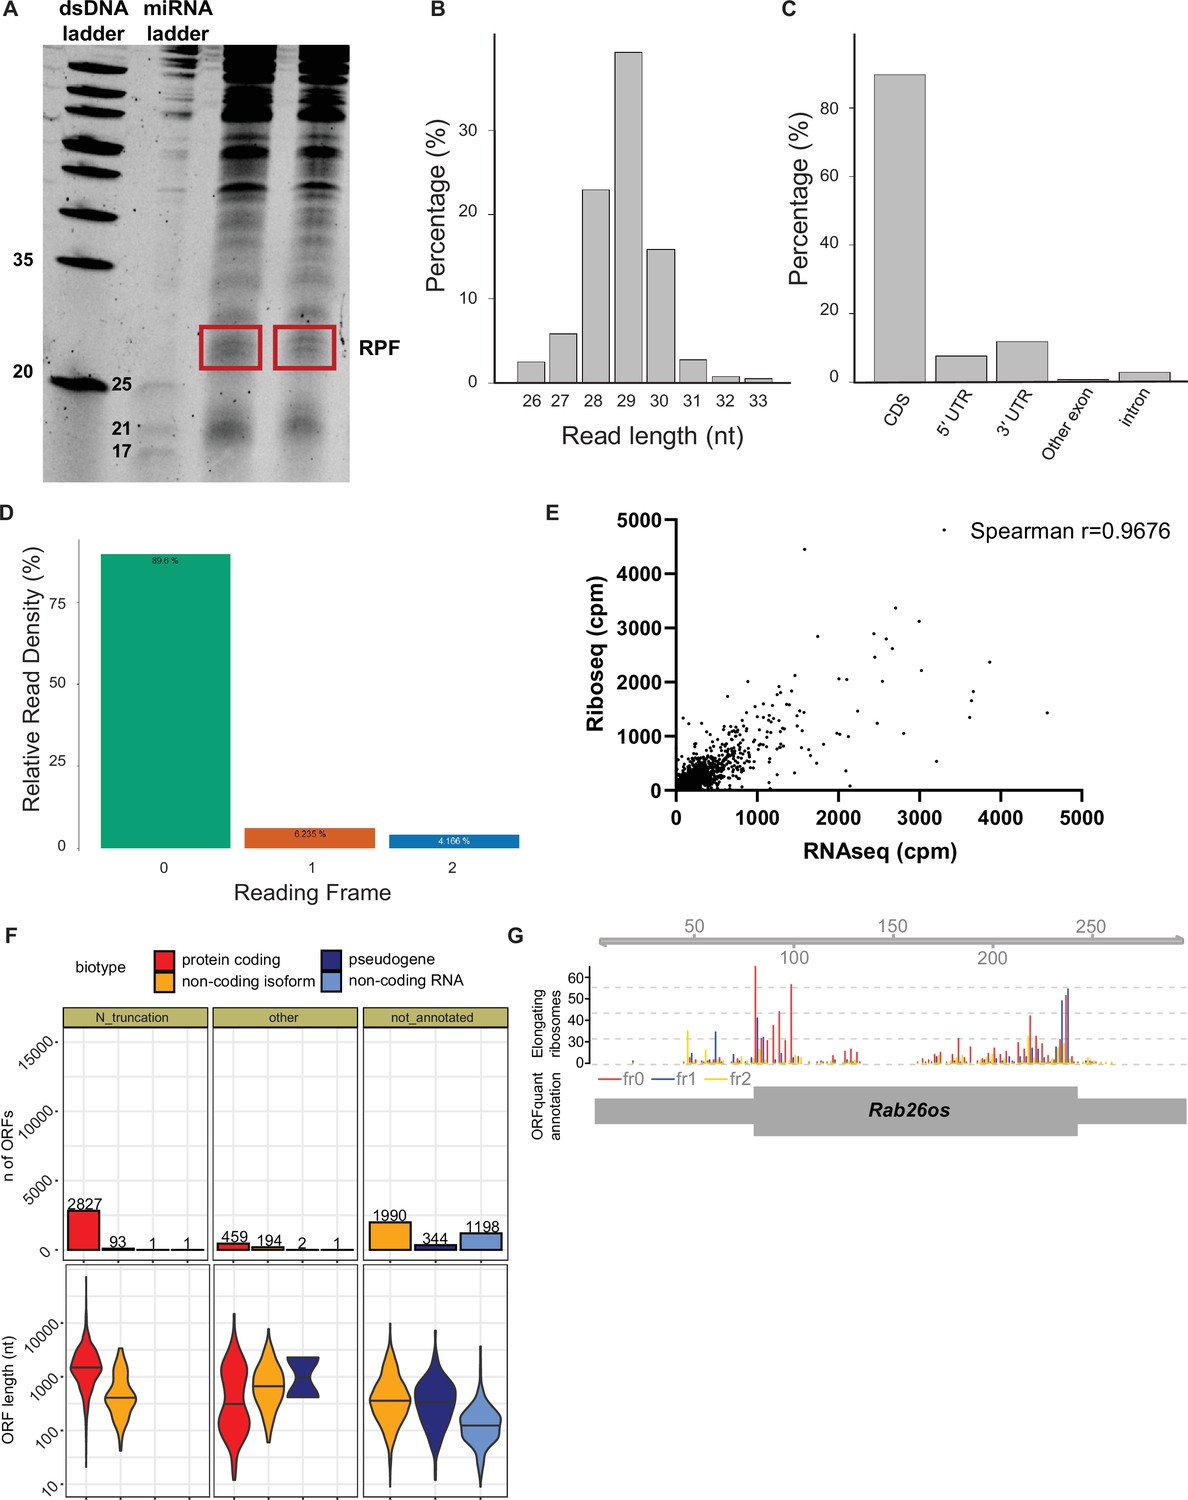
Quality Control Assessment of Ribosome Profiling in Ddx3x cKO mice.
(A) Representative denaturing urea gel of embryonic cortices treated with RNase I illustrating RPFs (red box). (B–D) RibosomeProfilingQC assessment of deep sequencing of cDNA libraries showing read length distribution (B), percent of reads mapping to CDS and UTRs, etc (C), and reading frame (D). (E) Comparison of RNAseq cpm and Riboseq cpm using all reads from all transcripts from WT data (excluding non-polyA histone and multi-mapping ribosomal genes); Spearman r=0.9676. Five transcripts were omitted when reducing axes for readability. (F) De novo identification of translated ORFs, including number of detected ORFs with their length (in nucleotides) for different ORF categories and annotated biotypes. (G) A novel translated ORF in the lncRNA Rab26os showing the P-sites position colored by frame (middle), and ORF quant-derived annotation (bottom).
-
Figure 6—figure supplement 1—source data 1
Quality Control Assessment of Ribosome Profiling.
- https://cdn.elifesciences.org/articles/78203/elife-78203-fig6-figsupp1-data1-v1.zip
Figure 6—figure supplement 2
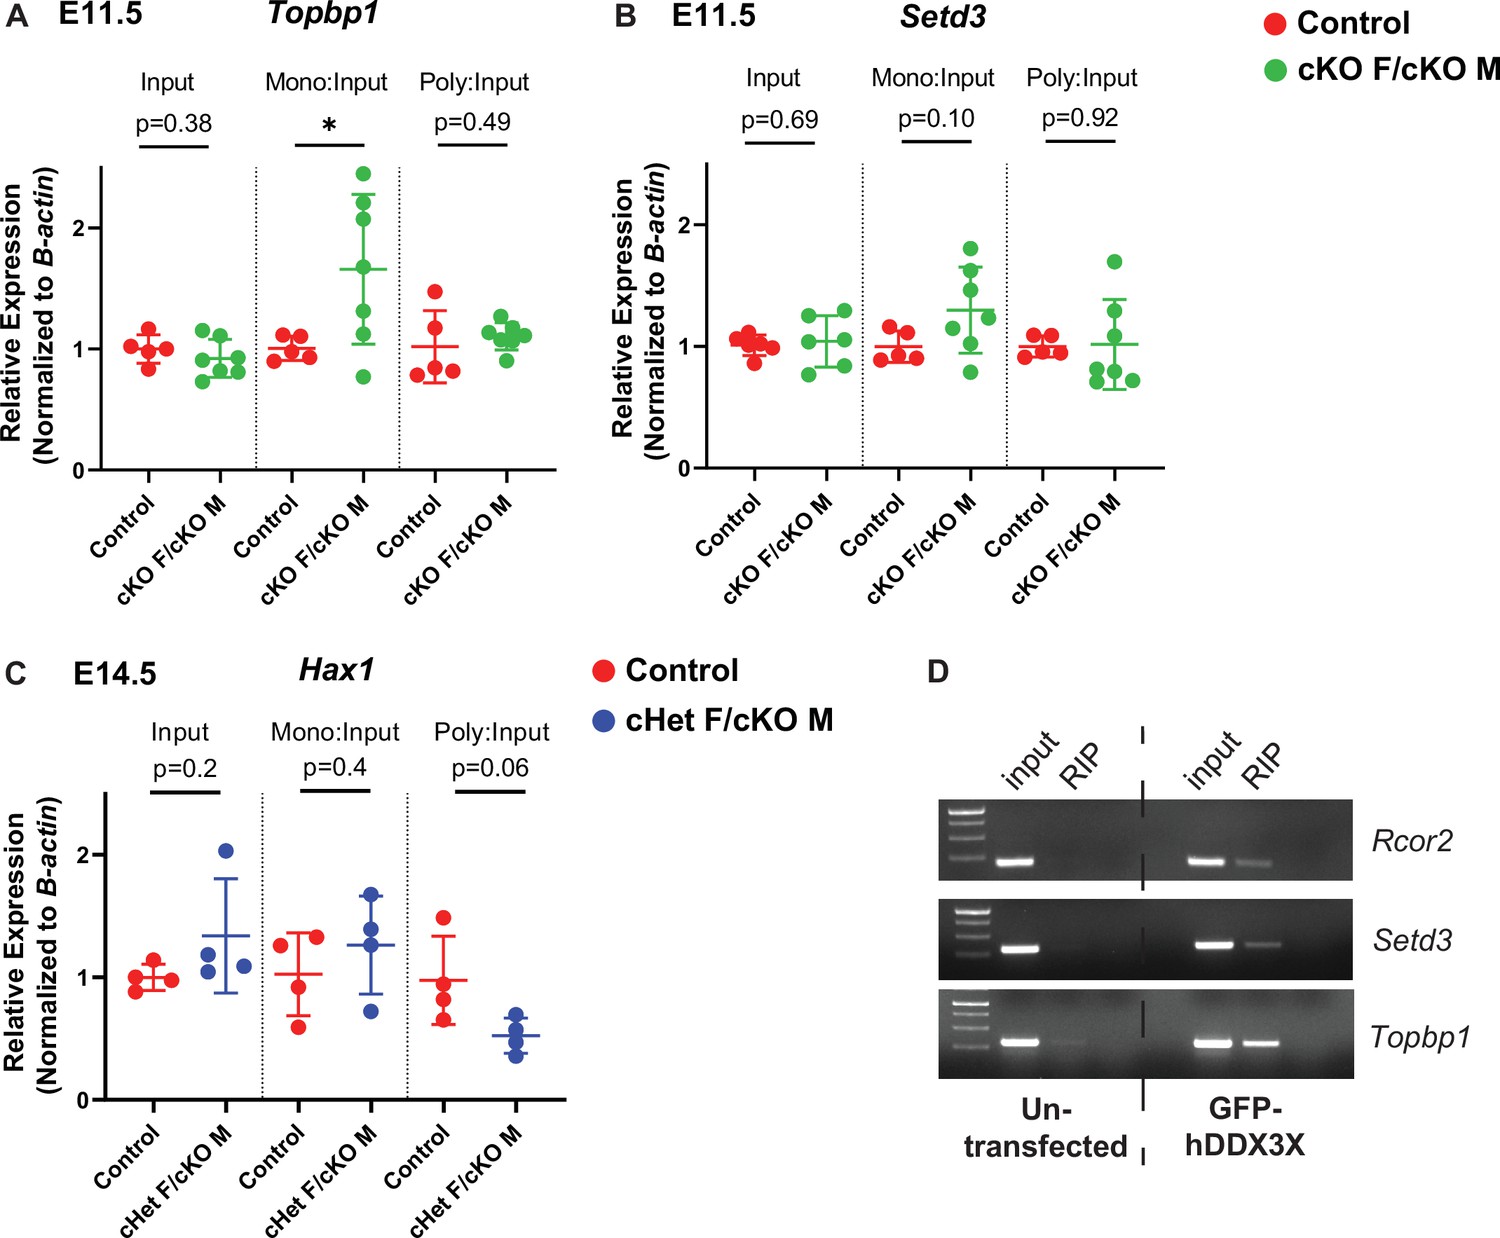
Polysome fractionation and RNA immunoprecipitations showing DDX3X targets in the cortex.
(A–C) RT-qPCR quantification of mRNA levels for Ribo-seq candidates in input samples, monosome and polysome fractions at E11.5 for Topbp1 (A) and Setd3 (B) and at E14.5 for Hax1 (C). (D) Representative gels of RNA immunoprecipitation of DDX3X translation targets, Rcor2, Setd3, and Topbp1. n=5–7 embryos/condition (A, B), 4 embryos/condition (C), 3 biological replicates (D). Student’s unpaired, two-tailed t-test (A–C).
-
Figure 6—figure supplement 2—source data 1
RNA immunoprecipitations of targets by DDX3X.
- https://cdn.elifesciences.org/articles/78203/elife-78203-fig6-figsupp2-data1-v1.zip
Figure 7

DDX3X-dependent translation target, Setd3, is required for neurogenesis.
(A) RT-qPCR quantification of Setd3 knockdown in N2A cells. n=4/condition with two independent trials. (B) Representative sections of E17.5 brains from mice electroporated at E14.5 with pCAG-GFP and scrambled or Setd3 siRNAs and immunostained with GFP (grey), Sox2 (magenta), Neurod2 (green). (C) Quantification of distribution of GFP-positive cells in 5 even bins of cortex. n=4 embryos/condition. (D, E) Quantification of GFP co-localization with Sox2+ (D) and Neurod2+ (E) cells. n=4 embryos/condition. (F) Schematic model summarizing how loss of DDX3X-dependent translation impairs neurogenesis. Scale bars, indicated. Error bars, S.D. *p<0.05, ****p<0.0001. Student’s unpaired, two-tailed t-test (A, D, E), Two-way ANOVA with Sidak’s correction (C).
Author response image 1
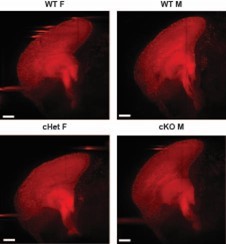
Representative 100um optical sagittal sections (50um on either side of the midsagittal plane) of brains of noted genotype generated using Imaris software.
Scale bar = 300mm.
Author response image 2
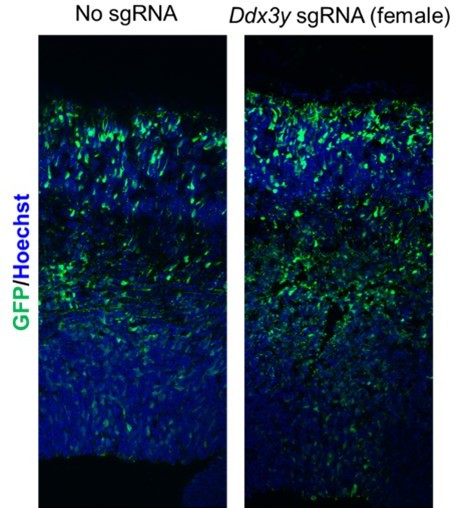
Representative images of female cortices electroporated with Ddx3y gRNA.
Tables
Key resources table
| Reagent type (species) or resource | Designation | Source or reference | Identifiers | Additional information |
|---|---|---|---|---|
| Gene (Mus musculus) | Ddx3x | NA | MGI:103064; NCBI Gene: 13,205 | |
| Gene (M. musculus) | Ddx3y | NA | MGI:1349406; NCBI Gene: 26,900 | |
| Gene (M. musculus) | Rcor2 | NA | MGI:1859854; NCBI Gene: 104,383 | |
| Gene (M. musculus) | Setd3 | NA | MGI:1289184; NCBI Gene: 52,690 | |
| Gene (M. musculus) | Topbp1 | NA | MGI:1920018; NCBI Gene: 235,559 | |
| Genetic reagent (M. musculus) | C57BL/6 J | Jackson Laboratory | JAX #000664; RRID:IMSR_JAX:000664 | |
| Genetic reagent (M. musculus) | Emx1-Cre | Jackson Laboratory | JAX #005628; RRID:IMSR_JAX:005628; MGI:2684610 | MGI symbol: Emx1 tm1(cre)Krj |
| Genetic reagent (M. musculus) | Rosa26Ai14 | Jackson Laboratory | JAX #007914; RRID:IMSR_JAX:007914 | MGI symbol: Gt(ROSA)26Sor tm14(CAG-tdTomato)Hze |
| Genetic reagent (M. musculus) | Neurod6-Cre (NEX-Cre) | PMID:17146780 | MGI:2668659 | MGI symbol: Neurod6 tm1(cre)Kan |
| Genetic reagent (M. musculus) | Ddx3xlox/lox | PMID:27179789 | MGI:5774968 | MGI symbol: Ddx3x tm1.1Lyou |
| Genetic reagent (M. musculus) | Ddx3y sgRNAs | this paper | NCBI gene: 26,900 | generated with Benchling for depleting Ddx3y; see Figure 2 |
| Genetic reagent (M. musculus) | smFISH probes for Ddx3x | this paper | NCBI gene: 13,205 | generated with script from Tsanov et al., 2016 for monitoring Ddx3x RNA; see Figure 1 |
| Genetic reagent (M. musculus) | Scrambled siRNAs | Qiagen | Qiagen:1022076 | |
| Genetic reagent (M. musculus) | Setd3 siRNAS | Qiagen | Qiagen:1027416 | Gene ID: 52,690 |
| Cell line (M. musculus, male) | Neuro-2a | ATCC | ATCC:CCL-131; RRID:CVCL_0470 | |
| Strain, strain background | NEB 5-alpha Competent E. coli (High Efficiency) | New England Biolabs | NEB:C2987H | |
| Sequence-based reagent (M. musculus) | Rcor2 qPCR primers | Harvard PrimerBank; PMID:22086960 | Harvard PrimerBank ID: 154147710 c2; Forward 5'-TGCTTCTGTGGCATAAACACG-3'; Reverse 5'-GGCTGGGAATCACCTTGTCAG-3' | |
| Sequence-based reagent (M. musculus) | Setd3 qPCR primers | Harvard PrimerBank; PMID:22086960 | Harvard PrimerBank ID: 21312266a1; Forward 5'-AAATCAGGTACTGGGGCTACA-3'; Reverse 5'-GGCCCATTTCATTAGATCAGGGA-3' | |
| Sequence-based reagent (M. musculus) | Topbp1 qPCR primers | Harvard PrimerBank; PMID:22086960 | Harvard PrimerBank ID: 118130322 c1; Forward 5'-CAGGATTGTTGGTCCTCAAGTG-3'; Reverse 5'-ACAGGATACAGTTACGTCAGACA-3' | |
| Antibody | anti-SOX2 (rat monoclonal) | ThermoFisher | ThermoFisher:14-9811-82; RRID:AB_11219471 | (1:1000) |
| Antibody | anti-BrdU (rat monoclonal) | Abcam | Abcam:ab6326 | (1:200) |
| Antibody | anti-TUJ1 (mouse monoclonal) | Biolegend | Biolegend:801202; RRID:AB_10063408 | (1:2000) |
| Antibody | anti-CTIP2 (rat monoclonal) | Abcam | Abcam:AB18465 | (1:500) |
| Antibody | anti-TBR2 (rabbit polyclonal) | Abcam | Abcam:AB23345; RRID:AB_778267 | (1:1000) |
| Antibody | anti-CC3 (rabbit polyclonal) | Cell Signaling | Cell Signaling:9661; RRID:AB_2341188 | (1:250) |
| Antibody | anti-NEUROD2 (rabbit polyclonal) | Abcam | Abcam:AB104430; RRID:AB_10975628 | (1:500) |
| Antibody | anti-Ki67 (rabbit monoclonal) | Cell Signaling Technology | Cell Signaling:12,202 | (1:1000) |
| Antibody | anti-PH3 (rabbit polyclonal) | Millipore | Millipore:06–570 | (1:500) |
| Antibody | anti-TBR1 (rabbit monoclonal) | Cell Signaling Technology | Cell Signaling Technology:49,661 S | (1:1000) |
| Antibody | anti-DDX3X (rabbit polyclonal) | Sigma Aldrich | Sigma Aldrich:HPA001648; RRID:AB_1078635 | (IF, 1:500; western, 1:1000) |
| Antibody | anti-GFP (chicken polyclonal) | Abcam | Abcam:Ab13970; RRID:AB_300798 | (1:1000) |
| Antibody | anti-B-actin (mouse monoclonal) | Santa Cruz | Santa Cruz:sc-47778 | (1:500) |
| Antibody | anti-mouse HRP (goat polyclonal) | ThermoFisher | ThermoFisher:32430; RRID:AB_1185566 | (1:2000) |
| Antibody | anti-rabbit HRP (goat polyclonal) | ThermoFisher | ThermoFisher:A16110; RRID:AB_2534782 | (1:2000) |
| Antibody | anti-GFP (mouse monoclonal) | Santa Cruz | Santa Cruz:sc9996 | |
| Antibody | AlexaFluor-conjugated secondary antibodies (488, 555, 568, 594, 647) | ThermoFisher | (1:500) | |
| Recombinant DNA reagent | pX330-U6-Chimeric_BB-CBh-hSpCas9 | Addgene | AddGene:42230; RRID:Addgene_42230 | |
| Recombinant DNA reagent | pX330-U6-Chimeric_BB-CBh-hSpCas9+Ddx3y guides | this paper | Cloned for depletion of Ddx3y; see Figure 2 | |
| Recombinant DNA reagent | pCAG-GFP | PMID:32135084 | ||
| Recombinant DNA reagent | pCAG-GFP-human DDX3X | PMID:32135084 | ||
| Commercial assay or kit | Click-it EdU AlexaFluor 594 imaging kit | Life Technologies | Life Technologies:c10339 | |
| Commercial assay or kit | Qiagen RNAeasy kit | Qiagen | Qiagen:74,034 | |
| Commercial assay or kit | Qiagen miRNA library prep kit | Qiagen | Qiagen:331,502 | |
| Commercial assay or kit | RiboMinus Eukaryote kit v2 | ThermoFisher | ThermoFisher:A15020 | |
| Commercial assay or kit | RNA Analysis Kit (15 nt) | Agilent | Agilent:DNF-471 | |
| Commercial assay or kit | Kapa mRNA HyperPrep kit with mRNA capture | KapaBiosystems | KapaBiosystems:KR1352 | |
| Commercial assay or kit | iScript cDNA synthesis kit | BioRad | BioRad:1708891 | |
| Commercial assay or kit | iTaq Universal Sybr Green Supermix | BioRad | BioRad:1725121 | |
| Commercial assay or kit | BCA protein quantification | ThermoFisher | ThermoFisher:23,227 | |
| Commercial assay or kit | ECL | ThermoFisher | ThermoFisher:32,106 | |
| Chemical compound, drug | EdU | ThermoFisher | ThermoFisher:A10044 | |
| Chemical compound, drug | BrdU | Sigma Aldrich | Sigma:B5002 | |
| Chemical compound, drug | Cycloheximide | Calbiochem | Sigma:239,764 | |
| Software, algorithm | Fiji/ImageJ | PMID:22743772 | v1.52i | |
| Software, algorithm | QuPATH | PMID:29203879 | v0.3.2 | |
| Software, algorithm | bowtie2 | PMID:22388286 | v2.4.4 | |
| Software, algorithm | STAR | PMID:23104886 | v2.7.9a | |
| Software, algorithm | RibosomeProfilingQC | DOI:10.18129/B9.bioc.ribosomeProfilingQC | v1.8.0 | |
| Software, algorithm | Ribo-seQC | DOI:10.1101/601468 | v0.99 | |
| Software, algorithm | DESeq2 | PMID:25516281 | v1.34.0 | |
| Software, algorithm | ORFquant | PMID:33765284 | v1.02 | |
| Software, algorithm | R | R Foundation for Statistical Computing | v4.1.0 | |
| Other | Vectashield | Vector Labs | Vector Labs:H-1000–10 | See immunoflourescence section in methods |
| Other | DAPI stain | ThermoFisher | ThermoFisher:D1306 | See FACS section in methods |
| Other | Propidium iodide stain | ThermoFisher | ThermoFisher:P3566 | See FACS section in methods |
| Other | Hoechst stain | ThermoFisher | ThermoFisher:H3570 | See immunoflourescence section in methods |
| Other | Turbo DNase I | Invitrogen | Invitrogen:AM2238 | See RNAseq and ribosome footprinting section in methods |
| Other | Superase In | Invitrogen | Invitrogen:AM2694 | See RNAseq and ribosome footprinting section in methods |
| Other | TRIzol | Invitrogen | Invitrogen:15596026 | See RNAseq and ribosome footprinting section in methods |
| Other | GlycoBlue | Invitrogen | Invitrogen: AM9515 | See RNAseq and ribosome footprinting section in methods |
| Other | PNK enzyme | New England Biolabs | NEB:M0247S | See RNAseq and ribosome footprinting section in methods |
| Other | 15% acrylamide denaturing urea-gel | BioRad | BioRad:4566053 | See RNAseq and ribosome footprinting section in methods |
| Other | 2 X sample dye | Novex | Novex:LC6876 | See RNAseq and ribosome footprinting section in methods |
| Other | dsDNA ladder | ThermoFisher | ThermoFisher:10488023 | See RNAseq and ribosome footprinting section in methods |
| Other | miRNA ladders | New England Biolabs | NEB:N2102S | See RNAseq and ribosome footprinting section in methods |
| Other | SYBR gold | Invitrogen | Invitrogen:S11494 | See RNAseq and ribosome footprinting section in methods |
| Other | SpinX column | Corning | Corning:CLS8162 | See RNAseq and ribosome footprinting section in methods |
| Other | TRIzol LS reagent | ThermoFisher | ThermoFisher:10296010 | See RNA Immunoprecipitation section in methods |
| Other | Lipofectamine 2000 | ThermoFisher | ThermoFisher:11668019 | See RNA Immunoprecipitation section in methods |
| Other | Protein G-coated Dynabeads | ThermoFisher | ThermoFisher:0003D | See RNA Immunoprecipitation section in methods |
| Other | GoTaq Green Master Mix | Promega | Promega:M712 | See RNA Immunoprecipitation section in methods |
| Other | 1 X RIPA buffer | Pierce | Pierce:89,900 | See SDS-PAGE and western blot analysis section in methods |
| Other | 2 X sample buffer | BioRad | BioRad:1610737 | See SDS-PAGE and western blot analysis section in methods |
| Other | protease inhibitors | Sigma Aldrich | Sigma:78,429 | See SDS-PAGE and western blot anlaysis section in methods |
| Other | 12% polyacrylamide gel | BioRad | BioRad:4568046 | See SDS-PAGE and western blot anlaysis section in methods |
| Other | PVDF membrane | BioRad | Biorad:1704157 | See SDS-PAGE and western blot anlaysis section in methods |
Additional files
-
Supplementary file 1
An excel file containing the comparison, sample size, statistical test and number of litters used (when applicable) for each data plot.
- https://cdn.elifesciences.org/articles/78203/elife-78203-supp1-v1.xlsx
-
Supplementary file 2
An excel file containing the primer and sgRNA sequences used in this paper.
- https://cdn.elifesciences.org/articles/78203/elife-78203-supp2-v1.xlsx
-
Supplementary file 3
An excel file containing three tabs (1) the differential expression analysis of controls versus Ddx3x cKO for RNAseq and Riboseq data (using only unique reads); (2) the analysis of translational efficiency from wildtype (ie: control) data (using all reads); (3) the cell type-enriched transcripts used in Figure 6B.
- https://cdn.elifesciences.org/articles/78203/elife-78203-supp3-v1.xlsx
-
Transparent reporting form
- https://cdn.elifesciences.org/articles/78203/elife-78203-transrepform1-v1.docx
Download links
A two-part list of links to download the article, or parts of the article, in various formats.
Downloads (link to download the article as PDF)
Open citations (links to open the citations from this article in various online reference manager services)
Cite this article (links to download the citations from this article in formats compatible with various reference manager tools)
Aberrant cortical development is driven by impaired cell cycle and translational control in a DDX3X syndrome model
eLife 11:e78203.
https://doi.org/10.7554/eLife.78203


