SRSF10 is essential for progenitor spermatogonia expansion by regulating alternative splicing
- Department of Obstetrics and Gynecology, Center for Reproductive Medicine, Guangdong Provincial Key Laboratory of Major Obstetric Diseases, The Third Affiliated Hospital of Guangzhou Medical University, China
- Key Laboratory for Reproductive Medicine of Guangdong Province, The Third Affiliated Hospital of Guangzhou Medical University, China
- Center for Stem Cell Biology and Regenerative Medicine, MOE Key Laboratory of Bioinformatics, School of Life Sciences, Tsinghua University, China
- State Key Laboratory of Stem Cell and Reproductive Biology, Institute of Zoology, Chinese Academy of Sciences, China
- Fertility Preservation Lab, Guangdong-Hong Kong Metabolism & Reproduction Joint Laboratory, Reproductive Medicine Center, Guangdong Second Provincial General Hospital, China
Figures
Figure 1 with 2 supplements
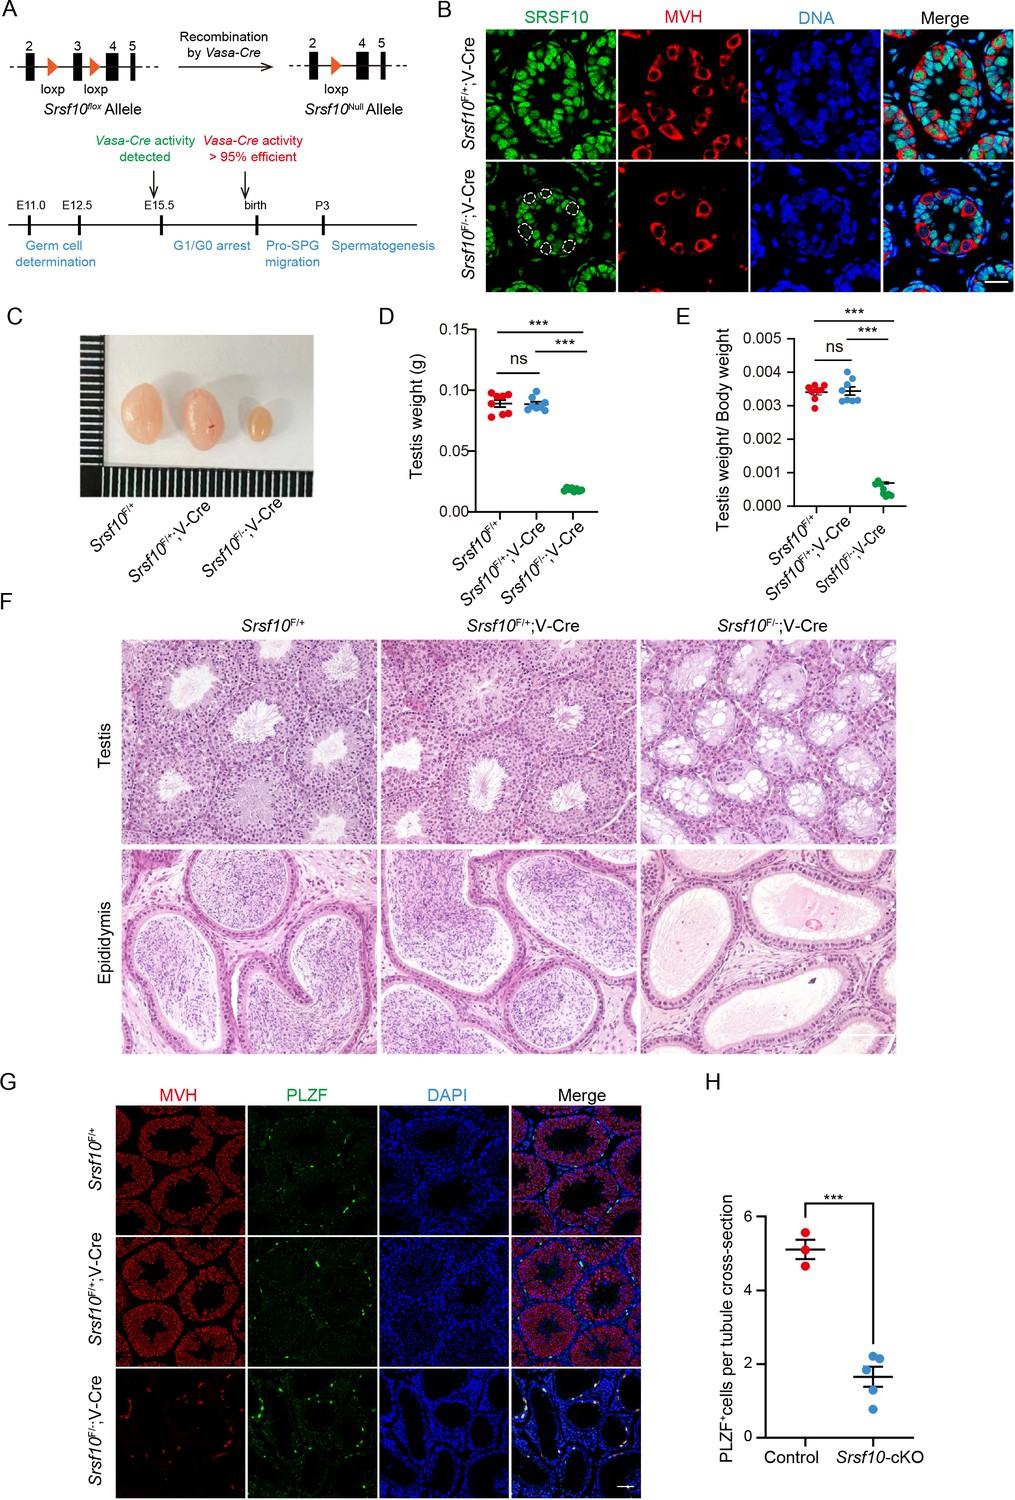
Srsf10 is required for spermatogenesis and male fertility.
(A) Schematic showing the deletion of Srsf10 exon 3 and generation of Srsf10F/−;Vasa-Cre by Vasa-Cre-mediated recombination in male germ cells as early as embryonic day 15 (E15). (B) Immunofluorescence (IF) staining for SRSF10 in the Srsf10F/+;Vasa-Cre and Srsf10F/−;Vasa-Cre testes of postnatal day 8 (P8) mice. White circles denote the SRSF10 null germ cells. MVH (a germ cell marker) was co-stained to indicate the location of germ cells. The DNA was stained with Hoechst 33342. Scale bar, 20 μm. (C) Morphological analysis of the testes of 2-month-old Srsf10F/+, Srsf10F/+;Vasa-Cre, and Srsf10F/−;Vasa-Cre mice. (D) Testis weight of 2-month-old Srsf10F/+, Srsf10F/+;Vasa-Cre, and Srsf10F/−;Vasa-Cre mice. Two-tailed Student’s t-test was used for statistics. n=4, ***p<0.001, ns, no significance. Error bars represent s.e.m. (E) The ratio of testes to body weight in 2-month-old Srsf10F/+, Srsf10F/+;Vasa-Cre, and Srsf10F/−;Vasa-Cre mice. Two-tailed Student’s t-test was used for statistics. n=4, ***p<0.001, ns, no significance. Error bars represent s.e.m. (F) Hematoxylin and eosin (H&E) staining of testes and cauda epididymis in 2-month-old Srsf10F/+, Srsf10F/+;Vasa-Cre, and Srsf10F/−;Vasa-Cre mice. Scale bar, 50 μm. (G) Co-staining for MVH (all germ cell marker) and PLZF (all undifferentiated spermatogonia marker) in adult testes in 2-month-old Srsf10F/+, Srsf10F/+;Vasa-Cre, and Srsf10F/−;Vasa-Cre mice. DNA was stained with Hoechst 33342. Scale bar, 50 μm. (H) Statistics of PLZF-positive cells per tubule cross-section of testes in 2-month-old Srsf10F/+;Vasa-Cre (hereafter, ‘control’) and Srsf10F/−;Vasa-Cre (hereafter, ‘Srsf10-cKO’) mice. 174 tubule cross-sections were counted in control from 3 different mice. 407 tubule cross-sections were counted in Srsf10-cKO from 5 different mice. Two-tailed Student’s t-test was used for statistics. ***p<0.001. Error bars represent s.e.m.
-
Figure 1—source data 1
The testis weight and the number of PLZF+ cells of adult male mice.
- https://cdn.elifesciences.org/articles/78211/elife-78211-fig1-data1-v1.zip
Figure 1—figure supplement 1
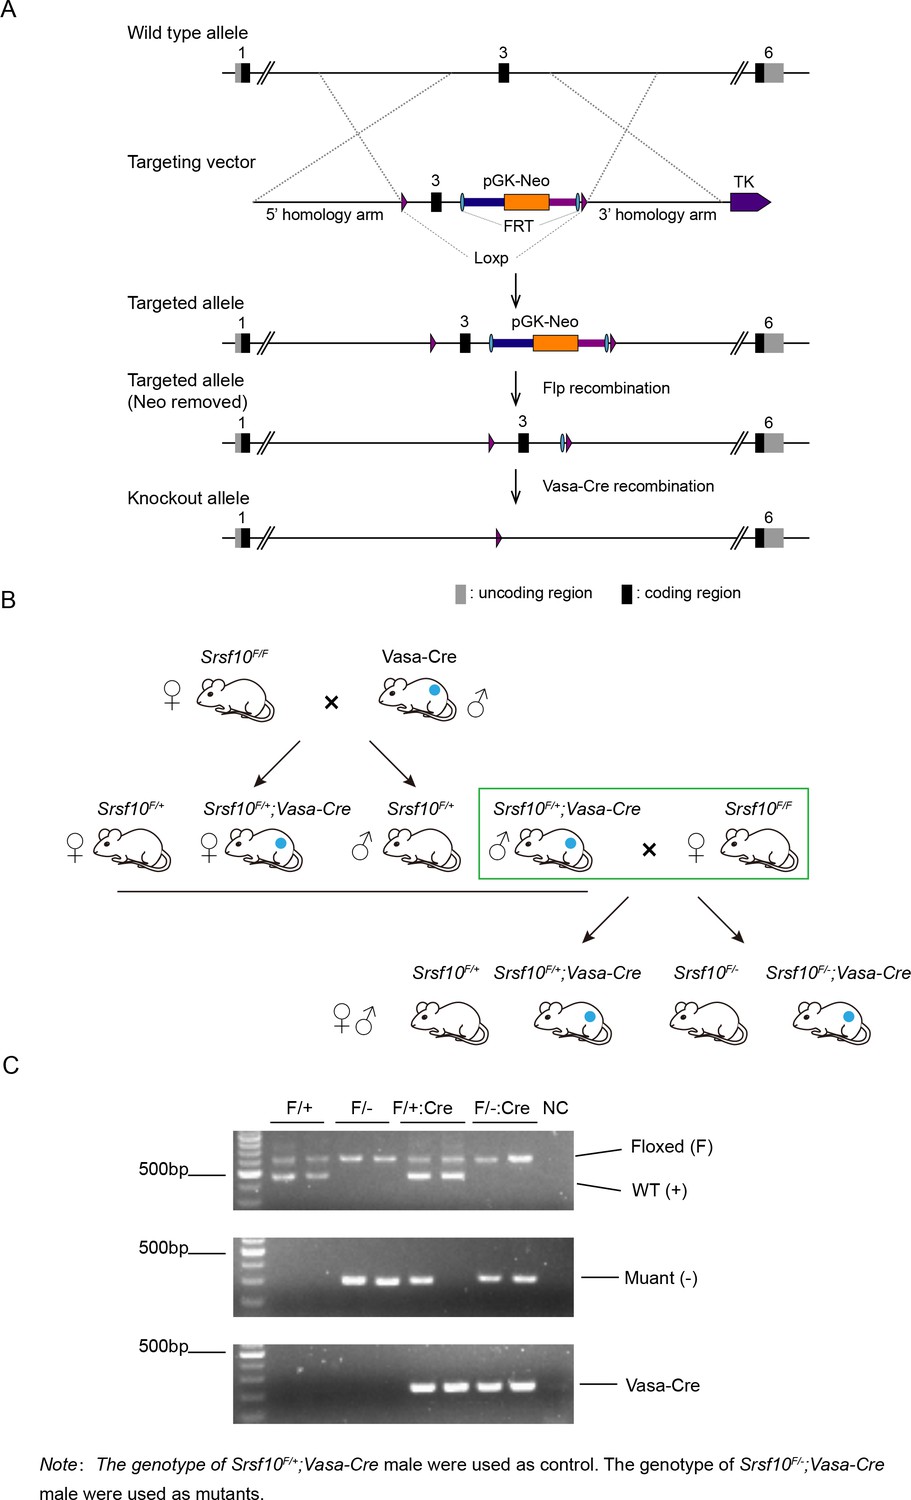
Generation, breeding, and genotyping of control and Srsf10-cKO mice.
(A) Schematic showing the targeting strategy for generating a floxed Srsf10 allele through homologous recombination. Exon 3 will be deleted after Vasa-Cre-mediated recombination. (B) Breeding strategy for generating control (Srsf10F/+;Vasa-Cre) and Srsf10-cKO (Srsf10F/−;Vasa-Cre) mice. The genotypes and gender of mice used for breeding to generate the control and Srsf10-cKO mice are boxed in green. The blue dots denote the mice carry the Vasa-Cre gene. (C) Genotyping of Srsf10F/+ (F/+), Srsf10F/− (F/−), Srsf10F/+;Vasa-Cre (F/+;Cre), and Srsf10F/−;Vasa-Cre (F/−;Cre) mice using genomic PCRs. Water is used as the template for negative control (NC). Srsf10F/+;Vasa-Cre males were used as control, and Srsf10F/−;Vasa-Cre males were used as mutants (Srsf10-cKO).
-
Figure 1—figure supplement 1—source data 1
Raw genotyping gel of control and Srsf10-cKO mice using genomic PCRs.
- https://cdn.elifesciences.org/articles/78211/elife-78211-fig1-figsupp1-data1-v1.zip
Figure 1—figure supplement 2
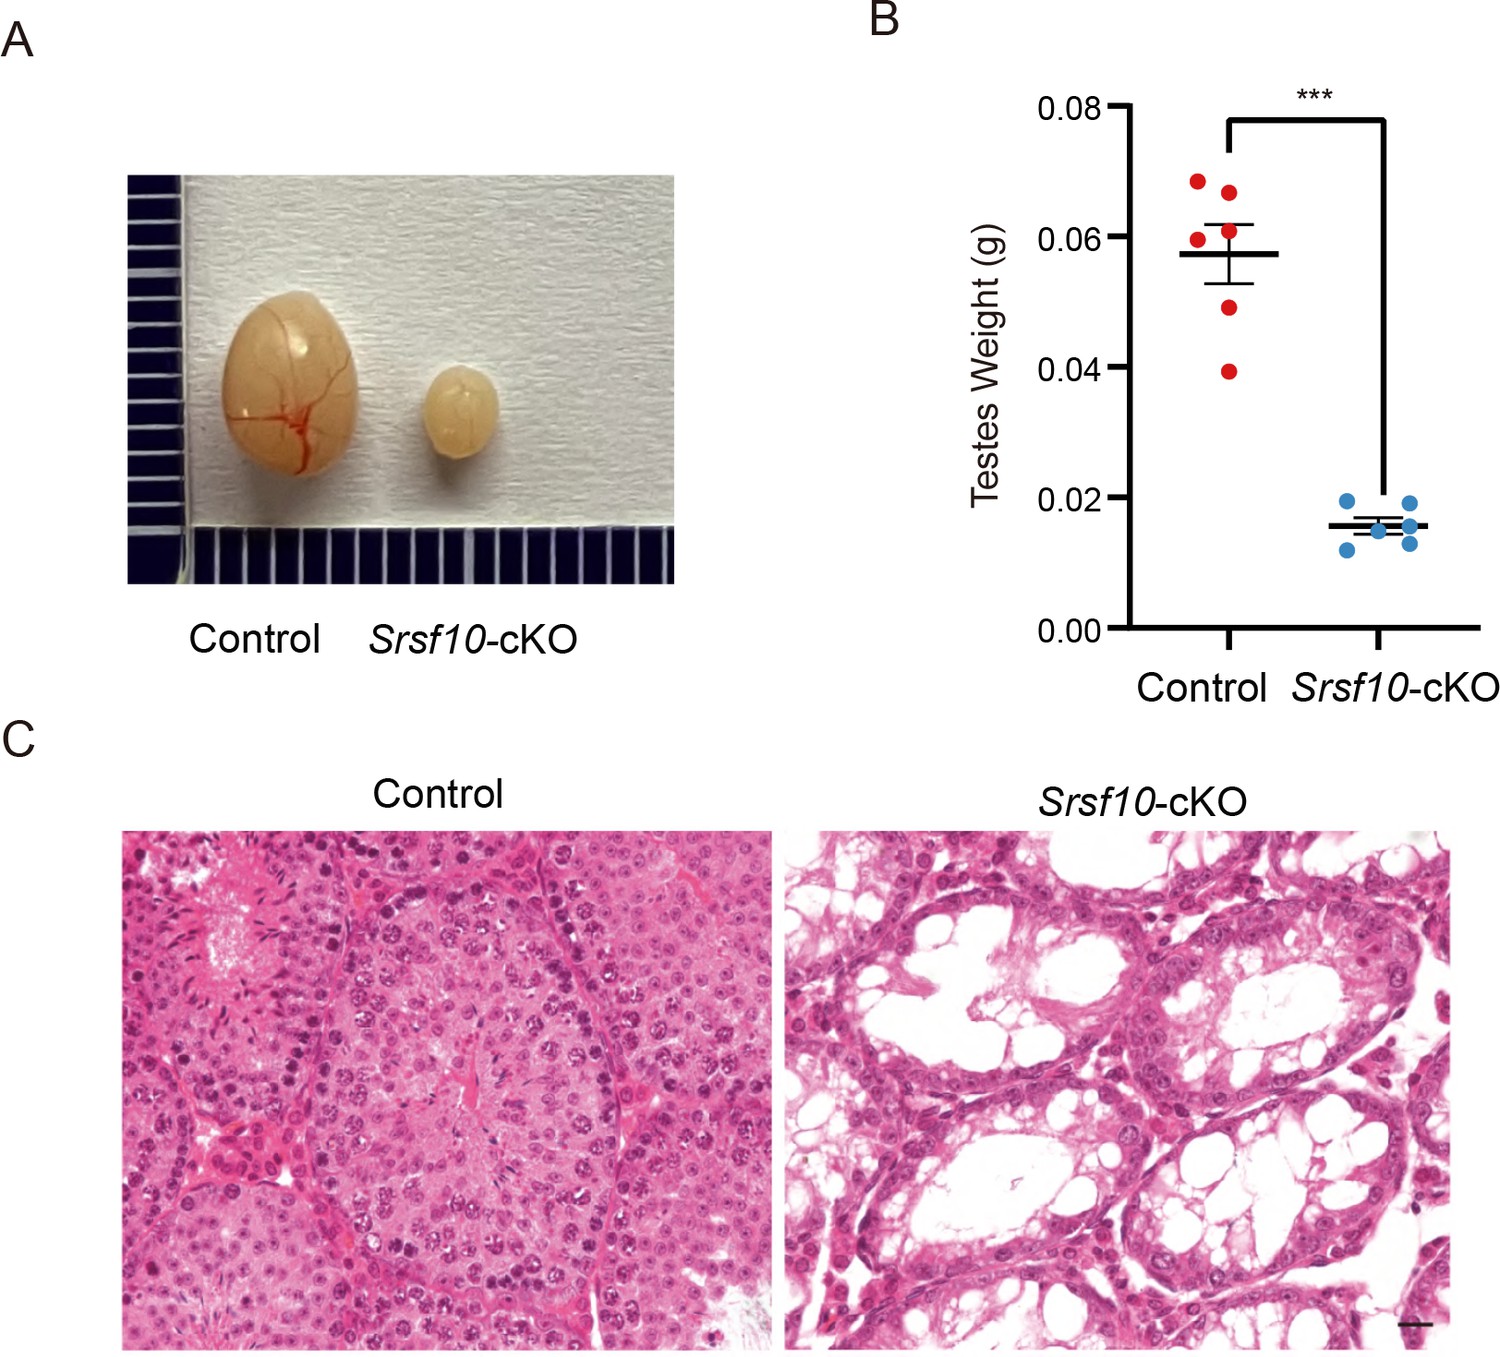
Srsf10 is required for the first wave of spermatogenesis.
(A) Morphological analysis of the control and Srsf10-cKO testes at postnatal day 35 (P35). (B) Testes weight of P35 control and Srsf10-cKO mice (***p<0.001, n=3). Two-tailed Student’s t-test was used for statistics. Error bars represent s.e.m. (C) Hematoxylin and eosin staining of P35 testes in control and Srsf10-cKO mice. Scale bar, 10 μm.
-
Figure 1—figure supplement 2—source data 1
The testis weight of 1-month-old male mice.
- https://cdn.elifesciences.org/articles/78211/elife-78211-fig1-figsupp2-data1-v1.zip
Figure 2
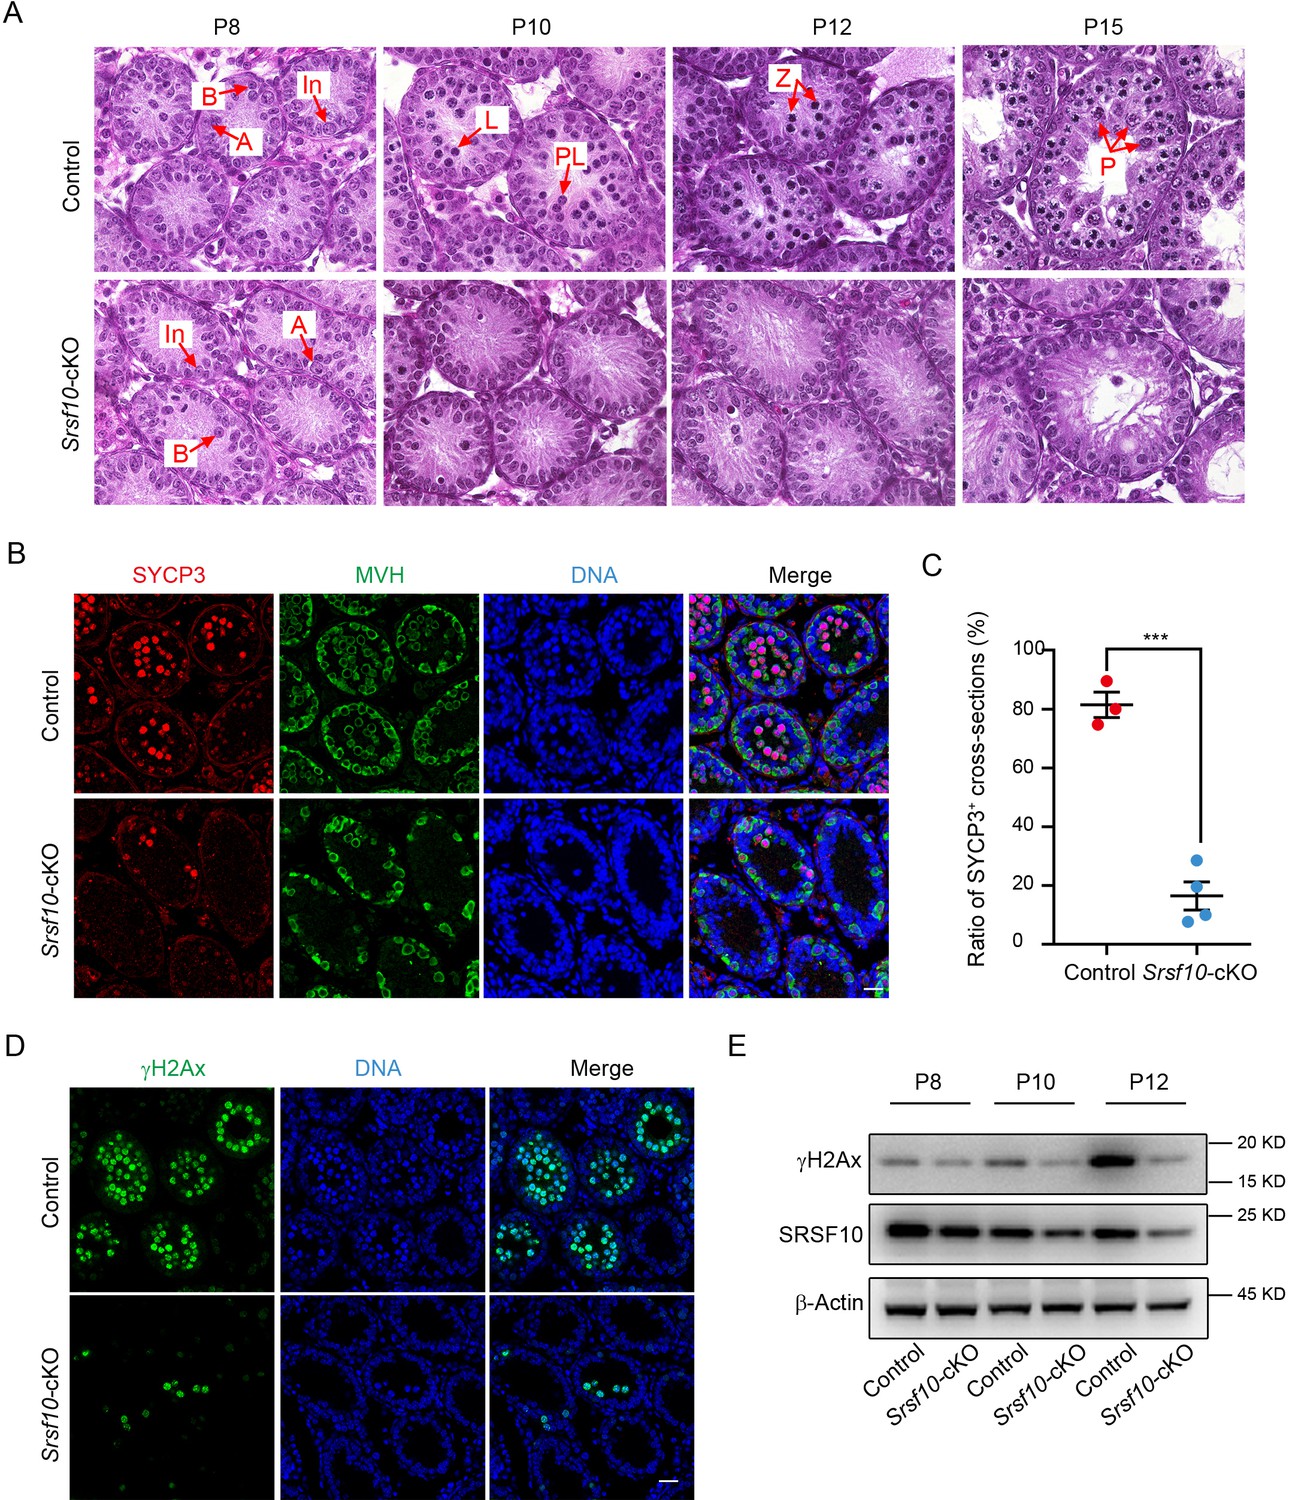
The meiosis initiation is impaired in Srsf10-deficient germ cells.
(A) Hematoxylin and eosin staining of control and Srsf10-cKO testes at postnatal day 8 (P8), P10, P12, and P15. Spermatogenic cells were shown in cross-sections of seminiferous tubules from control and Srsf10-cKO testes. Spermatogenic cell types were distinguished by H&E staining according to theirchromatin morphologies (Ahmed and de Rooij, 2009). Red arrows indicate the representative stages of the spermatocytes. A, type A spermatogonia; In, intermediate spermatogonia; B, type B spermatogonia; L, leptotene spermatocytes; Z, zygotene spermatocytes; P, pachytene spermatocytes. Scale bar, 10 μm. (B) Immunofluorescence co-staining for SYCP3 and MVH in control and Srsf10-cKO testes at P12. Scale bar, 20 µm. (C) Statistics of the ratio of SYCP3-positive tubule cross-sections in control and Srsf10-cKO testes at P12. 845 tubule cross-sections were counted in control from 3 different mice. 1507 tubule cross-sections were counted in Srsf10-cKO from 4 different mice. Two-tailed Student’s t-test was used for statistics. ***p<0.001. Error bars represent s.e.m. (D) Immunofluorescence staining for γH2AX in control and Srsf10-cKO testes at P12. Scale bar, 20 µm. (E) Western blot analyses of γH2AX in control and Srsf10-cKO testes at P8, P10, and P12. β-actin was used as the loading control. Because SRSF10 was only specifically depleted in the germ cells, the detected residual SRSF10 protein was likely from the somatic cells in the Srsf10-cKO testes.
-
Figure 2—source data 1
The ratio of SYCP3+ tubule cross-sections in P12 testes.
- https://cdn.elifesciences.org/articles/78211/elife-78211-fig2-data1-v1.zip
-
Figure 2—source data 2
RAW western blot for γH2AX, SRSF10, and β-actin.
- https://cdn.elifesciences.org/articles/78211/elife-78211-fig2-data2-v1.zip
Figure 3 with 1 supplement
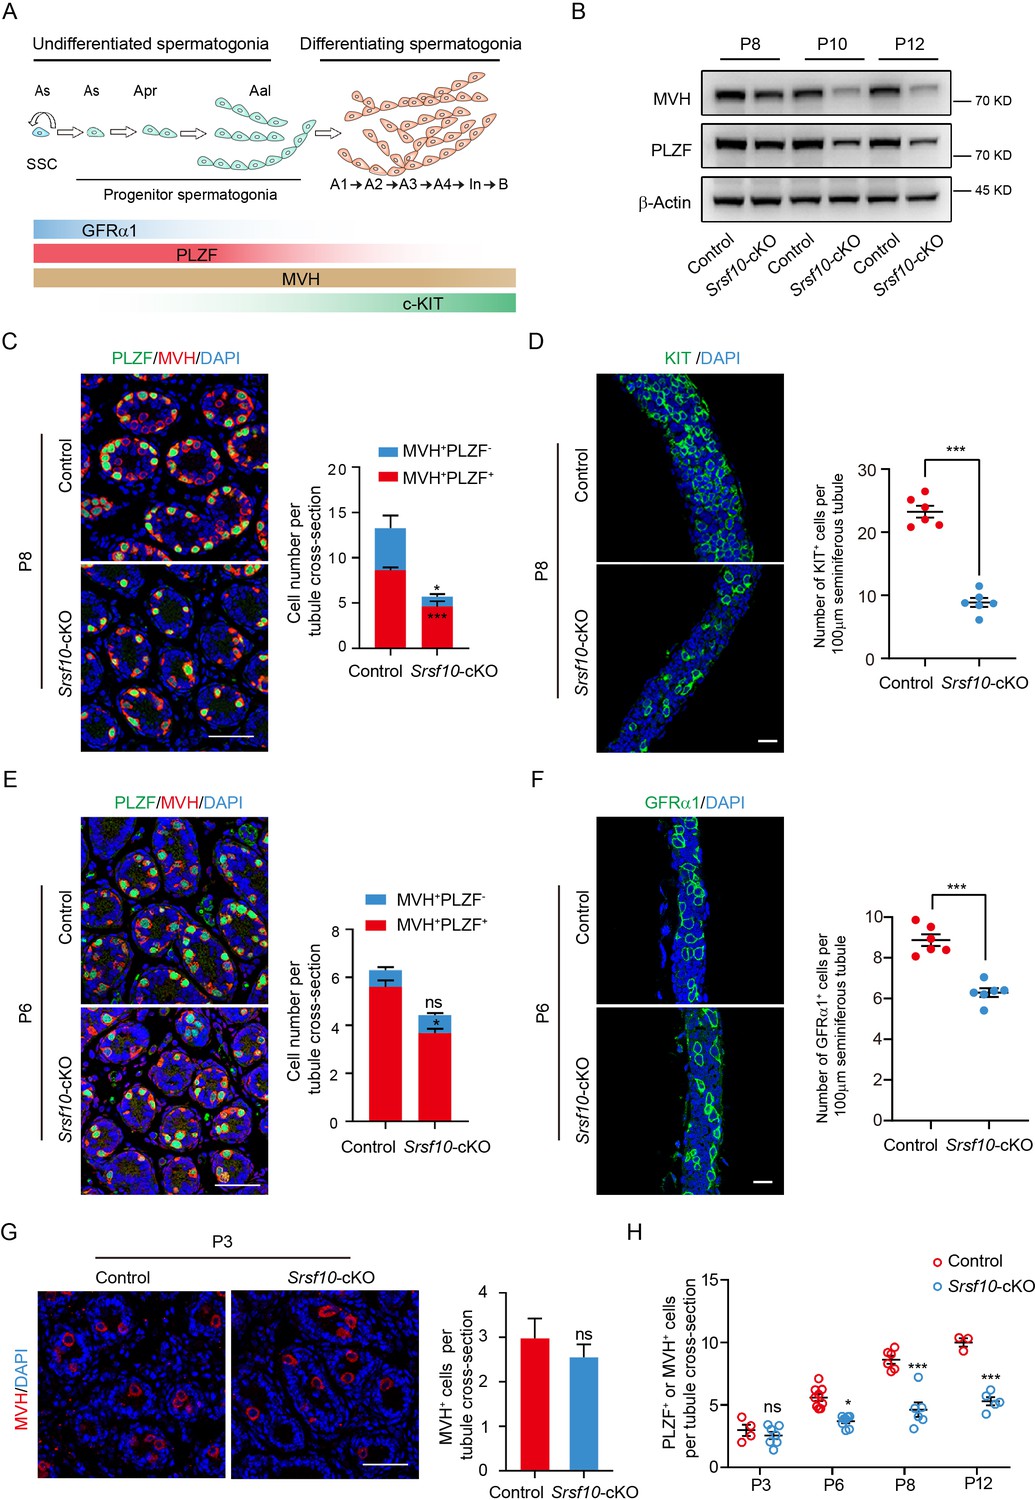
Srsf10 depletion impairs the expansion and differentiation of progenitor spermatogonia.
(A) Schematic showing the progression of mitosis phase of spermatogonia from spermatogonial stem cells (SSCs) to differentiating spermatogonia. The expression of representative markers at each stage is also shown. (B) Western blot analyses of PLZF and MVH in control and Srsf10-cKO testes at postnatal day 8 (P8), P10, and P12. β-actin was used as the loading control. (C) Left, immunofluorescence co-staining for PLZF and MVH in control and Srsf10-cKO testes at P8. Scale bar, 50 µm. Right, quantification of MVH-positive and PLZF-positive cells (MVH+PLZF+) per tubule cross-section or MVH-positive but PLZF-negative (MVH+PLZF-) cells per tubule cross-section in control and Srsf10-cKO testes at P8. 1286 tubule cross-sections were counted in control from 6 different mice. 1354 tubule cross-sections were counted in Srsf10-cKO from 6 different mice. Two-tailed Student’s t-test was used for statistics. ***p<0.001. *p<0.05. Error bars represent s.e.m. (D) Left, whole-mount staining for KIT in control and Srsf10-cKO testes at P8. Scale bar, 20 µm. Right, quantification of KIT+ cells per 100 μm seminiferous tubule. 51 tubules were counted in control from 6 different mice. 48 tubules were counted in Srsf10-cKO from 6 different mice. Two-tailed Student’s t-test was used for statistics. ***p<0.001. Error bars represent s.e.m. (E) Left, immunofluorescence co-staining for PLZF and MVH in control and Srsf10-cKO testes at P6. Scale bar, 50 µm. Right, quantification of MVH+PLZF− cells or MVH+PLZF+ cells per tubule cross-section in control and Srsf10-cKO testes at P6. 1262 tubule cross-sections were counted in control from 3 different mice. 1069 tubule cross-sections were counted in Srsf10-cKO from 3 different mice. Two-tailed Student’s t-test was used for statistics. *p<0.05. ns represents no significance. Error bars represent s.e.m. (F) Left, whole-mount staining for GFRα1 in control and Srsf10-cKO testes at P6. Scale bar, 20 µm. Right, quantification of GFRα1+ cells per 100 μm seminiferous tubule. 55 tubules were counted in control from 6 different mice. 76 tubules were counted in Srsf10-cKO from 6 different mice. Two-tailed Student’s t-test was used for statistics. ***p<0.001. Error bars represent s.e.m. (G) Left, immunofluorescence staining for MVH in control and Srsf10-cKO testes at P3. Scale bar, 50 µm. Right, quantification of MVH-positive cells per tubule cross-section in control and Srsf10-cKO testes at P3. 711 tubule cross-sections were counted in control from 4 different mice. 1398 tubule cross-sections were counted in Srsf10-cKO from 7 different mice. Two-tailed Student’s t-test was used for statistics. ns represents no significance. Error bars represent s.e.m. (H) Quantification of PLZF+ or MVH+ cells per tubule cross-section in control and Srsf10-cKO testes at P3, P6, P8, and P12. The PLZF+MVH+ cells were counted as PLZF+ cells at P6、P8 and P12, but only MVH+ cells were counted at P3. Two-tailed Student’s t-test was used for statistics. *p<0.05. ***p<0.001. ns represents no significance. Error bars represent s.e.m.
-
Figure 3—source data 1
RAW western blot for MVH, PLZF, and β-actin.
- https://cdn.elifesciences.org/articles/78211/elife-78211-fig3-data1-v1.zip
-
Figure 3—source data 2
Quantification of MVH+, MVH+PLZF+, or MVH+PZF− cells per tubule cross-section and KIT+ or GFRα1+ cells per 100 μm seminiferous tubule.
- https://cdn.elifesciences.org/articles/78211/elife-78211-fig3-data2-v1.zip
Figure 3—figure supplement 1
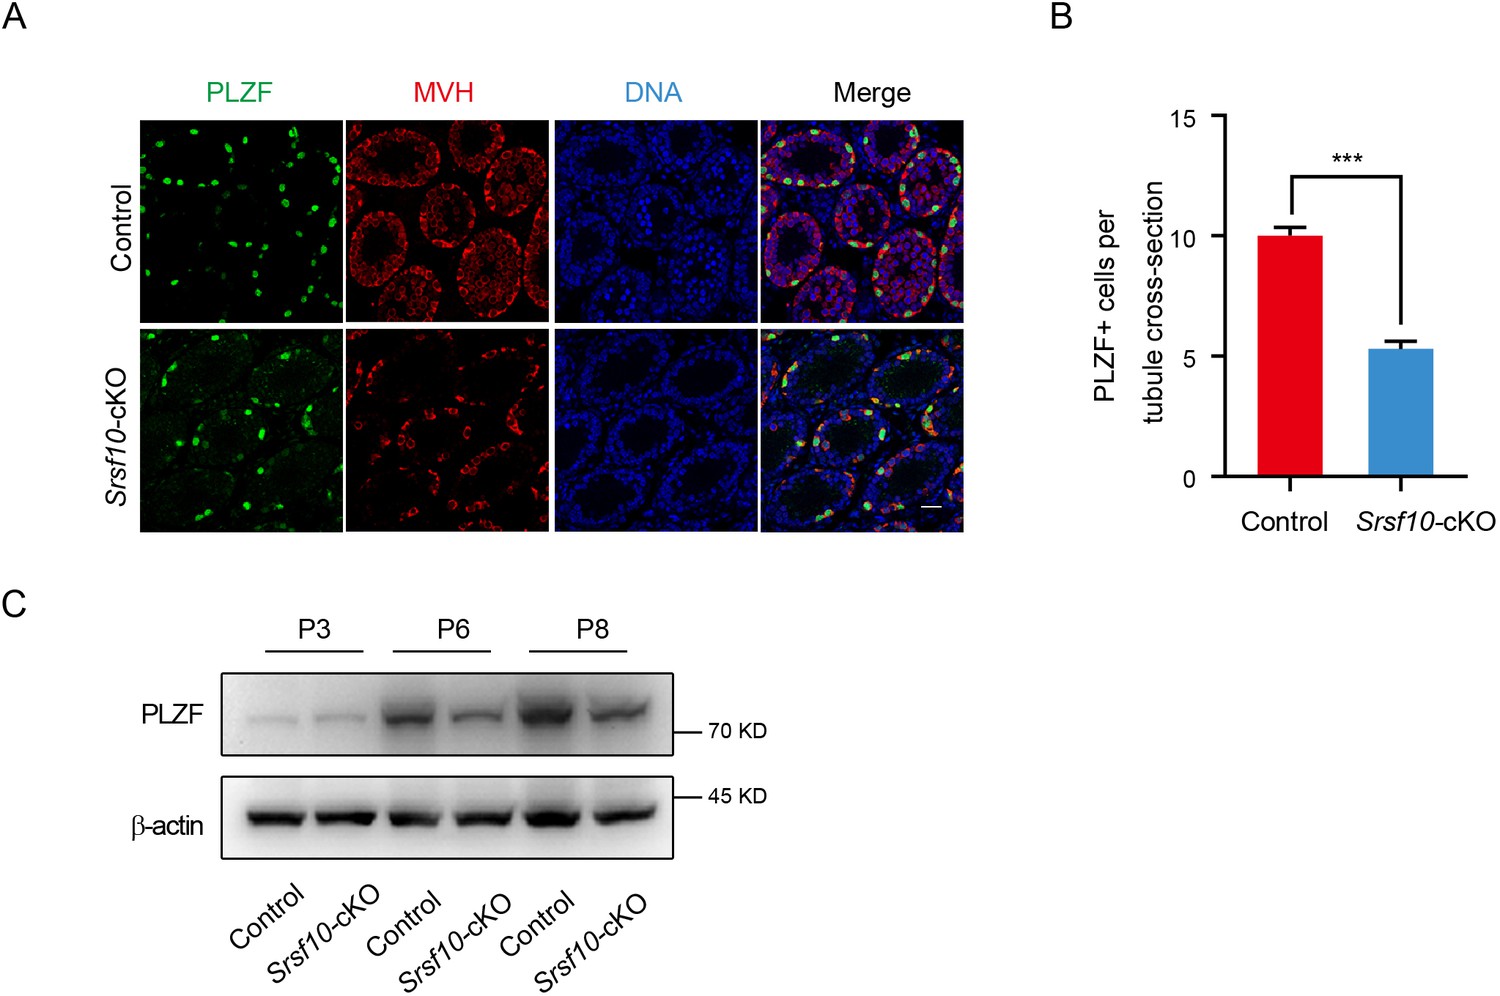
Spermatogonia development is impaired in Srsf10-cKO testes.
(A) Immunofluorescence co-staining for PLZF and MVH in control and Srsf10-cKO testes at postnatal day 12 (P12). Scale bar, 20 µm. (B) Quantification of PLZF-positive cells per tubule cross-section in control and Srsf10-cKO testes at P12. 297 tubule cross-sections were counted in control from 3 different mice. 608 tubule cross-sections were counted in Srsf10-cKO from 5 different mice. Two-tailed Student’s t-test was used for statistics. ***p<0.001, Error bars represent s.e.m. (C) Western blot analyses of MVH and PLZF in control and Srsf10-cKO testes at P3, P6, and P8. β-actin was used as the loading control.
-
Figure 3—figure supplement 1—source data 1
Quantification of PLZF+ cells per tubule cross-section in P12 control and Srsf10-cKO testes.
- https://cdn.elifesciences.org/articles/78211/elife-78211-fig3-figsupp1-data1-v1.zip
-
Figure 3—figure supplement 1—source data 2
RAW western blot for PLZF and β-actin.
- https://cdn.elifesciences.org/articles/78211/elife-78211-fig3-figsupp1-data2-v1.zip
Figure 4 with 1 supplement

Srsf10 deficiency alters expression patterns of genes involved in progenitor spermatogonia.
(A) Scatter plots showing the expression of genes in control and Srsf10-cKO testes at postnatal day 3 (P3), P6, and P8. Blue dots represent significantly downregulated genes, while red dots show significantly upregulated genes ( fragments per kilobase of exon per million reads mapped [FPKM] ≥5, fold change ≥2, and p<0.01). Gray dots represent unchanged genes. (B) Venn diagram depicting the overlap of downregulated genes between P6 and P8. Gene ontology (GO) terms of the 57 shared downregulated genes in P6 and P8 Srsf10-cKO testes, and genes involved in specific GO terms were shown on the right. (C) Hierarchical clustering of two replicates of control and Srsf10-cKO testes at P3, P6, and P8 based on the expression of spermatogonia-specific genes (Green et al., 2018). Note the closer relationship between P8 Srsf10-cKO and P6 control testes. (D) Heatmap showing the mRNA abundance of genes functioning in spermatogonial stem cells (SSCs; Bcl6b, Etv5, Lhx1, Cd82, Bmi1, T, Id4, and Gfra1), progenitors (Lin28a, Nanos3, Neurog3, Pou5f1, Sohlh1, and Sox3), undifferentiated spermatogonia (Sall4 and Zbtb16), and differentiating spermatogonia (Dmrtb1, Dnmt3b, Kit, Stra8, and Prdm9). (E) Quantitative RT-PCR validation of the expression of genes involved in SSC, progenitors, undifferentiated spermatogonia, and differentiating spermatogonia in control and Srsf10-cKO testes at P6. β-actin was used as the internal control. Two-tailed Student’s t-test was used for statistics. *p<0.05, **p<0.01, ***p<0.001; ns, no significance. Error bars represent s.e.m.
-
Figure 4—source data 1
List of the differential expression genes in control and Srsf10-cKO testes at P3, P6, and P8, respectively.
- https://cdn.elifesciences.org/articles/78211/elife-78211-fig4-data1-v1.zip
-
Figure 4—source data 2
Validation of the expression of marker genes in control and Srsf10-cKO testes using qRT-PCR at P6.
- https://cdn.elifesciences.org/articles/78211/elife-78211-fig4-data2-v1.zip
Figure 4—figure supplement 1
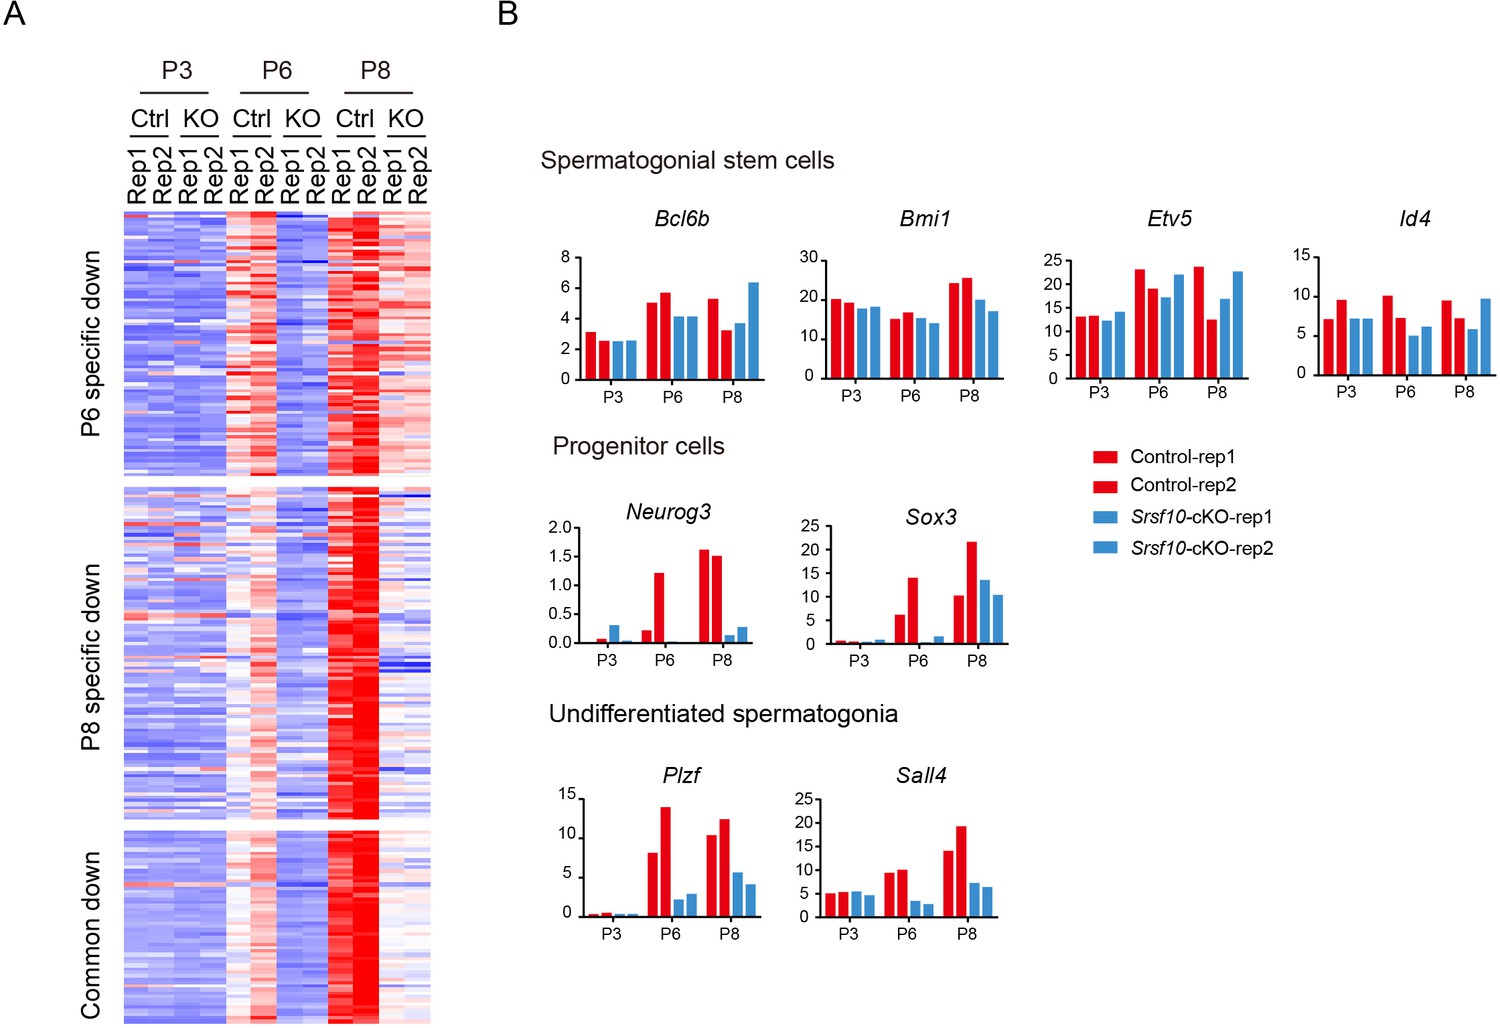
Systematical analysis of the downregulated genes from postnatal day 3 (P3) to P8.
(A) Heatmap shows the mRNA abundance of all the downregulated genes from P3 to P8. (B) RNA-seq results of the expression level of selected marker genes related to spermatogonial stem cells, progenitor cells, and undifferentiated spermatogonia from P3 to P8.
Figure 5 with 1 supplement
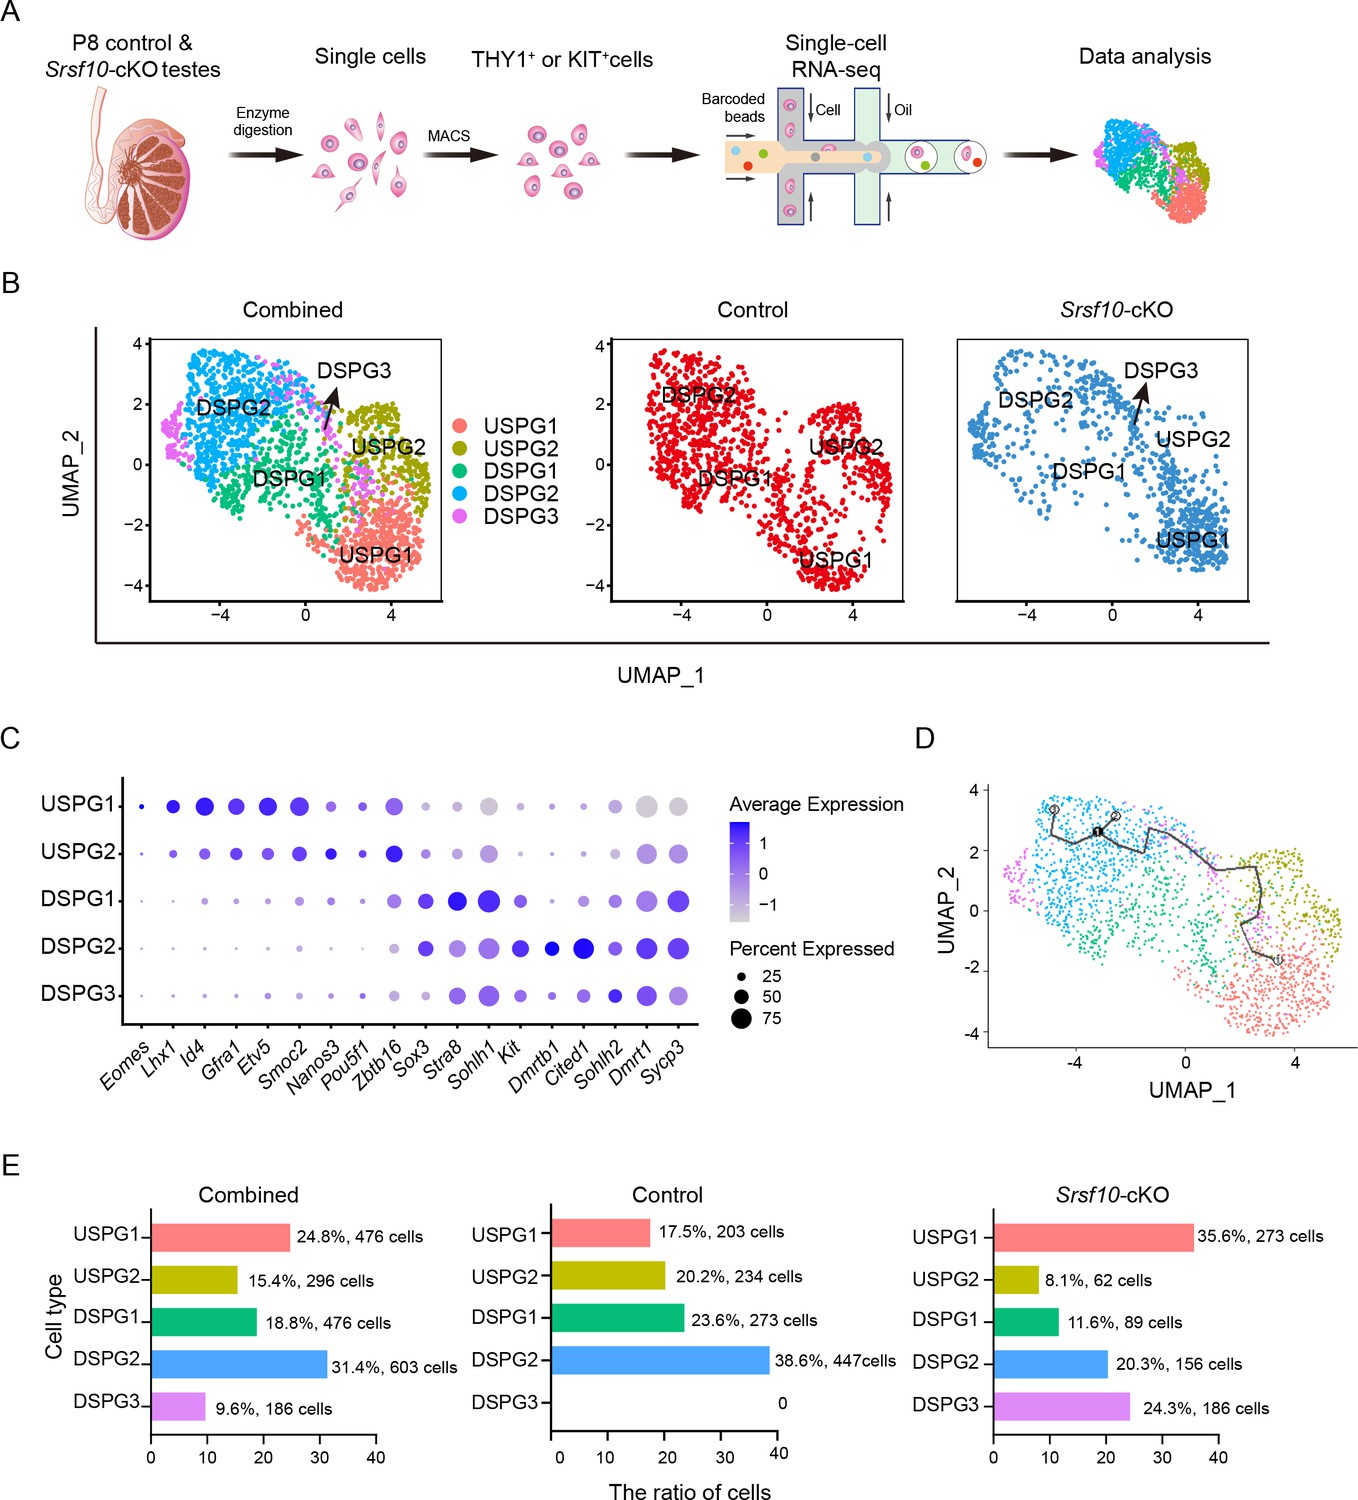
Single-cell RNA sequencing (scRNA-seq) defines the transcriptome-wide signatures of spermatogonia development in Srsf10-cKO testes at postnatal day 8 (P8).
(A) Schematic illustration of the workflow for scRNA-seq analysis. (B) Uniform manifold approximation and projection (UMAP) clustering analysis of combined (left), control (middle), and Srsf10-cKO (right) spermatogonia. Five subtypes, including USPG1 (undifferentiated spermatogonia 1), USPG2, DSPG1 (differentiating spermatogonia 1), DSPG2, and DSPG3 are identified and color-coded in the left panel. (C) Dot plot showing the expression of selected marker genes across the five spermatogonia subtypes. (D) Pseudotime trajectory analysis of the indicated cell clusters. (E) Quantification of the number and percentage of spermatogonia in each subtype in combined, control, and Srsf10-cKO groups.
Figure 5—figure supplement 1
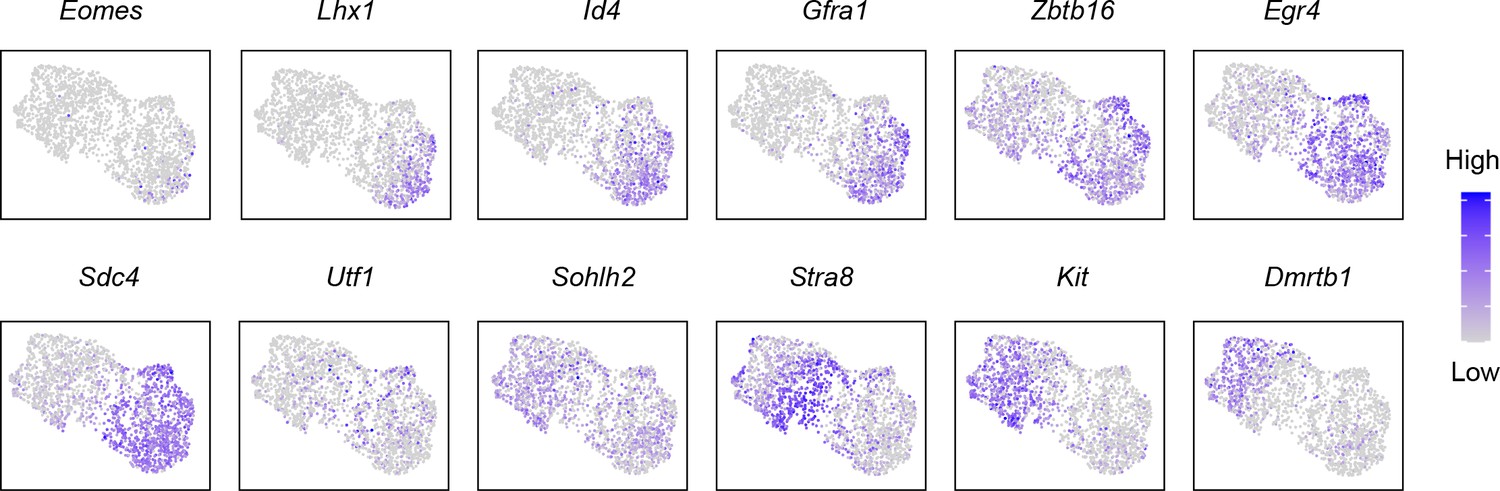
The expression pattern of spermatogonial marker genes in the subtypes of control and Srsf10-cKO samples.
Gene expression patterns of marker genes corresponding to each cellular state on the uniform manifold approximation and projection plots.
Figure 6 with 3 supplements

Srsf10 depletion impairs the cell cycle and proliferation of undifferentiated spermatogonia.
(A) Volcano plot showing the significantly differentially expressed transcripts in the USPG1 subtype in Srsf10-cKO compared with the control samples. Blue dots represent significantly downregulated transcripts, while red dots show significantly upregulated transcripts (|log2FC|>0.25 and p<0.01). Gray dots represent unchanged transcripts. (B) Gene ontology of upregulated and downregulated genes in Srsf10-cKO USPG1 subtype and representative genes in up- and downregulated groups are shown. (C) Violin plots showing the expression of functional genes involved in cell cycle and spermatogenesis in the USPG 1 subtype in control and Srsf10-cKO groups. (D) Immunofluorescence co-staining for the mitosis marker Ki-67 and PLZF in control and Srsf10-cKO testes at postnatal day 6 (P6). The DNA was stained with Hoechst 33342. Double-positive cells (Ki-67+PLZF+) are indicated by the white arrowhead. Scale bar, 50 μm. (E) Quantification of the ratio of Ki-67+PLZF+ cells in PLZF+ cells in control and Srsf10-cKO testes at P6. 841 PLZF+ cells were counted in control from 3 different mice. 624 PLZF+ cells were counted in Srsf10-cKO from 3 different mice. Two-tailed Student’s t-test was used for statistics. ns, no significance. Error bars represent s.e.m. (F) Immunofluorescence co-staining for the EdU and PLZF in control and Srsf10-cKO testes at P6. Control and Srsf10-cKO mice were treated with EdU for 4 hr. The DNA was stained with Hoechst 33342. White arrowheads indicate the representative EdU+PLZF+ cells. Scale bar, 20 μm. (G) Quantification of the ratio of EdU+PLZF+ cells in PLZF+ cells of control and Srsf10-cKO testes at P6. 4356 PLZF+ cells were counted in control from 7 different mice. 2739 PLZF+ cells were counted in Srsf10-cKO from 8 different mice. Two-tailed Student’s t-test was used for statistics. *p<0.05, Error bars represent s.e.m. (H) Immunofluorescence co-staining for the apoptosis marker cleaved caspase 3 (CAP3) and PLZF in control and Srsf10-cKO testes at P8. The DNA was stained with Hoechst 33342. Scale bar, 50 μm. (I) Quantification of the ratio of CAP3+PLZF+ cells in PLZF+ cells of control and Srsf10-cKO testes at P8. 8298 PLZF+ cells were counted in control from 6 different mice. 5031 PLZF+ cells were counted in Srsf10-cKO from 6 different mice. Two-tailed Student’s t-test was used for statistics. *p<0.05, Error bars represent s.e.m.
-
Figure 6—source data 1
List of the differential expression genes in USPG1 and GO analysis of these differential expression genes.
- https://cdn.elifesciences.org/articles/78211/elife-78211-fig6-data1-v1.zip
-
Figure 6—source data 2
Quantification of the ratio of KI67+PLZF+ cells, EdU+PLZF+ cells, and CAP3+PLZF+ cells in PLZF+ cells in control and Srsf10-cKO testes.
- https://cdn.elifesciences.org/articles/78211/elife-78211-fig6-data2-v1.zip
Figure 6—figure supplement 1
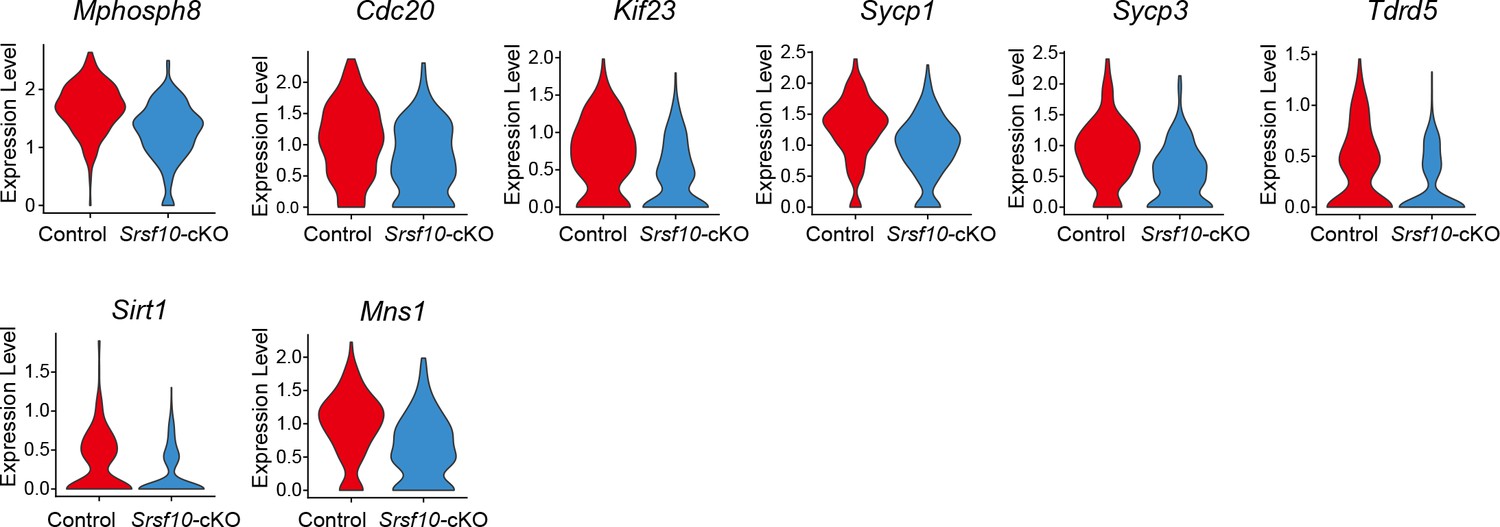
The expression pattern of key genes of the USPG1 subtype in control and Srsf10-cKO groups.
The violin plots show the expression level of cell cycle key genes and spermatogenesis-related genes of the USPG1 subtype in the control and Srsf10-cKO groups.
Figure 6—figure supplement 2
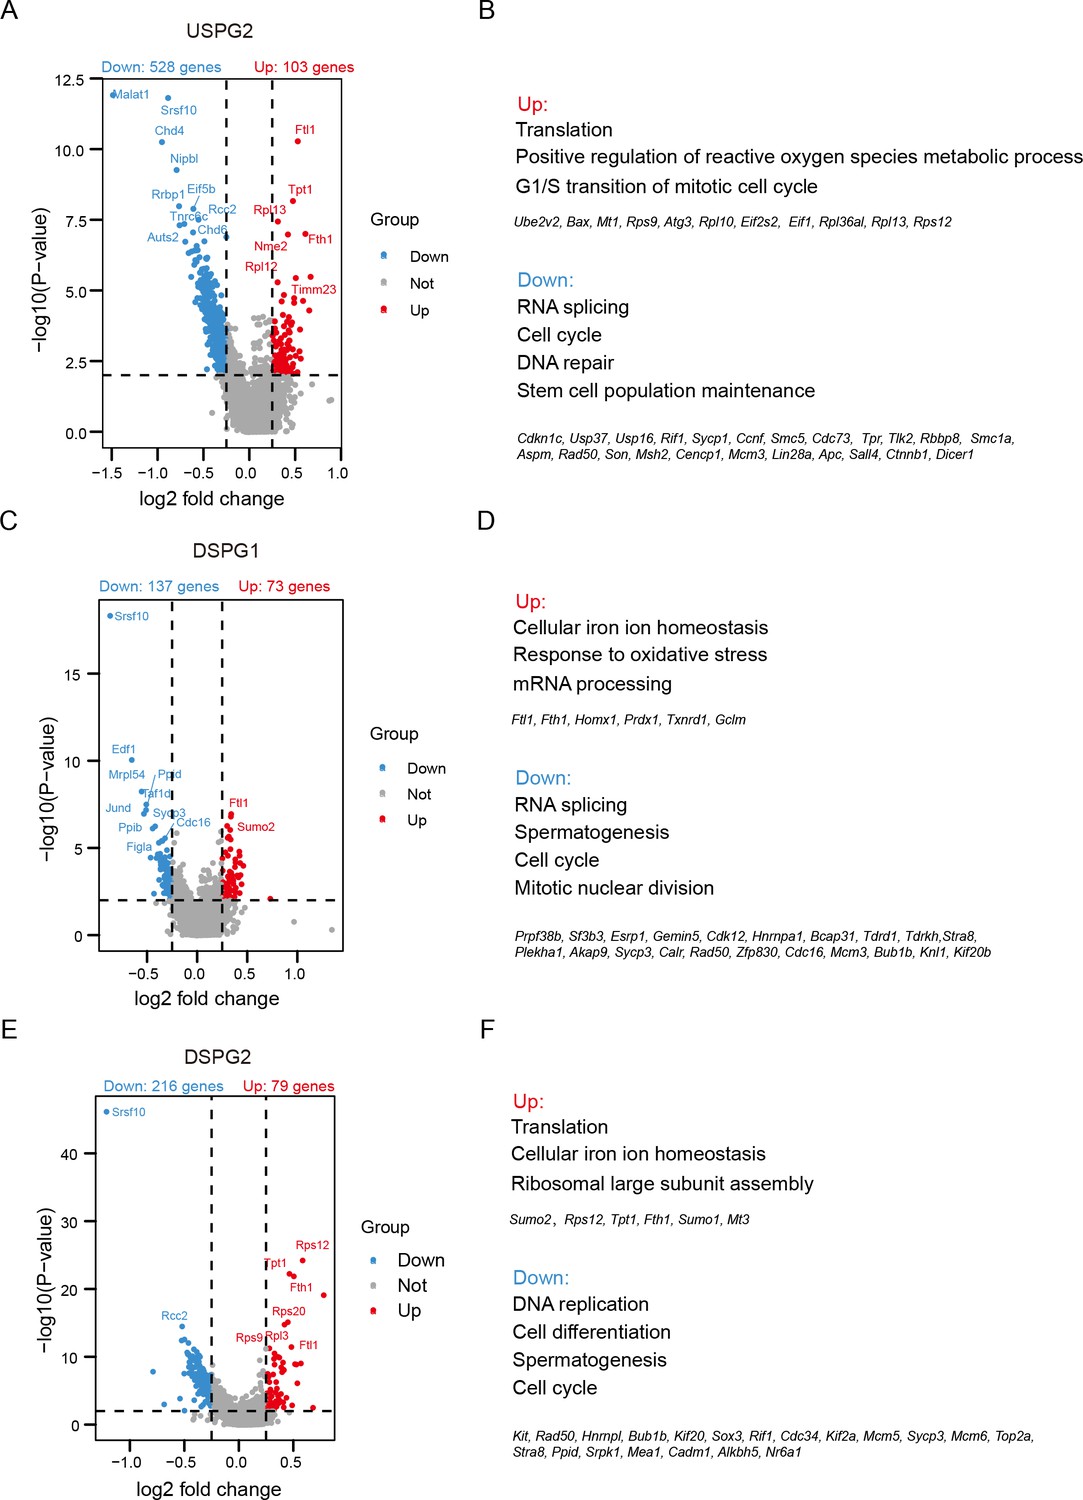
Identification of the differential expression genes (DEGs) and gene ontology (GO) analysis of DEGs in USPG2, DSPG1, and DSPG2 subtypes between control and Srsf10-cKO samples.
(A, C, and E) Volcano plot of significantly differentially expressed transcripts of the USPG2, DSPG1, and DSPG2 subtype, respectively, in Srsf10-cKO sample compared with the control. Blue dots represent significantly downregulated transcripts, while red dots show significantly upregulated transcripts (|log2FC|>0.25 and p<0.01). Gray dots illustrated unchanged transcripts. (B, D, and F) GO of upregulated and downregulated genes in Srsf10-cKO USPG2, DSPG1, and DSPG2 subtype, respectively.
-
Figure 6—figure supplement 2—source data 1
Lists of the differential expression genes in USPG2, DSPG1, and DSPG2 and GO analysis of these differential expression genes.
- https://cdn.elifesciences.org/articles/78211/elife-78211-fig6-figsupp2-data1-v1.zip
Figure 6—figure supplement 3
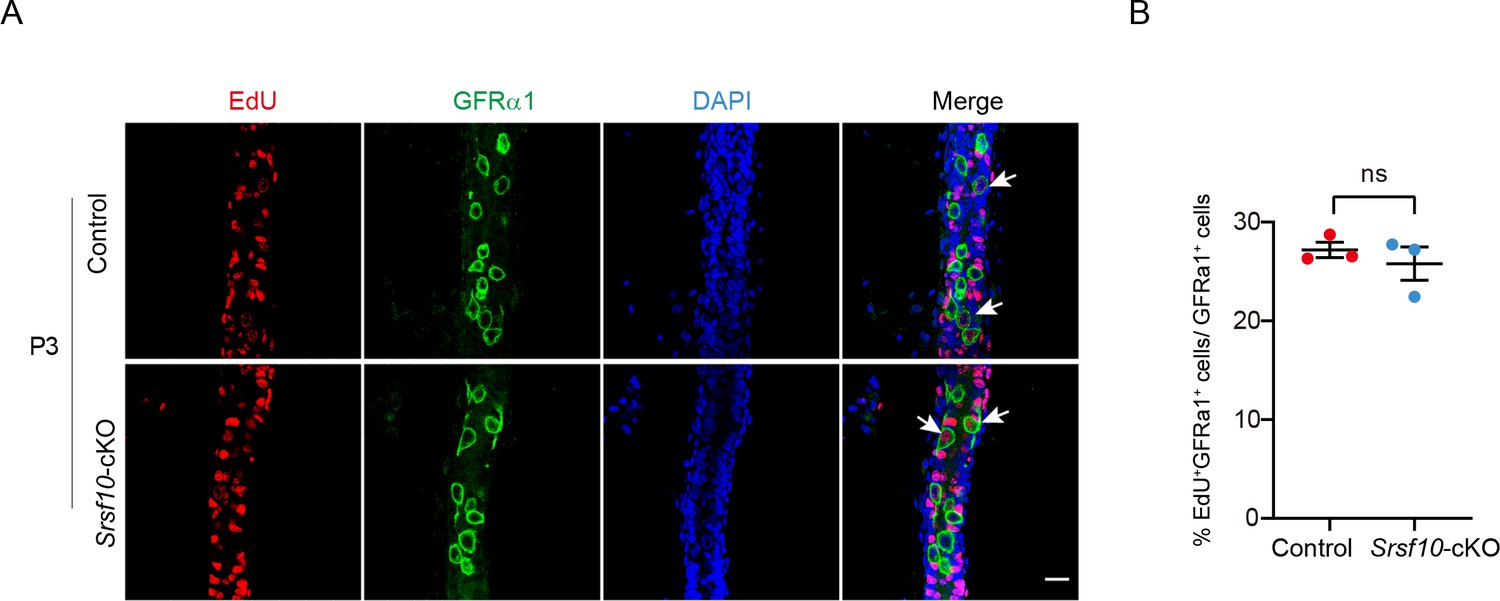
The proliferation of GFRα1-positive spermatogonial stem cells in control and Srsf10-cKO testes at P3.
(A) Whole-mount staining for EdU and GFRα1 in control and Srsf10-cKO testes at postnatal day 3 (P3). Control and Srsf10-cKO mice were treated with EdU (5 mg/kg) for 4 hr. The DNA was stained with Hoechst 33342. White arrowheads indicate the representative EdU+GFRα1+ cells. Scale bar, 20 μm. (B) Quantification of the ratio of EdU+GFRα1+ cells in GFRα1+ cells of control and Srsf10-cKO testes at P3. 1492 GFRα1+ cells were counted in control from 3 different mice. 1406 GFRα1+ cells were counted in Srsf10-cKO from 8 different mice. Two-tailed Student’s t-test was used for statistics. *p<0.05, Error bars represent s.e.m.
-
Figure 6—figure supplement 3—source data 1
Quantification of the ratio of EdU+GFRα1+ cells and in GFRα1+ cells in control and Srsf10-cKO testes at P3.
- https://cdn.elifesciences.org/articles/78211/elife-78211-fig6-figsupp3-data1-v1.zip
Figure 7 with 2 supplements

Genome-wide binding of SRSF10 in mouse spermatogonia.
(A) Schematic showing the workflow for the enrichment of THY1+ spermatogonia from wide-type postnatal day 6 (P6) testes for linear amplification of complementary DNA ends and sequencing (LACE-seq). (B) The UCSC genome browser showing the reproducibility of SRSF10 LACE-seq data. IgG was used as a negative control. Note the binding of SRSF10 to Bclaf1 but not the adjacent Mtfr2. (C) Pie chart showing the distribution of SRSF10 peaks in the genome. UTR, untranslated region; ncRNA, non-coding RNA; TTS, transcriptional termination site. (D) Enriched hexamer motifs bound by SRSF10. The top eight enriched motifs are shown. (E) Line chart showing the distribution of SRSF10 binding sites in the vicinity of the 5’ exon-intron and the 3’ intron-exon boundaries (300 nt upstream of 5’SS and 300 nt downstream of 3’SS). The black boxes denote exons, and the dotted line denotes intron. SS, splice site. (F) Gene ontology (GO) analysis of SFSR10 bound genes. The overrepresented terms, gene count, and p-value are shown.
-
Figure 7—source data 1
List of SRSF10 binding targets of LACE-seq data and GO analysis of the SRSF10 binding targets of LACE-seq data.
- https://cdn.elifesciences.org/articles/78211/elife-78211-fig7-data1-v1.zip
Figure 7—figure supplement 1
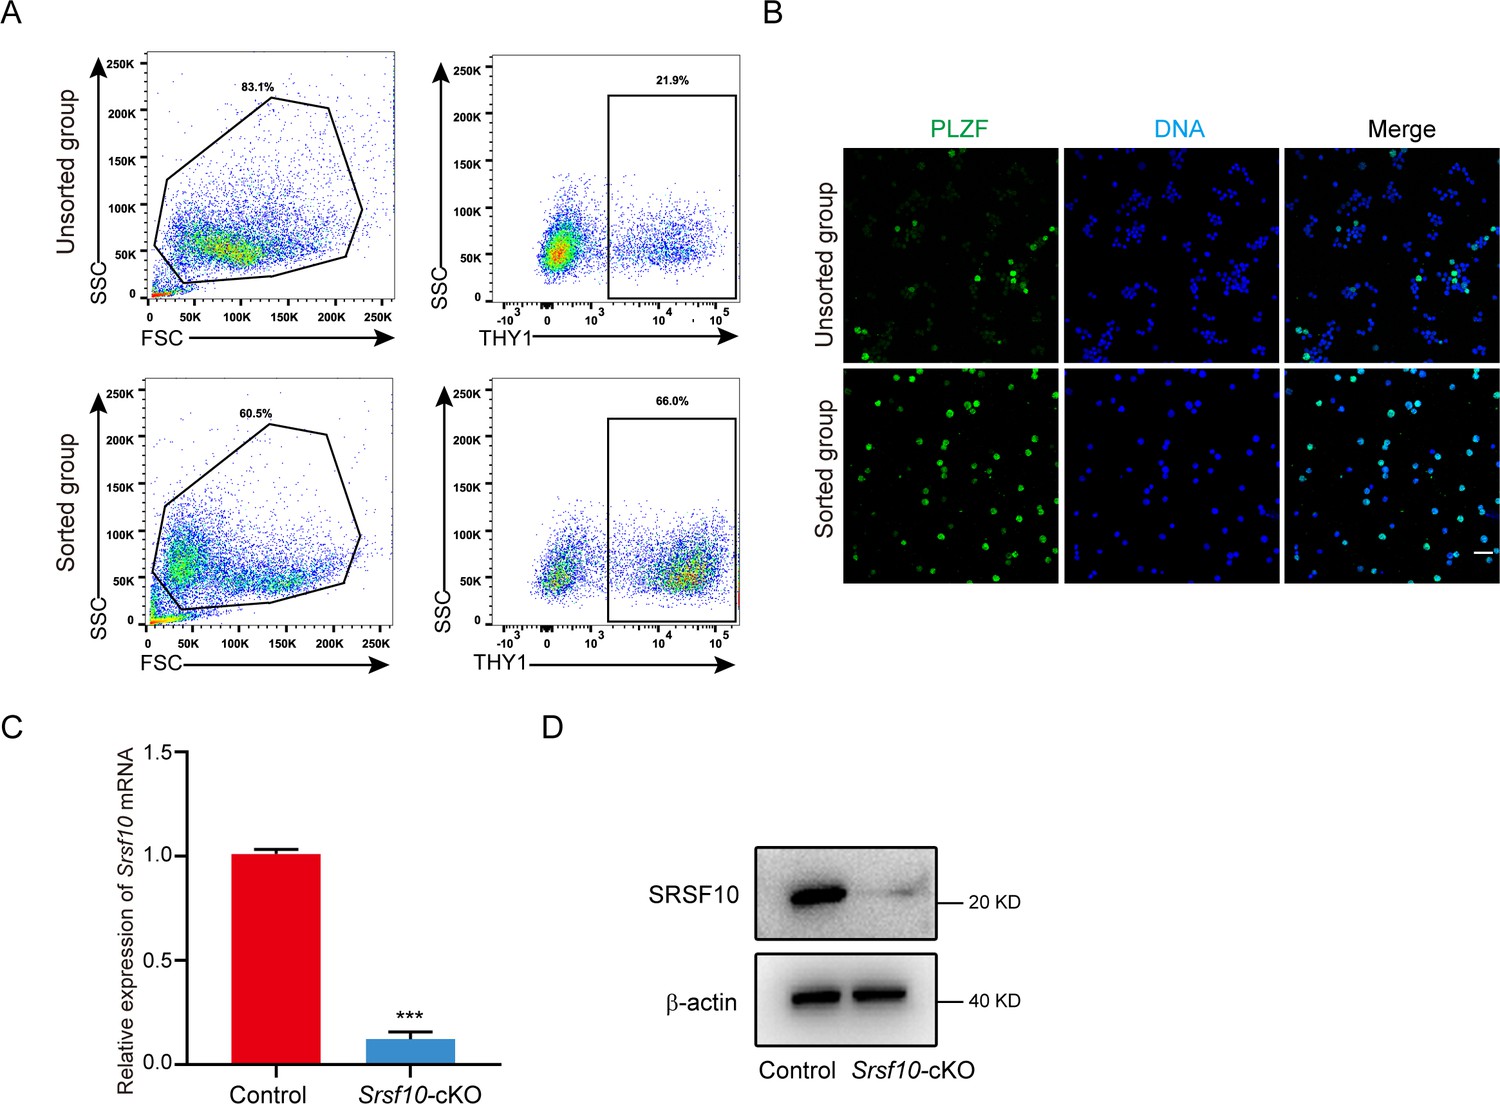
Sorting strategy for THY1+ spermatogonia in control and Srsf10-cKO testes at postnatal day 6 (P6).
(A) Gating strategy for identifying THY1+ spermatogonia from P6 testes. Forward scatter (FSC) vs side scatter (SSC) gating was used to clean up the debris and dead cells. The percentage of THY1+ cells in the unsorted and sorted groups corresponds to 21.9 and 66.0%, respectively. (B) Immunofluorescence staining for PLZF in the unsorted and sorted groups. Scale bar, 20 µm. (C) Quantitative RT-PCR analysis of Srsf10 expression in the sorted THY1+ spermatogonia from control and Srsf10-cKO testes at P6. β-actin was used as the internal control. Two-tailed Student’s t-test was used for statistics. ***p<0.001, Error bars represent s.e.m. (D) Western blot analyses of SRSF10 expression in the sorted THY1+ spermatogonia from control and Srsf10-cKO testes at P6. β-actin was used as the loading control.
-
Figure 7—figure supplement 1—source data 1
Relative mRNA expression of Srsf10 in enriched cells.
- https://cdn.elifesciences.org/articles/78211/elife-78211-fig7-figsupp1-data1-v1.zip
Figure 7—figure supplement 2
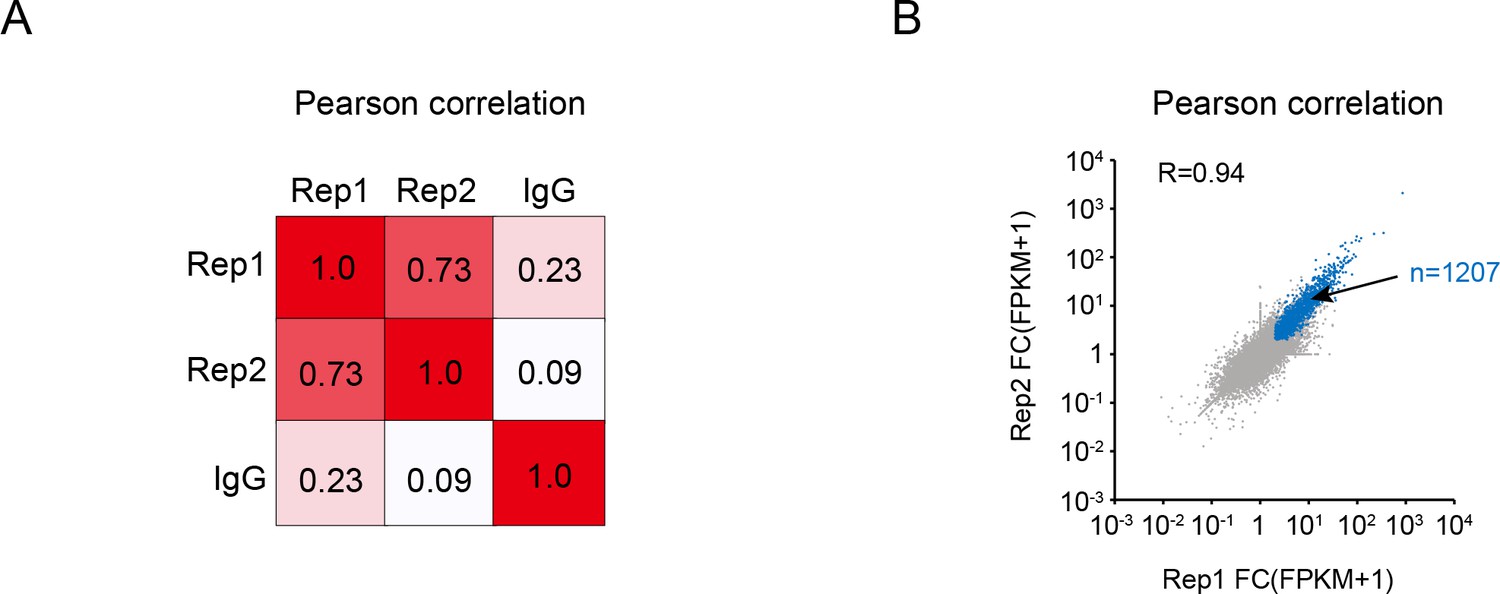
Reproducibility of linear amplification of complementary DNA ends and sequencing (LACE-seq) data.
(A) Heap map showing the Pearson correlation between each LACE-seq sample. (B) Scatter plot showing the reproducibility between two replicates of SRSF10 LACE-seq data. The blue dots denote the 1207 shared binding targets between 2 replicates. Pearson coefficient is shown.
Figure 8 with 3 supplements

Srsf10 is required for normal splicing of functional genes in spermatogonia.
(A) Schematic illustration of the workflow for the enrichment of THY1+ spermatogonia for transcriptome analysis and alternative splicing (AS) analysis using isoform sequencing (Iso-seq). (B) Venn diagram showing the overlapped gene between differentially spliced genes (675 genes including 417 genes in Iso-seq and 317 genes in RNA-seq) and linear amplification of complementary DNA ends and sequencing (LACE-seq; 1207 genes) data. (C) Gene ontology (GO) terms for 113 genes directly bound by SRSF10 with significantly affected AS events and representative genes are shown. (D) Visualization and validation of the differentially spliced genes in control and Srsf10 depleted spermatogonia, and the SRSF10-binding peaks are shown. Tracks from integrative genomics viewer and the SRSF10-binding peaks for selected candidate genes (left). Differentially spliced exons are shaded. Gels images show that RT-PCR analysis of AS patterns of the changed splicing genes in control and Srsf10-cKO spermatogonia. The specific primers for RT-PCR validation were supplied in Supplementary file 2. Schematics of AS events are shown (blue and yellow rectangles) (right). Changes in ‘percent spliced in (PSI)’ between control and Srsf10-cKO spermatogonia are shown below splicing schematics (ΔPSI). SE, skipped exon; A3SS, alternative 3’ splice sites. (E) The protein level of NASP, BCLAF1, DAZL, and KAT7 was determined in control and Srsf10-cKO THY1+ spermatogonia by western blot. β-actin and β-tubulin were used as the internal control.
-
Figure 8—source data 1
Differential alternative splicing events in the Iso-seq data using SUPPA2 analysis and RNA-seq data using comprehensive AS Hunting analysis and raw GO analysis data of all 675 differential alternative splicing genes.
- https://cdn.elifesciences.org/articles/78211/elife-78211-fig8-data1-v1.zip
-
Figure 8—source data 2
Raw GO terms for 113 genes directly bound by SRSF10 with significantly affected AS events.
- https://cdn.elifesciences.org/articles/78211/elife-78211-fig8-data2-v1.zip
-
Figure 8—source data 3
Raw RT-PCR gel for Bclaf1, Nasp, Sycp1, Cenph, Rif1, and Mcm10.
- https://cdn.elifesciences.org/articles/78211/elife-78211-fig8-data3-v1.zip
-
Figure 8—source data 4
Raw western blot for BCLAF1, NASP, DAZL, and KAT7.
- https://cdn.elifesciences.org/articles/78211/elife-78211-fig8-data4-v1.zip
Figure 8—figure supplement 1
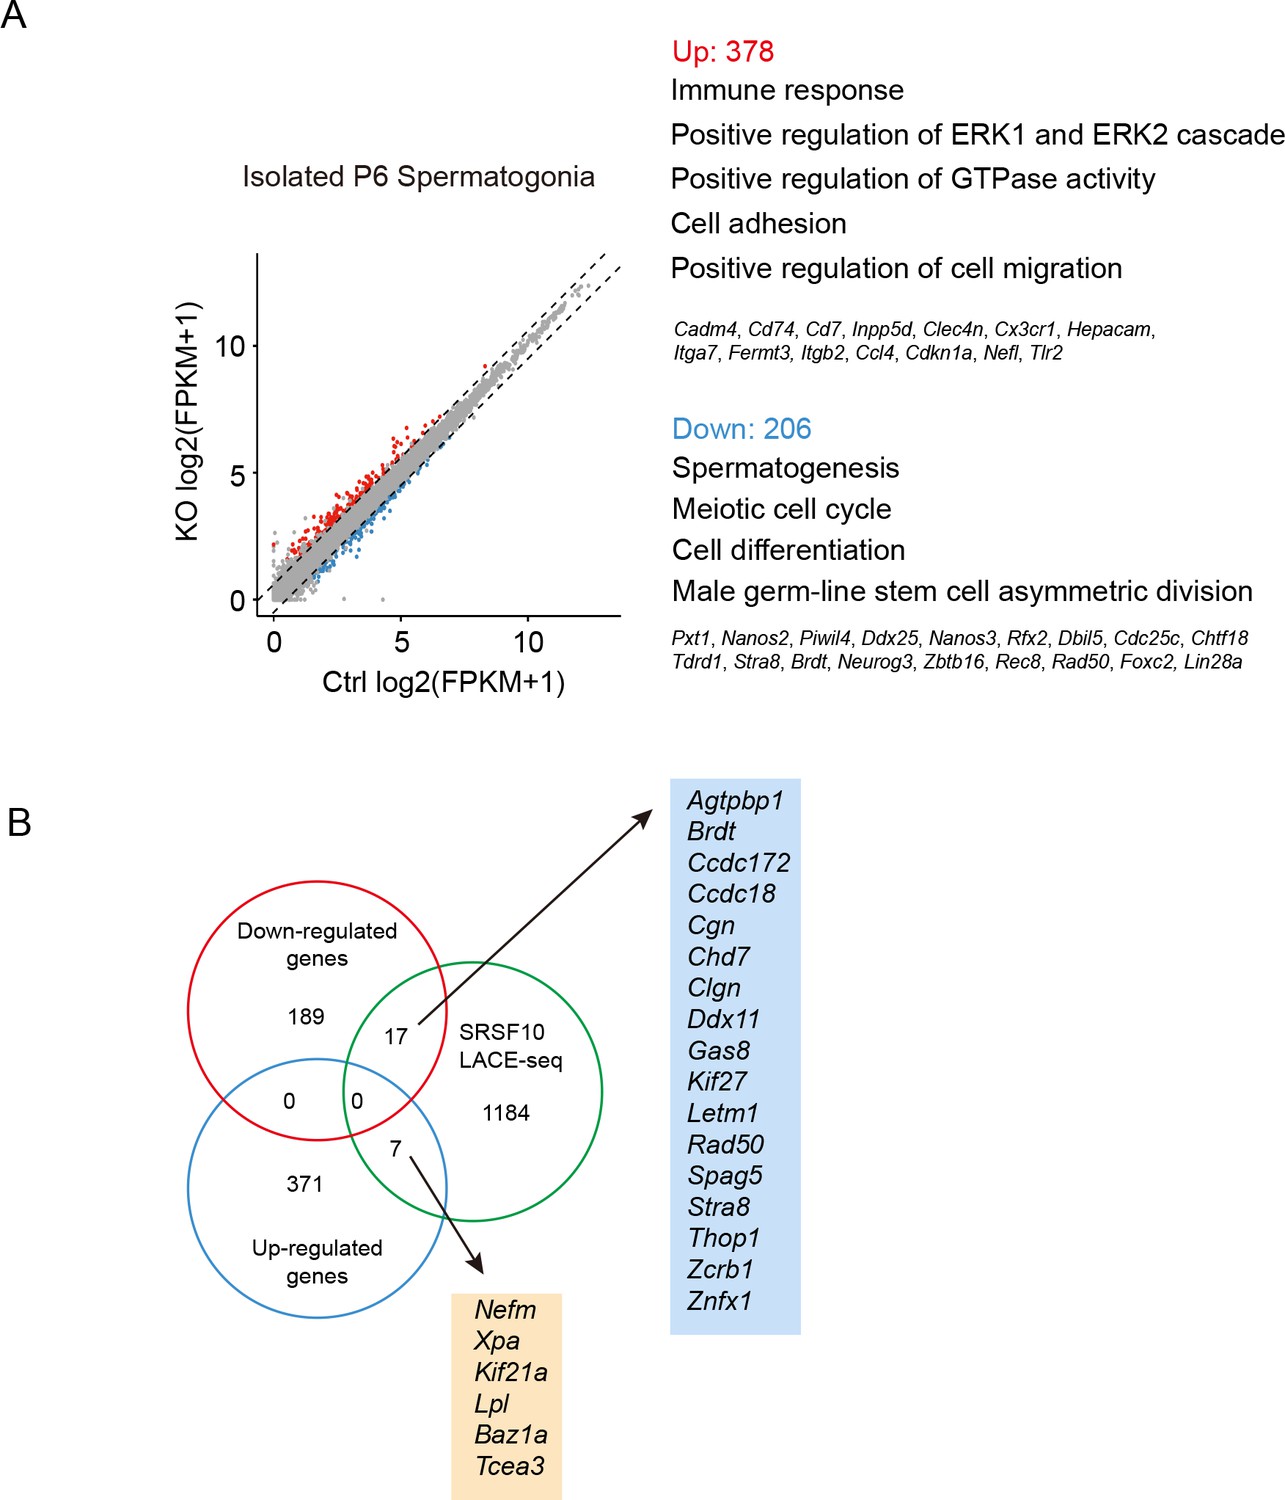
Comparison between RNA-seq and linear amplification of complementary DNA ends and sequencing (LACE-seq) data of THY1+ spermatogonia enriched from control and Srsf10-cKO testes at postnatal day 6 (P6).
(A) Left, scatter plots showing the expression of genes in THY1+ spermatogonia enriched from control and Srsf10-cKO testes at P6. Blue dots represent significantly downregulated genes, while red dots show significantly upregulated genes ( fragments per kilobase of exon per million reads mapped [FPKM] ≥2, |log2FC|≥0.5, and p<0.05). Gray dots represent unchanged genes. Right, gene ontology of upregulated and downregulated genes in Srsf10-cKO THY1+ spermatogonia. (B) Venn diagram showing the overlapped gene between differentially expressed genes (206 downregulated genes and 378 upregulated genes) and 1207 binding targets of SRSF10 in LACE-seq data.
-
Figure 8—figure supplement 1—source data 1
Lists of the differential expression genes in isolated THY1+ spermatogonia in control and Srsf10-cKO at P6.
- https://cdn.elifesciences.org/articles/78211/elife-78211-fig8-figsupp1-data1-v1.zip
Figure 8—figure supplement 2

The differentially alternative splicing (AS) analysis of isoform-sequencing and RNA-seq data.
(A) Seven AS events were significantly affected by the depletion of Srsf10 in the spermatogonia at postnatal day 6 (P6) in Iso-seq data. Splicing events affected by depletion of Srsf10 were analyzed using SUPPA2 software (p<0.05 and |ΔPSI|≥0.1). (B) Scatter plot showing the significantly affected AS events (color-coded) in the absence of Srsf10 at P6. Blue dots represent significantly downregulated AS events (ΔPSI ≤–0.1), while red dots show significantly upregulated AS events (ΔPSI ≥0.1). (C) Seven AS events were significantly affected by depletion of Srsf10 in the RNA-seq data using Comprehensive AS Hunting software analysis (p<0.05). (D) Gene ontology (GO) terms for all 675 differentially spliced genes and representative genes involved in cell cycle, chromosome segregation and spermatogenesis are shown.
Figure 8—figure supplement 3
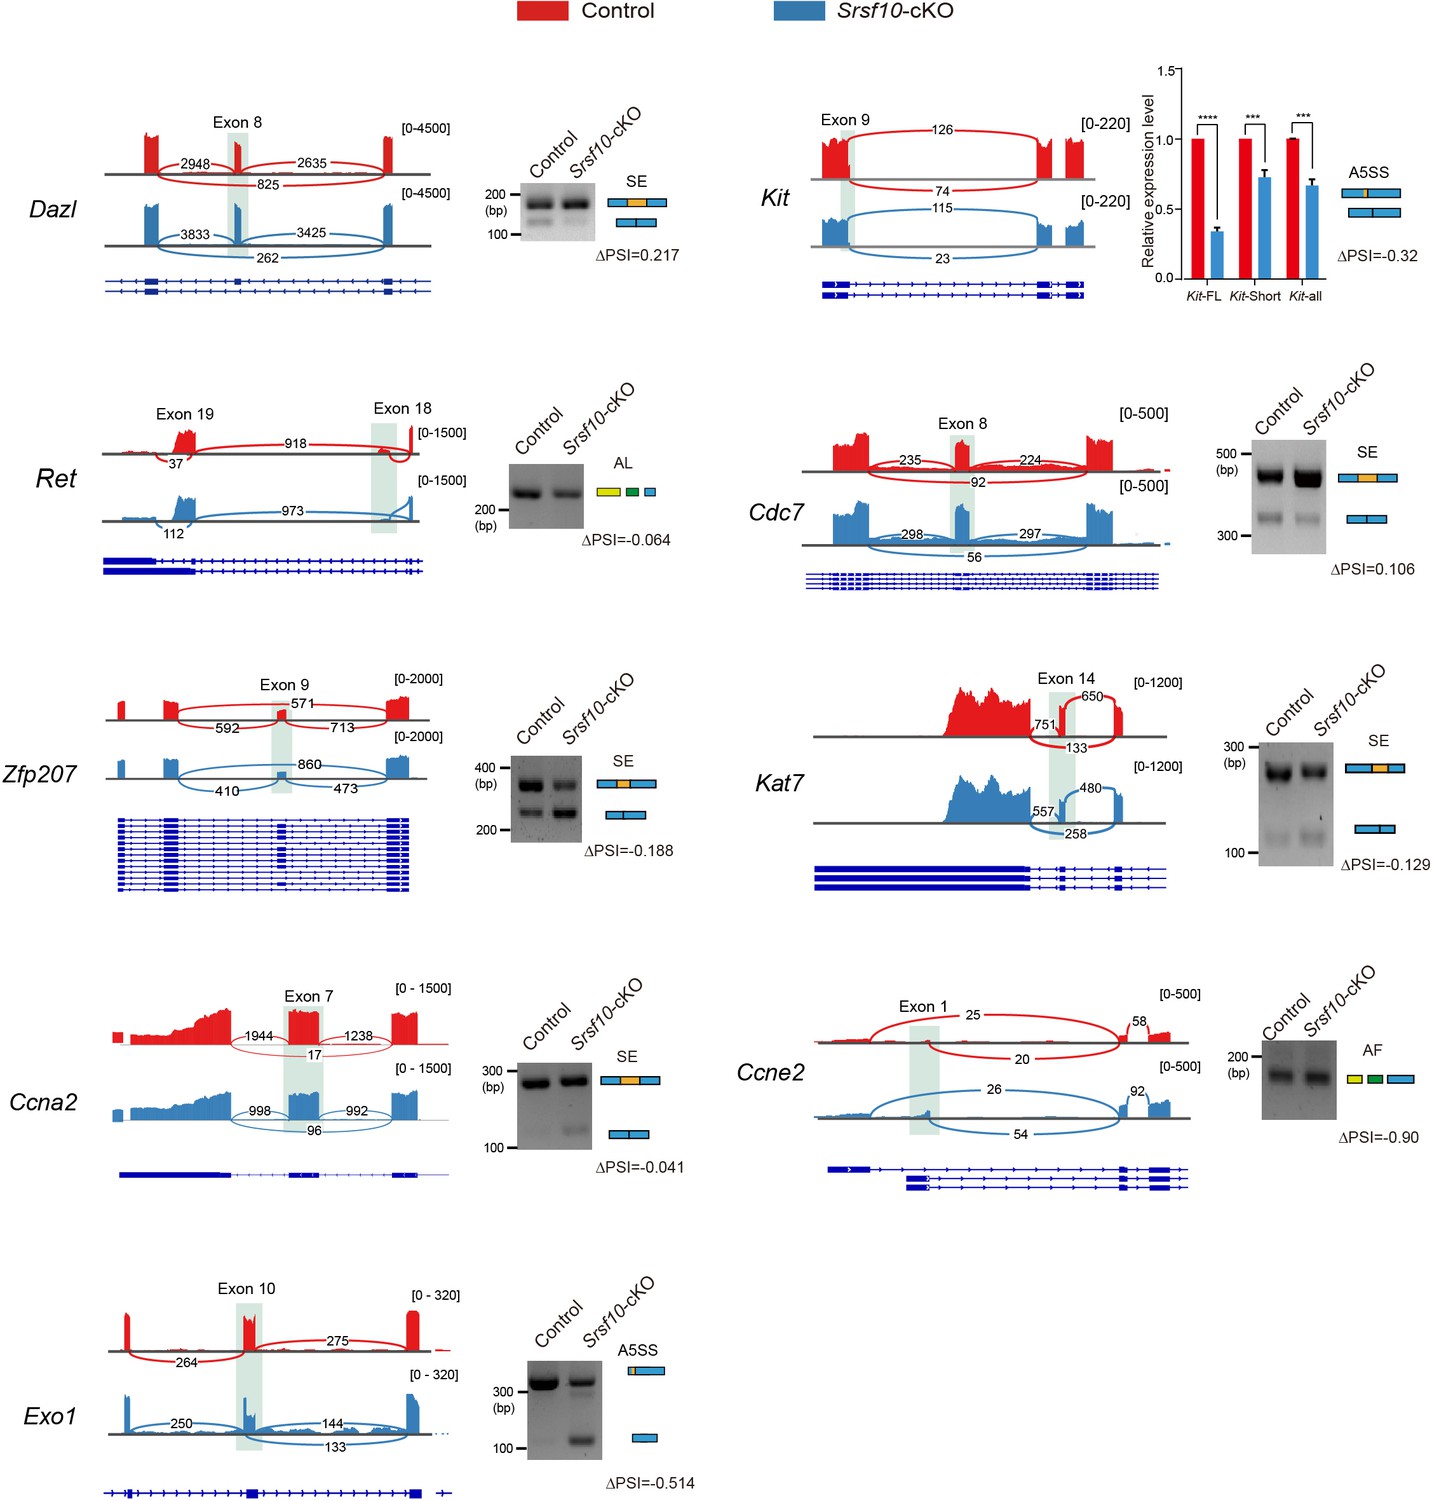
Visualization and validation of some differentially spliced functional genes in control- and Srsf10-depleted spermatogonia.
Visualization and validation of the differentially spliced genes in control- and Srsf10-depleted spermatogonia. Tracks from integrative genomics viewer are shown for selected candidate genes (left). Differentially spliced exons are shaded. Gel images show that RT-PCR analysis of alternative splicing (AS) patterns of the changed splicing genes in control and Srsf10-cKO spermatogonia. The specific primers for RT-PCR validation were supplied in Supplementary file 2. Schematics of AS events are shown (blue and yellow rectangles) (right). Changes in ‘percent spliced in (PSI)’ between control and Srsf10-cKO spermatogonia are shown below splicing schematics (ΔPSI). SE, skipped exon, A5SS, alternative 5’ splice sites, AF, alternative first exon, AL, alternative last exon.
-
Figure 8—figure supplement 3—source data 1
Raw RT-PCR gel for Dazl, Kat7, Zfp207, Exo1, Ret, Ccna2, Ccne2, and Cdc7.
- https://cdn.elifesciences.org/articles/78211/elife-78211-fig8-figsupp3-data1-v1.zip
-
Figure 8—figure supplement 3—source data 2
Relative expression of Kit in control and Srsf10-cKO spermatogonia.
- https://cdn.elifesciences.org/articles/78211/elife-78211-fig8-figsupp3-data2-v1.zip
Figure 9
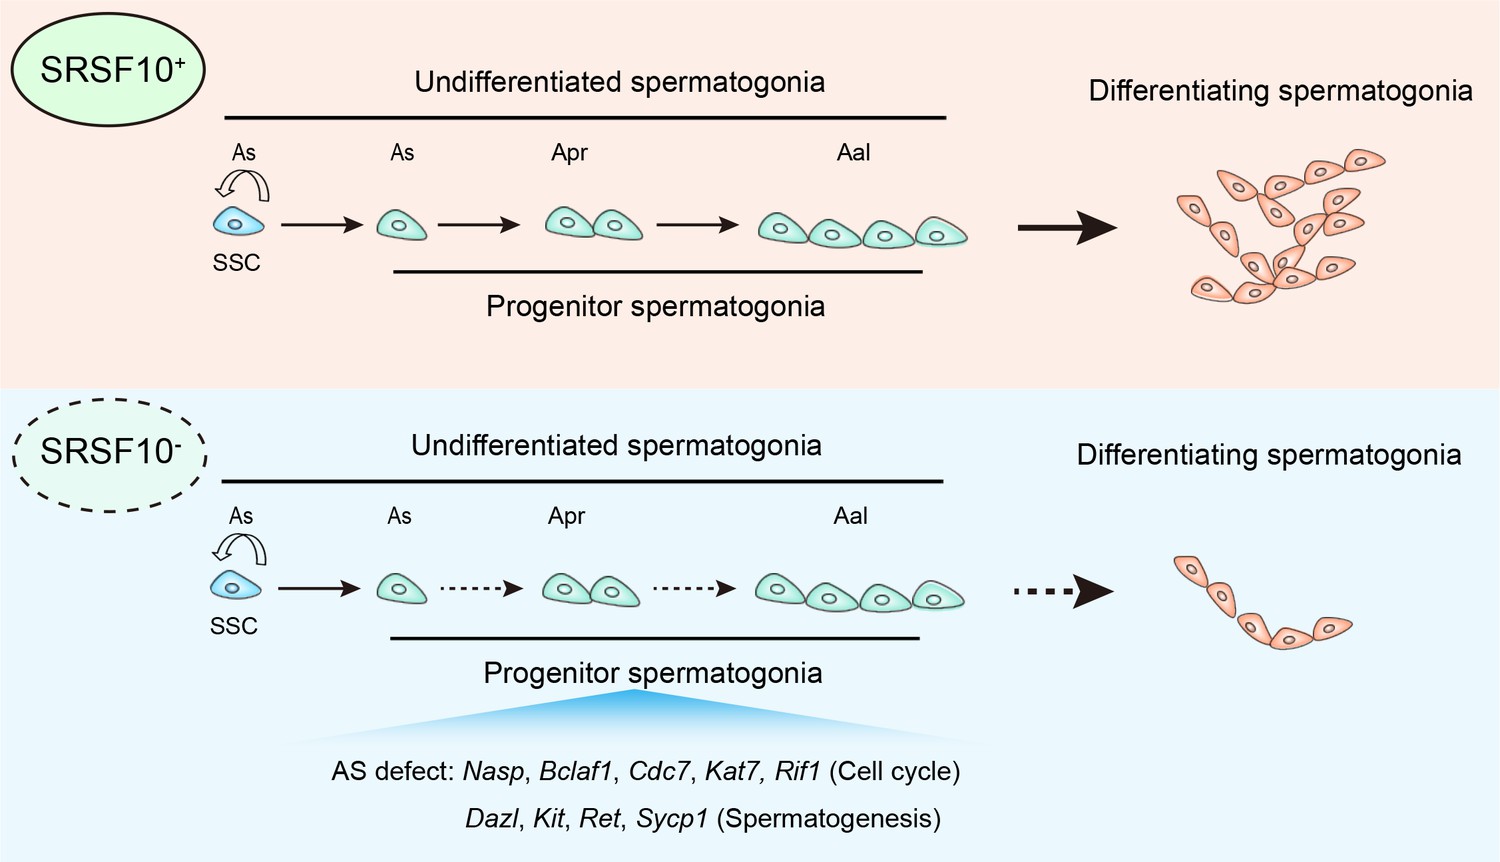
Model of SRSF10-mediated alternative splicing (AS) regulation in the development of undifferentiated spermatogonia.
In the control testes, SRSF10 promotes the expansion of progenitor spermatogonia and subsequent differentiation of spermatogonia. In the absence of SRSF10, the AS defects of key genes involved in cell cycle, chromosome segregation, and spermatogenesis impair the expansion of progenitor spermatogonia, leading to the decreased number of undifferentiated spermatogonia and nearly absence of differentiating spermatogonia.
Author response image 1
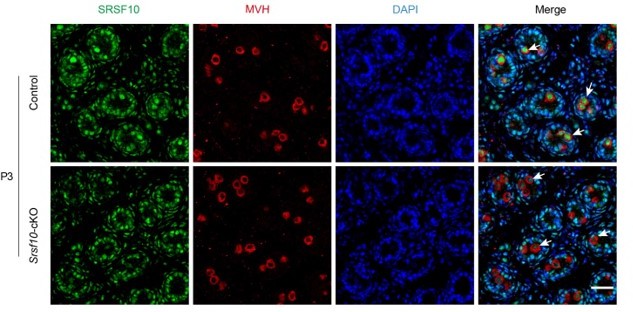
Co-staining for SRSF10 and MVH in P3 control and Srsf10-cKO testes.
White arrows indicate the representative germ cells. MVH (a germ cell marker) was co-stained to indicate the location of germ cells. The DNA was stained with Hoechst 33342. Scale bar, 20 µm.
Tables
Table 1
The fertility of Srsf10-cKO males.
| Genotype | No. of male mice | No. of plugged female mice | No. of litters | No. of pups per litter | |
|---|---|---|---|---|---|
| Male | Female | ||||
| Control | WT | 8 | 17 | 14 | 13.43±3.78 |
| Srsf10-cKO | WT | 8 | 16 | 0 | 0 |
-
*8-week-old wide-type ICR mice.
-
Table 1—source data 1
The fertility of Srsf10-cKO male mice.
- https://cdn.elifesciences.org/articles/78211/elife-78211-table1-data1-v1.zip
Author response table 1
Antibodies used for validating the differentially spliced genes at the protein level in control and Srsf10-cKO isolated THY1+ spermatogonia.
| Antibody | Company and Cat. No. | Work for WB | Bound by SESF10 | Validated |
|---|---|---|---|---|
| BCLAF1 | 26809-1-AP Proteintech | Yes | Yes | Yes |
| NASP | 11323-1-AP Proteintech | Yes | Yes | Yes |
| MCM10 | 12251-1-AP Proteintech | No | Yes | No |
| MAM10 | A7199 Abclonal | Yes | Yes | No |
| CENPH | 12841-1-AP Proteintech | Yes | Yes | No |
| RIF1 | A15167Abclonal | No | Yes | No |
| KDM3B | 19915-1-AP Proteintech | No | Yes | No |
| SYCP1 | ab217295 Abcam | No | Yes | No |
| EXO1 | 16253-1-AP Proteintech | No | No | No |
| DAZL | MCA23336 Bio-Rad | Yes | No | Yes |
| RET | Ab134100 Abcam | No | No | No |
| KIT | AF1356R&D | No | No | No |
| KIT | 18696-1-AP Proteintech | No | No | No |
| KAT7 | 13751-1-AP Proteintech | Yes | No | Yes |
Additional files
-
Transparent reporting form
- https://cdn.elifesciences.org/articles/78211/elife-78211-transrepform1-v1.docx
-
Supplementary file 1
Primers for quantitative PCR validation.
- https://cdn.elifesciences.org/articles/78211/elife-78211-supp1-v1.docx
-
Supplementary file 2
Primers for validation of differential splicing changes.
- https://cdn.elifesciences.org/articles/78211/elife-78211-supp2-v1.docx
Download links
A two-part list of links to download the article, or parts of the article, in various formats.
Downloads (link to download the article as PDF)
Open citations (links to open the citations from this article in various online reference manager services)
Cite this article (links to download the citations from this article in formats compatible with various reference manager tools)
SRSF10 is essential for progenitor spermatogonia expansion by regulating alternative splicing
eLife 11:e78211.
https://doi.org/10.7554/eLife.78211


