Vocalization categorization behavior explained by a feature-based auditory categorization model
- Center for Neuroscience at the University of Pittsburgh, United States
- Center for the Neural Basis of Cognition, United States
- Department of Neurobiology, University of Pittsburgh, United States
- Department of Bioengineering, University of Pittsburgh, United States
- Department of Communication Science and Disorders, University of Pittsburgh, United States
Figures
Figure 1 with 1 supplement
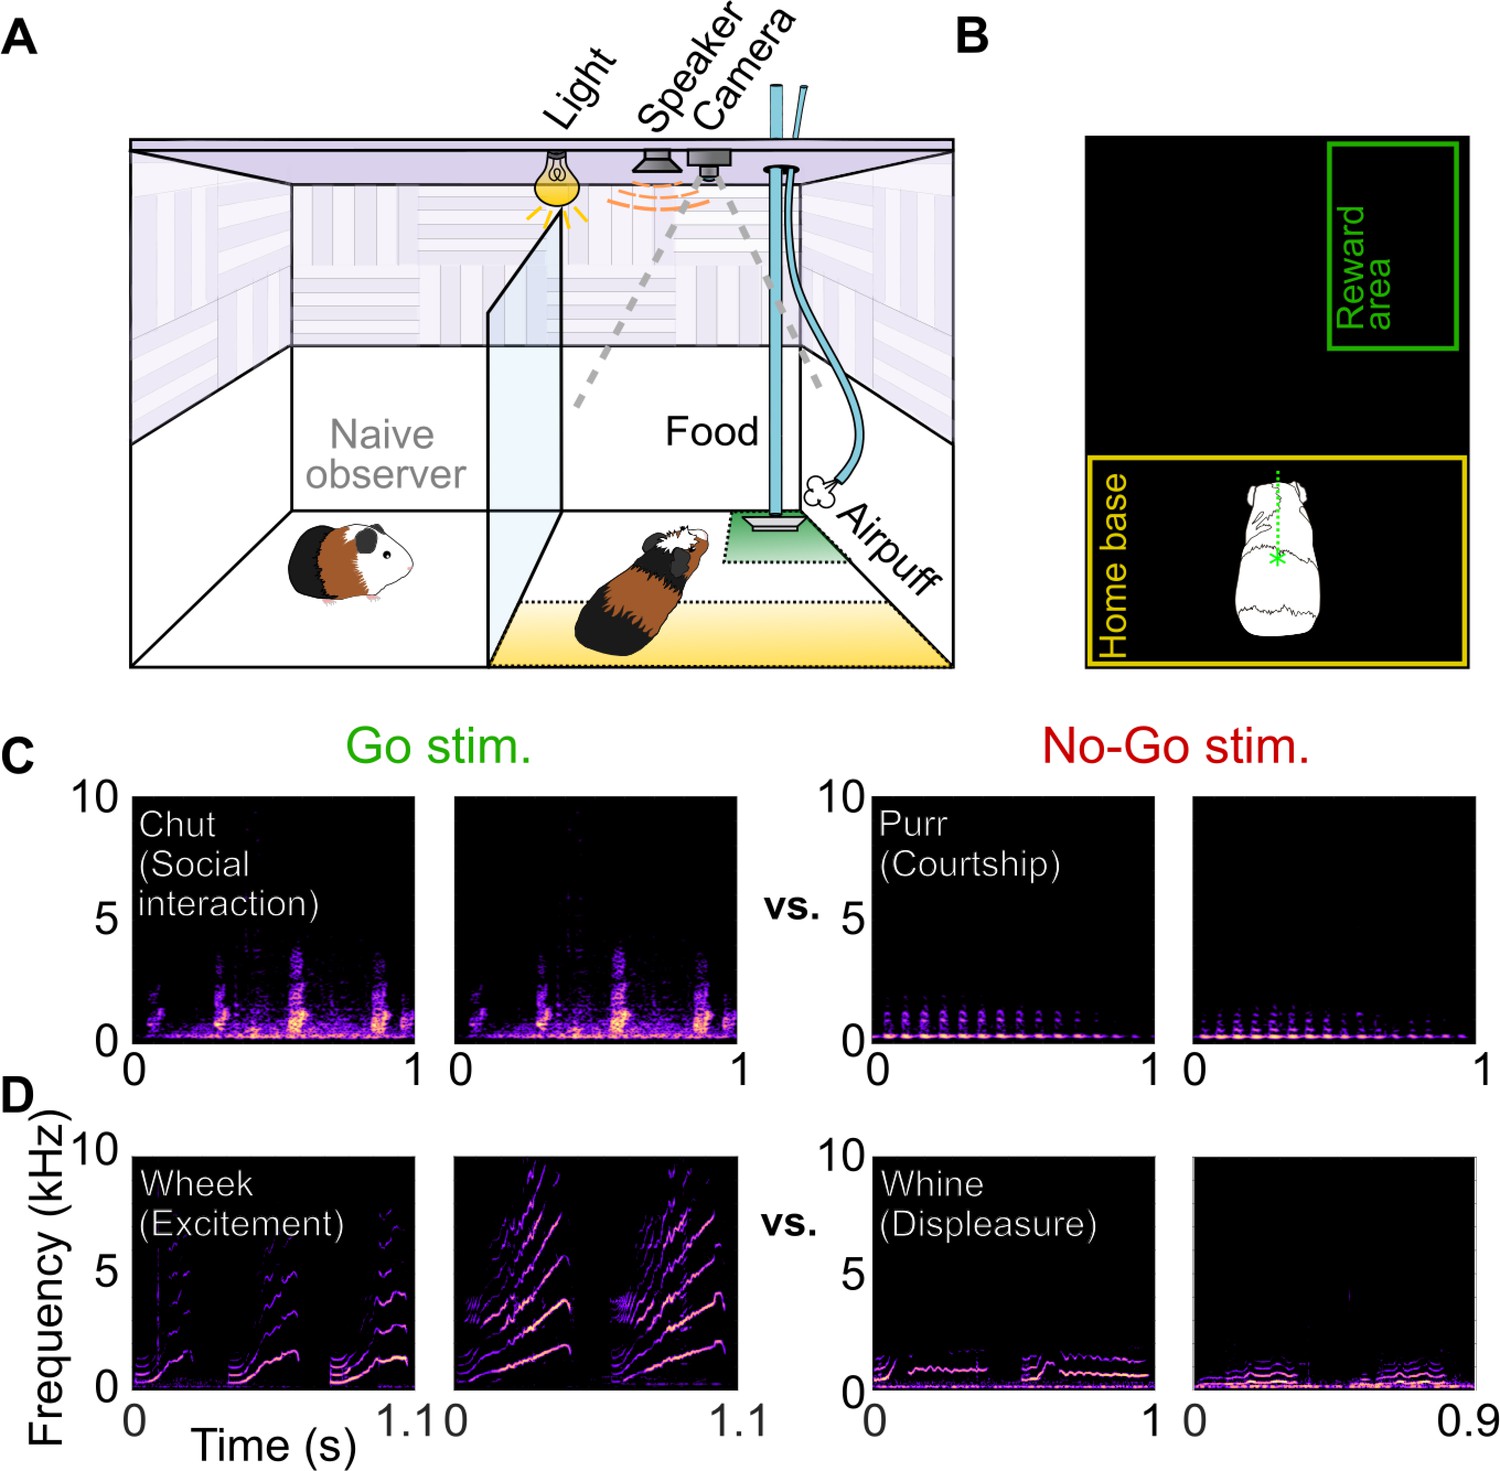
Call categorization behavior in GPs.
(A) Behavioral setup, indicating home base region for trial initiation (yellow) and reward area (green). Some naive animals observed expert animals performing the task to speed up task acquisition. (B) Video tracking was employed to detect GP position and trigger task events (stimulus presentation, reward delivery, etc.). (C) Spectrograms of example chut calls (Go stimuli for Cohort 1) and purr calls (No-go stimuli for Cohort 1). (D) Spectrograms of example wheek calls (Go stimuli for Cohort 2) and whine calls (No-go stimuli for Cohort 2). Performance of GPs during the training phase of the call categorization task is shown in Figure 1—figure supplement 1. GP, guinea pig.
Figure 1—figure supplement 1
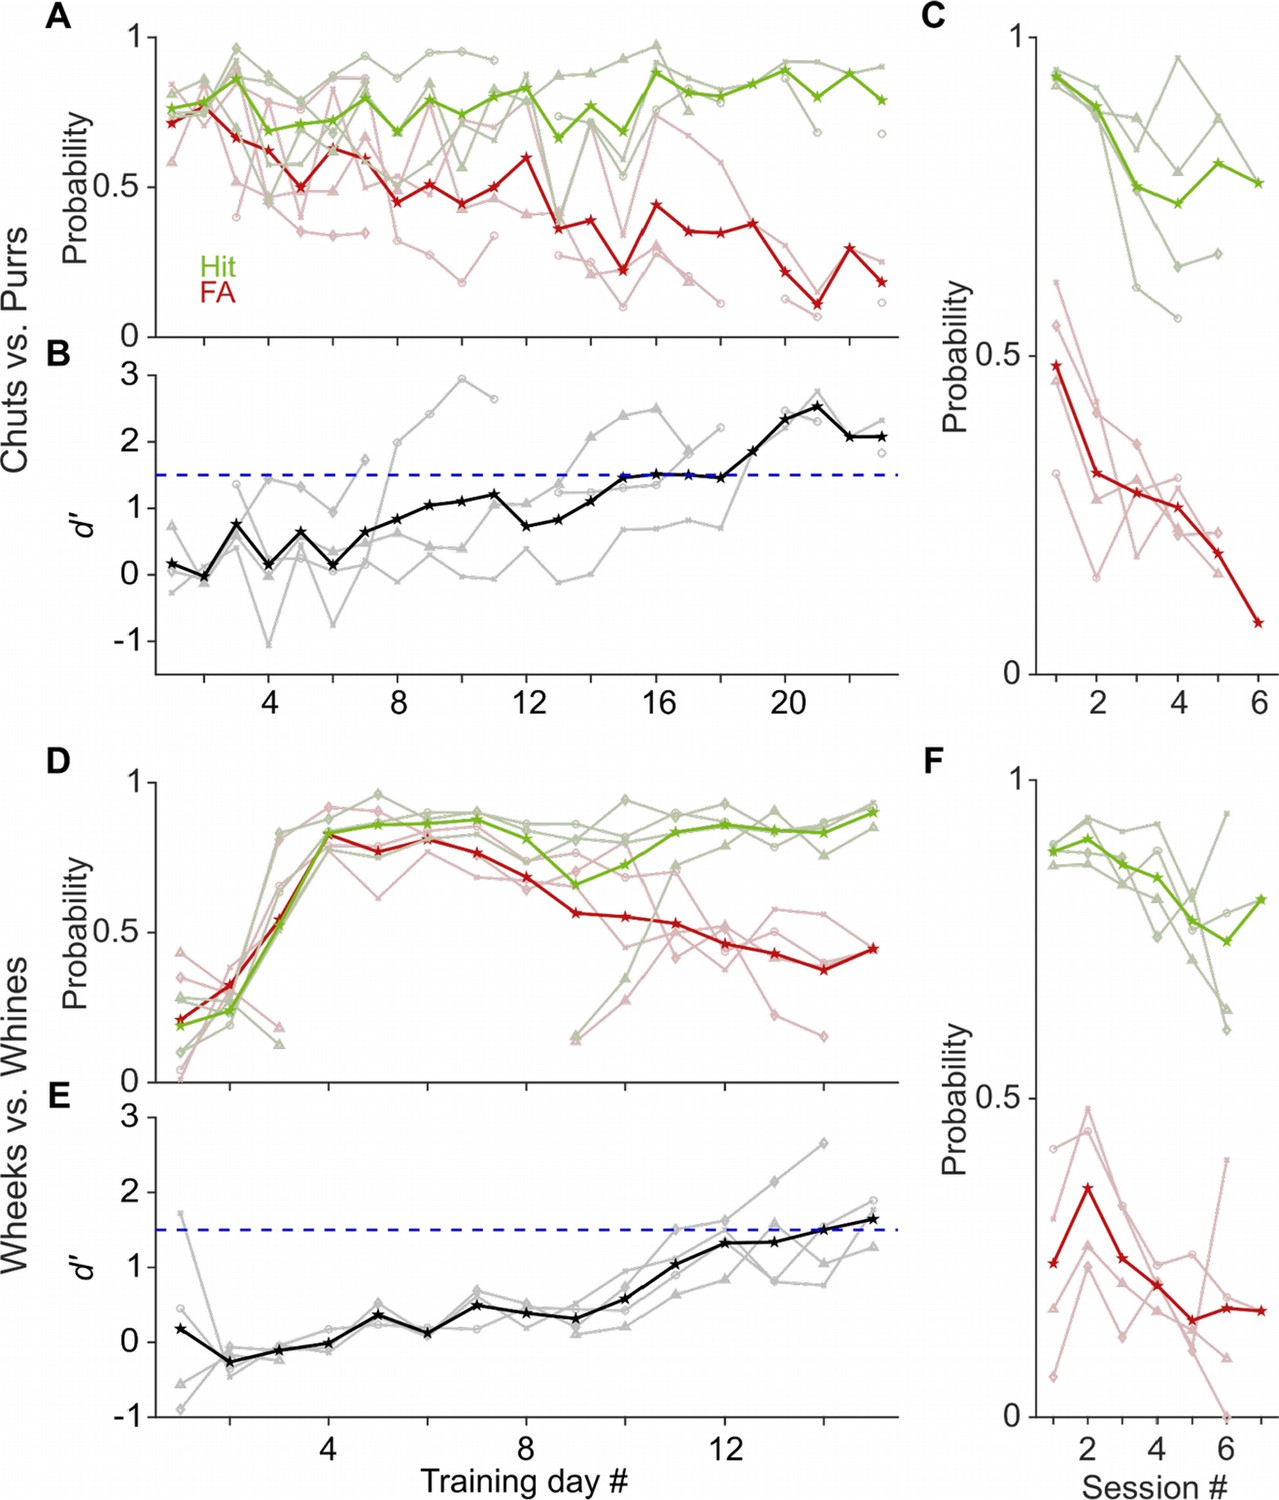
Learning rates of GPs performing a call categorization task.
(A) and (D) Probability of hits (green) and false alarms (FAs; red) as a function training day (averaged over ~6 sessions per day) for the chuts versus purrs (A) and wheeks versus whines (D) tasks. Dark lines are averages of all subjects, faint lines correspond to individual subjects. (B) and (E) Sensitivity index (d′) as a function of training day. Black line is average over four subjects, gray lines are individual subjects. Subjects were considered trained when their performance showed d′>1.5 (dashed blue line). (C) and (F) hits and FAs of animals as a function of intra-day session number, averaged over 4 days after animals acquired the task.
-
Figure 1—figure supplement 1—source data 1
Hit rates, false alarm rates, and d′ values of GPs over the course of training on vocalization categorization tasks.
- https://cdn.elifesciences.org/articles/78278/elife-78278-fig1-figsupp1-data1-v2.xlsx
Figure 2
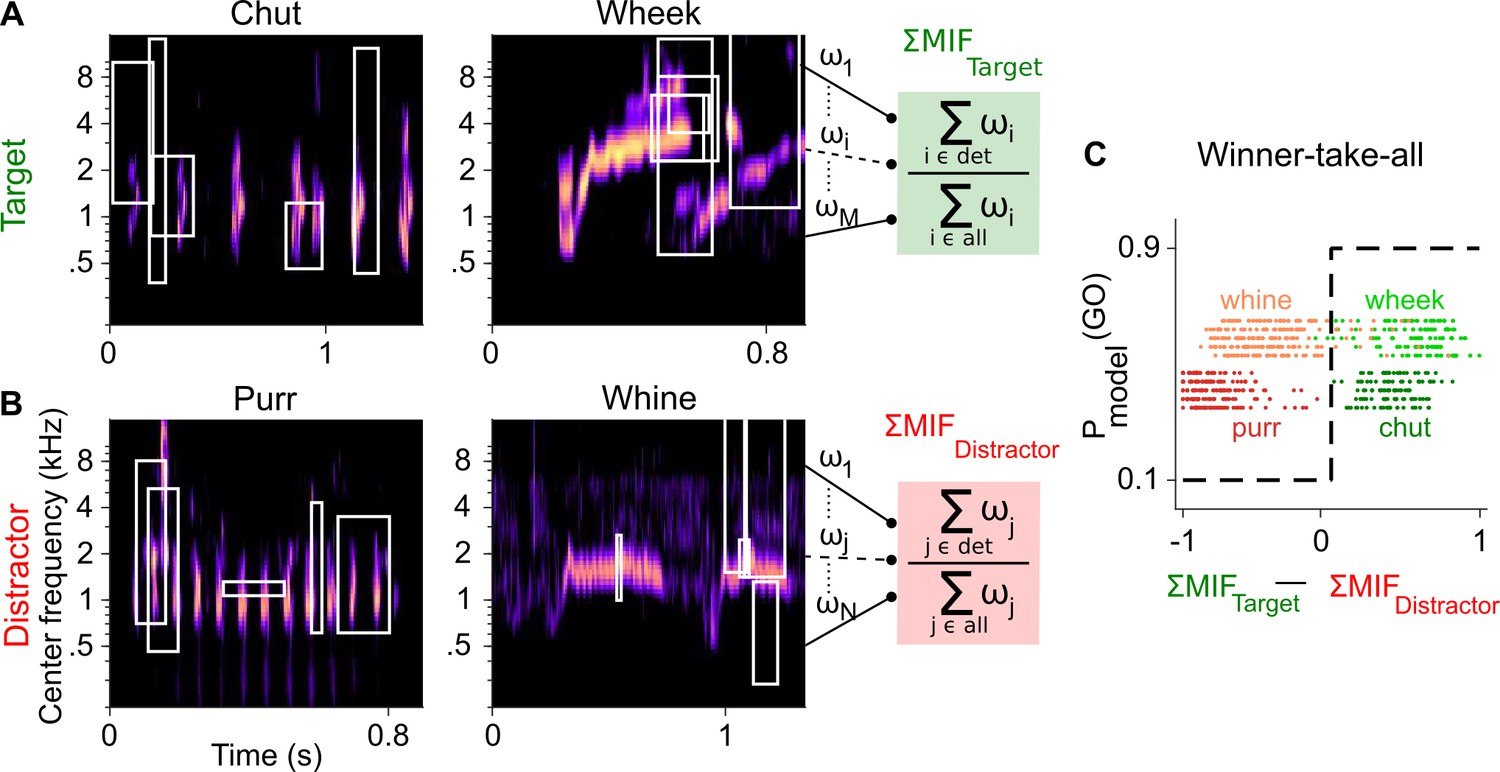
Framework of the model trained to perform call categorization tasks.
(A) and (B) Example cochleagrams for target (A) and distractor (B) calls. Cochleagram rows were normalized to set the maximum value as 1 and then smoothed for display. White rectangles denote detected MIFs for that call. For an input call, the target (green) FD stage response is the sum of all detected target MIF weights normalized by the sum of all MIF weights for that call type. The distractor response (red) is similarly computed. (C) The output of the winner-take-all (WTA) stage is determined based on the difference between the target and distractor FD stage responses. Dots represent the WTA outputs for all calls used for training the models. Rows represent the five instantiations of the model with different MIF sets. MIF, maximally informative features; det, detected MIFs; all, all MIFs.
Figure 3
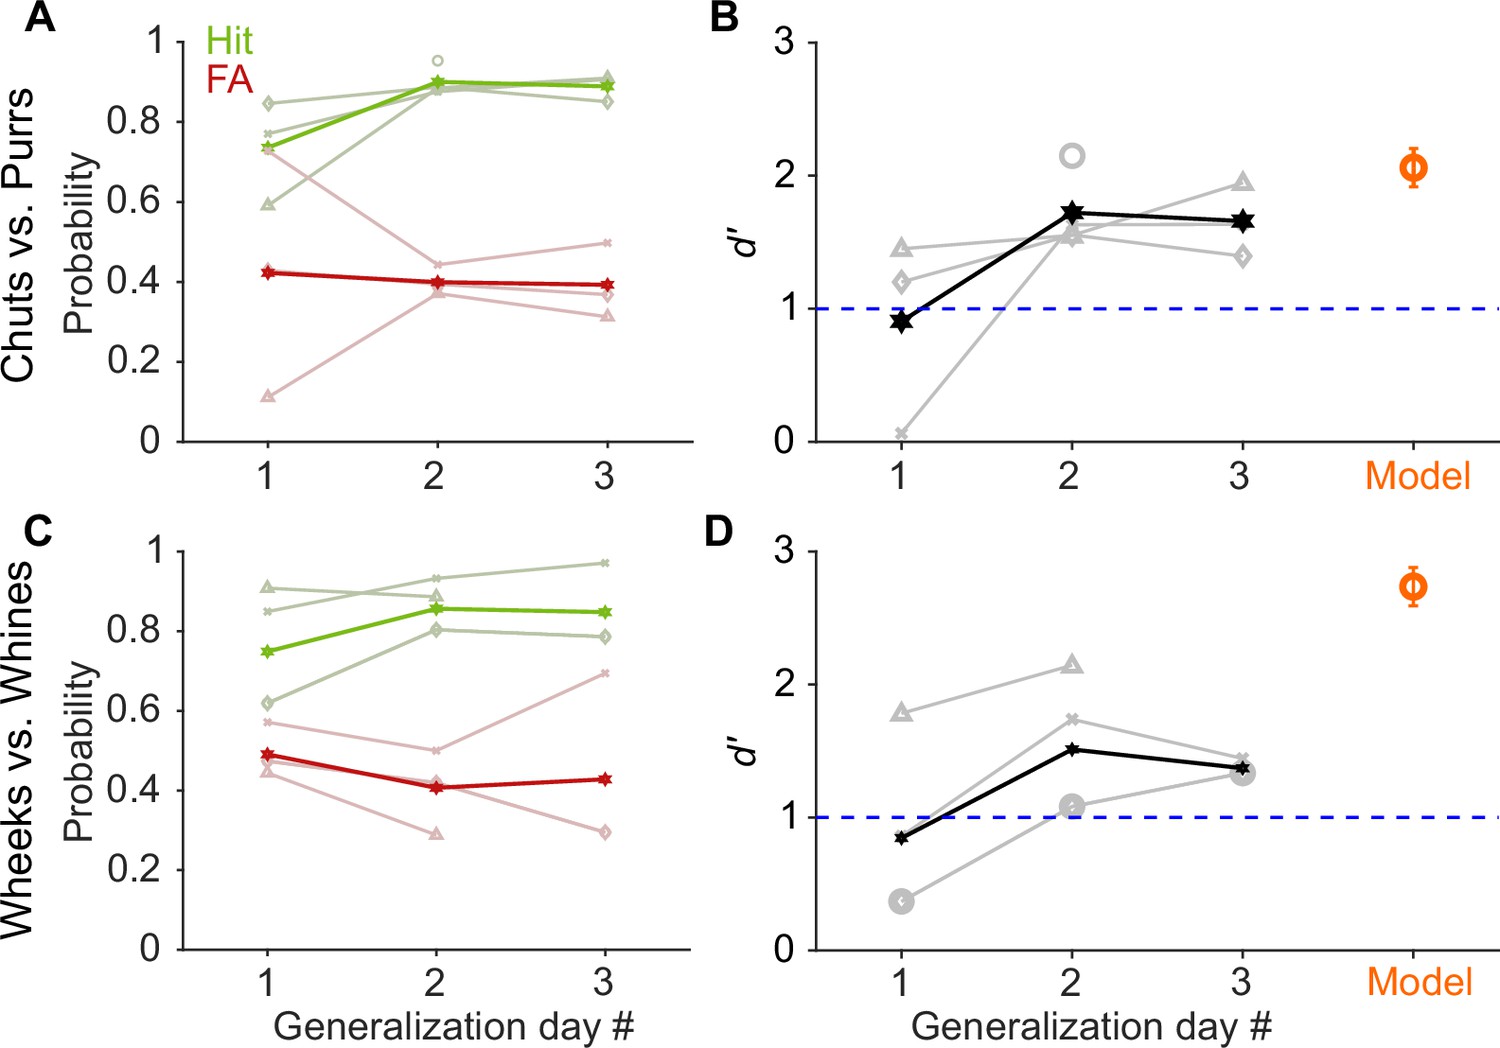
GP and model performance generalizes to new exemplars.
(A) and (C) Hit (green) and false alarm (FA; red) rates of GPs when categorizing new exemplars as a function of generalization day. We presented ~5 trials of each new exemplar per day. Dark lines correspond to average over subjects, faint lines correspond to individual subjects. (B) and (D) Quantification of generalization performance. Black line corresponds to average d′, gray lines are d′ values of individual subjects. GPs achieved a d′>1 by generalization day 2, that is, after exposure to only ~5 trials of each new exemplar on day 1. The feature-based model (orange, n = 5 instantiations, error bars correspond to s.e.m.) also generalized to new exemplars that were not part of the model’s training set of calls. Source data are available in Figure 3—source data 1. GP, guinea pig.
-
Figure 3—source data 1
Hit rates, false alarm rates, and d′ values of GPs and the feature-based model for generalization to new vocalization exemplars.
- https://cdn.elifesciences.org/articles/78278/elife-78278-fig3-data1-v2.xlsx
Figure 4
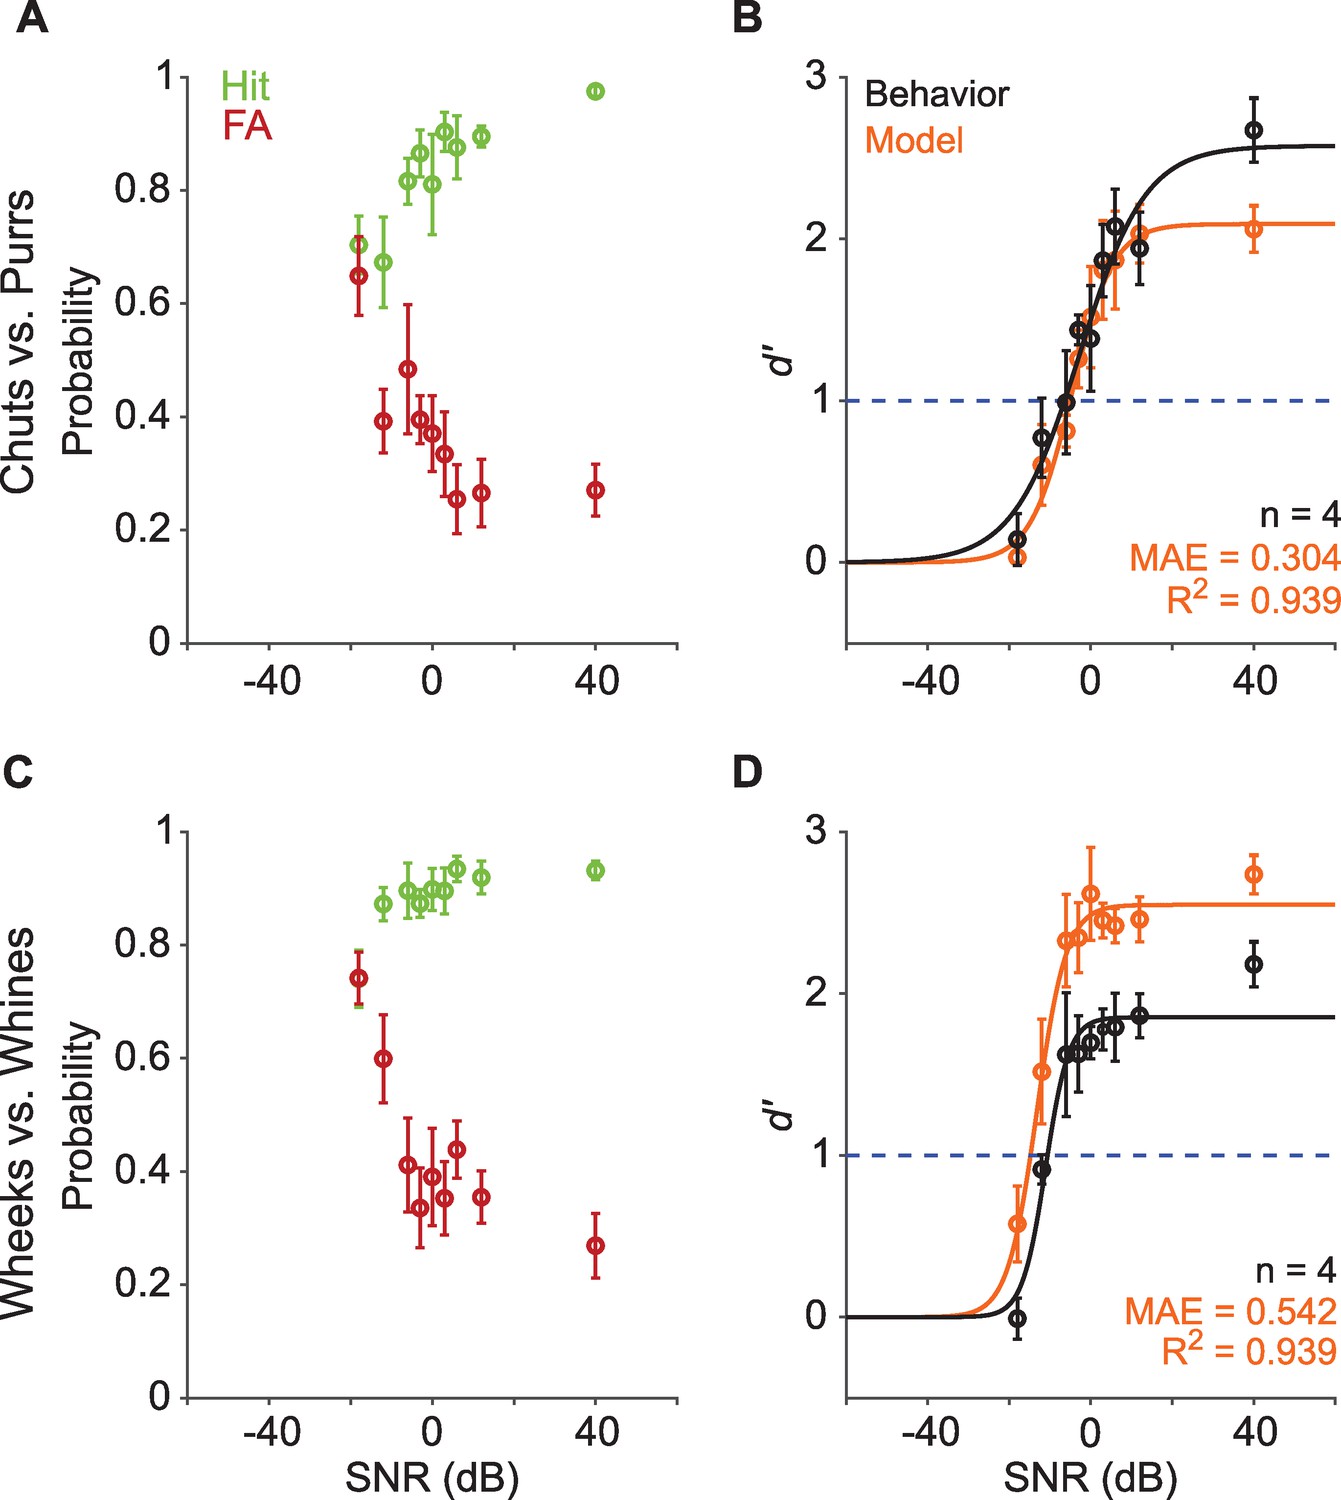
Call categorization is robust to degradation by noise.
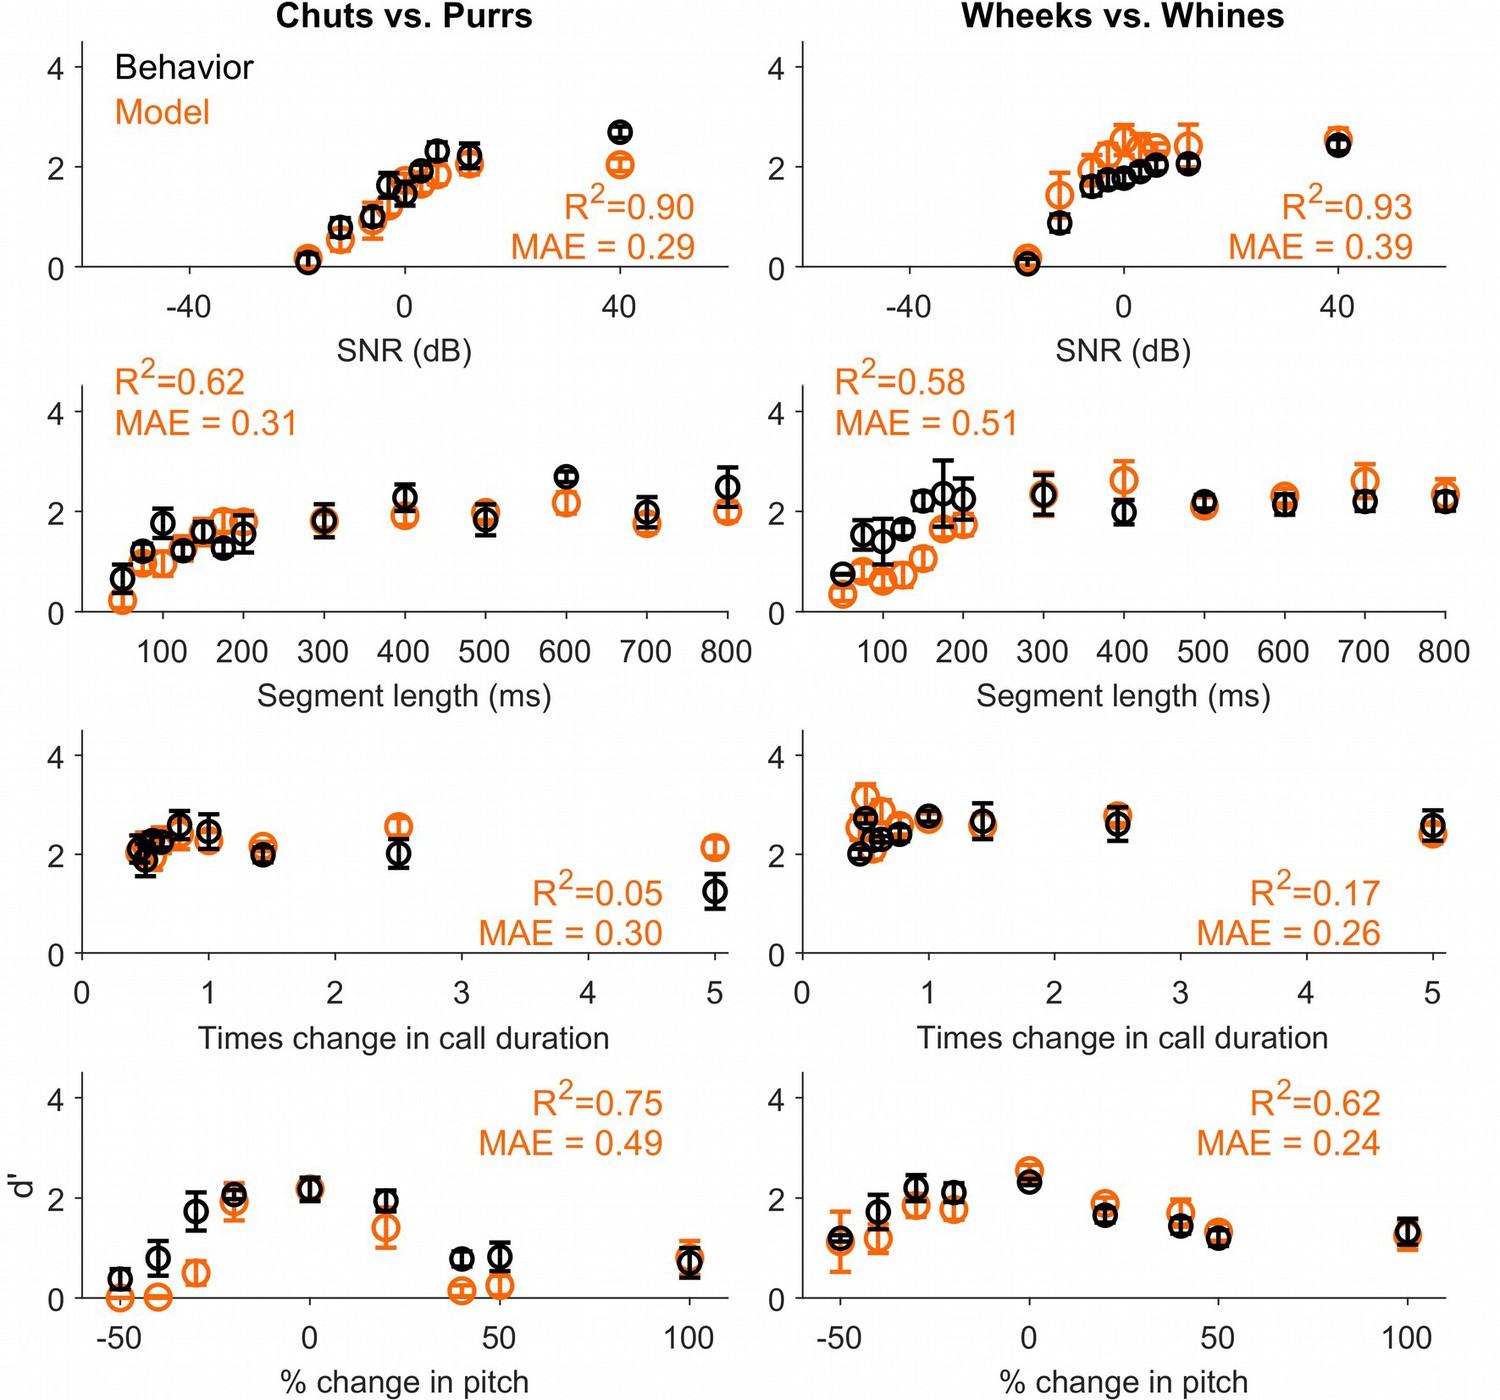
(A) and (C) Hit (green) and false alarm (FA; red) rates of GPs categorizing calls with additive white noise at different SNRs. (B) and (D) Sensitivity index (d′) as a function of SNR. Black symbols correspond to the mean d′ across animals (n=4); error bars correspond to s.e.m. Black line corresponds to a psychometric function fit to the behavioral data. Orange symbols correspond to the mean d′ across five instantiations of the model, error bars correspond to s.e.m. Orange line corresponds to a psychometric function fit to the model data. Dashed blue line signifies d′=1. The statistical significance of SNR value on behavior was evaluated using a generalized linear model (see main text). Source data are available in Figure 4—source data 1. GP, guinea pig; MAE, mean absolute error; SNR, signal-to-noise ratio.
-
Figure 4—source data 1
Hit rates, false alarm rates, and d′ values of GPs and the feature-based model for vocalization categorization in noise (at different SNRs).
- https://cdn.elifesciences.org/articles/78278/elife-78278-fig4-data1-v2.xlsx
Figure 5
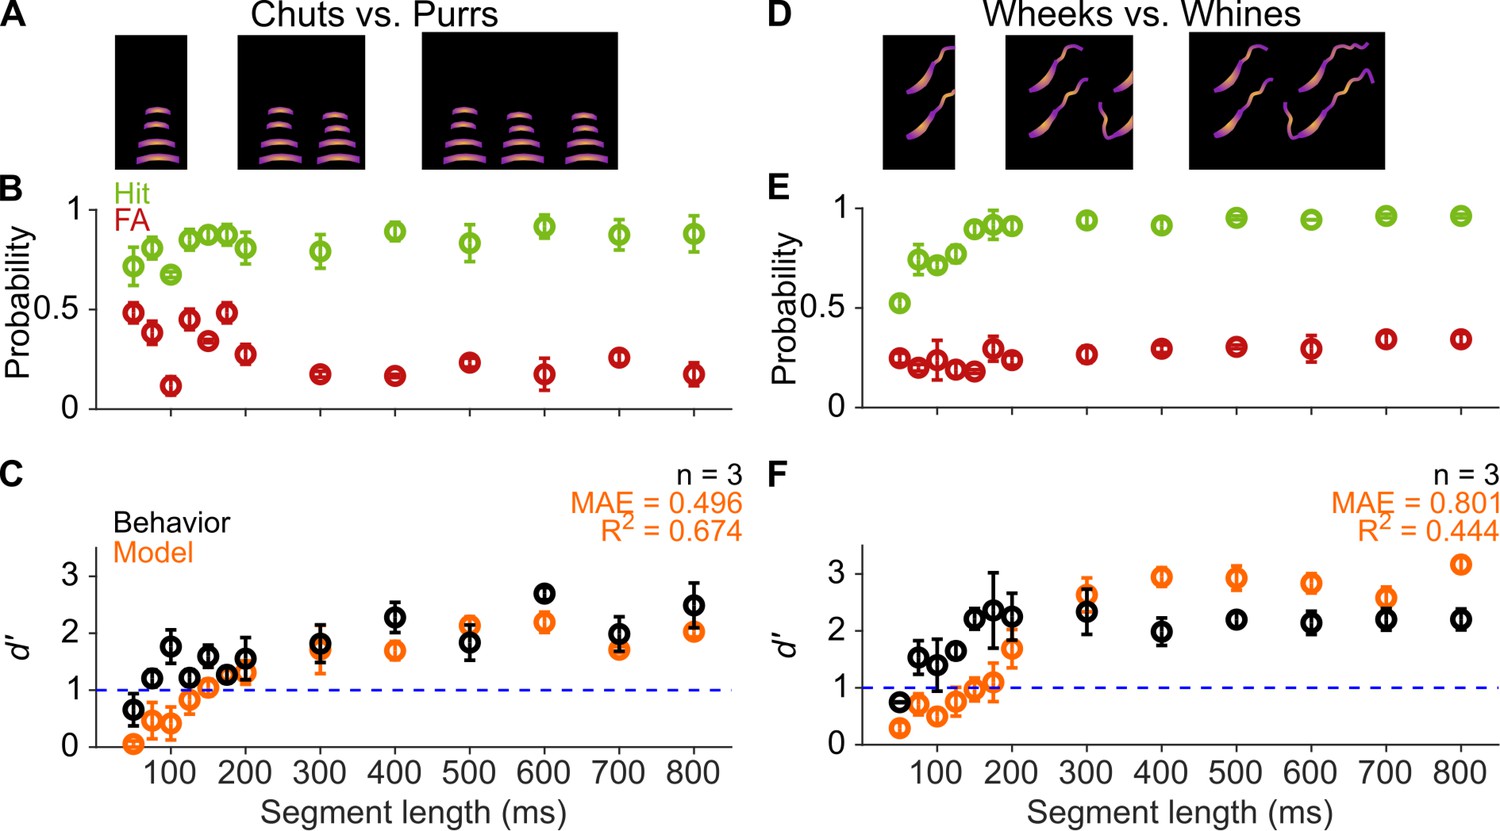
GPs can obtain information for categorization from short-duration segments of calls.
(A) and (D) Schematic showing truncation of stimuli at different segment lengths from the onset of calls. (B) and (E) Average (n=3 GPs) hit rate (green) and false alarm rates (red) as a function of stimulus segment length. (C) and (F) Black symbols correspond to average GP d′ (n=3 GPs), error bars correspond to s.e.m. Orange symbols correspond to average model d′ (n=5 model instantiations), error bars correspond to s.e.m. Dashed blue line denotes d′=1. The statistical significance of segment length value on behavior was evaluated using a generalized linear model (see main text). Source data are available in Figure 5—source data 1. FA, false alarm; GP, guinea pig.
-
Figure 5—source data 1
Hit rates, false alarm rates, and d′ values of GPs and the feature-based model for the segment-length manipulation.
- https://cdn.elifesciences.org/articles/78278/elife-78278-fig5-data1-v2.xlsx
Figure 6
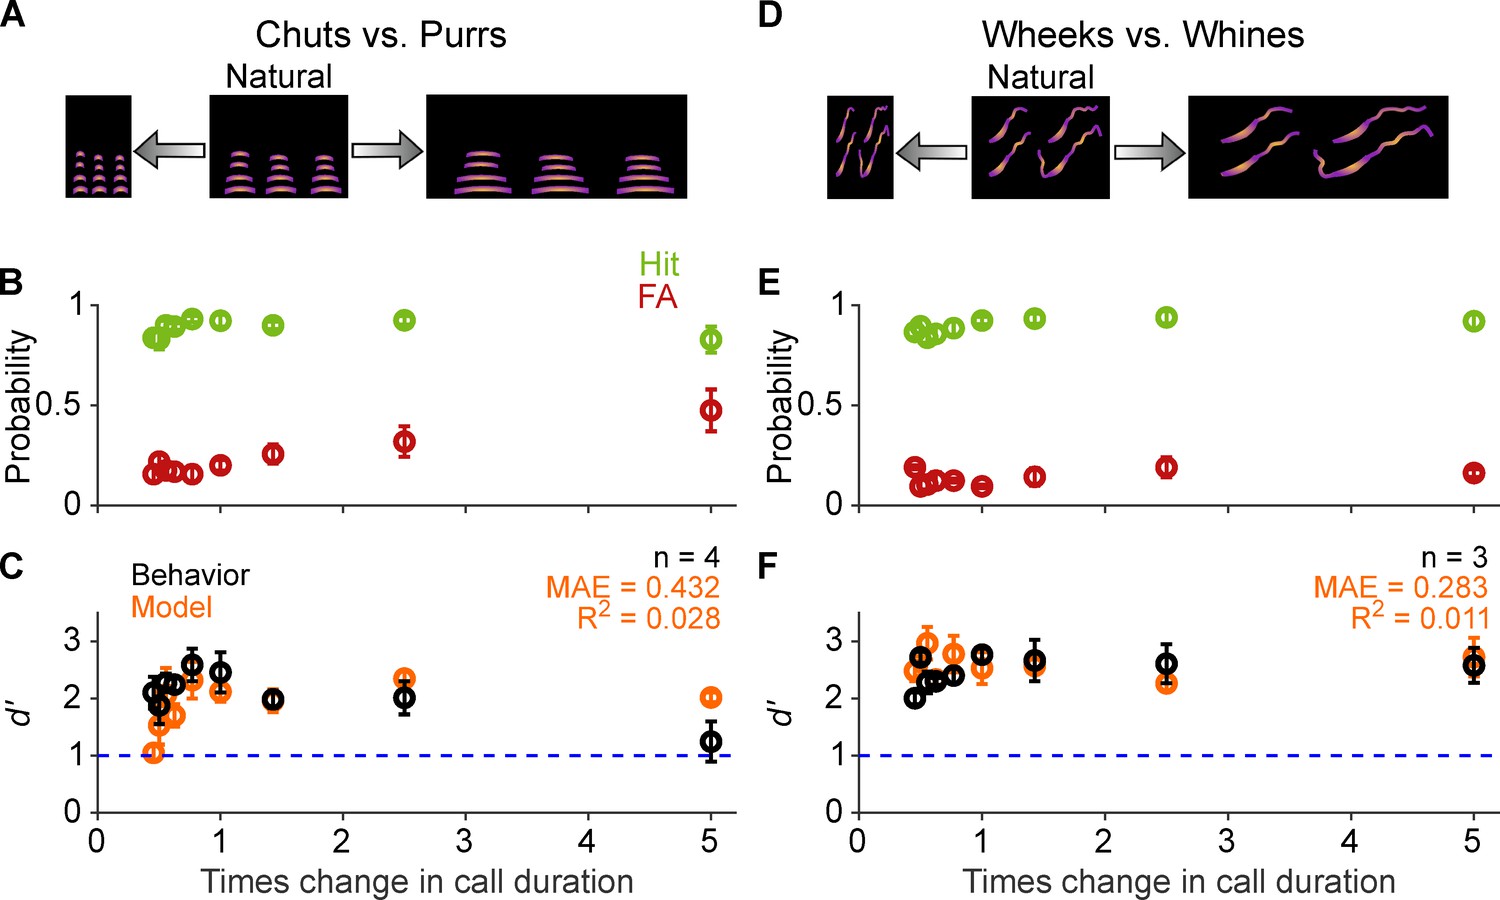
Call categorization is resistant to changes in tempo.
(A) and (D) Schematic showing changes to call tempo without affecting spectral content. (B) and (E) Average (n=4 GPs for chuts vs. purrs; n=3 GPs for wheeks vs. whines) hit rate (green) and false alarm rates (red) as a function of tempo change, expressed as times change in call duration (1 corresponds to the natural call). (C) and (F) Black points correspond to average GP d′; error bars correspond to s.e.m. Orange points correspond to average model d′ (n=5 model instantiations), error bars correspond to s.e.m. Dashed blue line denotes d′=1. The statistical significance of call duration value on behavior was evaluated using a generalized linear model (see main text). Source data are available in Figure 6—source data 1. FA, false alarm; GP, guinea pig.
-
Figure 6—source data 1
Hit rates, false alarm rates, and d′ values of GPs and the feature-based model for tempo-shifted vocalizations.
- https://cdn.elifesciences.org/articles/78278/elife-78278-fig6-data1-v2.xlsx
Figure 7
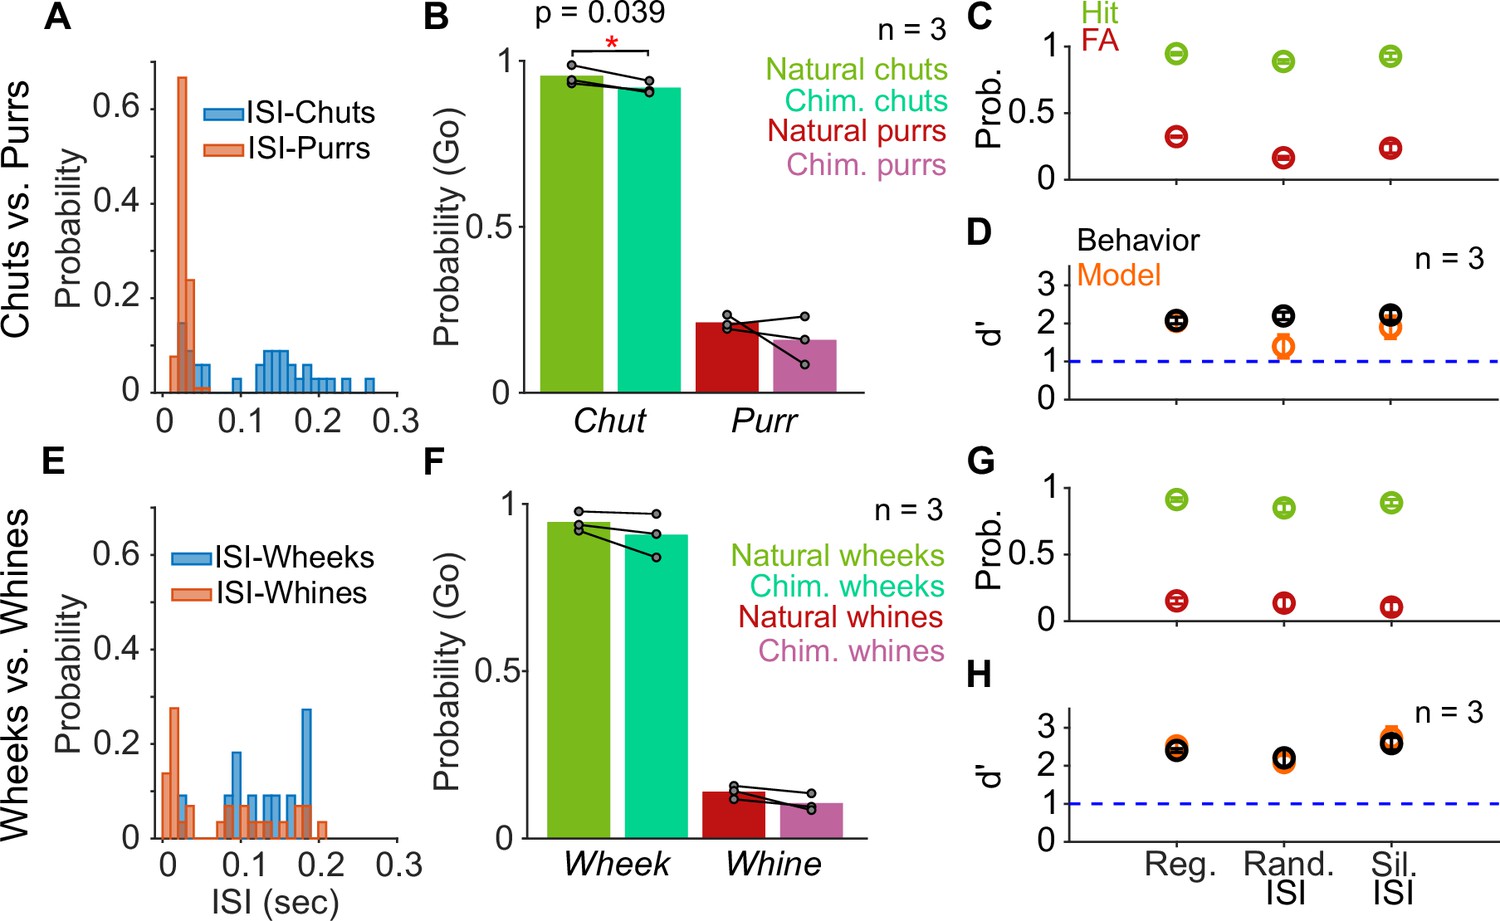
Call categorization is resistant to manipulations to the inter-syllable interval (ISI).
(A) and (E) Distribution of ISI lengths for the call types used in the categorization tasks. (B) and (F) Comparison of the Go rates for natural and chimeric calls. We compared Go rates rather than d′ because chimeric calls were presented in a catch-trial design (see main text and Materials and methods). Chim. refers to chimeric calls with one call’s syllables and the other call’s ISIs. For example, chimeric chuts have chut syllables and purr ISIs. Label on x-axis refers to syllable identity. (C) and (G) Comparison of hit (green) and FA (red) rates for regular calls, calls where we replaced ISI values with values drawn from the same calls’ ISI distributions, and calls where we replaced the ISI with silence (rather than background noise). (D) and (H) Comparison of GP (black; n=3 GPs) and model (orange; n=5 instantiations) d′ values across these manipulations. Error bars correspond to s.e.m. Source data are available in Figure 7—source data 1. FA, false alarm; GP, guinea pig.
-
Figure 7—source data 1
Hit rates, false alarm rates, and d′ values of GPs and the feature-based model for various ISI manipulations (silent ISI, random ISI, chimeric calls).
- https://cdn.elifesciences.org/articles/78278/elife-78278-fig7-data1-v2.xlsx
Figure 8
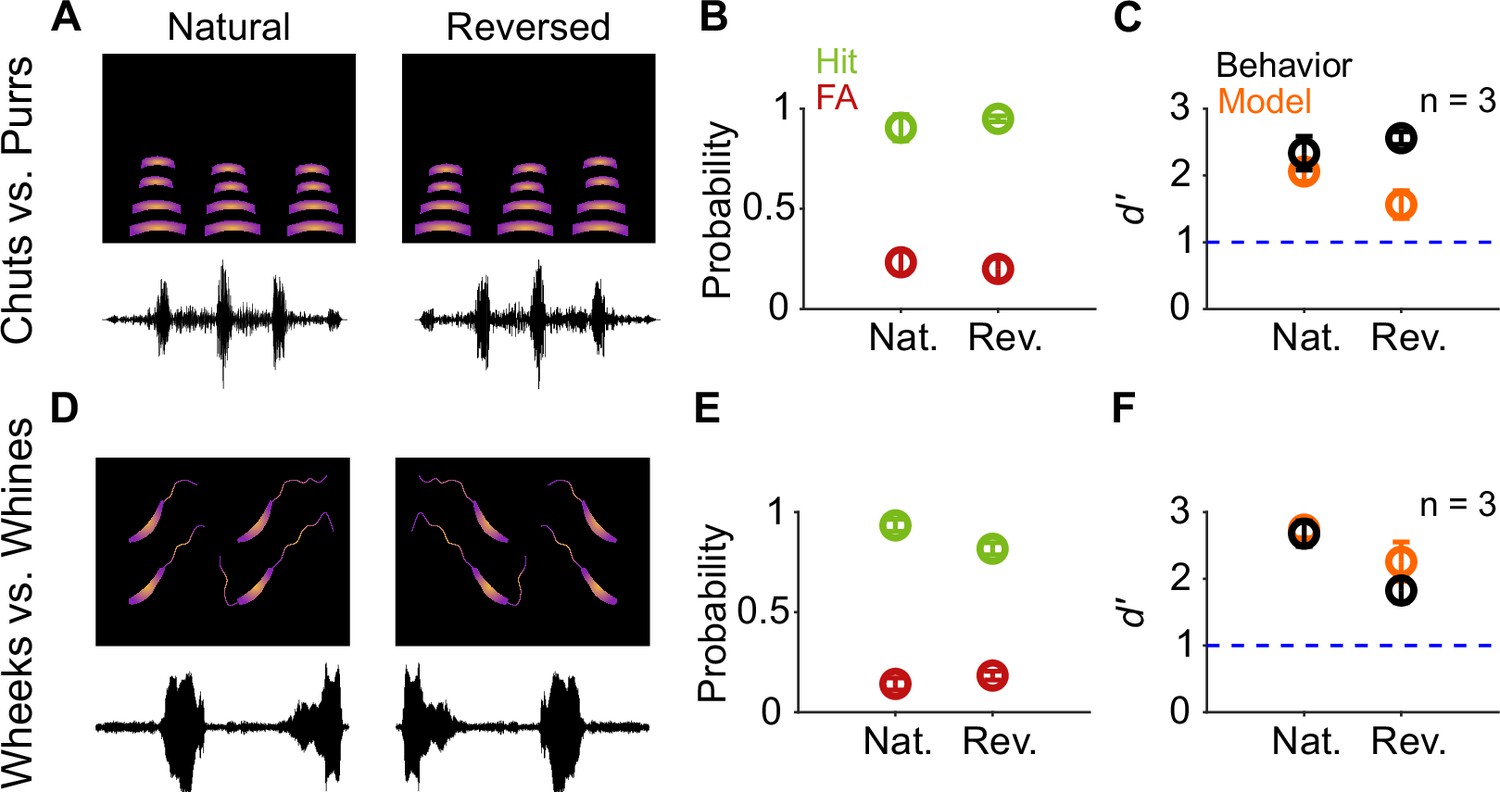
Call categorization is resistant to time-reversal.
(A) and (D) Schematics showing spectrogram and waveform of natural (left) and reversed (right) purr (A) and wheek (D) calls. (B) and (E) Average (n=3 GPs) hit rate (green) and FA rate (red) for natural and reversed calls. (C) and (F) Average performance of GPs (black; n=3 GPs) and model (orange; n=5 model instantiations) for natural and reversed calls. Error bars correspond to s.e.m. Source data are available in Figure 8—source data 1. FA, false alarm; GP, guinea pig.
-
Figure 8—source data 1
Hit rates, false alarm rates, and d′ values of GPs and the feature-based model for natural and reversed vocalizations.
- https://cdn.elifesciences.org/articles/78278/elife-78278-fig8-data1-v2.xlsx
Figure 9

Call categorization is sensitive to fundamental frequency (F0) shifts.
(A) and (D) Schematics showing spectrograms of natural calls (middle) and versions where the F0 has been decreased (left) or increased (right). (B) and (E) Average (n=4 GPs for chuts vs. purrs; n=3 GPs for wheeks vs. whines) hit rate (green) and FA rate (red) for F0-shifted calls Note that 0% change in F0 is the natural call, –50% change corresponds to shifting F0 one octave lower, and 100% change corresponds to shifting F0 one octave higher than the natural call. (C) and (F) Average performance of GPs (black) and model (orange; n=5 model instantiations) for natural and F0-shifted calls. Error bars correspond to s.e.m. The statistical significance of F0-shift value on behavior was evaluated using a generalized linear model (see main text). Source data are available in Figure 9—source data 1. FA, false alarm; GP, guinea pig.
-
Figure 9—source data 1
Hit rates, false alarm rates, and d′ values of GPs and the feature-based model for F0-shifted vocalizations.
- https://cdn.elifesciences.org/articles/78278/elife-78278-fig9-data1-v2.xlsx
Figure 10
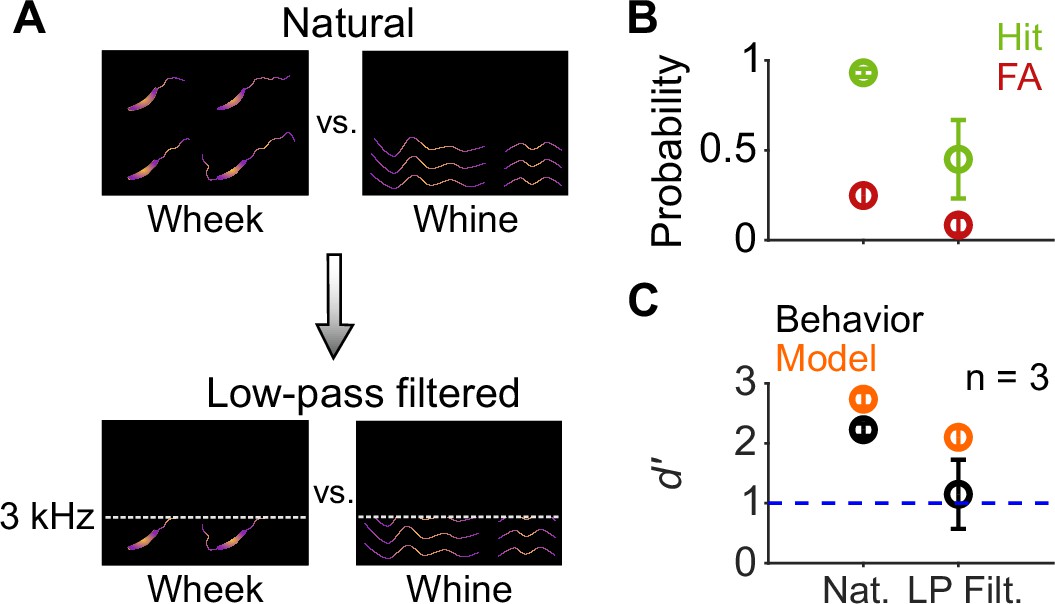
Call categorization is mildly affected by low-pass filtering.
(A) Schematic spectrograms of natural calls (top) and low-pass filtered (bottom) wheek and whine calls. (B) Average (n=3 GPs) hit rate (green) and FA rate (red) for natural and low-pass filtered (cutoff=3 kHz) calls. (C) Average performance of GPs (black) and model (orange; n=5 model instantiations) for natural and low-pass filtered calls. Error bars correspond to s.e.m. Source data are available in Figure 10—source data 1. FA, false alarm; GP, guinea pig.
-
Figure 10—source data 1
Hit rates, false alarm rates, and d′ values of GPs and the feature-based model for natural and low-pass filtered vocalizations.
- https://cdn.elifesciences.org/articles/78278/elife-78278-fig10-data1-v2.xlsx
Figure 11 with 2 supplements
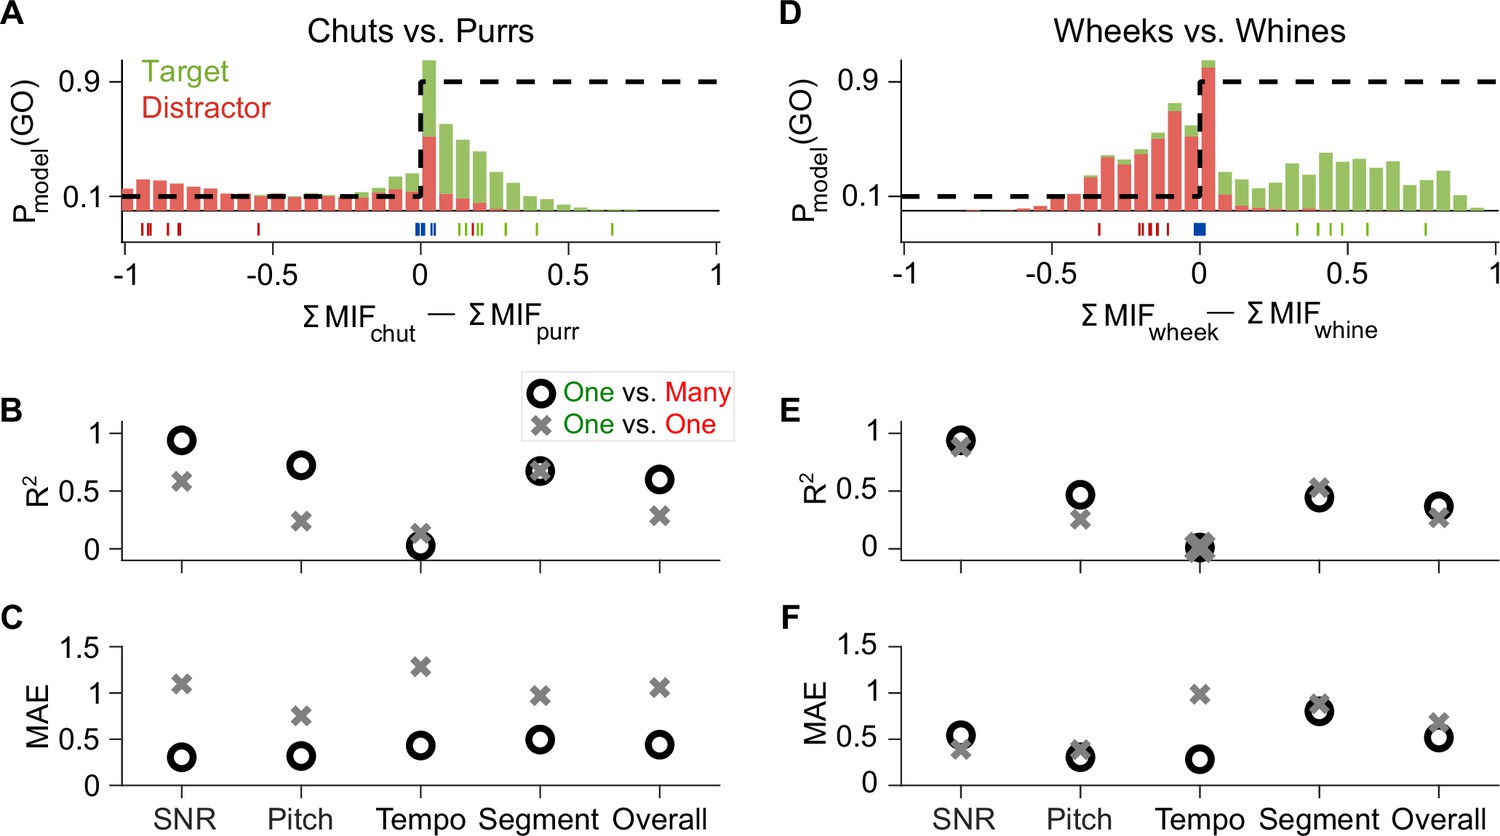
Feature-based model explains ~50% of the overall variance in GP behavior.
(A) Stacked distributions of the evidence for the presence of Go (green) and No-go (red) stimuli (across all manipulations for the chuts vs. purrs task), showing that the output is generally >0 for chuts (green; Go stimulus) and <0 for purrs (red; No-go stimulus). The evidence for easy tasks, such as generalizing to new natural chuts (green ticks) or purrs (red ticks), is typically well away from 0 (decision boundary). In contrast, the evidence for difficult tasks, such as the –18 dB SNR condition (blue ticks), falls near 0. Dashed black line corresponds to the winner-take-all output as a probability of reporting a Go response. (B, C) Compared to the model trained with the specific task performed by the GP (chuts vs. purrs; one vs. one), the model trained to classify each call type from all other call types (one vs. many) was more predictive of behavior as indicated by higher R2 (B) and lower MAE (C). (D–F) Same as (A–C) but for the wheeks versus whines task. The performance of an SVM classifier that uses the long-term spectrum to classify natural and manipulated calls is shown in Figure 11—figure supplement 1. The performance of a feature-based classifier, with feature duration constrained to 75 ms, is shown in Figure 11—figure supplement 2. GP, guinea pig; MAE, mean absolute error; SVM, support vector machine.
Figure 11—figure supplement 1
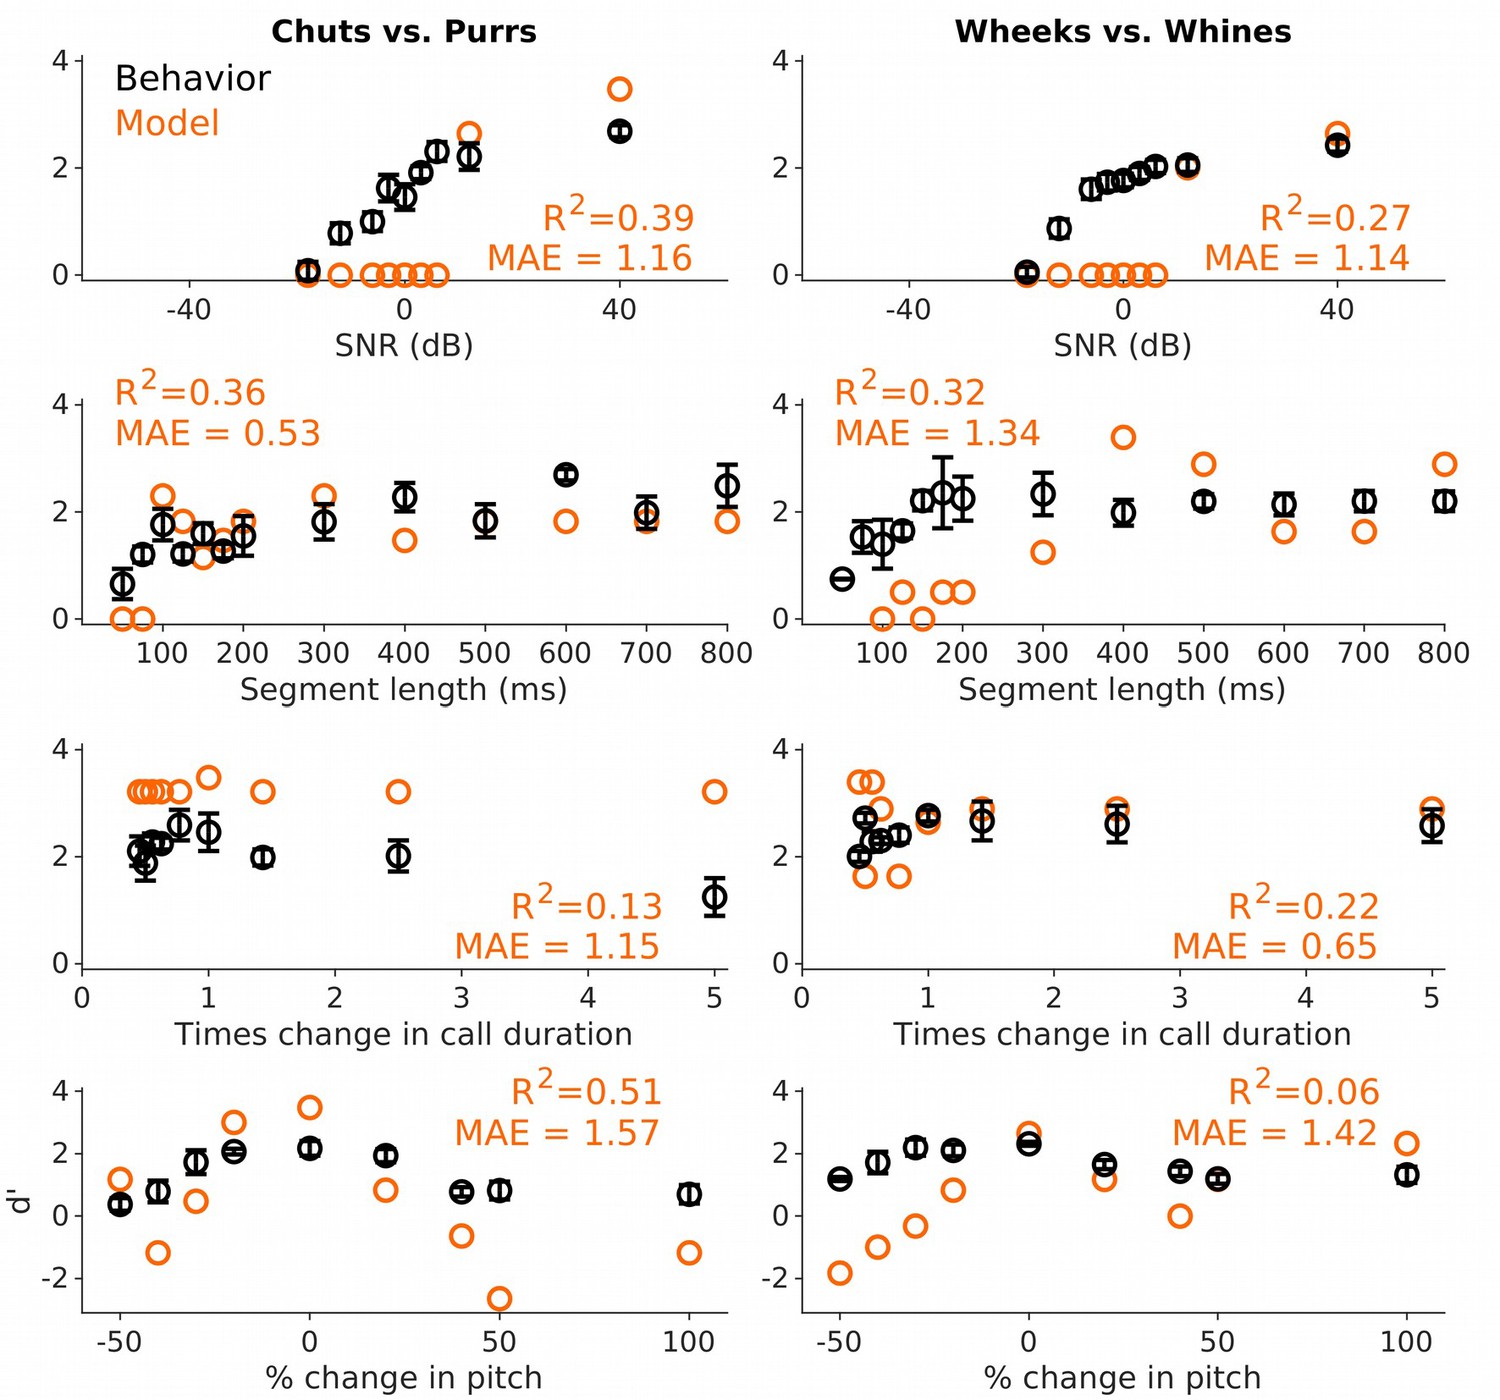
Performance of an SVM classifier on call categorization based on long-term spectrum.
An SVM classifier, trained to categorize calls from long-term spectrum alone, did not capture many aspects of GP behavior across the various stimulus manipulations. Black circles and lines correspond to GP behavioral performance (mean ± SEM). Behavioral data are reproduced from Figures 4—6 and Figure 9. Orange circles correspond to SVM performance. Left column corresponds to the chuts versus purrs task and right column corresponds to the wheeks versus whines task. GP, guinea pig; SVM, support vector machine.
Figure 11—figure supplement 2
Call categorization performance of a feature-based model with feature duration restricted to 75 ms.
Based on behavioral results from the segment length experiment, we re-trained a feature-based model with maximum feature duration restricted to 75 ms to classify calls. The restricted-MIF model outper formed the model described in the main manuscript.This result illustrates how future experimental data could be leveraged to generate additiona lconstraints for the feature-based categorization model. Black circles and lines correspond to GP behavioral performance (mean ± SEM). Behavioral data are reproduced from Figures 4—6 and Figure 9. Orange circles correspond to SVM performance. Left column corresponds to the chuts versus purrs task and right column corresponds to the wheeks versus whines task. GP, guinea pig; MIF, most informative feature; SVM, support vector machine.
Figure 12 with 1 supplement
Different subsets of MIFs are flexibly recruited to solve categorization tasks for different manipulations.
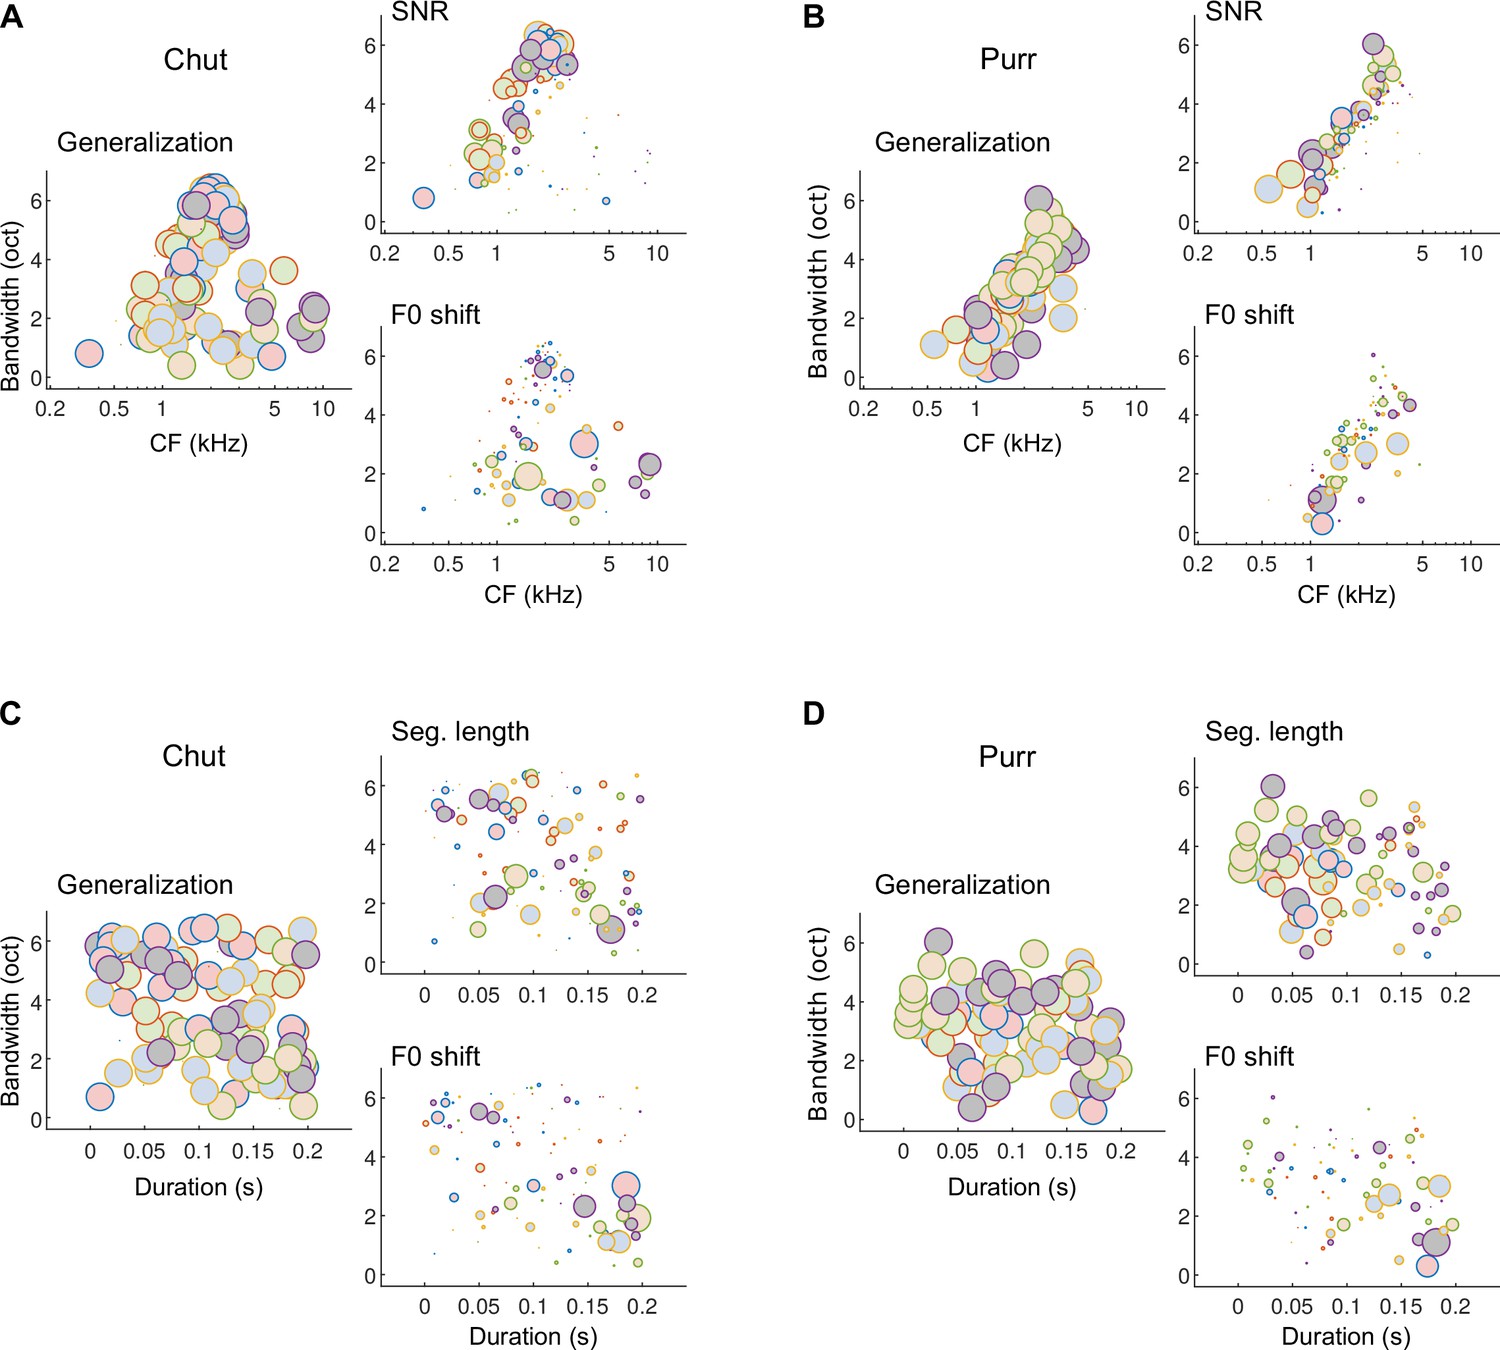
(A) We estimated the relative detection rate (i.e., the difference between the detection rate of a given MIF for all within-category and outside-category calls) of all MIFs (discs) for each behavioral paradigm (e.g., SNR). Colors denote different instantiations of the MIFs. Disc diameter is monotonically proportional to the relative detection rate, using a power-law relationship (fourth power) to highlight the most robust features. While MIFs of all center frequencies (CFs) and bandwidths were uniformly recruited for generalizing calls of chut call type, MIFs with lower CFs were preferentially selected for SNR conditions, likely because high-frequency chut features were masked by white noise. In contrast, MIFs with high CF were preferred by the model to solve the F0-shift task. (B) Similar results were obtained for purrs. (C) MIFs of all durations and bandwidths were uniformly recruited for generalizing calls of chut call type. In contrast, shorter duration MIFs were preferred for segment-length conditions whereas longer-duration MIFs were preferentially recruited for F0-shift conditions. (D) Results were similar for purrs. Source data are available in Figure 12—source data 1. Similar analyses for wheeks and whines are presented in Figure 12—figure supplement 1.
-
Figure 12—source data 1
Characteristics of most informative features (CF, bandwidth, and duration) and their relative detection rates for the various stimulus manipulations.
- https://cdn.elifesciences.org/articles/78278/elife-78278-fig12-data1-v2.xlsx
Figure 12—figure supplement 1
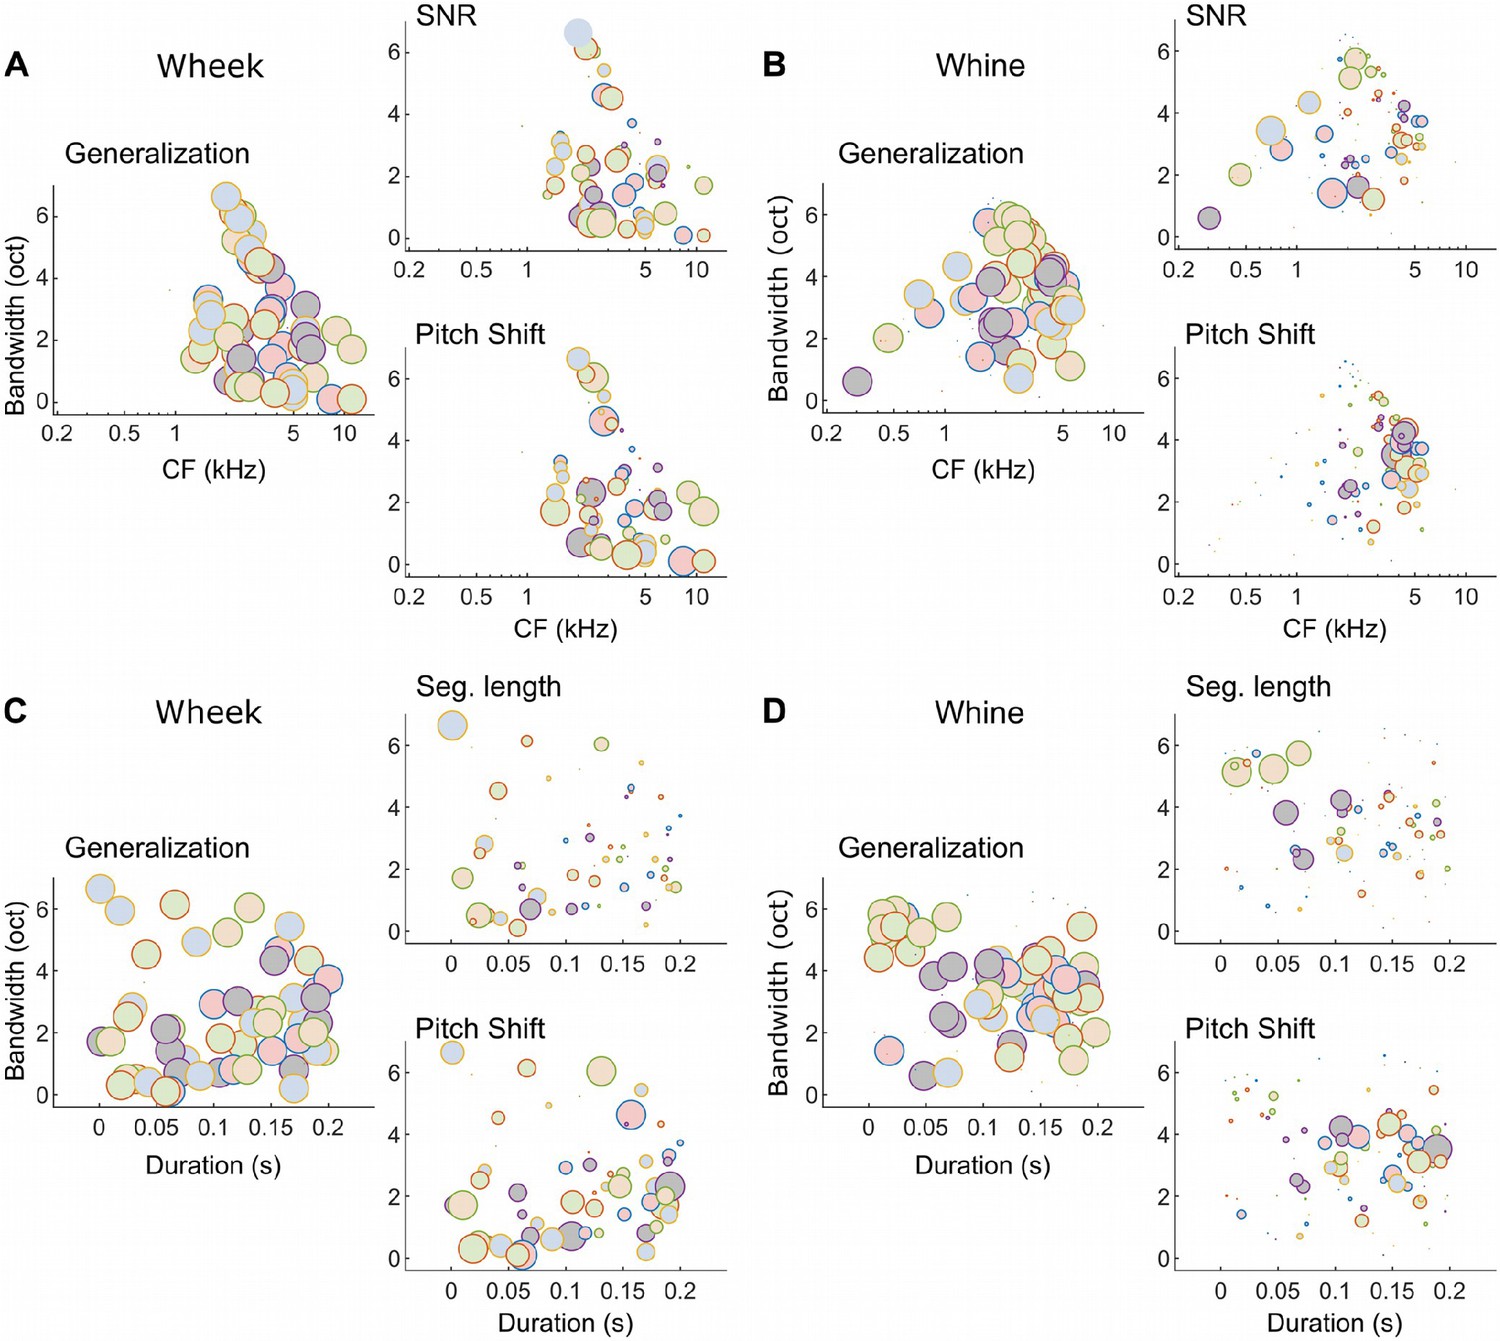
Different subsets of MIFs are flexibly recruited to solve categorization tasks for different manipulations (wheeks vs. whines).
(A, B) We estimated the relative detection rate (i.e., the difference between the detection rate of a given MIF for all target and all distractor calls) of all MIFs (discs) for each behavioral paradigm (e.g., SNR). Colors denote different instantiations of the MIFs. Disc diameter is monotonically proportional to the relative detection rate, using a power-law relationship (fourth power) to highlight the most robust features. While MIFs of all center frequencies (CFs) and bandwidths were uniformly recruited for generalizing calls of each call type, MIFs with lower CFs were preferentially selected for SNR conditions, likely because highfrequency features were masked by white noise. In contrast, MIFs with high CF were preferred by the model to solve the F0-shift task. These differences were especially apparent for whine calls. (C, D) MIFs of all durations and bandwidths were uniformly recruited for generalizing calls of each call type. In contrast, shorter duration MIFs were preferred for segment-length conditions whereas longer duration MIFs were preferentially recruited for F0-shift conditions. MIF, most informative feature; SNR, signal-to-noise ratio.
Tables
Table 1
Properties of MIFs.
| Call name | Instantiation | Number of MIFs | MIF duration (ms)(mean±std) | MIF bandwidth (octaves)(mean±std) |
|---|---|---|---|---|
| Chut | 1, 2, 3, 4, 5 | 20, 20, 20, 20, 20 | 88±63, 106±53, 108±56, 109±64, 133±47 | 4.0±2.0, 4.4±1.2, 3.1±1.9, 3.7±1.9, 2.6±1.8 |
| Purr | 1, 2, 3, 4, 5 | 8, 9, 20, 20, 20 | 91±49, 83±43, 116±49, 116±56, 86±63 | 2.6±1.2, 2.8±1.2, 3.1±1.4, 3.2±1.5, 3.6±1.2 |
| Wheek | 1, 2, 3, 4, 5 | 8, 14, 13, 11, 12 | 144±47, 99±58, 104±68, 116±62, 114±65 | 2.3±1.6, 2.6±1.8, 2.9±2.2, 2.1±1.1, 2.5±1.7 |
| Whine | 1, 2, 3, 4, 5 | 20, 20, 15, 20, 20 | 109±55, 111±68, 133±37, 117±51, 108±70 | 3.5±1.8, 3.4±1.6, 2.6±1.4, 3.2±1.5, 3.9±1.6 |
| Summary | 16.5±4.7 | 109±57 | 3.2±1.7 |
Additional files
-
Supplementary file 1
Statistical outputs of GLM model comparisons.
- https://cdn.elifesciences.org/articles/78278/elife-78278-supp1-v2.xlsx
-
Supplementary file 2
Statistical outputs of other tests used in the manuscript.
- https://cdn.elifesciences.org/articles/78278/elife-78278-supp2-v2.xlsx
-
Transparent reporting form
- https://cdn.elifesciences.org/articles/78278/elife-78278-transrepform1-v2.pdf
Download links
A two-part list of links to download the article, or parts of the article, in various formats.
Downloads (link to download the article as PDF)
Open citations (links to open the citations from this article in various online reference manager services)
Cite this article (links to download the citations from this article in formats compatible with various reference manager tools)
Vocalization categorization behavior explained by a feature-based auditory categorization model
eLife 11:e78278.
https://doi.org/10.7554/eLife.78278


