Microtubules restrict F-actin polymerization to the immune synapse via GEF-H1 to maintain polarity in lymphocytes
- Institut Curie, PSL Research University, INSERM U932, France
- Université de Paris, France
- Laboratoire P.A.S.T.E.U.R., Département de Chimie, École Normale Supérieure, PSL Research University, Sorbonne Université, CNRS, France
- Institut Pierre-Gilles de Gennes pour la Microfluidique, France
Figures
Figure 1 with 1 supplement
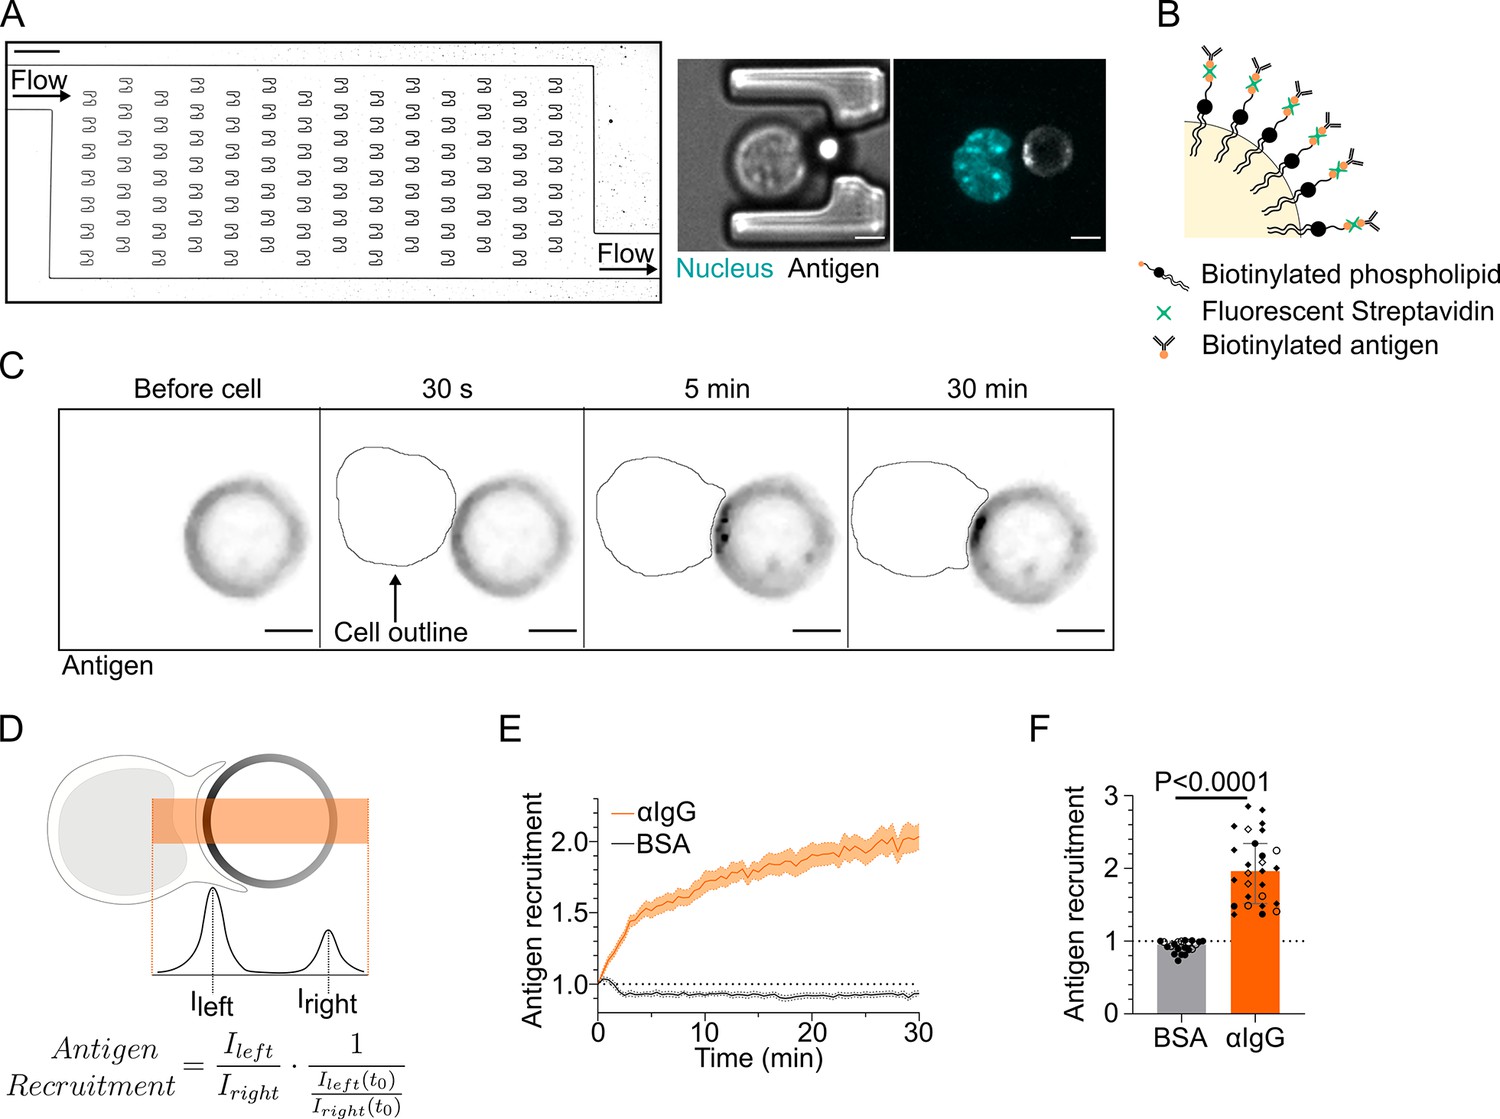
Microfluidic system to study dynamics of B lymphocyte polarization and immune synapse formation.
(A) Transmission image of a chamber of the microfluidic chip containing the traps. Scale bar 100 µm. Inset: cell–droplet doublet in a microfluidic trap. Bright-field image and fluorescence image (nucleus: cyan; antigen: gray). Scale bar 5 µm. (B) Schematic representation of the surface of an oil droplet used for antigen presentation. (C) Time-lapse images of antigen recruitment on a F(ab′)2αIgG-coated droplet (acting as an antigen). Scale bar 5 µm. (D) Schematic representation of the quantification of antigen recruitment at the immune synapse. (E) Quantification over time of recruitment on BSA-coated (negative control) or αIgG-coated droplets at the immune synapse (median ± IQR) and (F) plateau of antigen recruitment (average value 25–30 min) on BSA- or αIgG-coated droplets (mean ± SEM, BSA N = 14;7, αIgG N = 4;15;4;4, pooled from >2 independent experiments, Mann–Whitney test).
-
Figure 1—source data 1
Data tables related to graphs in Figure 1.
- https://cdn.elifesciences.org/articles/78330/elife-78330-fig1-data1-v2.zip
Figure 1—figure supplement 1
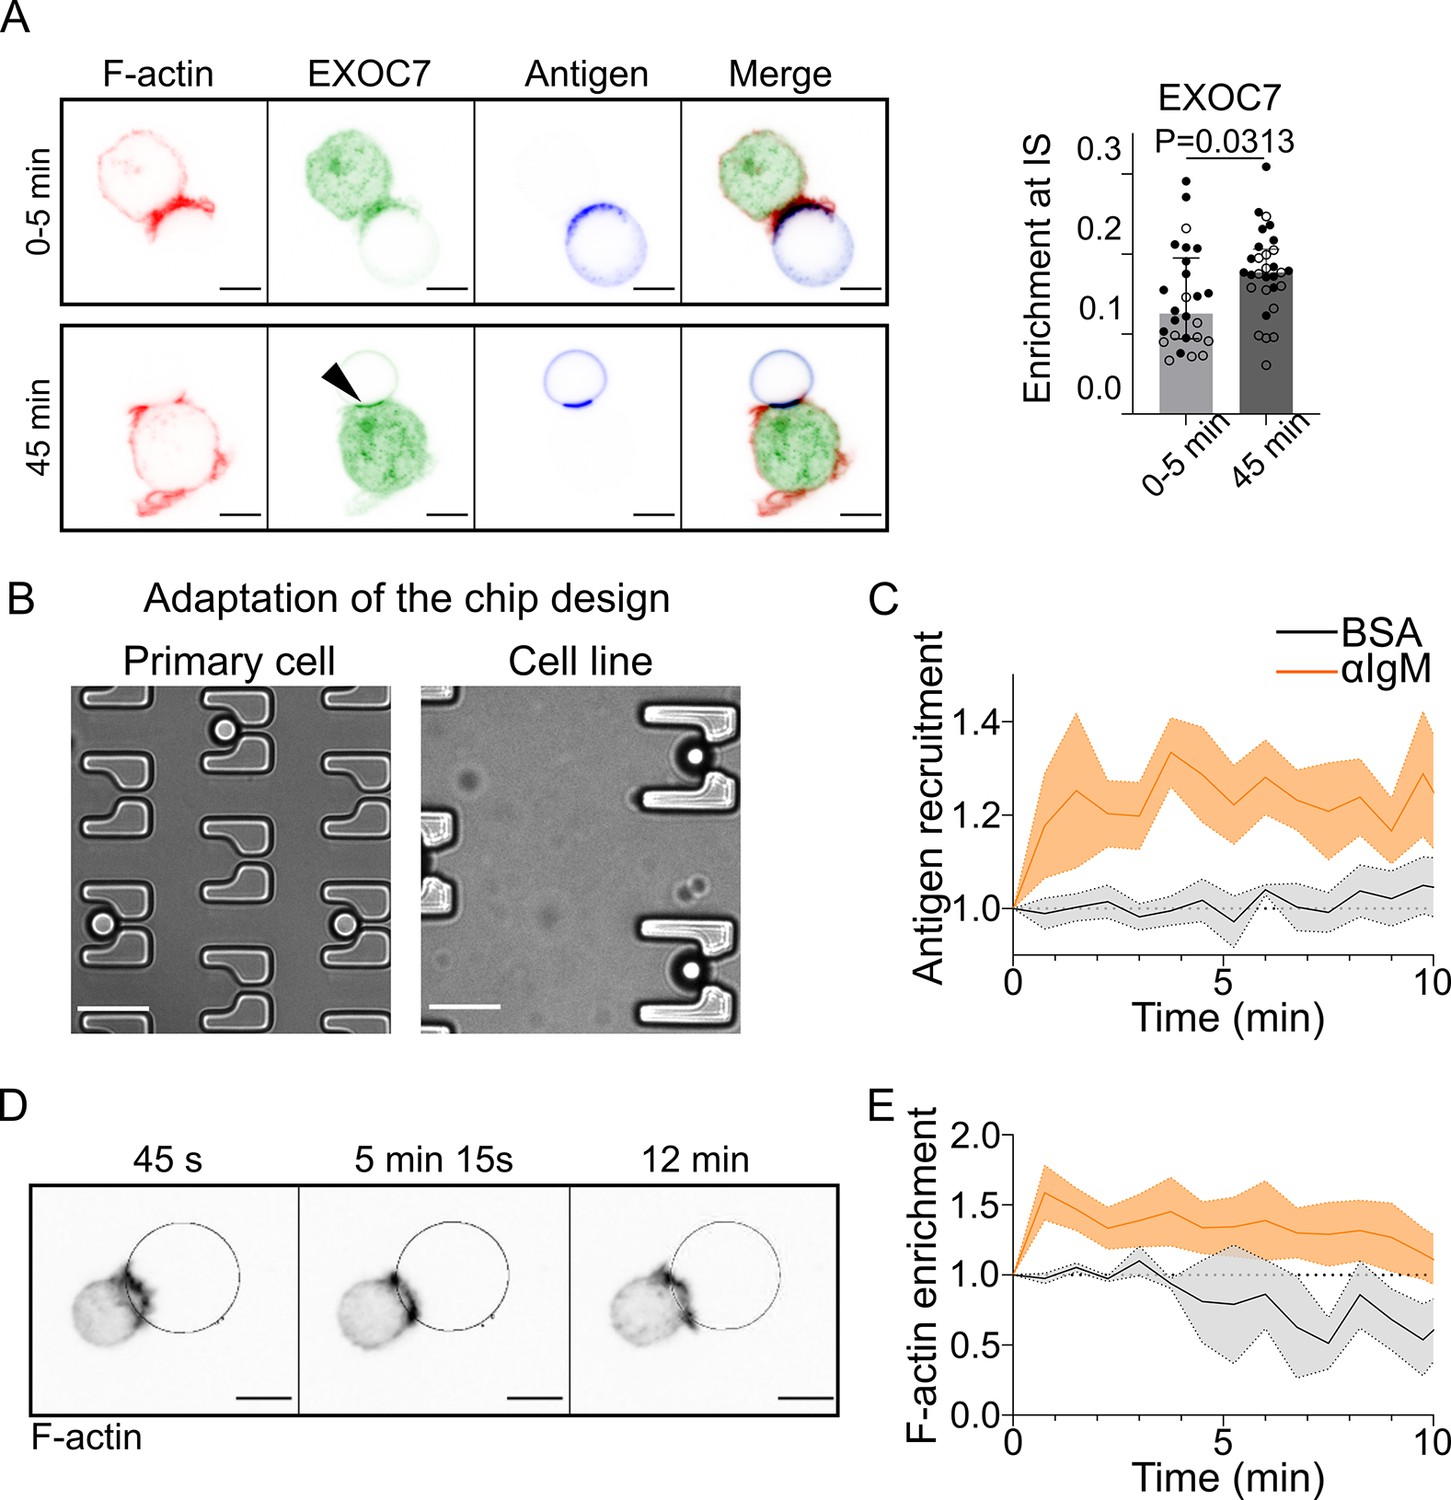
Microfluidic traps and antigen-coated droplets allow the study of the B cell immune synapse in cell lines and primary B cells.
(A) Immunofluorescence of IIA1.6 cells in contact with in contact with a F(ab′)2αIgG-coated droplet for 0–5 min or 45 min, stained for EXOC7 and F-actin (phalloidin), antigen visible on the droplet, imaged by laser scanning confocal microscopy (LSCM). Illustration is projection of six planes around the immune synapse (δz = 0.34 µm). Scale bar 5 µm. Graph: enrichment of EXOC7 at the immune synapse. Over the six planes, quantification of intensity within 1 µm of the droplet, divided by the intensity within the whole cell (median ± IQR, 0–5 min N = 16;10, 45 min N = 15;15, two independent experiments, Mann–Whitney test). (B) Transmission image of traps of the chip designed to be adapted to the size of primary B lymphocytes. As a comparison, transmission image of the traps used for the IIA1.6 cell line. Scale bar 20 µm. (C) Quantification over time of recruitment on BSA-coated (negative control) or αIgM-coated droplets at the immune synapse by a primary B lymphocyte, from 3D SDCM images, quantified as described in Figure 1 (mean ± SEM, BSA N = 5;2, αIgM = 8;6, two independent experiments). (D) Time-lapse images of a LifeAct-GFP primary B cell, in contact with an antigen-coated droplet (outline in blue) imaged by 3D SDCM, projection shown. Scale bar 5 µm. (E) Quantification over time of enrichment in F-actin (visualized with LifeAct-GFP) within 2 µm of the droplet, as compared to the total intensity, for primary B cell in contact with a BSA-coated (negative control) or αIgM-coated droplet, from 3D SDCM images (mean ± SEM, BSA N = 1;2, αIgM = 9;8, two independent experiments).
-
Figure 1—figure supplement 1—source data 1
Data tables related to graphs in Figure 1—figure supplement 1.
- https://cdn.elifesciences.org/articles/78330/elife-78330-fig1-figsupp1-data1-v2.zip
Figure 2 with 1 supplement
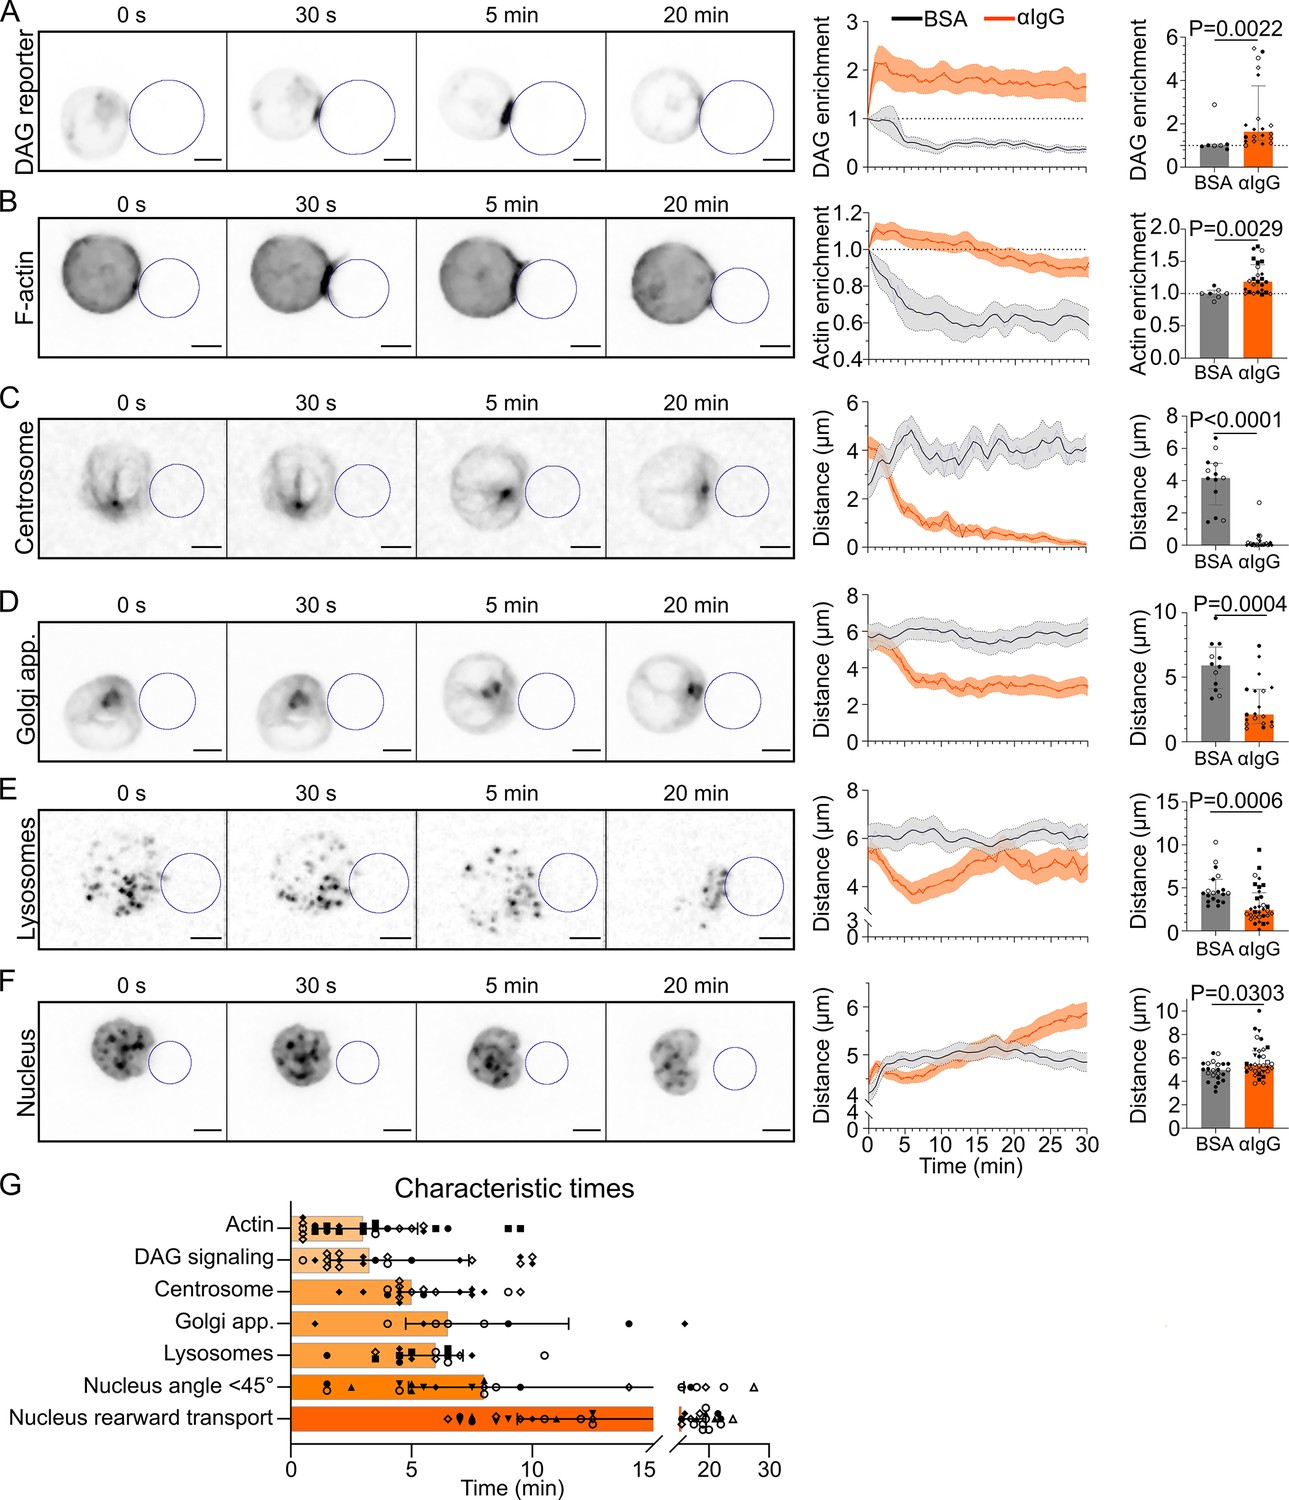
Timescales of B lymphocyte polarization.
All images in this figure are from 3D SDCM time-lapse imaging of IIA1.6 cells in contact with an antigen-coated droplet (outlined in blue). Analyses were done in 3D. (A) Time-lapse images of a IIA1.6 cell expressing a diacylglycerol (DAG) reporter (C1δ-GFP), in contact with an antigen-coated droplet. Enrichment in time of DAG reporter, defined as the intensity within 1 µm of the droplet, normalized by this value at t0 (mean ± SEM). Maximum enrichment (0–10 min) (median ± IQR, pooled from >2 independent experiments, BSA: N = 4;3, αIgG: N = 2;2;7;9, Mann–Whitney test). (B) Time-lapse images of a IIA1.6 cell expressing F-tractin-tdTomato, in contact with an antigen-coated droplet. Enrichment in time of F-actin defined as the intensity within 2 µm of the droplet divided by the intensity in the whole cell, and normalized by this value at t0, for BSA- or αIgG-coated droplets (mean ± SEM). Maximum enrichment (0–10 min) (median ± IQR, pooled from >2 independent experiments, BSA: N = 2;5, αIgG: N = 4;2;3;6;10, Mann–Whitney test). (C) Time-lapse images of a IIA1.6 cell stained with SiRTubulin to visualize the centrosome, in contact with an antigen-coated droplet. Distance over time between the centrosome and droplet surface for BSA- or αIgG-coated droplets (mean ± SEM). Average plateau distance (25–30 min) (median ± IQR, pooled from >2 independent experiments, BSA: N = 8;5, αIgG: N = 2;3;12;8, Mann–Whitney test). (D) Time-lapse images of a IIA1.6 cell expressing Rab6-mCherry to visualize the Golgi apparatus, in contact with an antigen-coated droplet. Distance over time between the Golgi body and droplet surface for BSA- or αIgG-coated droplets (mean ± SEM). Average plateau distance (25–30 min) (median ± IQR, pooled from >2 independent experiments, BSA: N = 9;3, αIgG: N = 4;1;8;6, Mann–Whitney test). (E) Time-lapse images of a IIA1.6 cell stained with LysoTracker to visualize lysosomes, in contact with an antigen-coated droplet. Average distance over time between lysosomes and droplet surface for BSA- or αIgG-coated droplets (mean ± SEM). Minimum distance (3–10 min) (median ± IQR, pooled from >2 independent experiments, BSA: N = 13;6, αIgG: N = 3;5;10;5;9, Mann–Whitney test). (F) Time-lapse images of a IIA1.6 cell stained with Hoechst to visualize the nucleus, in contact with an antigen-coated droplet. Nucleus–droplet distance in time (mean ± SEM). Average distance in the final state (25–30 min) (median ± IQR, pooled from >2 independent experiments, BSA: N = 14;9, αIgG: N = 5;10;2;7;5;1;4, Mann–Whitney test). (G) Characteristic times of polarization events, extracted from the data of (A–F) and Figure 3. NDAG = 2;2;7;9, NActin = 4;2;3;6;10, NCentrosome = 2;2;8;5, NGolgi = 2;4;3, NLyso = 2;3;3;4;6, NNuc angle = 3;7;1;3;4;1;3, NNuc transport = 5;10;2;7;5;1;4. Scale bar 5 µm.
-
Figure 2—source data 1
Data tables related to graphs in Figure 2.
- https://cdn.elifesciences.org/articles/78330/elife-78330-fig2-data1-v2.zip
Figure 2—figure supplement 1
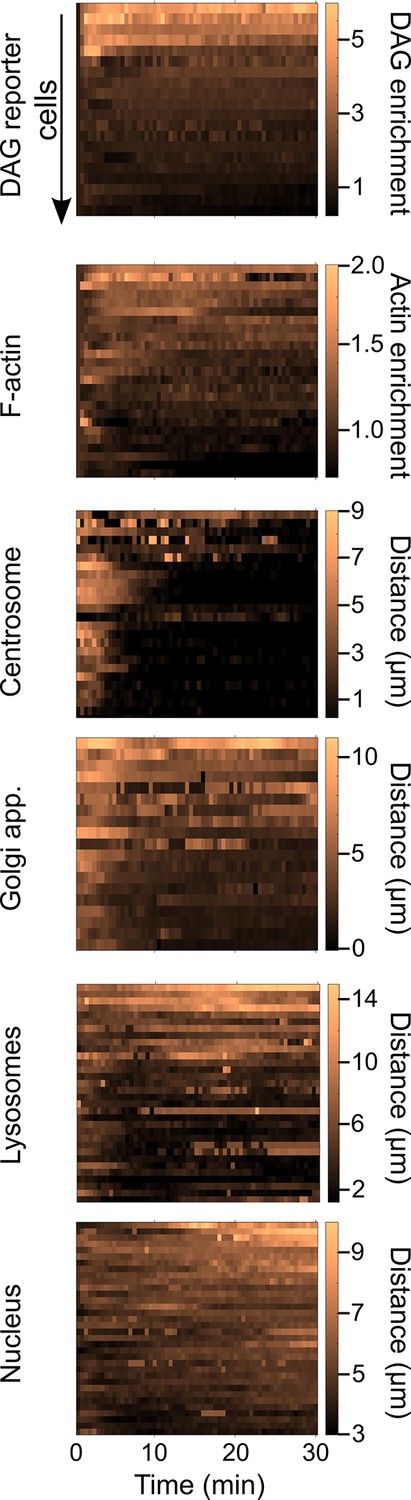
Single-cell kinetics of markers of B lymphocyte polarization.
For each marker analyzed in Figure 2 (diacylglycerol [DAG] enrichment, F-actin enrichment, centrosome, Golgi apparatus, lysosomes, and nucleus distance to the immune synapse), data presented as the signal for each individual cell (1 cell = 1 line) in time, color-encoded.
Figure 3
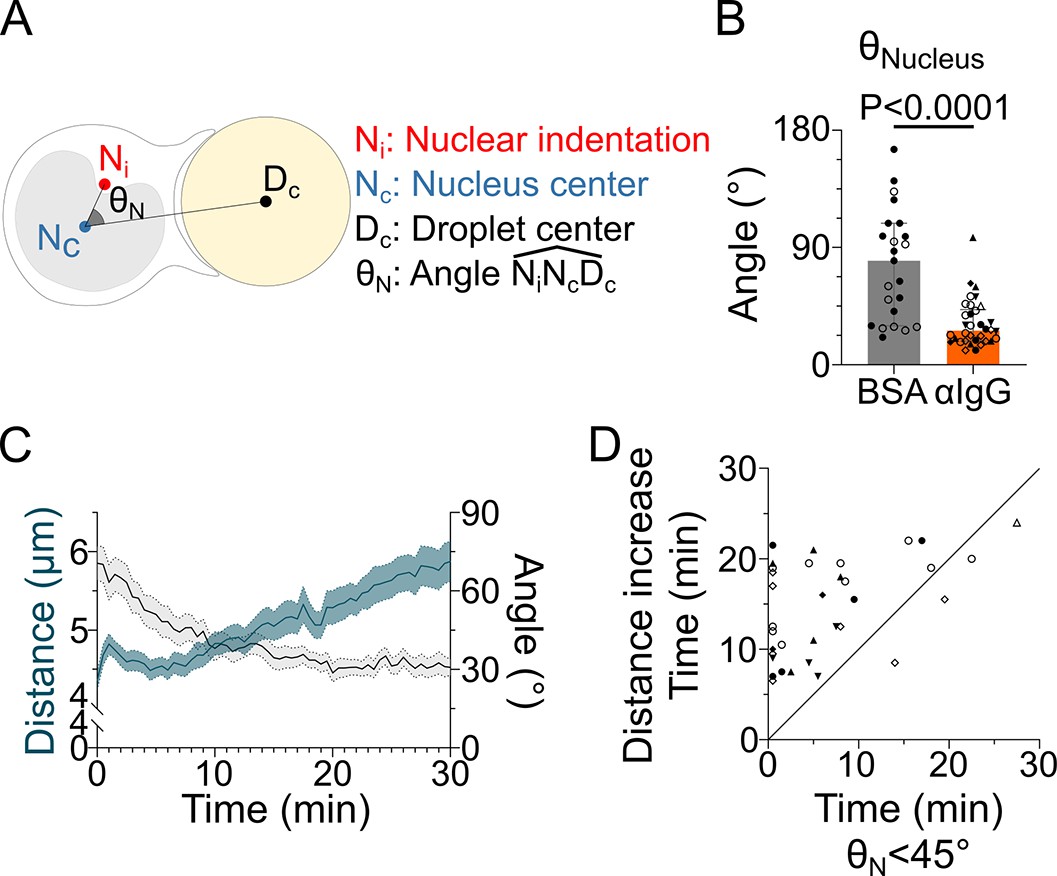
The nucleus undergoes a rotation followed by rearward transport.
Analyses were performed on movies obtained from 3D SDCM time-lapse imaging of IIA1.6 cells stained with Hoechst, in contact with a F(ab′)2αIgG- or BSA-coated droplet. (A) Schematic defining the angle measured to assess nucleus orientation (analysis was done in 3D). The indentation was detected based on local curvature. (B) Average angle in the final state (25–30 min) (pooled from >2 independent experiments, median ± IQR, BSA N = 14;9, αIgG N = 5;10;2;7;5;1;4, Mann–Whitney test). (C) Overlay of nucleus–droplet distance and over time for cells in contact with αIgG-coated droplets and (D) time for which the cell reaches (invagination oriented toward the immune synapse), and time of last local minima of nucleus–droplet distance (time after which the nucleus is only transported to the rear) (same data as in B). Line at Y = X.
-
Figure 3—source data 1
Data tables related to graphs in Figure 3.
- https://cdn.elifesciences.org/articles/78330/elife-78330-fig3-data1-v2.zip
Figure 4 with 1 supplement

F-actin is essential for antigen recruitment and signaling amplification, but not for the establishment of the polarity axis.
Experiments for this figure were performed using IIA1.6 cells, stained with SiRTubulin and Hoechst to visualize the centrosome and the nucleus, in contact with a F(ab′)2αIgG-coated droplet, imaged with SDCM 3D and quantified in 3D. Cells were pretreated for 1 hr either with DMSO or with latrunculin A 2 µM, kept in solution during the experiment. (A) Plateau of antigen recruitment (average values 25–30 min). Line at antigen recruitment = 1 (uniform fluorescence on the droplet). Median ± IQR, DMSO N = 7;10, LatA N = 6;18, two independent experiments, Mann–Whitney test (quantification: see Figure 1D). (B) Maximum diacylglycerol (DAG) enrichment (in 0–10 min). Median ± IQR, DMSO N = 1;5;4, LatA N = 2;5;2, three independent experiments, Mann–Whitney test (quantification: see Figure 2A). (C) Time-lapse images of untreated (DMSO) or LatA-treated cells, centrosome in red, nucleus in blue, and antigen in gray. Scale bar 5 µm. Right: angle between the cell–droplet axis and the cell–nucleus invagination (blue) or cell–centrosome (red) axis in time (quantification: see Figure 3A). (D) Nucleus–droplet distance over time. Mean ± SEM, DMSO N = 7;10, LatA N = 15;17, two independent experiments. (E) Average centrosome–droplet distance (25–30 min). Median ± IQR, DMSO N = 6;10, LatA N = 11;17, two independent experiments, Mann–Whitney test. (F) Time of centrosome polarization (threshold distance <2 µm). Median ± IQR, DMSO N = 4;6, LatA N = 4;5, two independent experiments, Mann–Whitney test. (G) Nucleus orientation and centrosome orientation (quantification: see Figure 3A) during the first 15 min, for DMSO-treated cells. N = 6;10 cells, one image every 30 s, two independent experiments. Nonparametric Spearman correlation between nucleus–centrosome pairs of data, average correlation 0.93, confidence interval: 0.86–0.97.
-
Figure 4—source data 1
Data tables related to graphs in Figure 4.
- https://cdn.elifesciences.org/articles/78330/elife-78330-fig4-data1-v2.zip
Figure 4—figure supplement 1
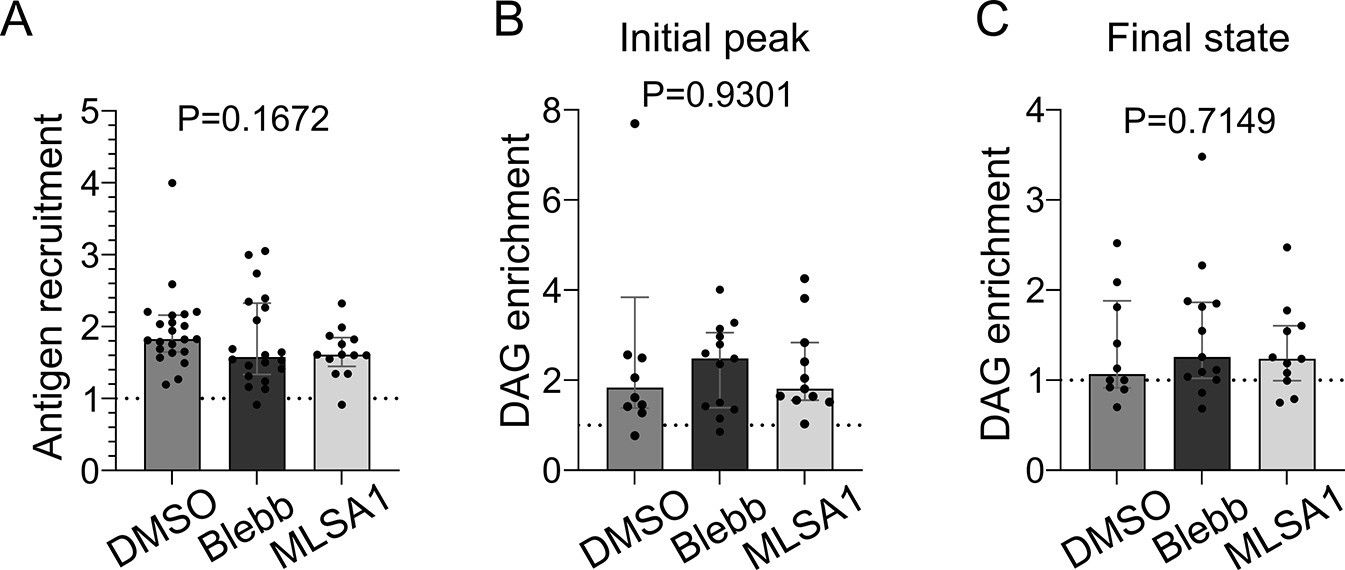
Myosin II merely regulates antigen recruitment and diacylglycerol (DAG) signaling.
(A) Plateau of antigen recruitment (average 25–30 min) (median ± IQR, DMSO N = 22, p-nBlebb 20 µM N = 20, MLSA1 1 µM N = 13, two independent experiments, Kruskal–Wallis test). (B) Maximum (in 0–20 min) and (C) average final (25–30 min) DAG reporter enrichment (median ± IQR, DMSO N = 10, p-nBlebb 20 µM N = 13, MLSA1 1 µM N = 11, two independent experiments, Kruskal–Wallis test).
-
Figure 4—figure supplement 1—source data 1
Data tables related to graphs in Figure 4—figure supplement 1.
- https://cdn.elifesciences.org/articles/78330/elife-78330-fig4-figsupp1-data1-v2.zip
Figure 5
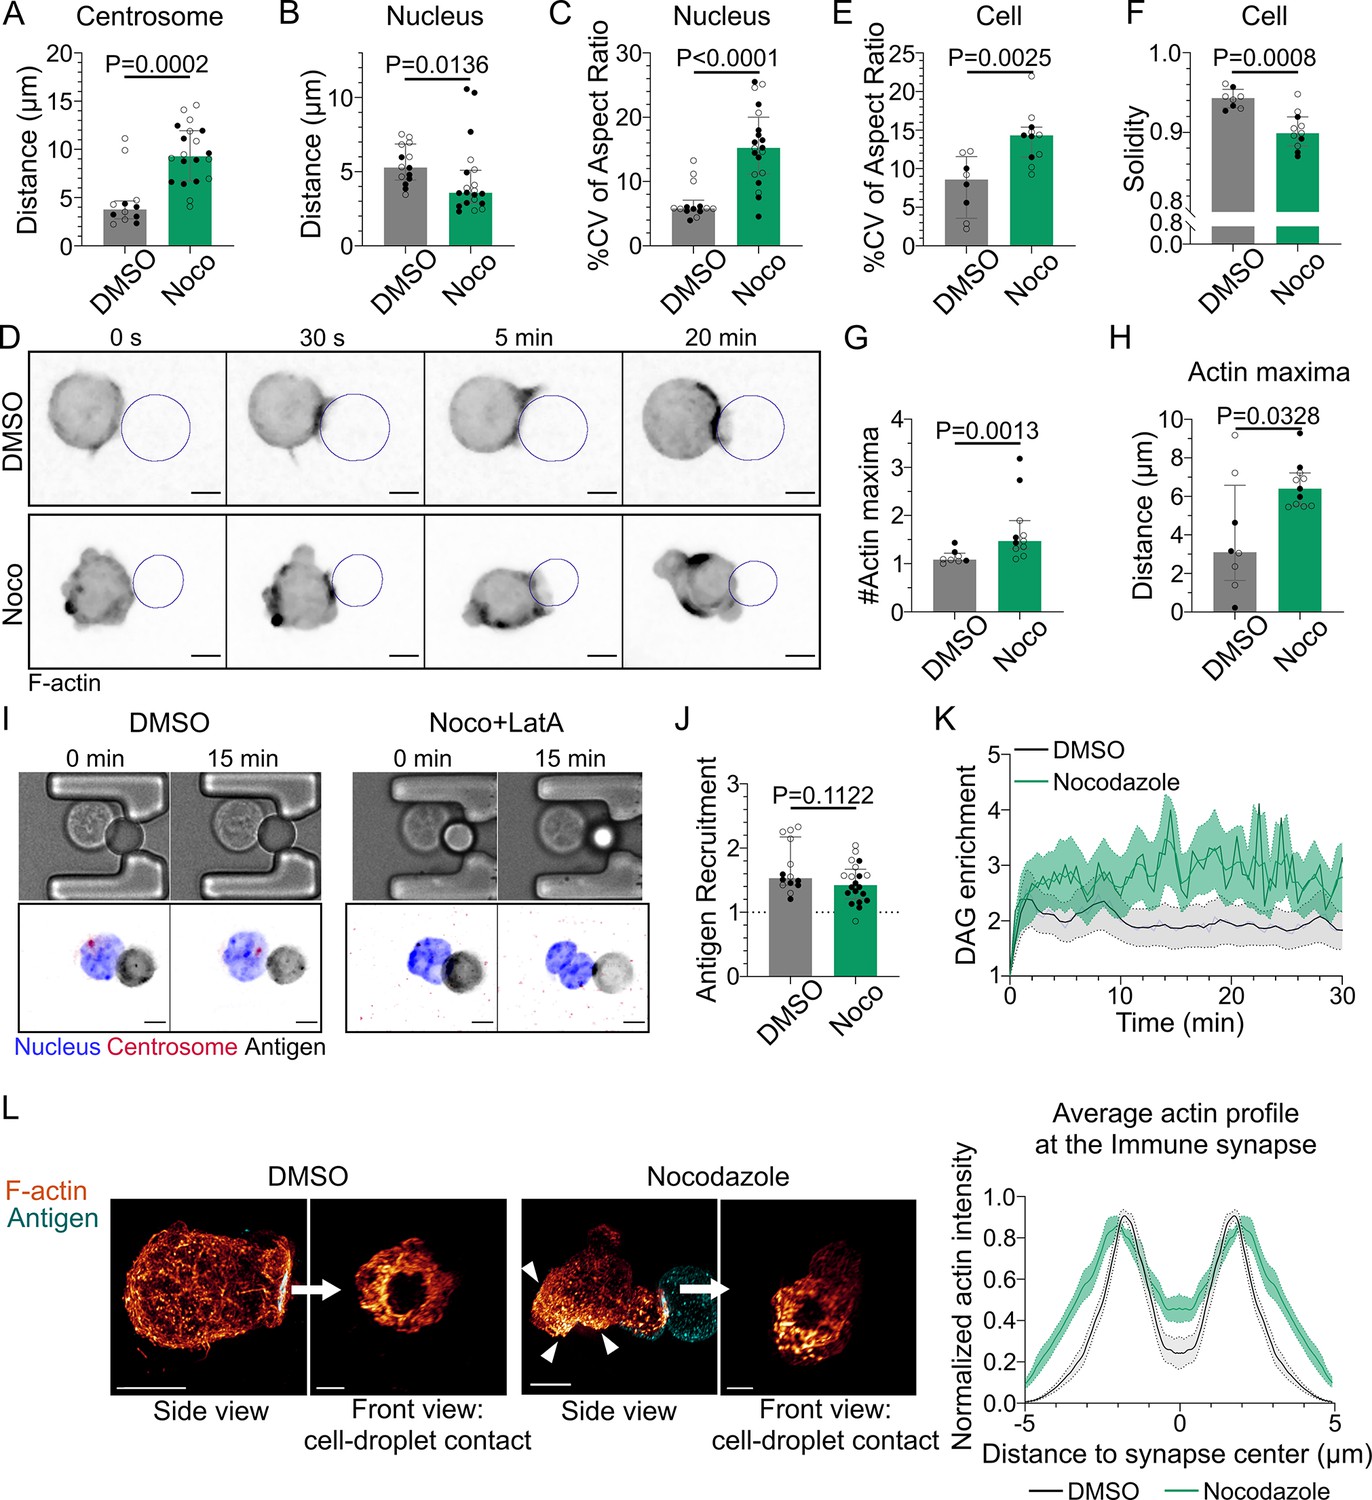
Microtubule disruption leads to intense cell and nucleus deformation, and impairs the establishment and maintenance of a polarized organization.
Experiments for this figure were performed using IIA1.6 cells in contact with a F(ab′)2αIgG-coated droplet, and 3D SDCM time-lapse imaging. Cells were pretreated for 1 hr either with DMSO or with nocodazole 5 µM, kept in solution during the experiment. (A) Average centrosome–droplet distance (25–30 min) (median ± IQR, DMSO N = 5;7, Noco N = 9;11, two independent experiments, Mann–Whitney test). Measured in 3D using eGFP-Centrin1-expressing cells. (B) Average nucleus–droplet distance (25–30 min), measured in 3D, and (C) % coefficient of variation of 2D aspect ratio of individual nuclei over time, measured on maximum z-projections of 3D movies (median ± IQR, DMSO N = 6;8, Noco N = 12;8, two independent experiments, Mann–Whitney test). Staining: Hoechst. (D) Time-lapse images of F-tractin-tdTomato-expressing cells treated with DMSO or nocodazole, droplet outlined in blue. Scale bar 5 µm. (E) % coefficient of variation of 2D aspect ratio of individual cells over time and (F) median 2D solidity of individual cells (median ± IQR, DMSO N = 3;5, Noco N = 4;7, two independent experiments, Mann–Whitney test). Measured using a mask of F-tractin-tdTomato on maximum z-projections of 3D movies. (G) Average number of F-actin maxima detected per cell over time and (H) average distance of maxima to the droplet surface (median ± IQR, DMSO N = 3;5, Noco N = 4;7, two independent experiments, Mann–Whitney test). Measured on maximum z-projections of 3D movies. (I) Example images of untreated (DMSO) or treated (Noco 5 µM + LatA 2 µM) cells, bright-field and fluorescence (eGFP-Cent1, Hoechst, antigen). Scale bar 5 µm. (J) Plateau of antigen recruitment on the droplet (average values 25–30 min) (median ± IQR, DMSO N = 6;8, Noco N = 12;8, two independent experiments, Mann–Whitney test) (quantification: see Figure 1D). (K) Diacylglycerol (DAG) enrichment over time (mean ± SEM, DMSO N = 6;7, Noco N = 4;6, two independent experiments). Measured using cells expressing the DAG reporter (C1δ-GFP) (quantification: see Figure 2A). (L) Left: examples of 3D SIM immunofluorescence imaging of F-actin (phalloidin staining) and antigen on the droplet after 15–20 min of immune synapse formation. White arrowheads: sites of actin enrichment outside of the immune synapse. Side view: scale bar 5 µm. Front view: scale bar 2 µm. MIP visualization. Right: profiles of F-actin at the immune synapse, from symmetric radial scans of the immune synapse, normalized to the maxima (mean ± SEM, one representative experiment, DMSO N = 12, Noco N = 8).
-
Figure 5—source data 1
Data tables related to graphs in Figure 5.
- https://cdn.elifesciences.org/articles/78330/elife-78330-fig5-data1-v2.zip
Figure 6 with 2 supplements
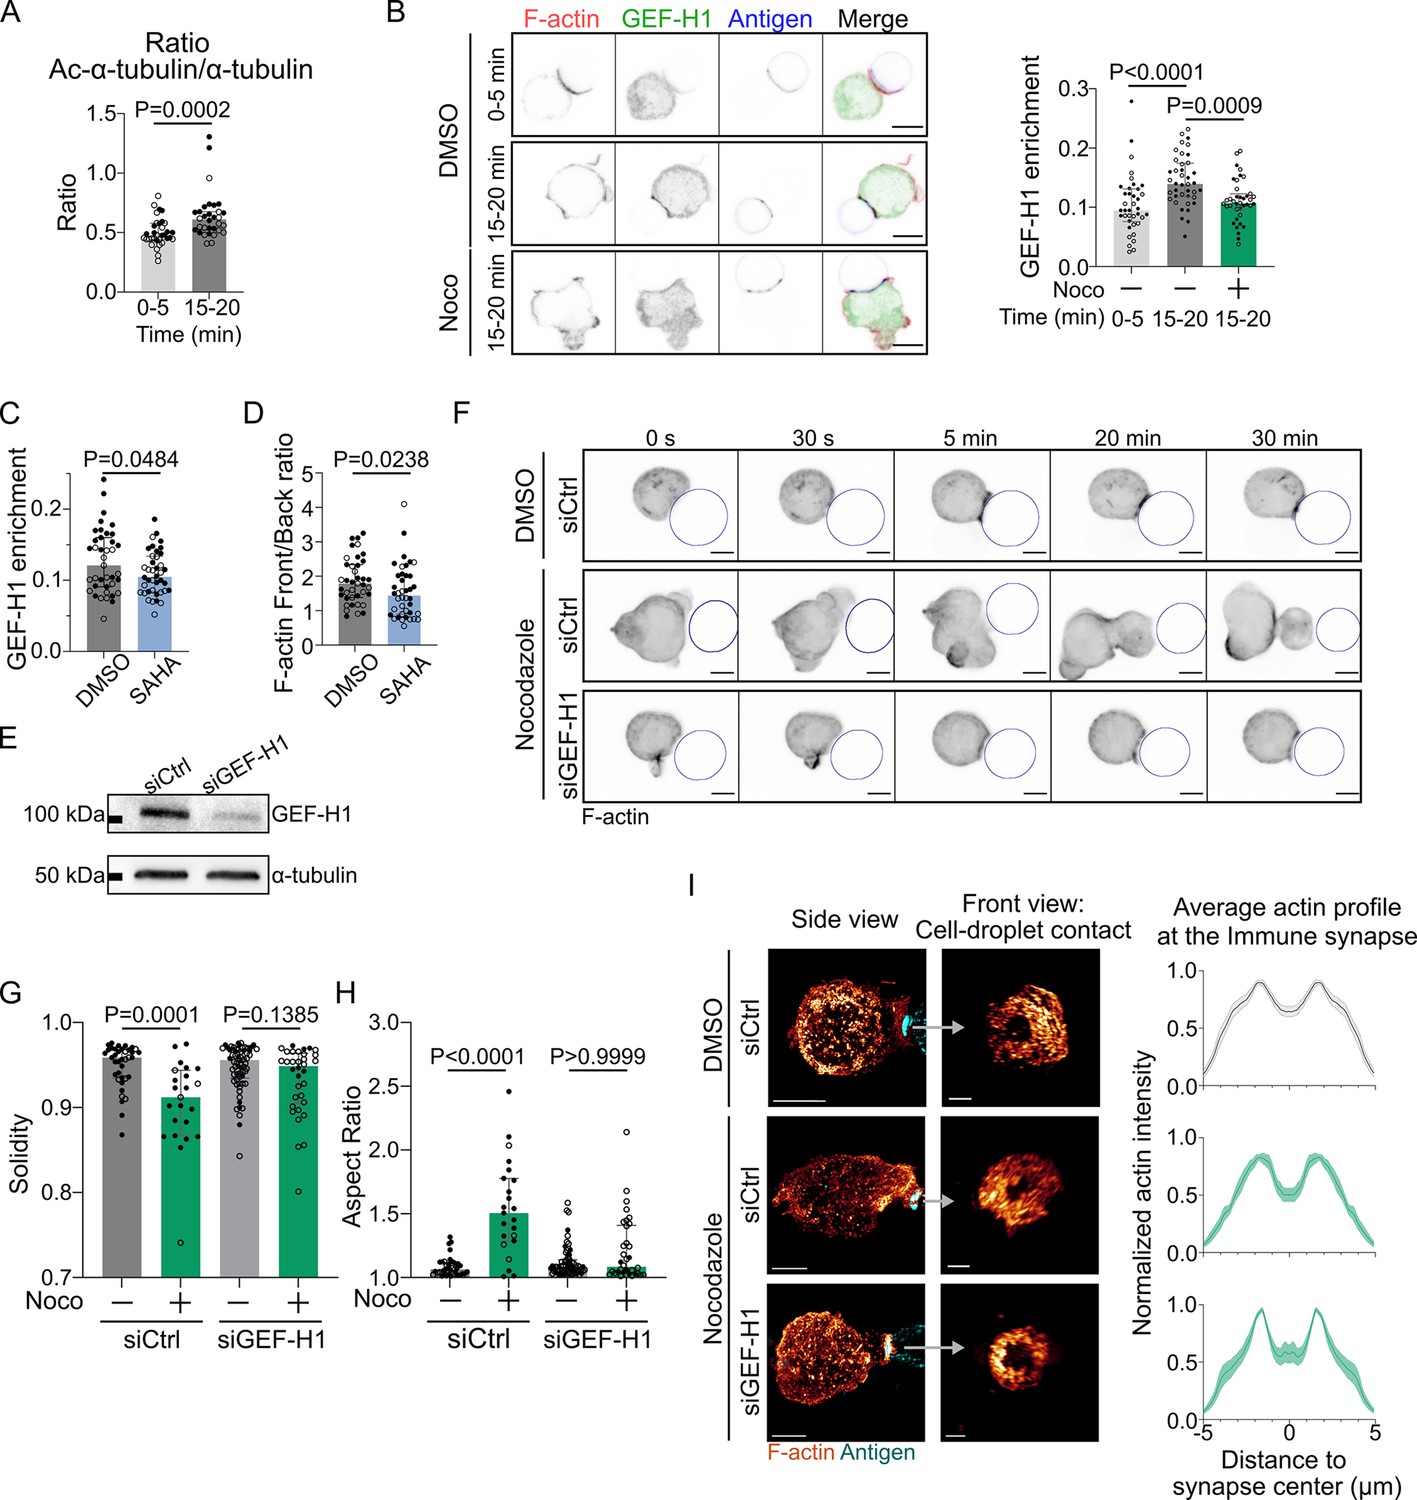
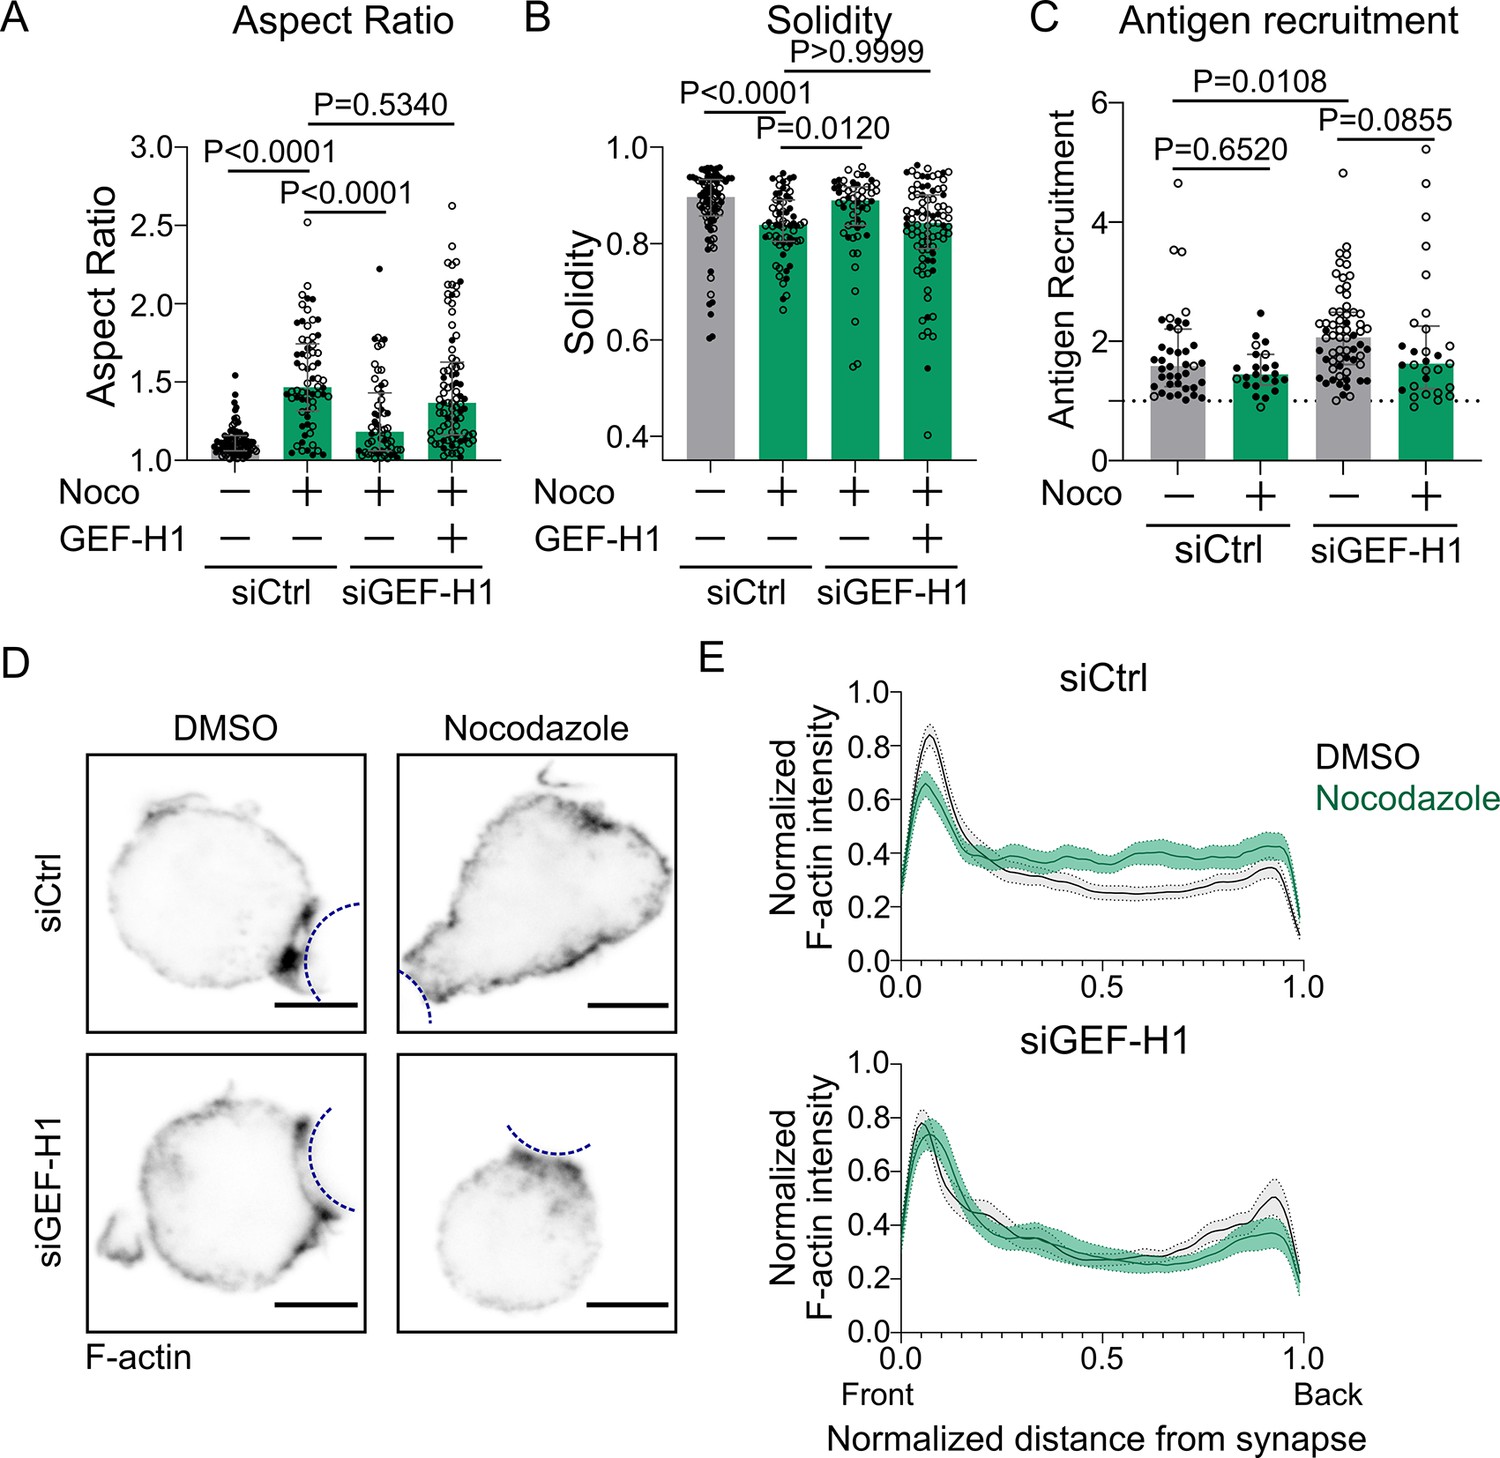
GEF-H1 is responsible for cell shape and actin patterning defects upon microtubule depletion.
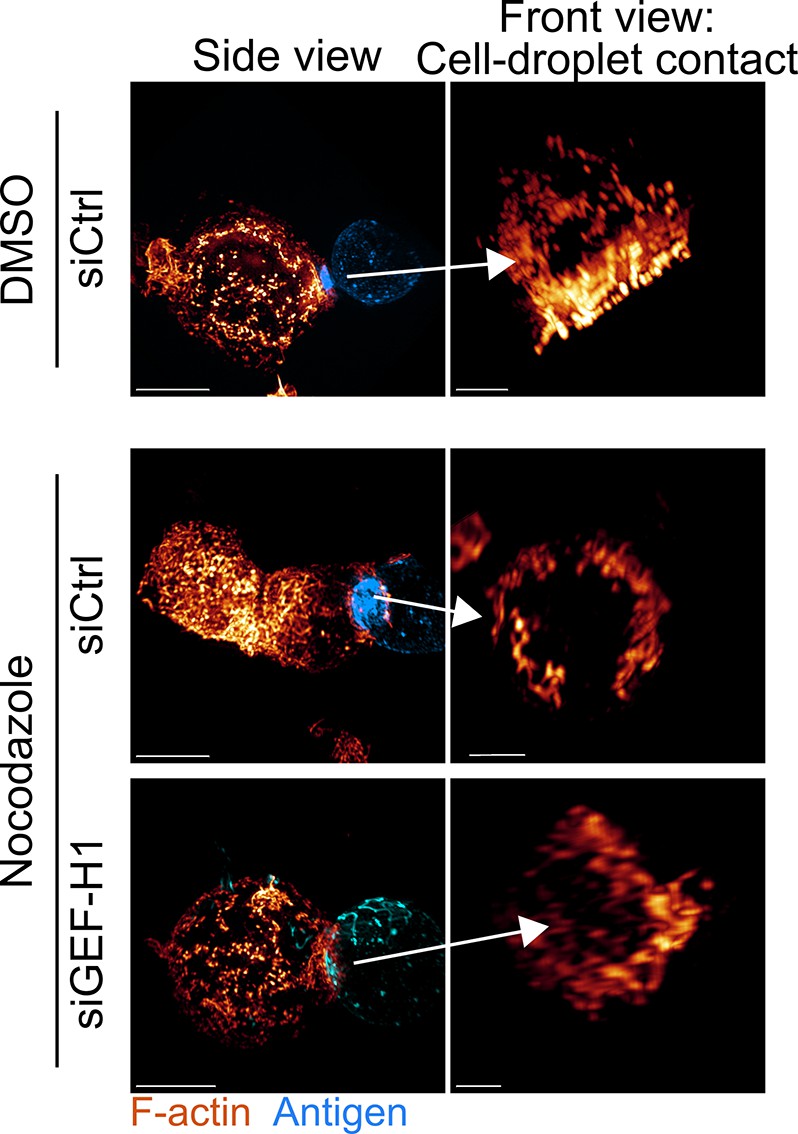
Experiments for this figure were performed using IIA1.6 cells transfected either with siCtrl or siGEF-H1 siRNAs 60 hr before experiment, with F-tractin-tdTomato the day before experiment, then put in contact with a F(ab′)2αIgG-coated droplet. Cells were pretreated for 1 hr with DMSO, suberoylanilide hydroxamic acid (SAHA) 10 µM or with nocodazole 5 µM, kept in solution during the experiment. (A) Quantification of the ratio of acetylated α-tubulin/α-tubulin in the whole cell, for IIA1.6 cells in contact with a droplet for different times, by immunofluorescence. Imaging by confocal microscopy (median ± IQR, 0–5 min N = 14;20, 15–20 min N = 18;14, two independent experiments, Mann–Whitney test). (B) Left: immunofluorescence images of IIA1.6 cells treated with DMSO or nocodazole, and in contact with a droplet for 0–5 min or 15–20 min. F-actin stained with phalloidin (red), GEF-H1 (green), and antigen on droplet (blue). Scale bar 6 µm. Right: quantification of the enrichment in GEF-H1 within 1 µm of the droplet divided by the total intensity in the cell in one plane, imaged by laser scanning confocal microscopy (LSCM), for IIA1.6 cells in contact with a droplet for different times, by immunofluorescence (median ± IQR, DMSO 0–5 min N = 20;18, DMSO 15–20 min N = 20;20, Noco 15–20 min N = 19;20, two independent experiments, Kruskal–Wallis test with multiple comparisons, Dunn’s post test). (C) From immunofluorescence imaged with LSCM, quantification of the enrichment in GEF-H1 within 1 µm of the droplet divided by the total intensity in the cell, in one plane, and (D) quantification of F-actin (stained with phalloidin) on six planes (δz = 0.34 µm) around the immune synapse, ratio of intensity in the half of the cell near the synapse (front), and the half away from the synapse (back), for IIA1.6 cells treated with DMSO or SAHA in contact with a droplet for 15–20 min (median ± IQR, DMSO N = 23;16, SAHA N = 21;19, two independent experiments, Mann–Whitney test). (E) Western blot of GEF-H1 to evaluate the efficiency of GEF-H1 silencing. α-tubulin was used as a loading control. The blot presented is representative of two independent experiments. (F) Time-lapse images of F-actin in cells transfected with siCtrl or siGEF-H1 and treated with DMSO (control) or nocodazole, using SDCM 3D time-lapse imaging. Scale bar 5 µm. (G) Solidity in 2D and (H) aspect ratio of cells after 40 min of immune synapse formation (siCtrl DMSO N = 30;8, siCtrl Noco N = 19;4, siGEF-H1 DMSO N = 19;46, siGEF-H1 Noco N = 7;27, two independent experiments, Kruskal–Wallis test with multiple comparisons between DMSO and Noco, Dunn’s post test), analyzed on maximum z-projections of SDCM 3D images. (I) Left: examples of 3D SIM immunofluorescence imaging of F-actin and antigen on the droplet after 15–20 min of immune synapse formation. Side view: scale bar 5 µm. Front view: scale bar 2 µm. MIP visualization. Right: profiles of F-actin at the immune synapse, from symmetric radial scans of the immune synapse, normalized to the maxima (mean ± SEM, pooled from two experiments, siCtrl DMSO N = 11;7, siCtrl Noco N = 5;6, siGEF-H1 Noco N = 2;7).
-
Figure 6—source data 1
Raw file of the full unedited Western blot images of Figure 6E, and a figure with annotated images of the full Western blot.
- https://cdn.elifesciences.org/articles/78330/elife-78330-fig6-data1-v2.zip
-
Figure 6—source data 2
Data tables related to graphs in Figure 6.
- https://cdn.elifesciences.org/articles/78330/elife-78330-fig6-data2-v2.zip
Figure 6—figure supplement 1
Microtubules control cell shape and F-actin polarized polymerization via the GEF-H1/RhoA pathway.
(A) 2D aspect ratio and (B) 2D solidity of cells after 40 min of immune synapse formation, for cells silenced (or not) for GEF-H1 expression, treated with DMSO or nocodazole 5 µM, and transfected either with an empty vector (pRK5) or with GEF-H1 for rescue (siCtrl DMSO N = 53;34, siCtrl Noco N = 31;35, siGEF-H1 Noco N = 19;36, siGEF-H1 Noco + GEF-H1 rescue N = 23;61, two independent experiments, Kruskal–Wallis test with multiple comparisons to siCtrl Noco, with Dunn’s post test), analyzed on maximum z-projections of SDCM 3D images of IIA1.6 cells stained with anti-B220 AF647. (C) Antigen recruitment by IIA1.6 cells after 40 min of immune synapse formation (median ± IQR, siCtrl DMSO N = 31;8, siCtrl Noco N = 19;4, siGEF-H1 DMSO N = 20;43, siGEF-H1 Noco N = 7;22, two independent experiments, Kruskal–Wallis test with Dunn’s post test for multiple comparisons). (D) Examples of laser scanning confocal imaging of immunofluorescence of F-actin and antigen on the droplet after 15–20 min of immune synapse formation, in IIA1.6 cells transfected with siCtrl or siGEF-H1, and treated with DMSO or nocodazole. Average projection of six planes (δz = 0.34 µm) around the synapse plane. Scale bar 5 µm. Outline of droplet in blue. (E) Linescan of actin intensity along cells (from immune synapse to back of cell) transfected with siCtrl or siGEF-H1, treated or not with nocodazole 5 µM, in six planes (δz = 0.34 µm) around the immune synapse, from images acquired as in (D). Intensity was normalized by the maximum intensity per cell (mean ± SEM, siCtrl DMSO N = 19;12, siCtrl Noco N = 14;14, siGEF-H1 DMSO N = 16;10, siGEF-H1 Noco N = 10;12, two independent experiments).
-
Figure 6—figure supplement 1—source data 1
Data tables related to graphs in Figure 6—figure supplement 1.
- https://cdn.elifesciences.org/articles/78330/elife-78330-fig6-figsupp1-data1-v2.zip
Figure 6—figure supplement 2
Additional examples of 3D SIM immunofluorescence imaging of F-actin (phalloidin staining) and antigen on the droplet after 15–20 min of immune synapse formation.
Side view: scale bar 5 µm. Front view: scale bar 2 µm. MIP visualization.
Figure 7 with 1 supplement

Microtubules control actin polarized polymerization via RhoA in a myosin II-independent manner.
Experiments for this figure were performed using F-tractin-tdTomato-expressing IIA1.6 cells in contact with a F(ab′)2αIgG-coated droplet and SDCM 3D time-lapse imaging. Cells were pretreated for 1 hr either with DMSO or with nocodazole 5 µM + para-nitroBlebbistatin 20 µM, kept in solution during the experiment. (A) Time-lapse images of F-actin-tdTomato-expressing cells, co-transfected with either a control empty vector (pRK5) or expressing RhoA CA (constitutively active). Scale bar 5 µm. (B) % coefficient of variation of 2D aspect ratio of individual cells over time, (C) Median 2D solidity of individual cells and (D) average distance of actin maxima to the droplet surface (median ± IQR, Control N = 10;9, RhoA CA N = 9;12, two independent experiments, Mann–Whitney test), analyzed on maximum z-projections. (E) Time-lapse images of F-tractin-tdTomato-expressing cells treated with DMSO or nocodazole + p-nBlebb, droplet outlined in blue. Scale bar 5 µm. (F) Median 2D solidity of maximum z-projections of individual cells over time (median ± IQR, DMSO N = 5;5;4, Noco + p-nBlebb N = 4;3;4, three independent experiments, Mann–Whitney test). (G) Aspect ratio of z-projections of cells in time (mean ± SEM, DMSO N = 5;5;4, Noco + p-nBlebb N = 4;3;4, three independent experiments). (H) Percentage of cells with aspect ratio >1.2 or <1.2 after 40 min of synapse formation. (I) Average distance of F-actin maxima to the droplet over 30 min of synapse formation (median ± IQR, DMSO N = 5;5;4, Noco + p-nBlebb N = 4;3;4, three independent experiments, Mann–Whitney test) (quantification: as in Figure 5H).
-
Figure 7—source data 1
Data tables related to graphs in Figure 7.
- https://cdn.elifesciences.org/articles/78330/elife-78330-fig7-data1-v2.zip
Figure 7—figure supplement 1
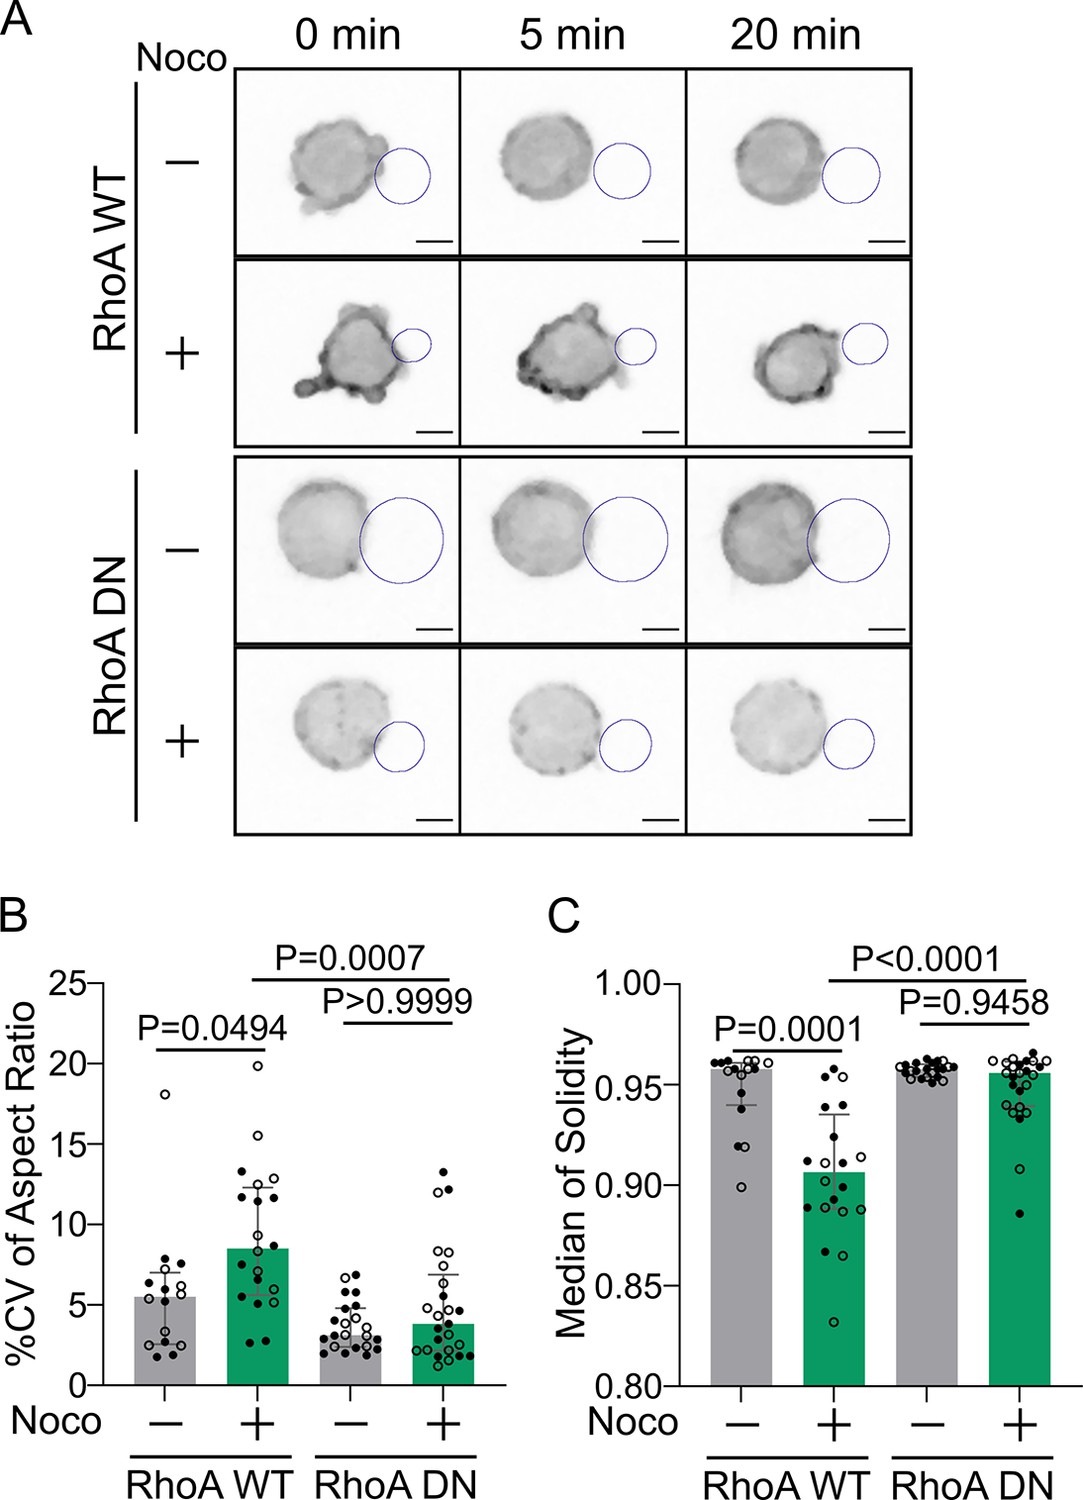
Cell deformation upon microtubule depletion is RhoA-dependent.
(A) Time-lapse images of F-actin-tdTomato-expressing cells, co-transfected to express either RhoA WT or RhoA DN (dominant negative), treated with DMSO or nocodazole, and imaged using SDCM 3D time-lapse imaging. Scale bar 5 µm. (B) % coefficient of variation of 2D aspect ratio of individual cells over time and (C) median 2D solidity of individual cells (median ± IQR, RhoA WT DMSO N = 8;8, RhoA WT Noco N = 11;9, RhoA DN DMSO N = 14;8, RhoA DN Noco N = 10;15, two independent experiments, Kruskal–Wallis test with Dunn’s post test for multiple comparisons), from the data obtained from SDCM 3D time-lapse imaging. Analyzed on maximum z-projections.
-
Figure 7—figure supplement 1—source data 1
Data tables related to graphs in Figure 7—figure supplement 1.
- https://cdn.elifesciences.org/articles/78330/elife-78330-fig7-figsupp1-data1-v2.zip
Figure 8
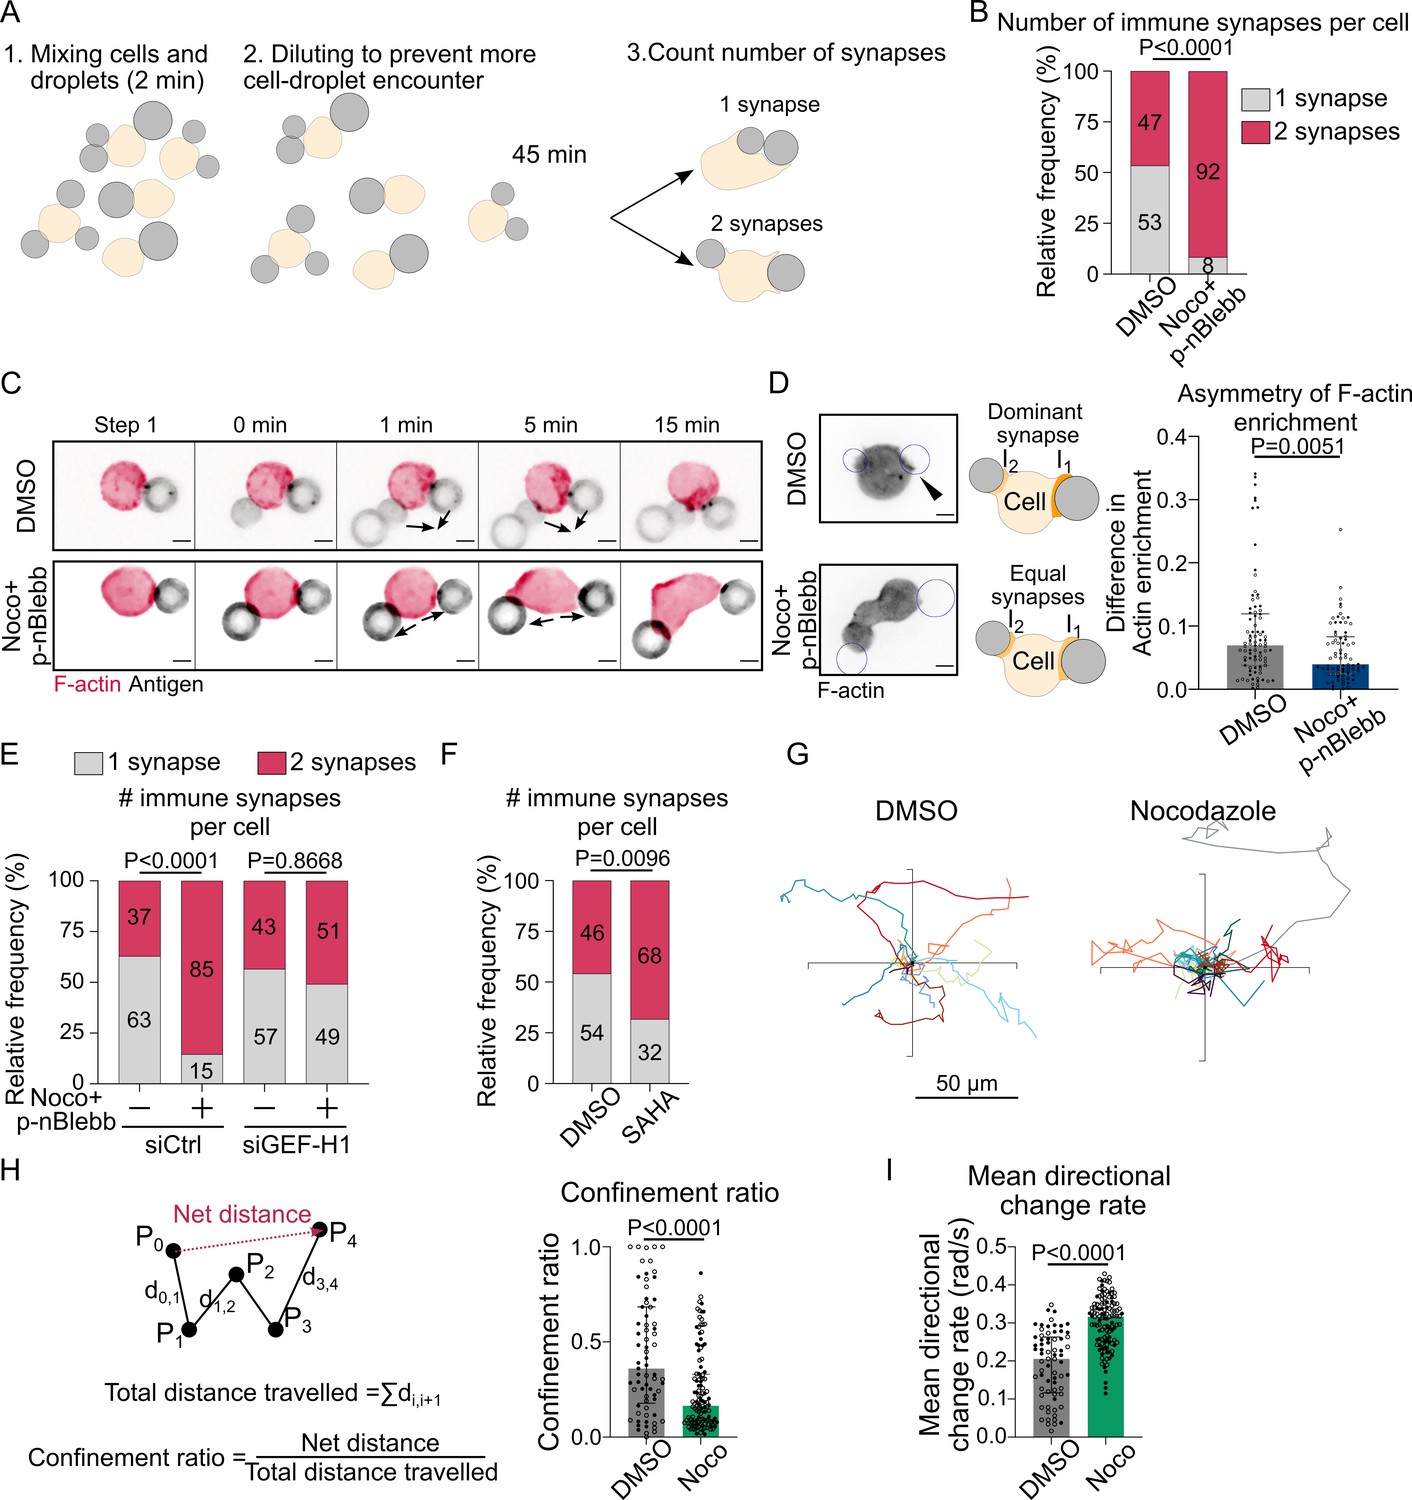
Microtubule depletion favors the formation of multiple polarity axis.
Experiments for this figure were performed using F-tractin-tdTomato-expressing-IIA1.6 cells in contact with a F(ab′)2αIgG-coated droplet and SDCM 3D time-lapse imaging. Cells were pretreated for 1 hr with DMSO, with suberoylanilide hydroxamic acid (SAHA) 10 µM or with nocodazole 5 µM + para-nitroBlebbistatin 20 µM, which was kept in the media throughout experiments. (A) Schematic of the concept of the multiple synapse experiment. Considering only cells in contact with exactly two droplets, counting number of contact areas (number of synapses) after 45 min. (B) Number of immune synapses per cell treated with DMSO or Noco + p-nBlebb (DMSO N = 74;70, Noco + p-nBlebb N = 54;67, two independent experiments, Mann–Whitney test p=0.0038), from SDCM 3D imaging of cells and droplets. (C) Examples of time-lapse images of F-actin and antigen on the droplet. Situation of a cell (untreated) bringing droplets closer into one immune synapse, and of a cell (treated with nocodazole and para-nitroBlebbistatin) taking droplets apart. Scale bar 5 µm. 3D time-lapse SDCM imaging in the microfluidic chip. (D) Left: examples of images (from SDCM 3D time-lapse) of F-actin and antigen on the droplet. Situation of a cell (untreated) with one synapse more enriched in F-actin and of a cell (treated with nocodazole + para-nitroBlebbistatin) with equivalent synapses. Scale bar 5 µm. Right: To assess the asymmetry in F-actin enrichment between multiple synapses and the presence of a dominant, more enriched synapse, we compute here the difference of enrichment in F-actin between immune synapses, per cell (DMSO N = 44;42, Noco + p-nBlebb N = 26;50, two independent experiments, Mann–Whitney test) (quantification of F-actin enrichment: see Figure 2B). Quantification from SDCM 3D images in the microfluidic chip. (E) Number of immune synapses per cell transfected 60 hr before with siCtrl or siGEF-H1, and treated with DMSO or Noco + p-nBlebb (siCtrl DMSO N = 25;29, siCtrl Noco + p-nBlebb N = 28;34, siGEFH1 DMSO N = 24;29 siGEF-H1 Noco + p-nBlebb N = 29;26, two independent experiments, Kruskal–Wallis test with Dunn’s post test for multiple comparisons), from SDCM 3D imaging of cells and droplets. (F) Number of immune synapses per cell treated with DMSO or suberoylanilide hydroxamic acid (SAHA) 10 µM (DMSO N = 32;27, SAHA N = 57;28, two independent experiments, Mann–Whitney test), from SDCM 3D imaging of cells and droplets. (G) Example trajectories of migrating IIA1.6 B lymphocytes in contact with an antigen-coated droplet, representative of two experiments, 14 trajectories per condition, 7 trajectories per experiment. Plot over 2 hr. Analysis of migration from videomicroscope bright-field time-lapse imaging. (H) Confinement ratio and (I) directional change rate of trajectories (2 hr, image every 4 min) of migrating IIA1.6 cells in contact with a droplet (DMSO N = 33;36, Noco N = 48;73, two independent experiments, Mann–Whitney test).
-
Figure 8—source data 1
Data tables related to graphs in Figure 8.
- https://cdn.elifesciences.org/articles/78330/elife-78330-fig8-data1-v2.zip
Author response image 1
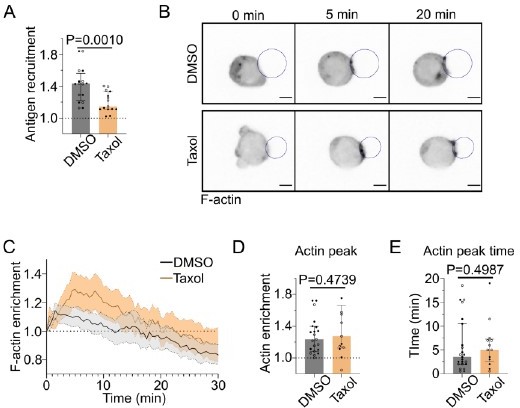
The effect of Taxol (1 µM) on B lymphocyte immune synapse formation.
(A) Plateau (Average 25-30min) of antigen recruitment (Median+/- IQR,DMSO N=8;8, Taxol N=9;6, 2 independent experiments, Mann-Whitney test). (B) Timelapse images of F-tractin td Tomato-expressing cells in contact with an antigen-coated droplet, treated with DMSO or Taxol. Scale bar 5µm. (C) F-actin enrichment at the immune synapse (as defined in the paper) in time (Mean+/- SEM). (D) peak value of F-actin enrichment in 0-10min and (E) time of peak of F-actin enrichment (Median+/- IQR, DMSO N=12;11, Taxol N=6;7, 2 independent experiments, Mann-Whitney test).
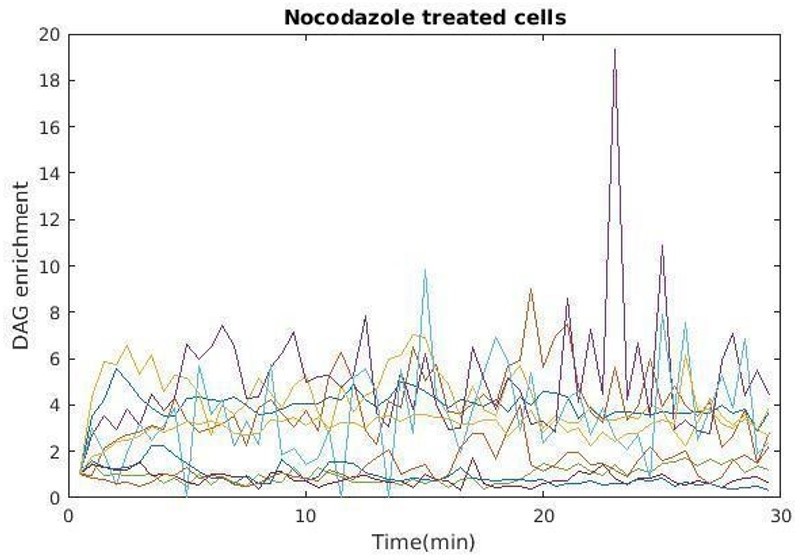
Author response image 2
Videos
Video 1
Bright-field movie of cell injection in the microfluidic chip.
Video 2
Recruitment of antigen on the droplet by a IIA1.6 cell; outline of the nucleus drawn to follow cell arrival.
Video 3
Examples of polarization dynamics at the B cell immune synapse of a IIA1.6 cell, for diacylglycerol (DAG) signaling, F-actin, the centrosome, the Golgi apparatus, lysosomes and the nucleus; droplet outline drawn on each movie.
Video 4
Centrosome (SiRTubulin staining) and nucleus (Hoechst staining) in IIA1.6 cells treated with DMSO or latrunculin A.
Video 5
Nucleus (Hoechst staining) in IIA1.6 cells treated with DMSO or nocodazole; droplet outline.
Video 6
F-actin in IIA1.6 cells treated with DMSO or nocodazole; droplet outline.
Video 7
F-actin in IIA1.6 cells expressing an empty vector (pRK5) or RhoA CA; droplet outline.
Video 8
F-actin in IIA1.6 cells expressing RhoA WT or RhoA DN, treated with DMSO or nocodazole; droplet outline.
Video 9
F-actin in IIA1.6 cells treated with DMSO or nocodazole + para-nitroBlebbistatin; droplet outline.
Video 10
F-actin in IIA1.6 cells treated with DMSO or nocodazole + para-nitroBlebbistatin, contacting two droplets.
Example of a cell bringing droplets together (DMSO) and taking droplets apart (nocodazole + para-nitroBlebbistatin).
Video 11
Bright-field movies of migrating IIA1.6 cells treated with DMSO (Control) or nocodazole, on a BSA-coated dish, in contact with an antigen-coated droplet.
Scale bar 10 µm.
Tables
Key resources table
| Reagent type (species) or resource | Designation | Source or reference | Identifiers | Additional information |
|---|---|---|---|---|
| Cell line (Mus musculus) | IIA1.6 | Yuseff et al., 2011 | Cellosaurus A20.IIA (CVCL_0J27) | IgG+ B lymphoma cell line |
| Genetic reagent (M. musculus) | LifeAct-GFP mice/C57BL/B6 | Riedl et al., 2008 | MGI:4831036 | |
| Software, algorithm | Fiji | Schindelin et al., 2012 | https://imagej.net/Fiji | |
| Software, algorithm | Icy bioimage analysis | de Chaumont et al., 2012 | https://icy.bioimageanalysis.org/ | |
| Software, algorithm | MATLAB | MathWorks | ||
| Software, algorithm | GraphPad PRISM | GraphPad Software | Version 9.2.0 | |
| Software, algorithm | RStudio | RStudio | ||
| Software, algorithm | Metamorph | Molecular Devices | ||
| Software, algorithm | SoftWoRx | Image Precision | ||
| software, algorithm | Imaris Viewer | Imaris | ||
| Sequence-based reagent | ON-TARGETplus Control n=Non-Targeting Pool | Dharmacon | D-001810-10-05 | |
| Sequence-based reagent | SMARTPool ON-TARGETplus Mouse Arhgef2 siRNA | Dharmacon | L-040120-00-0005 | |
| Commercial assay or kit | B cell isolation kit | Miltenyi | 130-090-862 | |
| Commercial assay or kit | LS columns | Miltenyi | 130-042-401 | |
| Commercial assay or kit | 10 µL Neon Transfection system | Thermo Fisher | MPK1096 | 1300 V, 20 ms, two pulses |
| Commercial assay or kit | Amaxa Nucleofector kit R | Lonza | VCA-1001 | T-016 program |
| Chemical compound, drug | DSPE-PEG(2000) | Avanti Lipids, Coger | 880129-10mg | Resuspended in chloroform |
| Chemical compound, drug | Soybean oil | Sigma-Aldrich | CAS# 8001-22-7 | |
| Chemical compound, drug | Pluronic F68 | Sigma-Aldrich | CAS# 9003-11-6 | |
| Chemical compound, drug | Sodium alginate | Sigma-Aldrich | CAS# 9005-38-3 | |
| Chemical compound, drug | Tween 20 | Sigma-Aldrich | CAS# 9005-64-5 | |
| Chemical compound, drug | Na2HPO4· 7H2O | Merck | CAS# 7782-85-6 | |
| Chemical compound, drug | NaH2PO4· H2O | Carlo Erba | CAS# 10049-21-5 | |
| Chemical compound, drug | Streptavidin Alexa Fluor 405 | Thermo Fisher | S32351 | |
| Chemical compound, drug | Streptavidin Alexa Fluor 488 | Thermo Fisher | S11223 | |
| Chemical compound, drug | Streptavidin Alexa Fluor 546 | Thermo Fisher | S11225 | |
| Chemical compound, drug | Streptavidin Alexa Fluor 647 | Thermo Fisher | S32357 | |
| Chemical compound, drug | Biotin labeled bovine albumin | Sigma-Aldrich | A8549-10MG | |
| Chemical compound, drug | PDMS-RTV 615 | Neyco | RTV615 | 1:9 ratio |
| Chemical compound, drug | PVP K90 | Sigma-Aldrich | 81440 | 0.2 in MilliQ water |
| Chemical compound, drug | Latrunculin A | Abcam | ab144290 | 2 µM, 1 hr |
| Chemical compound, drug | para-nitroBlebbistatin | Optopharma | 1621326-32-6 | 20 µM, 1 hr |
| Chemical compound, drug | Nocodazole | Sigma | M1404 | 5 µM, 1 hr |
| Chemical compound, drug | MLSA1 | Tocris | 4746 | 1 µM, 1 hr |
| Chemical compound, drug | SAHA | Tocris | 4652 | 10 µM, 1 hr |
| Chemical compound, drug | Hoechst 33342 | Thermo Fisher | R37605 | |
| Chemical compound, drug | LysoTracker Deep Red | Thermo Fisher | L12492 | Cell labeling 50 nM, 45 min |
| Chemical compound, drug | SiRTubulin kit | Spirochrome AG, Tebu-bio | SC002 | 100 nM SiRTubulin + 10 µM verapamil |
| Other | Tygon Medical Tubing | Saint-Gobain (VWR) | ND 100-80 | Tubing for injection in microfluidic chips (see ‘Live imaging of IIA1.6 cell polarization in microfluidic chips’) |
| Other | Stainless steel dispensing needles 23GA | Kahnetics | KDS2312P | Needle for injection in microfluidic chips (see ‘Live imaging of IIA1.6 cell polarization in microfluidic chips’) |
| Antibody | Anti-B220 AF647 (rat monoclonal) | BioLegend | 103229 | On live cells (1:100), incubation 15 min at 4°C |
| Antibody | Biotin-SP-conjugated F(ab′)2 goat polyclonal anti-mouse IgG | Jackson ImmunoResearch | 115-066-072 | Droplet functionalization (5.7 µL) |
| Antibody | Biotin-SP-conjugated F(ab′)2 goat polyclonal anti-mouse IgM | Jackson ImmunoResearch | 115-066-020 | Droplet functionalization (5.7 µL) |
| Antibody | Anti-EXOC7 (rabbit polyclonal) | abcam | ab95981 | IF (1:200) |
| Antibody | Anti-GEF-H1 (rabbit polyclonal) | abcam | ab155785 | WB (1:1000), IF (1:100) |
| Antibody | Anti-α-tubulin (rat monoclonal) | Bio-Rad | MCA77G | WB (1:1000), IF (1:1000) |
| Antibody | Anti-acetyl-α-tubulin (Lys40) (rabbit monoclonal) | Cell Signaling | 5335 | IF (1:250) |
| Recombinant DNA reagent | eGFP-Centrin1 | Obino et al., 2016 | ||
| Recombinant DNA reagent | C1δ-GFP | Botelho et al., 2000 | ||
| Recombinant DNA reagent | GEF-H1 | Origene | RG204546 | |
| Recombinant DNA reagent | pRK5myc RhoA L63 | Addgene, Nobes and Hall, 1999 | 15900 | |
| Recombinant DNA reagent | RhoA WT EGFP | Subauste et al., 2000 | ||
| Recombinant DNA reagent | RhoA T19N EGFP | Subauste et al., 2000 |
Additional files
Download links
A two-part list of links to download the article, or parts of the article, in various formats.
Downloads (link to download the article as PDF)
Open citations (links to open the citations from this article in various online reference manager services)
Cite this article (links to download the citations from this article in formats compatible with various reference manager tools)
Microtubules restrict F-actin polymerization to the immune synapse via GEF-H1 to maintain polarity in lymphocytes
eLife 11:e78330.
https://doi.org/10.7554/eLife.78330


