Gain, not concomitant changes in spatial receptive field properties, improves task performance in a neural network attention model
- Department of Psychology, Stanford University, United States
Figures
Figure 1
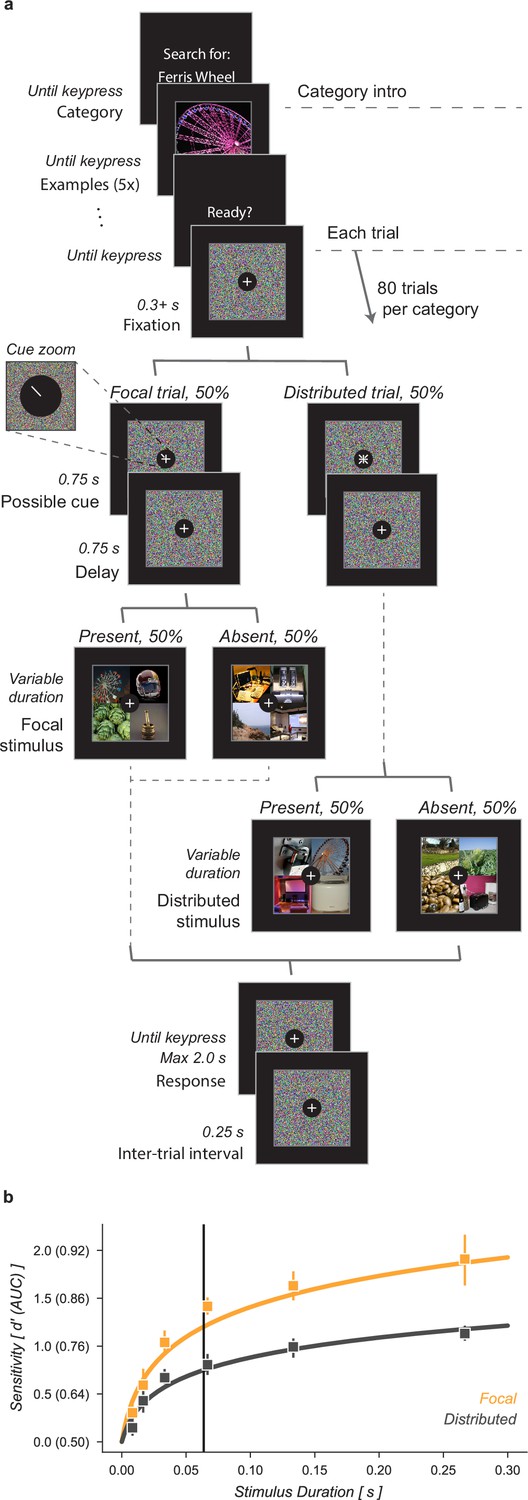
Cued object detection task.
(a) Observers were asked to perform object detection with or without a spatial cue. At the start of a block, observers were shown five examples of the target category. This was followed by 80 trials: 40 with a spatial cue indicating the possible target quadrant and 40 with no prior information. Stimulus presentation was pre and post-masked. The stimuli consisted of a composite grid of four individual object exemplars. The target category was present in 50% of trials and always in the cued location on focal trials. Human observers used a keyboard to make a fast button response to indicate the target presence before moving on to the next trial. (b) Human observers showed a substantial improvement in performance when given a focal cue indicating the quadrant at which the target might appear. Vertical line at 64ms indicates the duration at which the best-fit curve for the Distributed condition matched the CNN observer model performance without gain. Markers indicate the median and error bars the 95% confidence intervals (n=7 observers).
Figure 2
Neural network observer model.
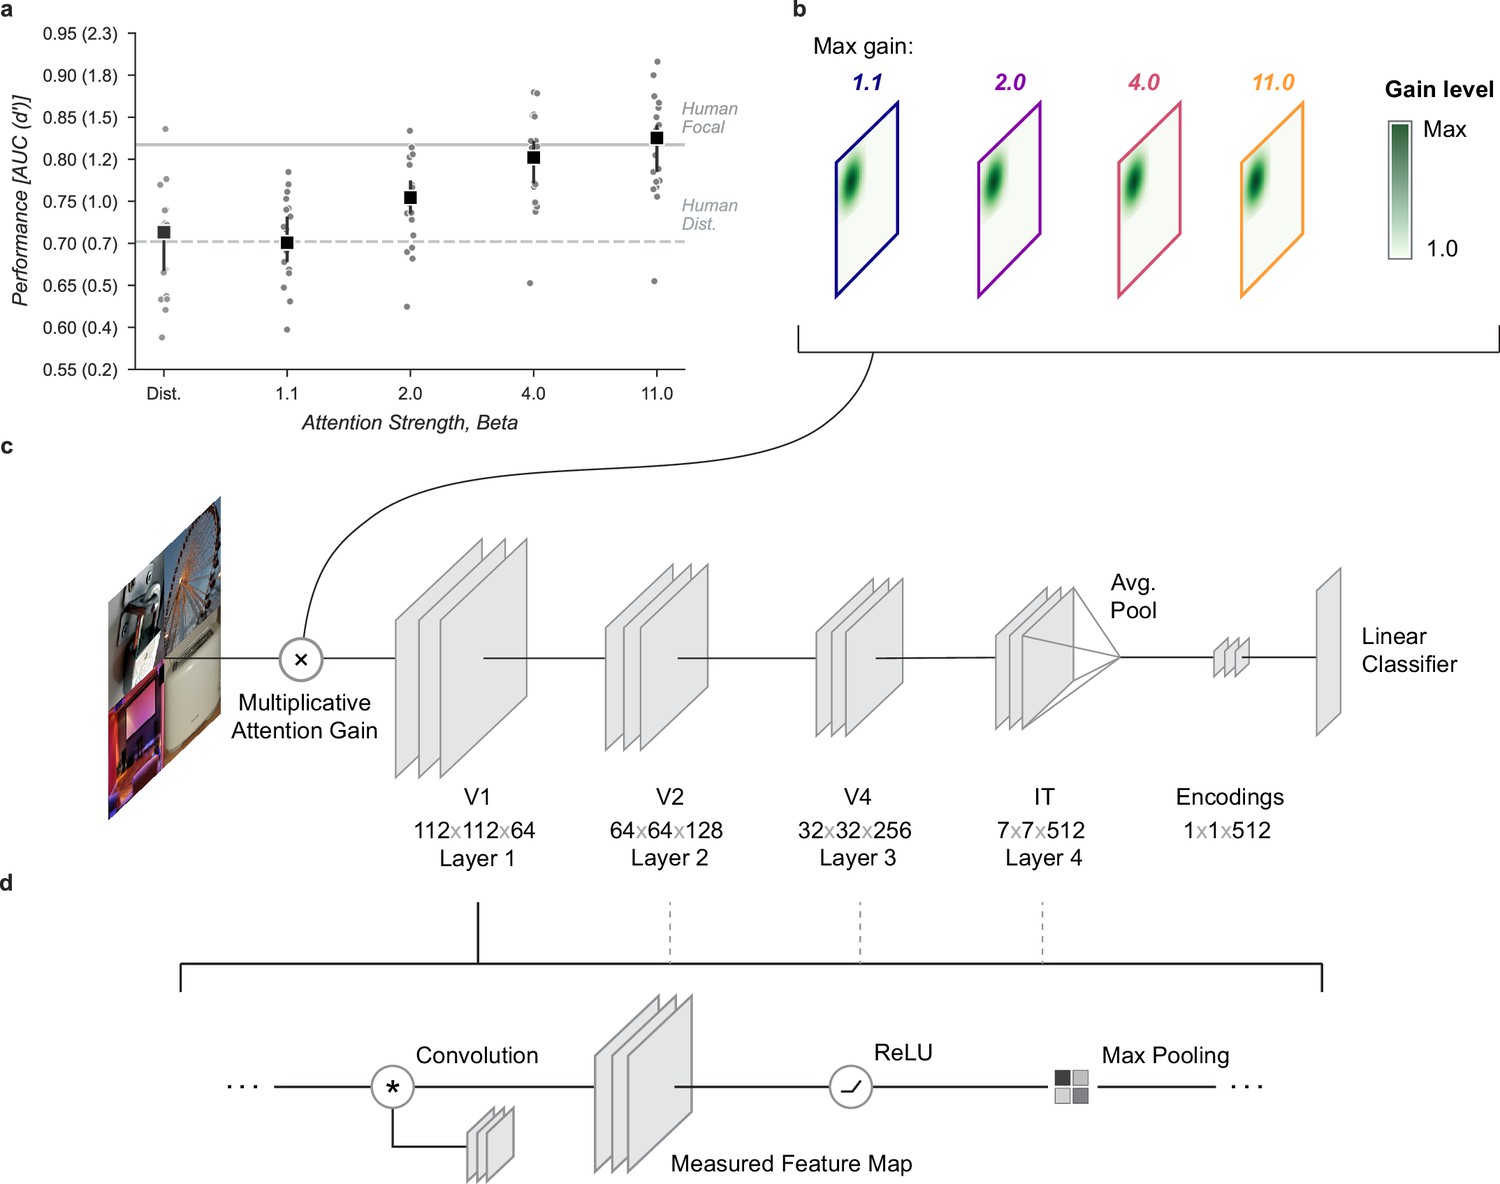
(a) Using a Gaussian gain the neural network observer was able to replicate the benefit of spatial attention for human observers. Human performance is shown at a stimulus duration of 64ms which provided the closest match to the convolutional neural network (CNN) performance without gain. Black markers indicate the median by category and error bars the 95% confidence intervals (n=20 categories). (b) The Gaussian gain was implemented by varying the maximum strength of a multiplicative gain map applied to the ‘cued’ quadrant. (c) The gain was applied prior to the first layer of the CNN. The neural network observer model consisted of a four layer CNN with linear classifiers applied to the output layer. Individual classifiers were trained on examples of each object category. (d) Each of the four convolutional layers consisted of a convolution operation, a rectified linear unit, and max pooling. Unit activations were measured at the output of each layer.
Figure 3
Effects of Gaussian gain on neural network units.
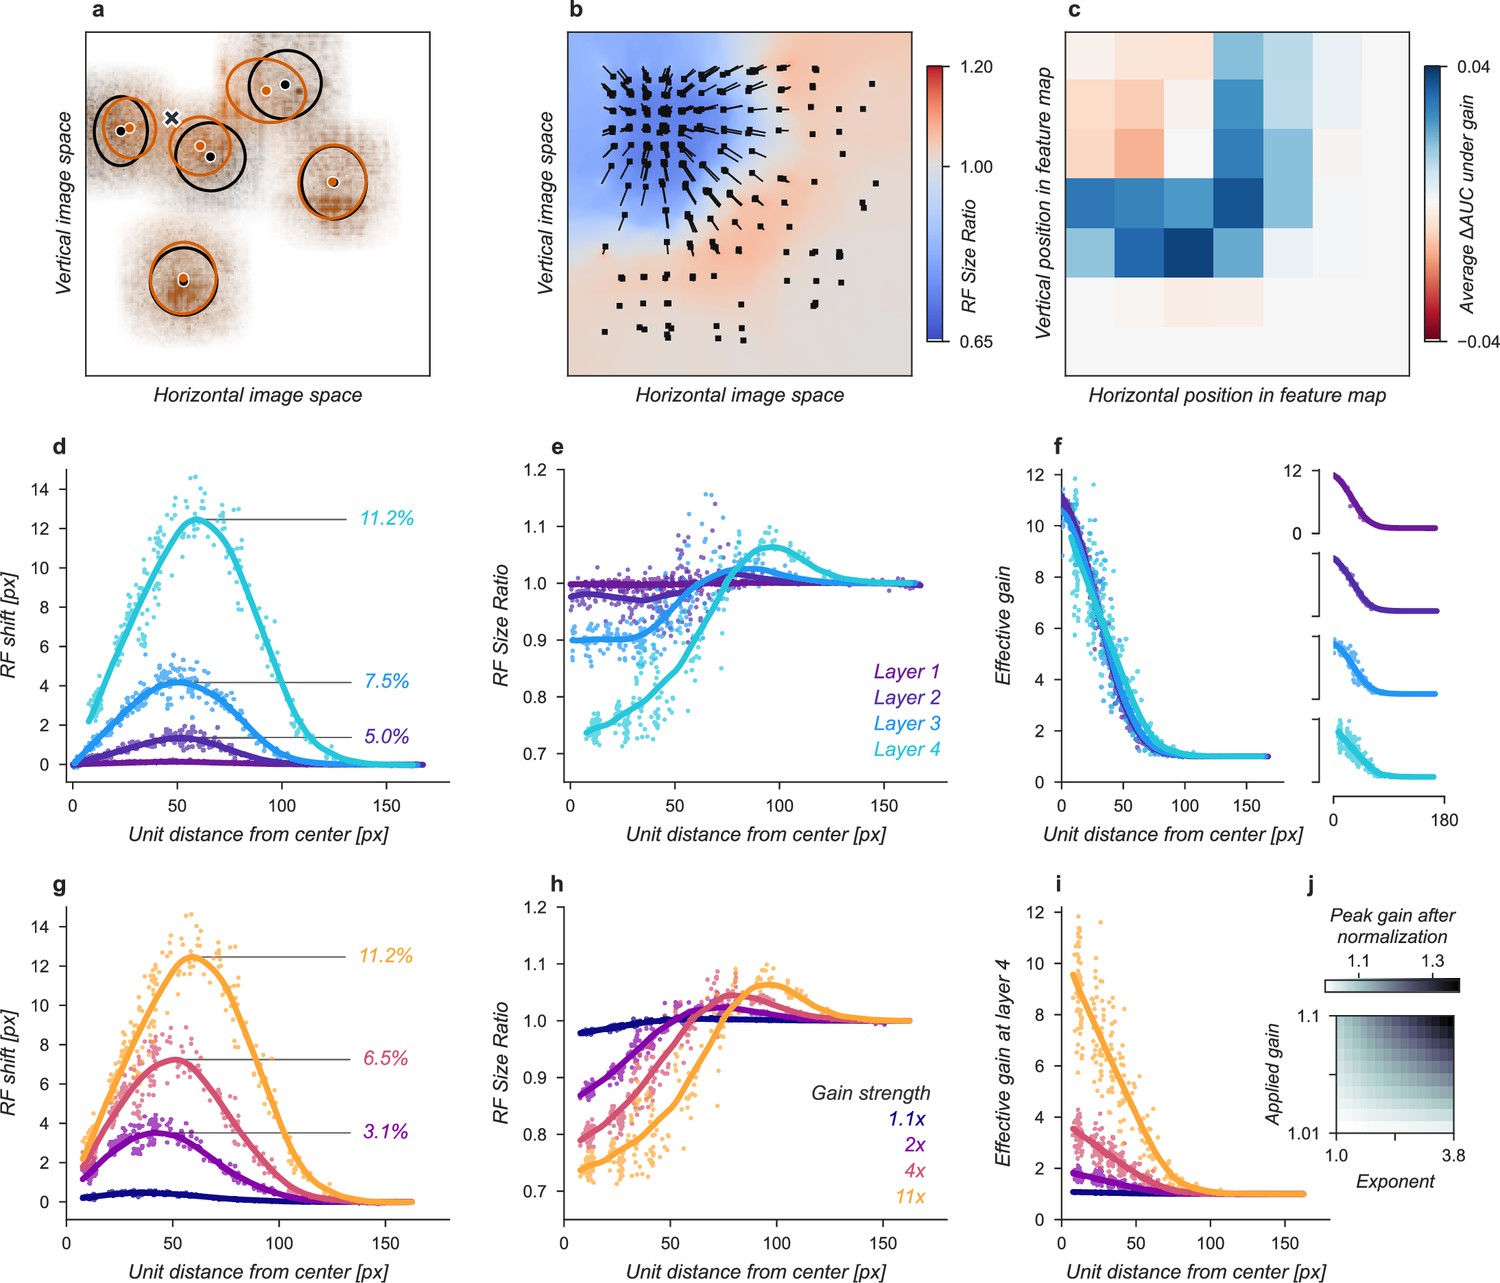
(a) The Gaussian gain applied to Layer 1 units caused the measured receptive field (RF) of units in Layer 4 to shift (black ellipse, original; brown ellipse, with gain) toward the locus of attention (black ×). (b) A 2D spatial map demonstrates the effects of Gaussian gain in Layer 4: shift of RF center position (black arrows), shrinking RF size near the attended locus (blue colors) and an expansion of size near the gain boundaries (red colors). (c) map of the output layer before averaging, showing the change in AUC caused by the addition of Gaussian gain. Each pixel’s ΔAUC is computed by projecting the activations at that location for composite grids with target present and absent on the decision axis and then calculating the difference in AUC between a model with and without Gaussian gain. The map demonstrates that units overlapping the borders of the composite grid have the largest change in information content when Gaussian gain is applied. (d,e) Scatter plots demonstrate that each layer magnifies the effect of the gain on RF shift and RF size. The RF shift percentages are the ratio of pixel shift at the peak of the curve relative to the average receptive field size, measured as the full-width at half-maximum. (f) Later layers do not magnify the effective gain (shown for an 11× gain), which stays constant across layers. (g) Gain strength influences the size of RF position shifts, RF size (h), and effective gain (i). (j) Adding an additional non-linear normalizing exponent at the output of each layer allows for much smaller gains to be magnified across layers. Markers in all panels indicate individual sampled units from the model. Lines show the LOESS fit for visualization.
Figure 4
Receptive field shift model.
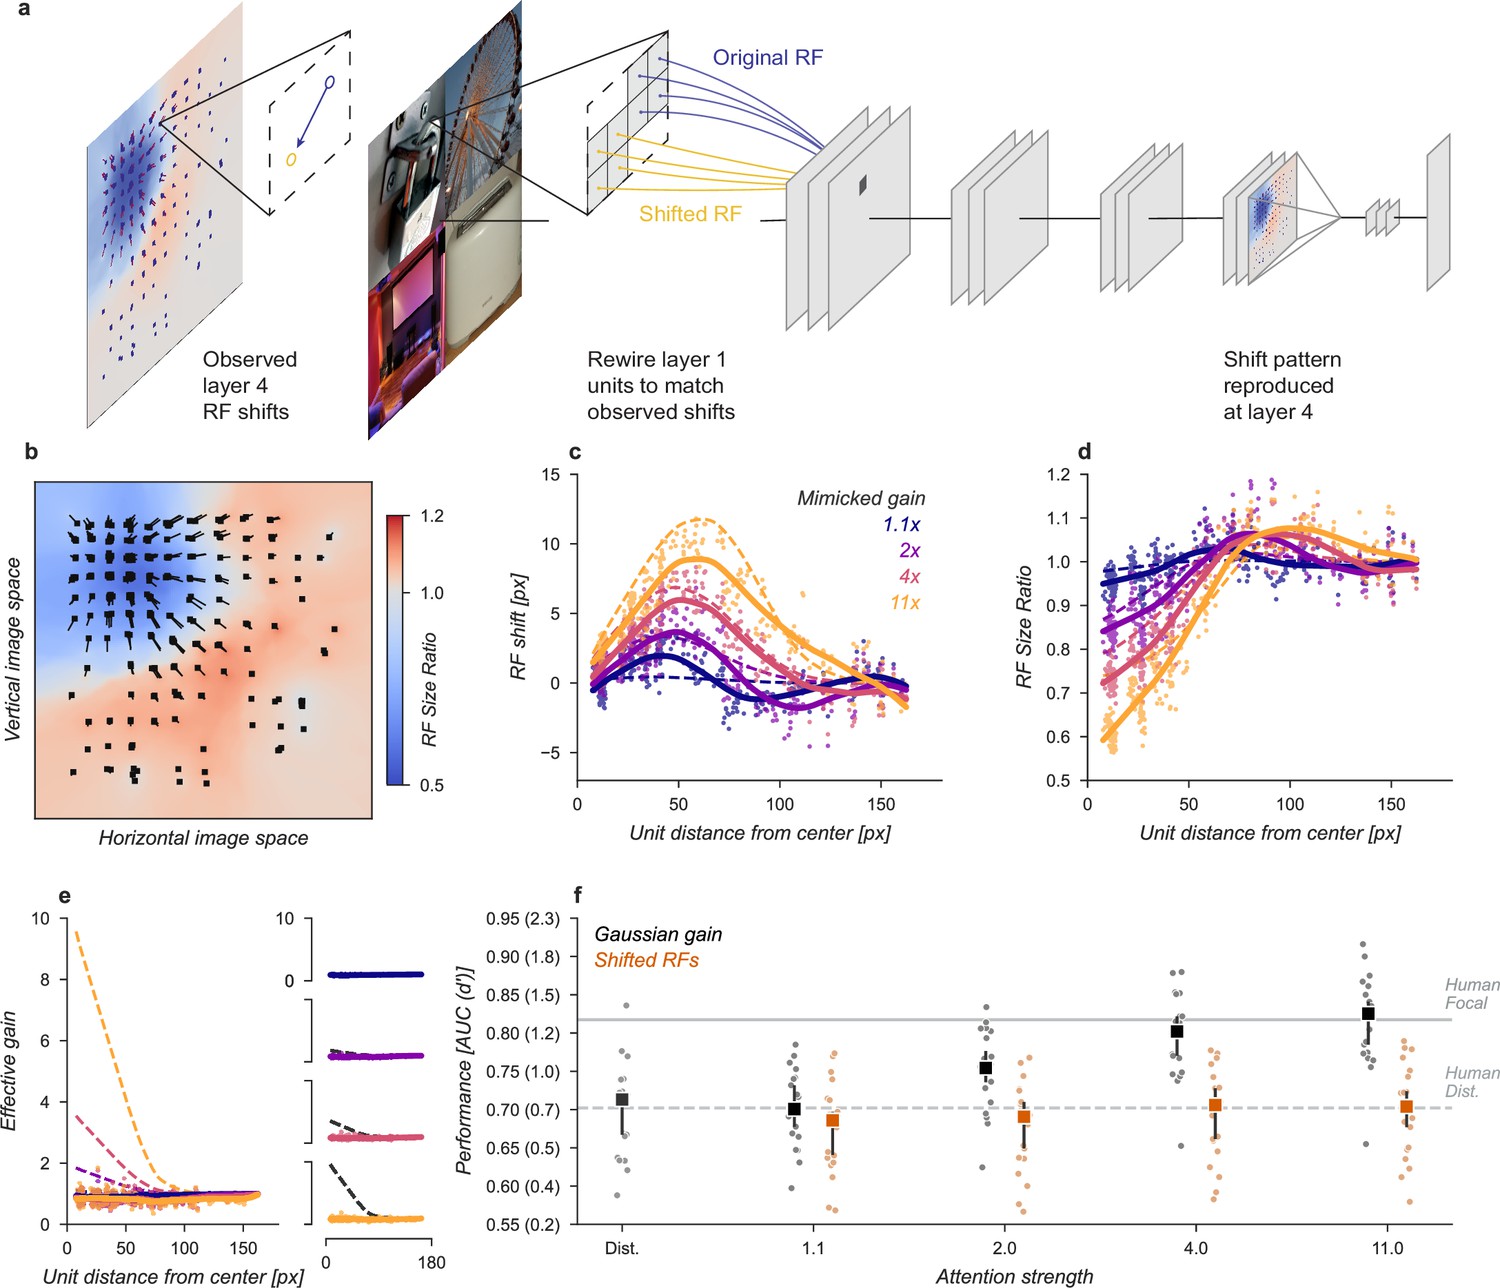
(a) To mimic the effects of the Gaussian gain on receptive field position without inducing gain in the model we re-assigned the inputs to units in Layer 1. This re-assignment was performed so that the pattern of receptive field shift in Layer 4 would match what was observed when the Gaussian gain was applied. (b) The observed pattern of receptive field shifts and shrinkage is shown for a sample of units in layer 4, qualitatively matching the effects of the Gaussian gain. (c) RF shift is shown for sampled units (markers) and the LOESS fit (solid lines) compared to the effect in the Gaussian gain model (dotted lines). (d) Conventions as in c for the RF size change. (e) Conventions as in (c,d) for the effective gain of units. (f) The behavioral effect of shifting receptive fields is shown to be null on average across categories when compared to the effect of Gaussian gain. Large markers indicate the median performance, small markers the individual categories (n=20), and error bars the 95% confidence intervals.
Figure 5
Receptive field structure model.
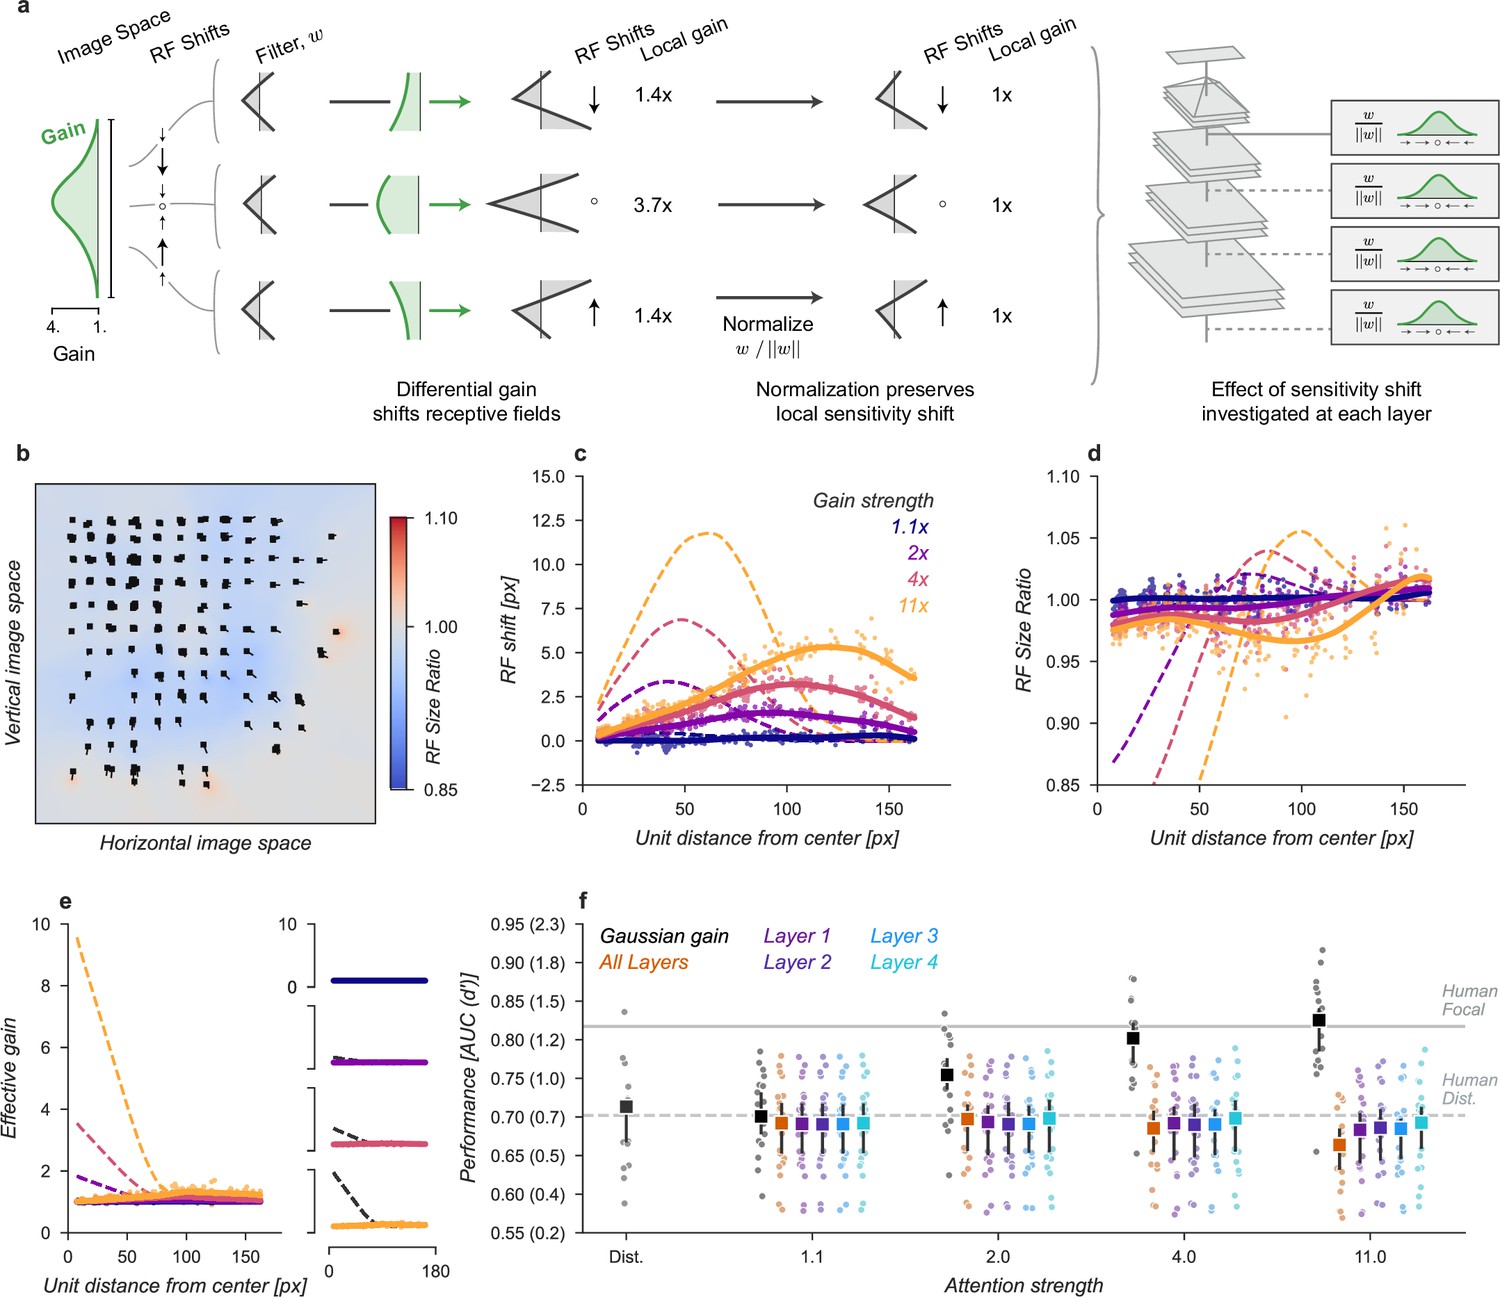
(a) We adjusted the kernels of each convolutional neural network (CNN) unit according to the effect of a Gaussian gain, subtly shifting the the sensitivity within individual units. To avoid inducing a gain change, we then normalized each units output such that the sum-of-squares of the weights was held constant, ensuring the local gain at that unit remained at 1×. This model was implemented individually at each layer, replicating the effect of a Gaussian gain of 1.1×–11× as well as at all layers at once. (b–f) conventions as in Figure 4.
Figure 6
Shrinkage model.
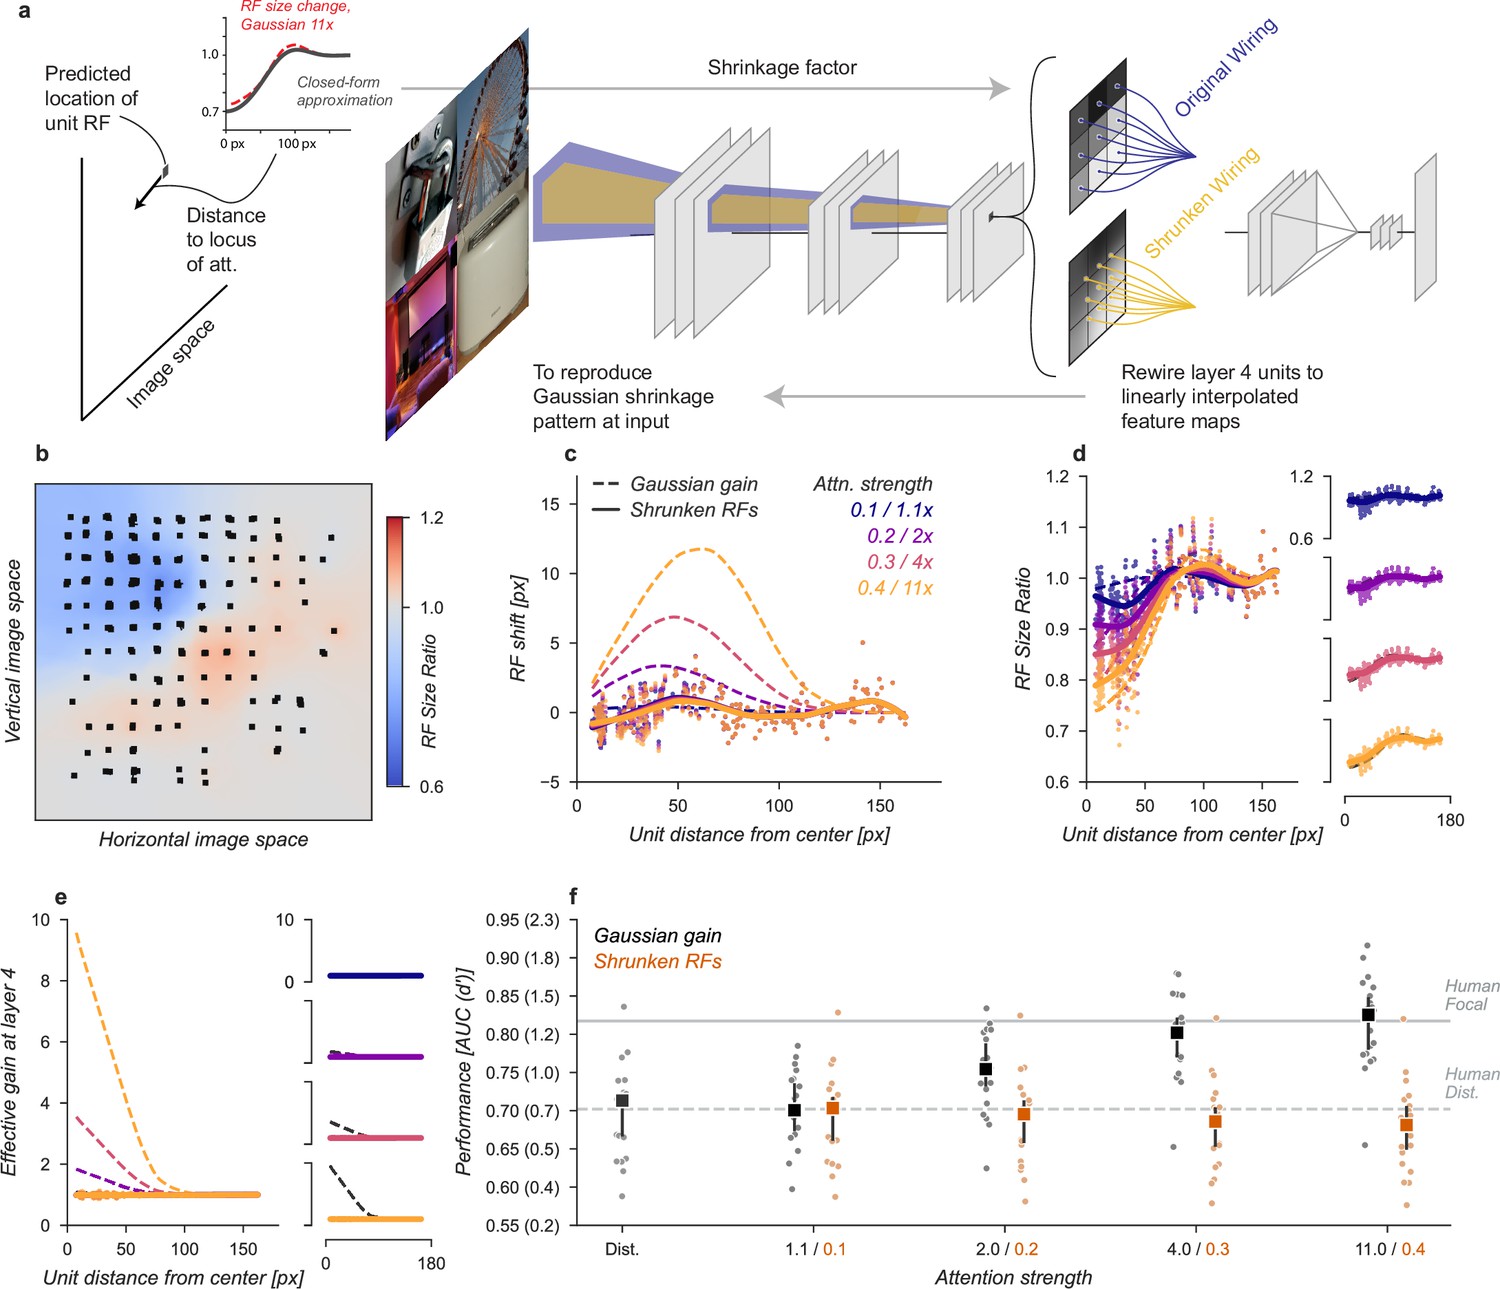
(a) To create shrinkage at layer 4 matched with the effects observed under Gaussian gain we re-assigned the connections between layers 3 and 4 according to a parameterized approximation of the shrinkage effect as a function of distance from the locus of attention. This re-scaling of connections changed the size of receptive fields without moving them in space or modifying their gain. (b–f) conventions as in previous figures.
Figure 7
Gain-only model.
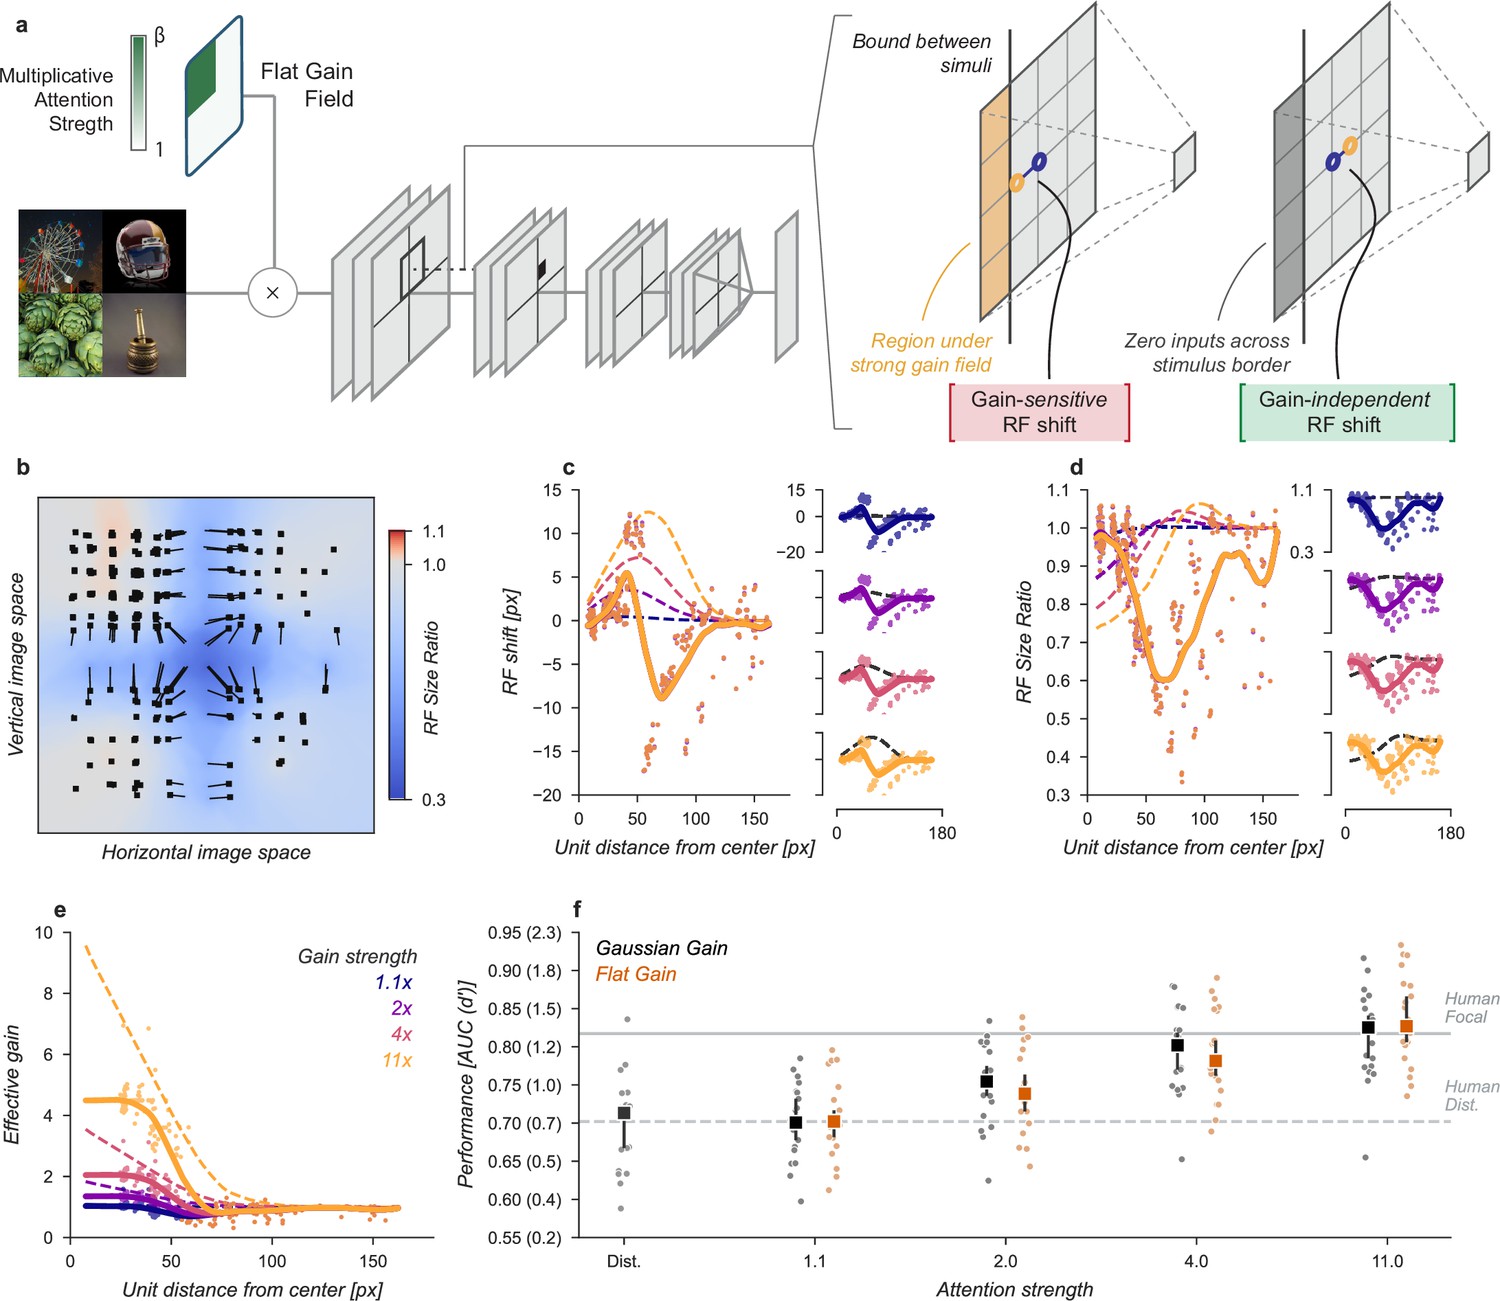
(a) To create a gain effect without modifying the receptive fields of units, we applied a flattened gain field, with the gain set to the average of the original Gaussian gain for each attention strength. The flat gain alone causes units to shift their receptive field at the boundary between the four stimulus quadrants. To modify gain while ensuring shifts were gain-independent, we computed the four quadrants separately with zero padding and then concatenated the results. (b–f) Conventions as in previous figures.
Figure 8 with 2 supplements
Gain is both necessary and sufficient to explain the improved task performance due to cued attention.
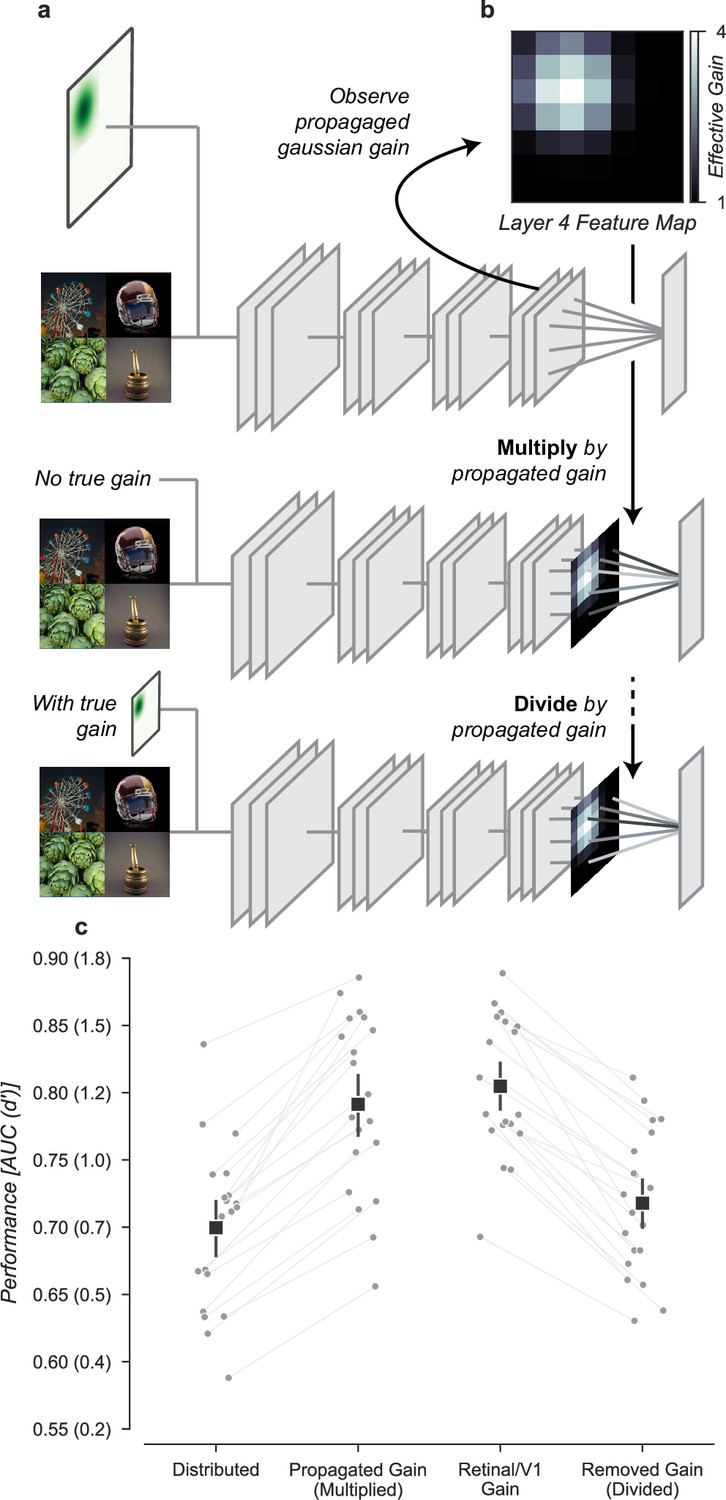
(a) To test necessity and sufficiency of gain on performance, we propagated the effect of Gaussian gain through the model and measured the effective gain at the output layer. (b) We averaged the effective gain across features to obtain a ‘propagated gain map’. To test sufficiency, we multiplied the output of a model with no true gain by the propagated gain map. To test necessity, we divided the output of a model with true gain by the propagated gain map. (c) Multiplying the output by the propagated gain recovered the effect of Gaussian gain, while dividing removed this effect, confirming that gain was both necessary and sufficient to account for the change in task performance. Grey markers show the individual category performance, black markers the median across categories (n=20) and error bars the 95% confidence intervals.
Figure 8—figure supplement 1

Direct readout from the cued quadrant improves performance alone, with no additional improvement from gain.
Figure 8—figure supplement 2

Gain propagation can account for changes in discrimination task performance due to Gaussian gain.
Tables
Table 1
Category pairs for the discrimination task.
| Pair | Category A | Category B |
|---|---|---|
| 0 | Ferris wheel | Analog clock |
| 1 | Artichoke | Bakery |
| 2 | Banana | Bathtub |
| 3 | Cabbage butterfly | Coffee |
| 4 | Computer | Football helmet |
| 5 | Garden spider | Greenhouse |
| 6 | Home theatre | Long-horned beetle |
| 7 | Mortar | Padlock |
| 8 | Paintbrush | Seashore |
| 9 | Stone wall | Toaster |
Table 2
CORnet-Z structure.
Average receptive field (RF) full-width at half-maximum (FWHM) is measured using ellipses fit to the backpropagated gradients of units in a convolutional layer with respect to the input image pixels. 22.4 pixels corresponds to one degree of visual angle (Kubilius et al., 2018).
| Layer Type | Kernel Size | Output Shape | FWHM (px, deg) | |
|---|---|---|---|---|
| Input | 224 × 224 × 3 | |||
| V1 Block | conv, stride = 2 | 7×7 | 112 × 112 × 64 | 11 (0.5) |
| ReLU | 56 × 56 × 64 | |||
| max pool | 2×2 | 56 × 56 × 64 | ||
| V2 Block | conv | 3×3 | 56 × 56 ×128 | 26.8 (1.21) |
| ReLU | 28 × 28 ×128 | |||
| max pool | 2×2 | 28 × 28 ×128 | ||
| V4 Block | conv | 3×3 | 28 × 28 × 256 | 55.6 (2.52) |
| ReLU | 14 × 14 × 256 | |||
| max pool | 2×2 | 14 × 14 × 256 | ||
| IT Block | conv | 3×3 | 14 × 14 × 512 | 111.4 (5.06) |
| ReLU | 7 × 7 × 512 | |||
| max pool | 2×2 | 7 × 7 × 512 | ||
| Encodings | avg. pool | 1 × 1 × 512 |
Additional files
Download links
A two-part list of links to download the article, or parts of the article, in various formats.
Downloads (link to download the article as PDF)
Open citations (links to open the citations from this article in various online reference manager services)
Cite this article (links to download the citations from this article in formats compatible with various reference manager tools)
Gain, not concomitant changes in spatial receptive field properties, improves task performance in a neural network attention model
eLife 12:e78392.
https://doi.org/10.7554/eLife.78392


