Isoform-specific mutation in Dystonin-b gene causes late-onset protein aggregate myopathy and cardiomyopathy
- Division of Neurobiology and Anatomy, Graduate School of Medical and Dental Sciences, Niigata University, Japan
- Transdisciplinary Research Programs, Niigata University, Japan
- Department of Physiology, School of Dentistry, Iwate Medical University, Japan
- Medical AI Center, School of Medicine, Niigata University, Japan
- Department of Nursing, Niigata College of Nursing, Japan
- Electron Microscope Laboratory, Keio University, Japan
- Department of Neuromuscular Research, National Institute of Neuroscience, National Center of Neurology and Psychiatry, Japan
- Division of Microscopic Anatomy, Graduate School of Medical and Dental Sciences, Niigata University, Japan
- Center for Coordination of Research Facilities, Niigata University, Japan
Figures
Figure 1 with 3 supplements

Generation of Dst-bE2610Ter mutant mouse line.
(A) The protein structure of Dst isoforms. The Dst-bE2610Ter allele has the mutation between the plakin repeat domain (PRD) and the spectrin repeats. The DstGt allele has the gene trap cassette within the actin-binding domain (ABD) shared by Dst-a and Dst-b isoforms. EB-BD, EB-binding domain; EFh, EF hand-calcium binding domains; GAR, growth arrest-specific protein 2-related domain; IFBD, intermediate filament-binding domain; MTBD, microtubule-binding domain. (B) A schematic representation of the Dst transcripts. The part of Dst-b-specific exons is enlarged, showing the mutation sites of the Dst-bE2610Ter allele. The nonsense mutation and XhoI recognition sequence are inserted within the Dst-b-specific exon. The primer-annealing sites are indicated by arrows. (C) PCR-restriction fragment length polymorphism (RFLP) genotyping to distinguish WT, Dst-bE2610Ter heterozygotes (Het), and Dst-bE2610Ter homozygotes (Homo). PCR products from Dst-bE2610Ter alleles are cut by XhoI. (D) Western blot analysis using the Dst antibody in lysates from the skeletal muscle (hindlimb muscle), heart, and brain (n = 3 mice, each genotype). Truncated Dst bands (arrowheads) were detected in the skeletal muscle and heart of Dst-bE2610Ter/E2610Ter mice. Dst bands in the brain were unchanged between WT and Dst-bE2610Ter/E2610Ter. Glyceraldehyde-3-phosphate dehydrogenase (Gapdh) was used as an internal control. (E) Quantitative PCR (qPCR) data of Dst-a and Dst-b mRNAs in the heart (n = 3 mice, each genotype). * denotes statistically significant difference at p<0.05 (Dst-b, p=0.0479) and ns means not statistically significant (Dst-a, p=0.4196), using Student’s t-test. Data are presented as mean ± standard error (SE). Similar truncations of the Dst protein in three independent Dst-bE2610Ter mouse lines are shown in Figure 1—figure supplement 1. The expression level of three N-terminal Dst isoforms is shown in Figure 1—figure supplement 2. qPCR data of Dst isoforms in the soleus are shown in Figure 1—figure supplement 3.
Figure 1—figure supplement 1
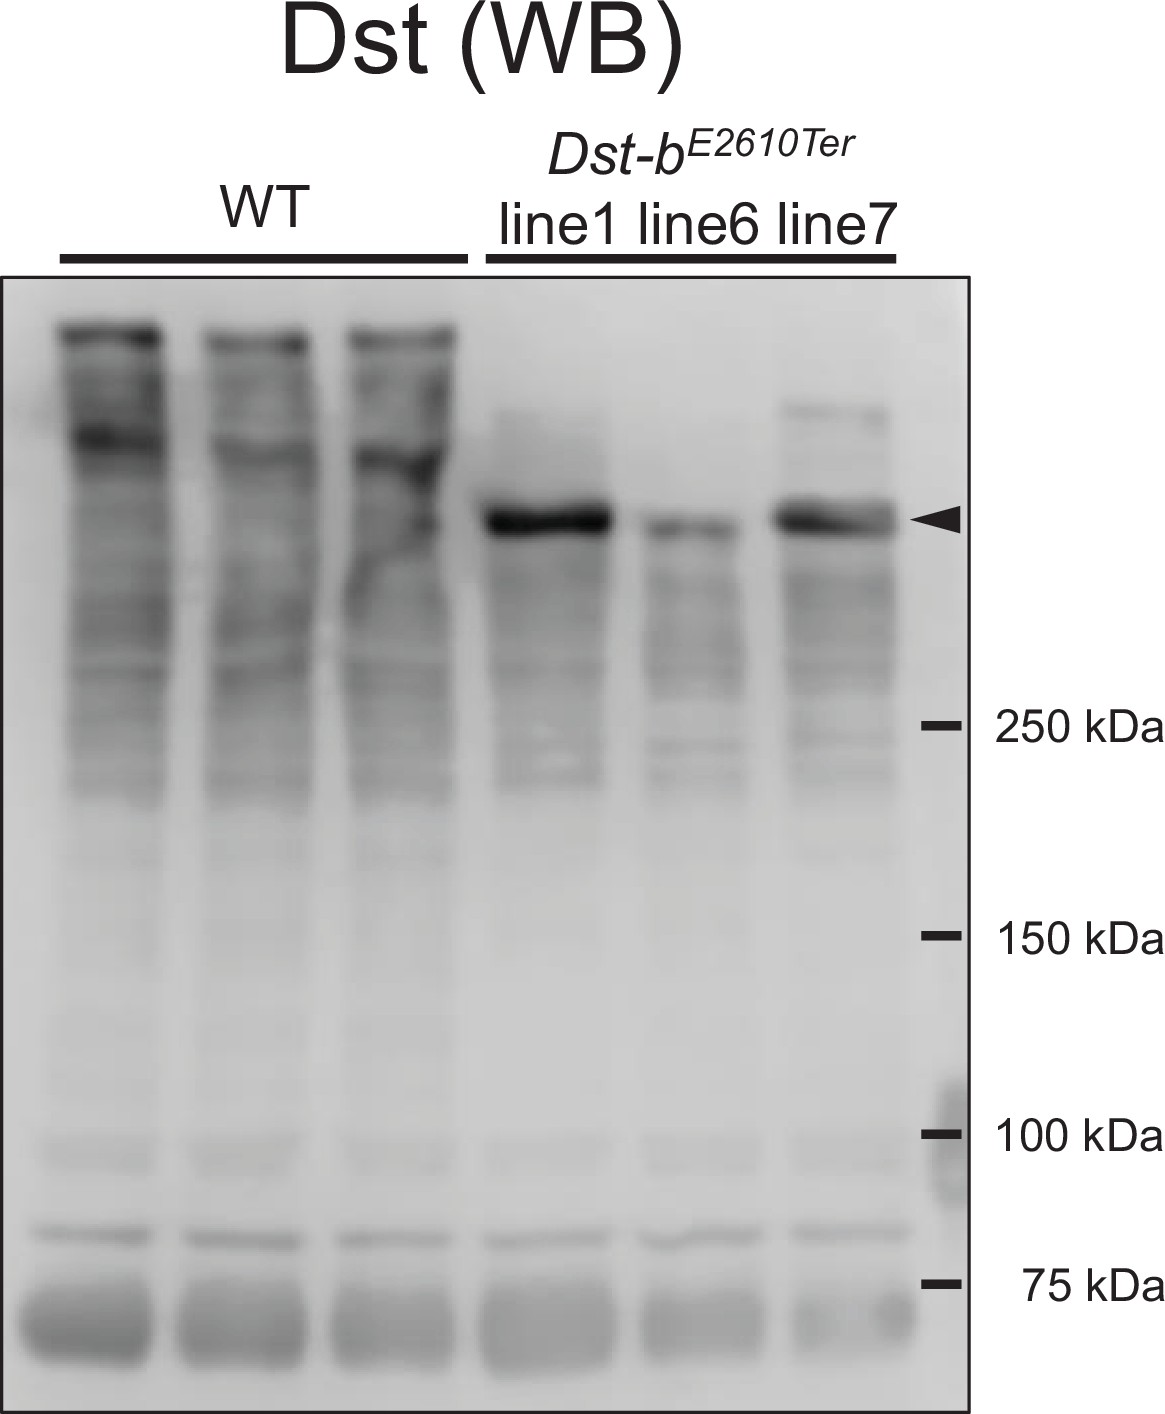
Expressions of truncated Dst-b from three Dst-bE2610Ter alleles.
Western blot analysis using the anti-Dst antibody in the heart lysate from WT and Dst-bE2610Ter/E2610Ter mice. Here we generated three Dst-bE2610Ter mouse lines #1, #6, and #7. The original Dst bands were detected in the heart of WT. Truncation of the Dst bands equally occurred in all Dst-bE2610Ter homozygotes (arrowheads). Positions of molecular weights markers in kDa are shown on the right.
Figure 1—figure supplement 2
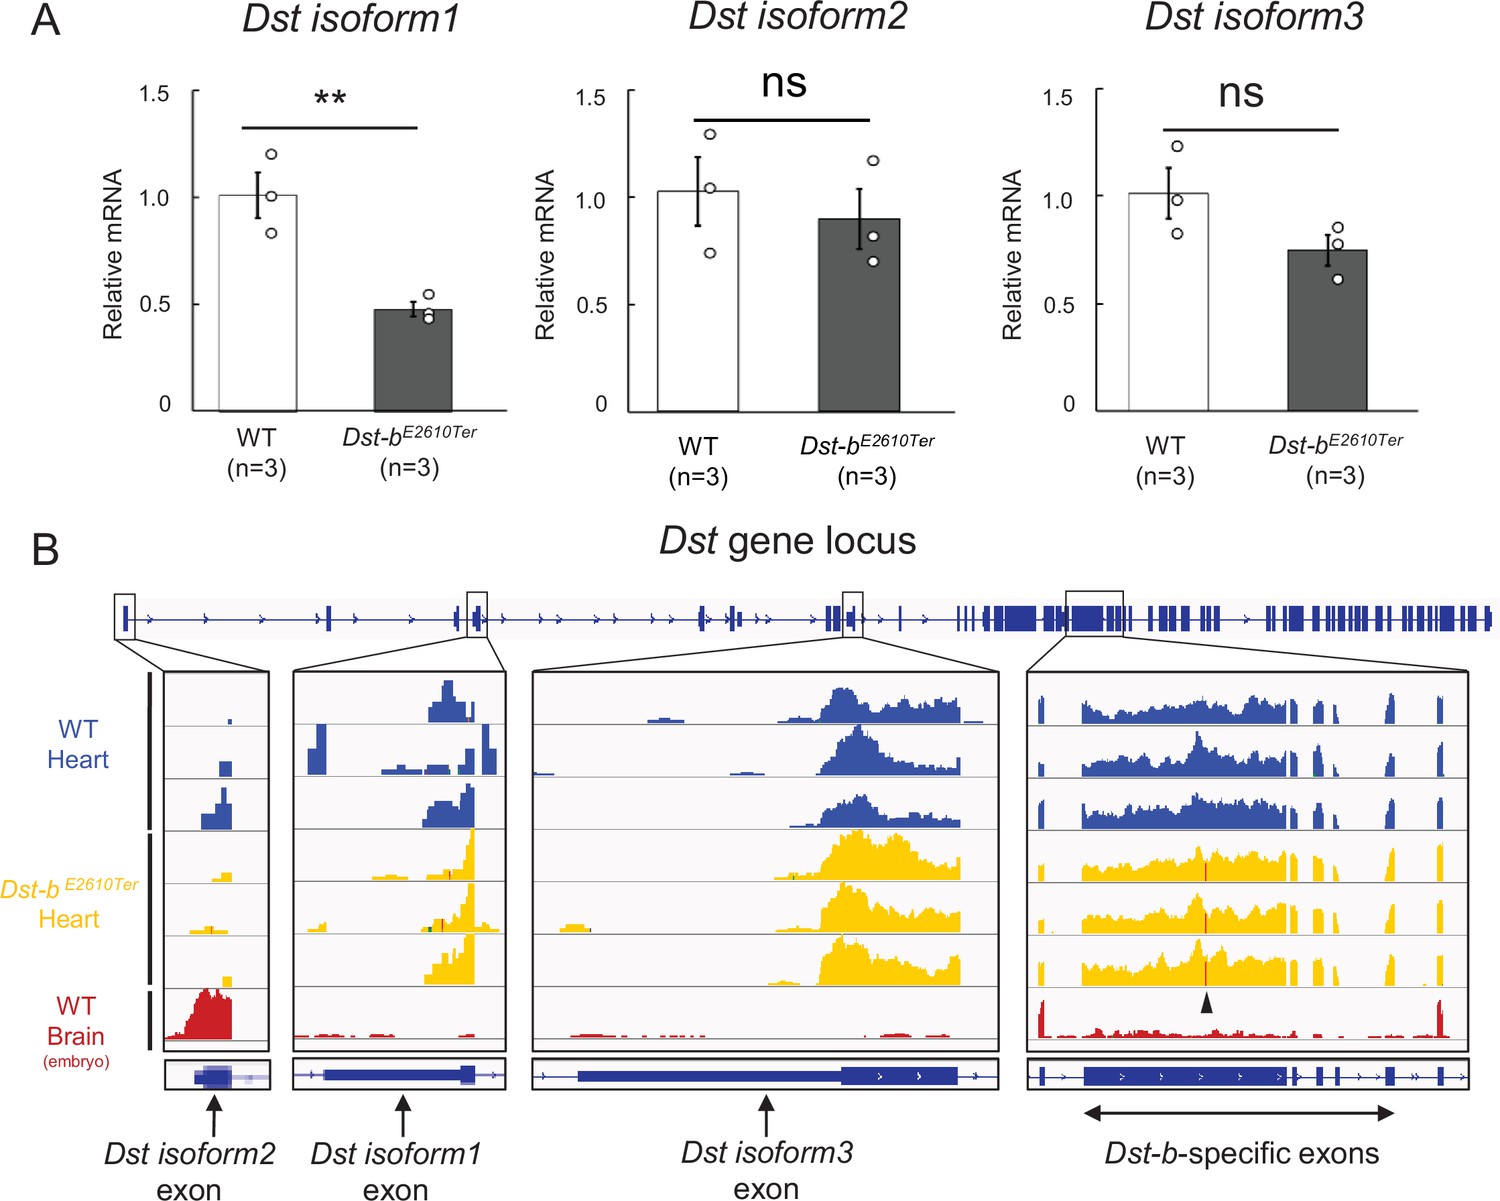
Expressions for N-terminal isoforms of Dst in the cardiac tissue.
(A) Quantification of mRNA levels of N-terminal Dst isoforms 1, 2, and 3 in the cardiac tissue using qPCR (n = 3 WT, n = 3 Dst-bE2610Ter/E2610Ter, over 20 months of ages). ** denotes statistically significant difference at p<0.01 (isoform 1, p=0.0091). ns means not statistically significant (isoform 2, p=0.5780; isoform 3, p=0.1273), using Student’s t-test. Data are presented as mean ± SE. (B) RNA-seq data of WT heart, Dst-bE2610Ter/E2610Ter heart, and embryonic WT brain. Integrative Genomics Viewer (IGV) image showing the coverage across first exons of Dst isoforms 1, 2, and 3, and, Dst-b-specific five exons. Arrowhead in coverages of Dst-b-specific exon points the position of the nonsense mutation in the Dst-bE2610Ter allele. RNA-seq data of embryonic brain were already disclosed in the previous study (Hayakawa-Yano and Yano, 2019; GSE123927).
Figure 1—figure supplement 3
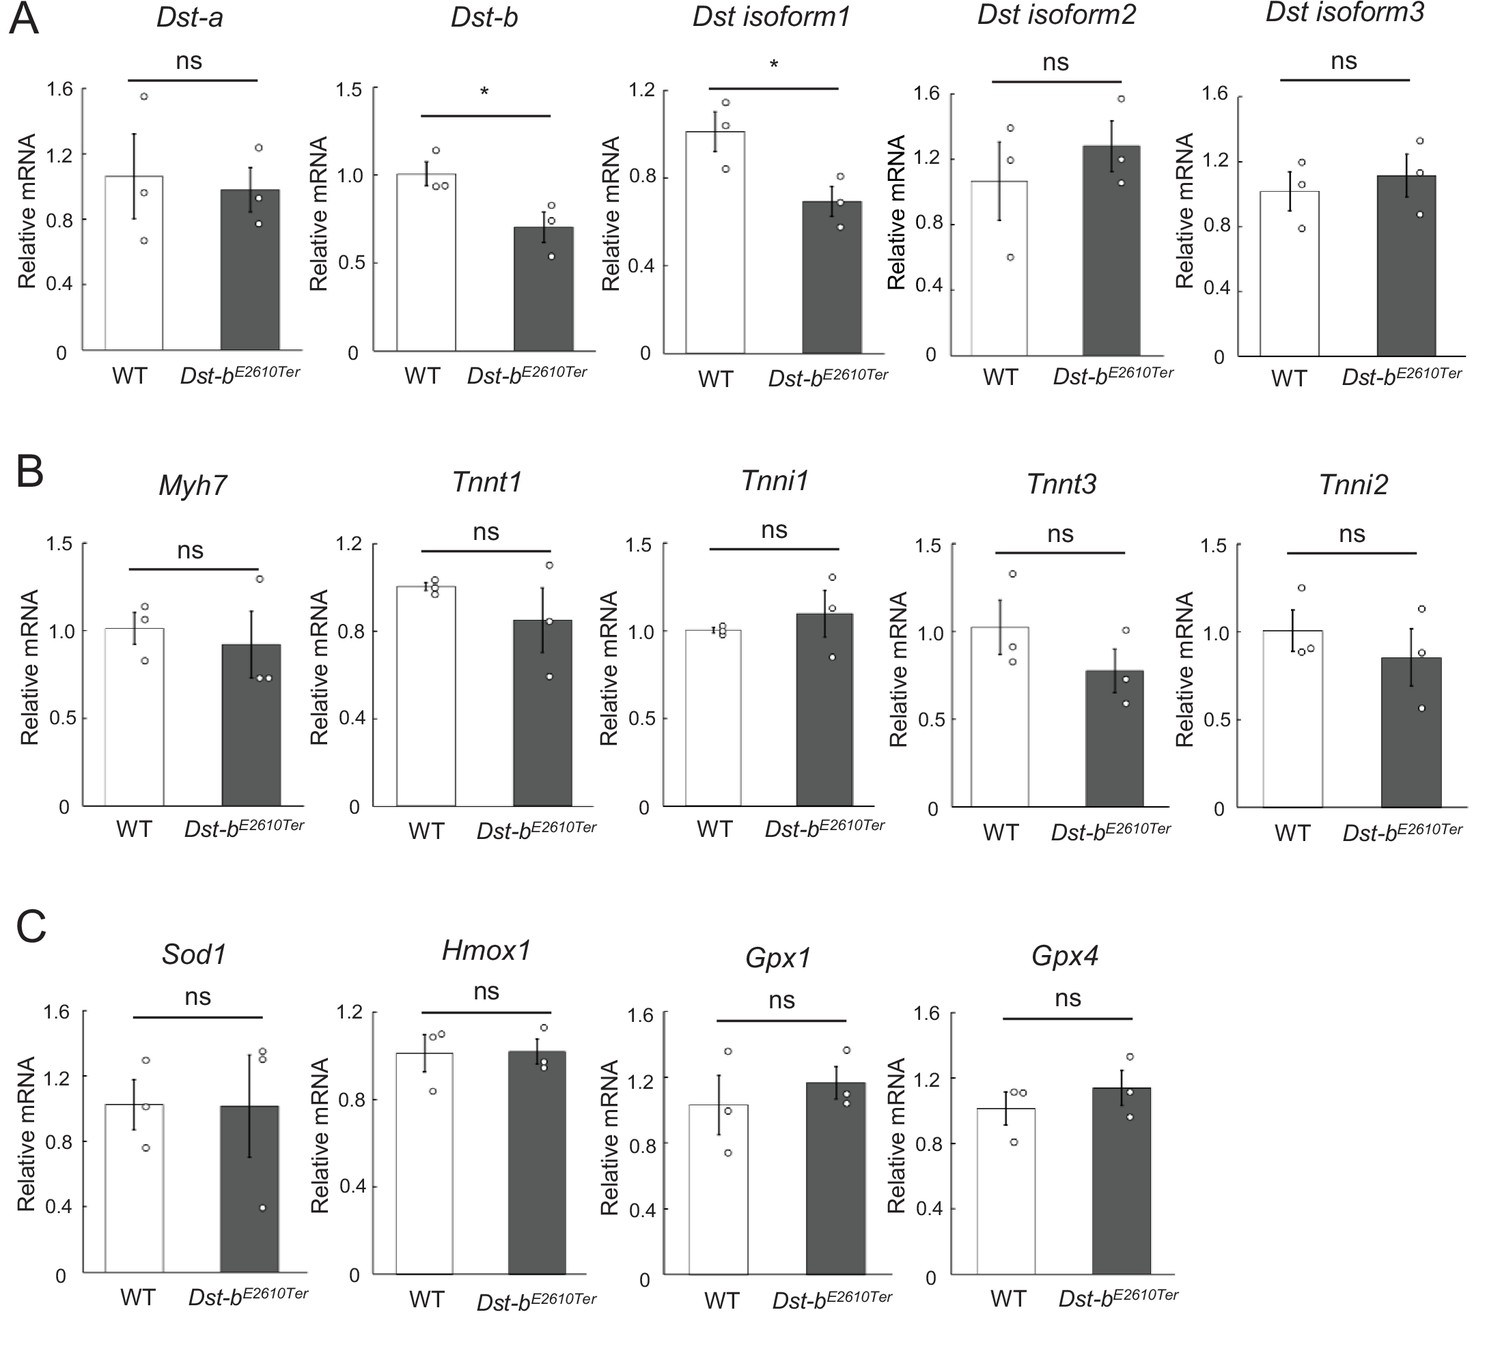
Quantification of mRNA levels in the soleus.
(A–C) qPCR data of Dst isoforms (A), marker genes for muscle fiber type (B), and oxidative stress-responsive genes (C) in the soleus (n = 3 mice, each genotype, 21 months of age). * denotes statistically significant difference at p<0.05 (Dst-b, p=0.0493; isoform 1, p=0.0463). ns means not statistically significant (Dst-a, p=0.7958; isoform 2, p=0.4924; isoform 3, p=0.6137; Myh7, p=0.6873; Tnnt1, p=0.3583; Tnni1, p=0.5180; Tnnt3, p=0.2769; Tnni2, p=0.4896; Sod1, p=0.9806; Hmox1, p=0.9463; Gpx1, p=0.5413; Gpx4, p=0.4429), using Student’s t-test. Data were presented as mean ± SE.
Figure 2

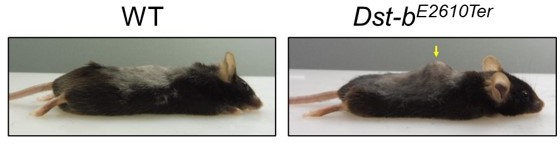
Characterizations of gross phenotypes of Dst-bE2610Ter homozygous mice.
(A) Tail suspension test of WT, Dst-bE2610Ter/E2610Ter, and DstGt/Gt mice around 1 month old. WT and Dst-bE2610Ter/E2610Ter mice exhibited normal posture, whereas the DstGt/Gt mice showed hindlimb clasping. (B) Muscle spindle structure on the cross sections of soleus with H&E staining. Muscle spindles of Dst-bE2610Ter/E2610Ter mice appeared normal, while DstGt/Gt mice showed atrophy of the intrafusal muscle fiber in muscle spindles around 1 month old. (C) Double immunohistochemistry (IHC) of neurofilament (NF) and ATF3 on the sections of dorsal root ganglia (DRG) around 1 month old. In only DstGt/Gt mice, NF was accumulated in some DRG neurons, and the neural injury marker, ATF3 was expressed. (D, E) Quantitative data of numbers of NF-accumulating cells (D) and ATF3-positive cells (E) in DRG of WT, Dst-bE2610Ter/E2610Ter, and DstGt/Gt mice (n = 6 WT mice; n = 3 Dst-bE2610Ter/E2610Ter mice; n = 3 DstGt/Gt mice). *** denotes statistically significant difference at p<0.005 (NF, WT vs. DstGt/Gt, p=0.0000; Dst-bE2610Ter/E2610Ter vs. DstGt/Gt, p=0.0001; ATF3, WT vs. DstGt/Gt, p=0.0001; Dst-bE2610Ter/E2610Ter vs. DstGt/Gt, p=0.0002), using ANOVA. (F) Parvalbumin (PV) ISH on the section of DRG around 1 month old. PV-positive proprioceptive neurons were greatly decreased in DRG of DstGt/Gt mice but not in that of Dst-bE2610Ter/E2610Ter mice. Dotted lines indicate the edge of DRG. (G) Quantitative data of number of PV-positive cells in DRG of WT, Dst-bE2610Ter/E2610Ter, and DstGt/Gt mice (n = 6 WT mice; n = 3 Dst-bE2610Ter/E2610Ter mice; n = 3 DstGt/Gt mice). *** denotes statistically significant difference at p<0.005 (PV, WT vs. DstGt/Gt, p=0.0000; Dst-bE2610Ter/E2610Ter vs. DstGt/Gt, p=0.0002), using ANOVA. (H) Male Dst-bE2610Ter/E2610Ter mice normally gained body weight until 1 year old and then became lighter than male WT mice (n = 6 WT mice; n = 7 Dst-bE2610Ter/E2610Ter mice; two-way ANOVA, genotype effect: p=0.1213; age effect: p=0.0000; genotype × age interaction: p=0.0398). * and ** denote statistically significant difference at p<0.05 (13 months old, p=0.0197; 15 months old, p=0.0296) and p<0.01 (16 months old, p=0.0073). (I) Behavior tests to assess motor coordination and grip strength around 1 year old. Dst-bE2610Ter/E2610Ter mice showed normal motor coordination and grid strength (n = 11 WT mice; n = 10 Dst-bE2610Ter/E2610Ter mice). ns means not statistically significant (rotarod test, p=0.4126; fire hang test, p=0.0612), using Student’s t-test. Data are presented as mean ± standard error (SE). Scale bars: (B) 5 μm; (C, D) 50 μm.
Figure 3 with 2 supplements

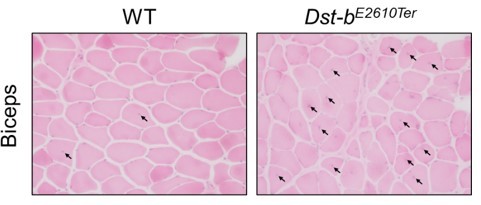
Pathological alterations in skeletal and cardiac muscles of Dst-bE2610Ter mice.
(A) H&E-stained cross soleus sections of WT and Dst-bE2610Ter/E2610Ter mice at 23 months of age. Dotted boxes in the soleus of Dst-bE2610Ter/E2610Ter include small-caliber and centrally nucleated fibers (CNFs, arrows) shown as insets. Histological analysis of soleus of Dst-bE2610Ter/E2610Ter mice at 3–4 months of age are shown in Figure 3—figure supplement 1. Histological analysis of gastrocnemius and erector spinae is shown in Figure 3—figure supplement 2. (B) Quantitative data representing percentages of CNFs in the soleus (n = 5 mice, each genotype), gastrocnemius (n = 5 WT mice; n = 6 Dst-bE2610Ter/E2610Ter mice), and erector spinae (n = 3 WT mice; n = 3 Dst-bE2610Ter/E2610Ter mice). * and *** denote statistically significant difference at p<0.05 (gastrocnemius, p=0.0118), and p<0.005 (soleus, p=0.0009; erector spinae, p=0.0044), using Student’s t-test. (C) Distribution of cross-sectional area in the soleus of WT and Dst-bE2610Ter/E2610Ter mice (n = 5 mice, each genotype, at 16–23 months old; two-way ANOVA; genotype effect: p=0.0133; area effect: p=0.0000; genotype × area interaction: p=0.2032). (D) Masson’s trichrome staining showed a fibrosis in the soleus and heart of Dst-bE2610Ter/E2610Ter mice at 16 months of age (arrowheads). (E) Quantitative data of the extent of fibrosis in soleus and heart of WT and Dst-bE2610Ter/E2610Ter mice (n = 5 mice, each genotype, at 16–23 months old). * and *** denote statistically significant difference at p<0.05 (p=0.0109) and p<0.005 (p=0.0045), using Student’s t-test. (F) Nppa and Nppb ISH in the heat at 16 months of age. Nppa mRNA was upregulated in the myocardium of left ventricle (LV) of Dst-bE2610Ter/E2610Ter mice, but not in the right ventricle (RV). Dotted areas are shown as insets. Nppa mRNA was strongly expressed in the myocardium of left atrium (LA) and right atrium (RA). Insets below represents Nppb mRNA the in same regions. (G, H) qPCR analyses on cardiac stress markers (G) and profibrotic cytokines (H) (n = 3 mice, each genotype, at 20–25 months old). * and ** denote statistically significant difference at p<0.05 (Nppa, p=0.0119; Tgfb2, p=0.0149) and p<0.01 (Nppb, p=0.0053; Ctgf, p=0.0095), using Student’s t-test. (I) Representative electrocardiogram (ECG) images of P-QRS-T complex. (J) Intervals of RR, QRS, and QT were quantified (n = 5 WT mice; n = 9 Dst-bE2610Ter/E2610Ter mice, at 18–25 months old). *** denotes statistically significant difference at p<0.005 (QT, p=0.0044) and ns means not statistically significant (RR, p=0.2000; QRS, p=0.8964), using Student’s t-test. (K) Premature ventricular contractions (PVC, arrows) were recorded in short-range (left panel) and long-range (right panel) ECG images from a Dst-bE2610Ter/E2610Ter mouse. Data are presented as mean ± SE. Scale bars: (A (left images), D) 50μm; (A (right magnified images)) 5 μm; (F) 1mm; (F (magnified images)) 200 μm.
Figure 3—figure supplement 1
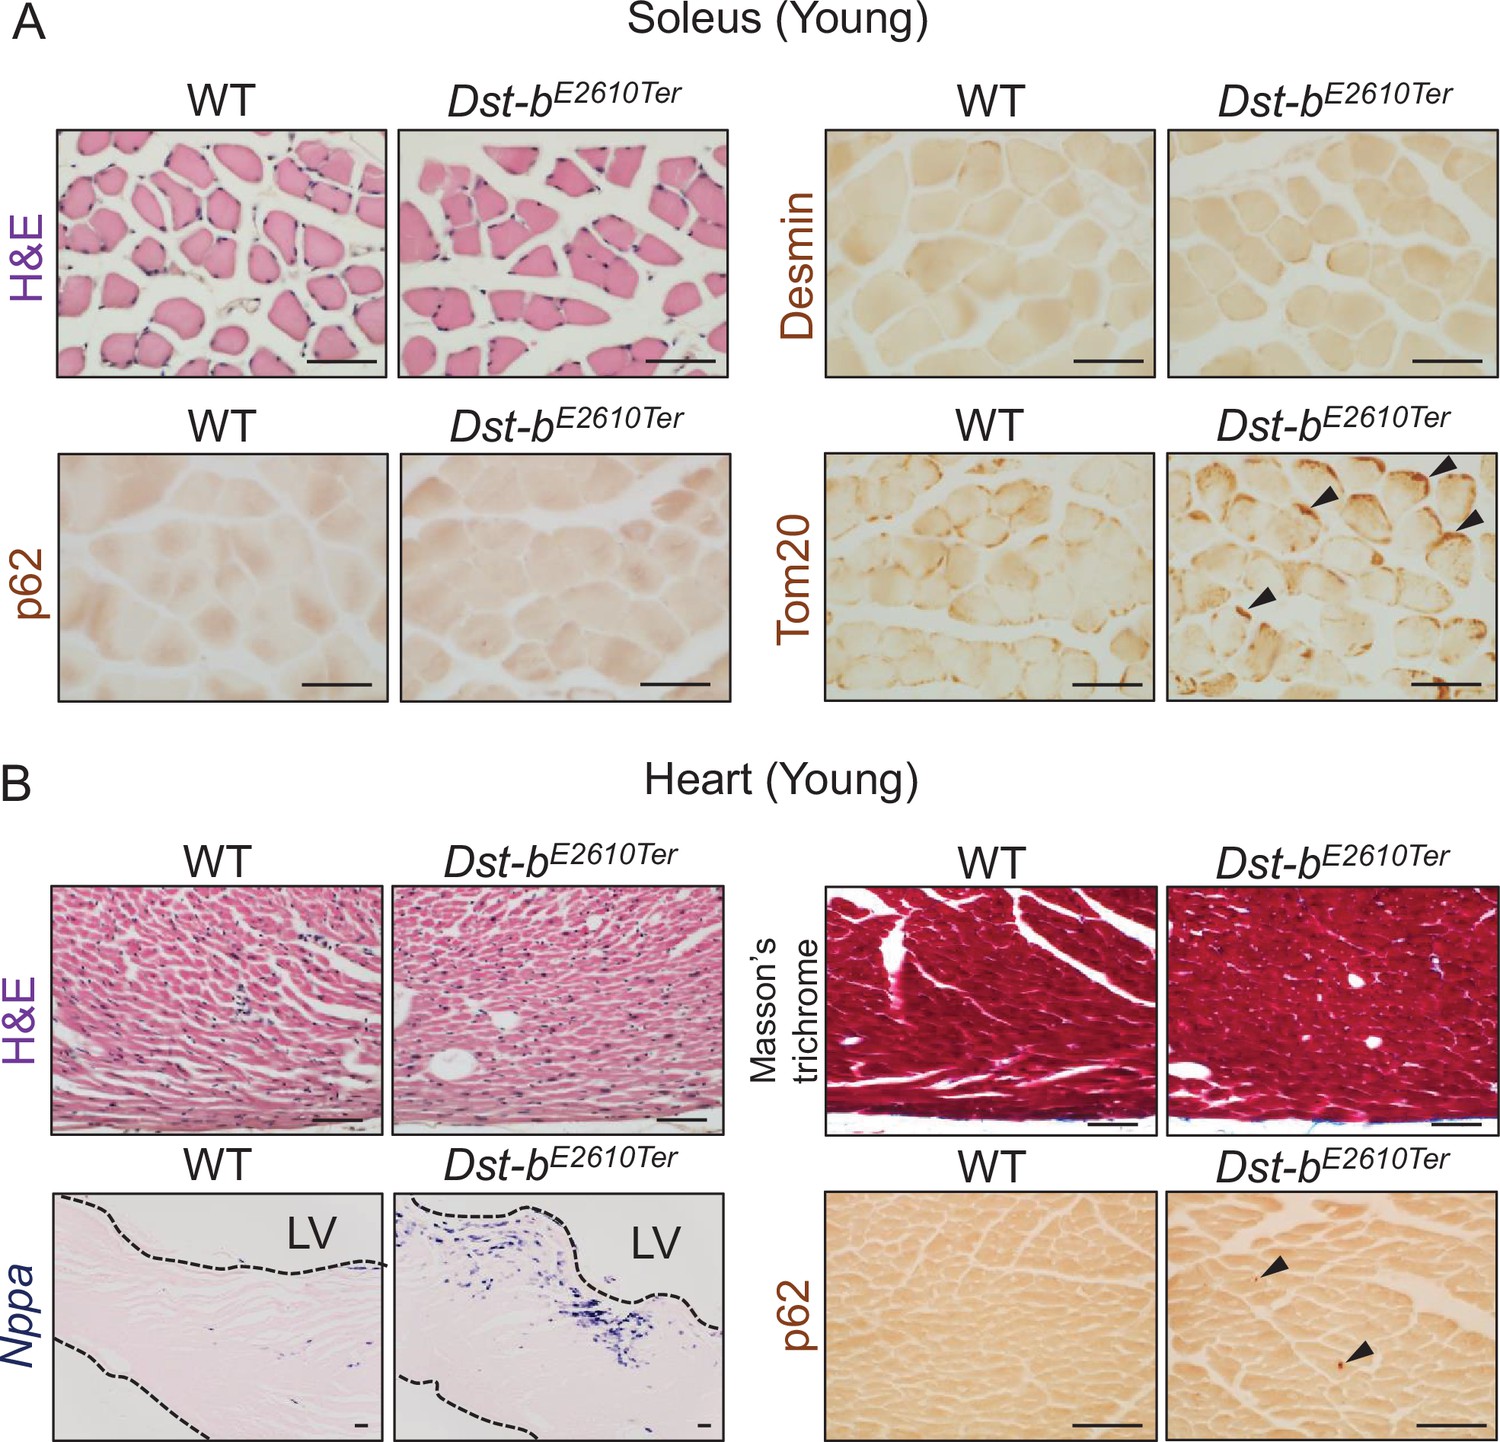
Histological analysis in the soleus and heart of young Dst-bE2610Ter mice.
(A) Histological analyses in the soleus of young mice at 3–4 months of age (n = 3 mice, each genotype). H&E staining showed normal histological features in the soleus of Dst-bE2610Ter/E2610Ter mice. Immunolabeling with anti-desmin antibody (RD301) and anti-p62 antibody did not stain any protein aggregates. Tom20-immunolabeled mitochondria densely distributed in subsarcolemmal spaces of Dst-bE2610Ter/E2610Ter soleus (arrowheads), compared with WT soleus. (B) Histological analyses in the heart of young mice at 3–4 months of age (n = 3 mice, each genotype). H&E staining and Masson’s trichrome staining showed normal histological features and no sign of fibrosis in the heart of Dst-bE2610Ter/E2610Ter mice. Nppa mRNA and p62-immunopositive depositions (arrowheads) were slightly increased in the left ventricular (LV) myocardium of Dst-bE2610Ter/E2610Ter mice. Scale bars: 50 μm.
Figure 3—figure supplement 2
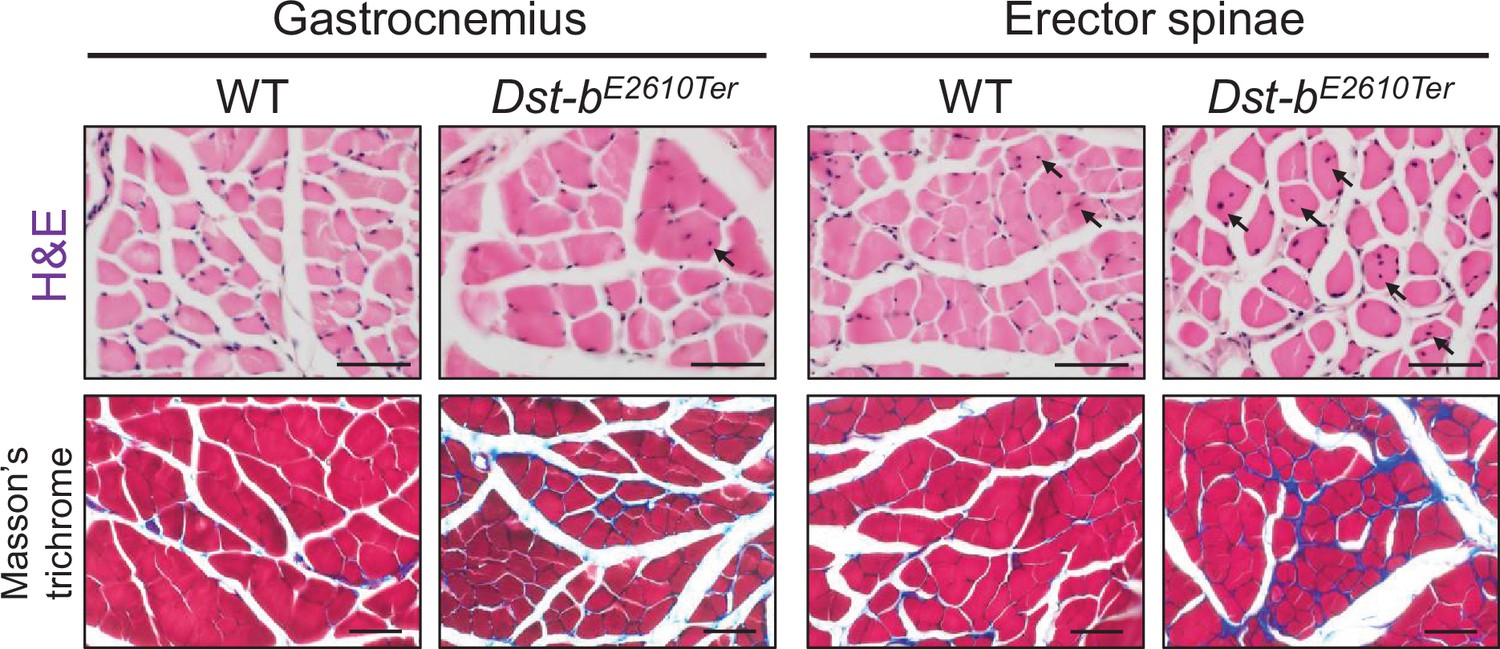
Histological analysis in gastrocnemius and erector spinae of Dst-bE2610Ter mice.
H&E-stained cross sections of gastrocnemius and erector spinae from WT and Dst-bE2610Ter/E2610Ter mice (upper panels). Centrally nucleated fibers (CNFs) are pointed by arrows. Masson’s trichrome staining showed an increase of the connective tissue surrounding muscle fibers in the sections of gastrocnemius and erector spinae of Dst-bE2610Ter/E2610Ter mice (lower panels). Scale bars: 50 μm.
Figure 4 with 2 supplements
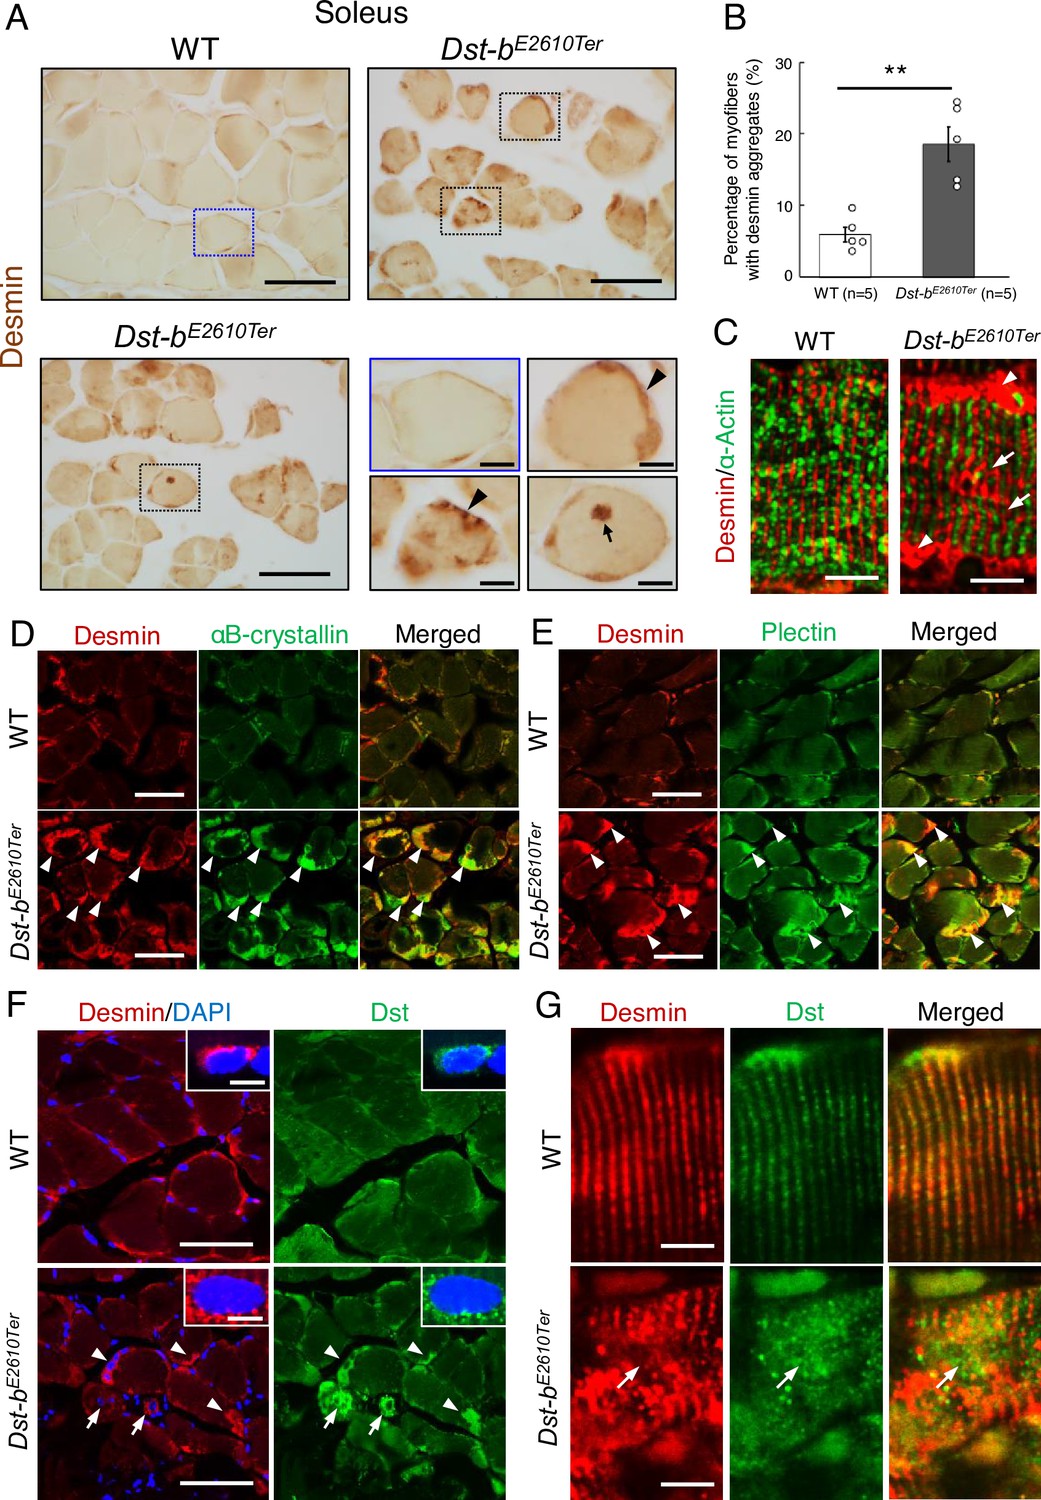
Dst-bE2610Ter mutation leads to protein aggregation myopathy.
(A) Desmin immunohistochemistry (IHC) on the cross sections of soleus from WT and Dst-bE2610Ter/E2610Ter mice at 23 months of age using anti-desmin antibody (RD301). Dotted boxes in Dst-bE2610Ter/E2610Ter soleus indicate desmin aggregates underneath the sarcolemma (arrowheads) and in the sarcoplasmic region (arrow) shown as insets. Desmin IHC on heart of Dst-bE2610Ter/E2610Ter mice is shown in Figure 4—figure supplement 1. (B) Quantitative data of the percentage of myofibers with desmin aggregates in soleus of WT and Dst-bE2610Ter/E2610Ter mice (n = 5 mice, each genotype, at 16–23 months old). ** denotes statistically significant difference at p<0.01 (p=0.0051), using Student’s t-test. Data are presented as mean ± SE. (C) Immunofluorescent images of longitudinal soleus sections labeled with anti-desmin (rabbit IgG) and anti-alpha-actin antibodies. Muscle fibers harboring subsarcolemmal desmin aggregates (arrowheads) showed the Z-disk displacement (arrows). (D, E) Double IHC using anti-desmin (RD301) and anti-αB-crystallin antibodies (D) or anti-desmin (Rabbit IgG) and anti-plectin antibodies (E) on the cross sections of soleus. In Dst-bE2610Ter/E2610Ter soleus, αB-crystallin and plectin were accumulated in subsarcolemmal regions with desmin (white arrowheads). Images of myotilin, a Z-disk component, are shown in Figure 4—figure supplement 2. (F) Double IHC using anti-desmin antibody and anti-Dst antibody on cross sections of WT and Dst-bE2610Ter/E2610Ter soleus. Dst protein accumulated in subsarcolemmal desmin aggregates (white arrowheads). Dst protein was also accumulated around myonuclei-labeled with DAPI (arrows). Insets show localizations of desmin and Dst proteins around nuclei. (G) Double IHC of desmin and Dst. In longitudinal soleus sections, Dst protein was distributed in a striped pattern at desmin-positive Z-disks. In Dst-bE2610Ter/E2610Ter soleus sections, Dst protein was dispersed around displaced Z-disks (arrows). Scale bars: (A, D, E, F) 50μm; (A (magnified images), C, F (insets), G) 5μm.
Figure 4—figure supplement 1
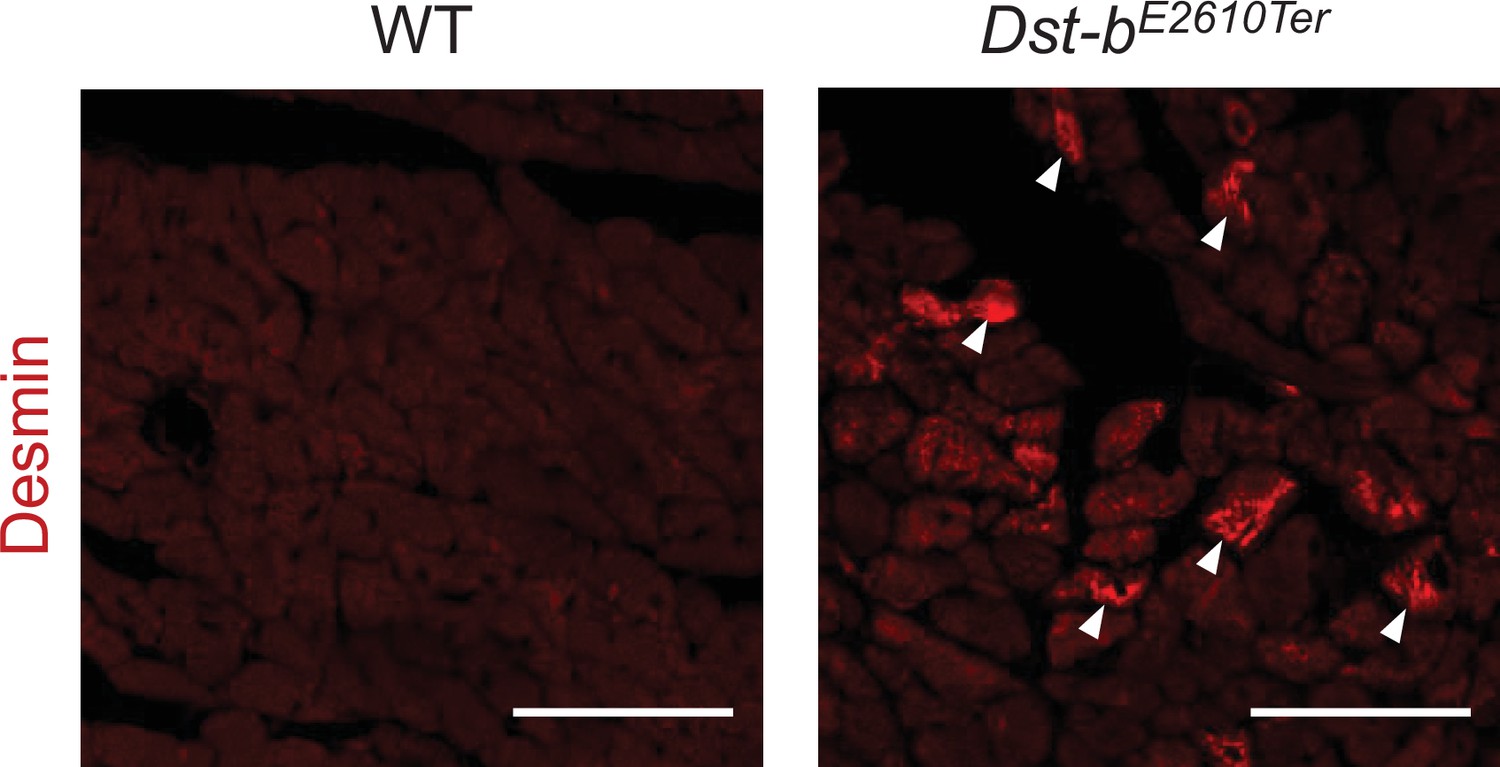
Desmin immunohistochemistry (IHC) on the sections of heart from WT and Dst-bE2610Ter/E2610Ter mice at 23 months of age using anti-desmin antibody (RD301).
Desmin was accumulated in cardiomyocytes of Dst-bE2610Ter/E2610Ter mice (arrowheads). Scale bars: 50 μm.
Figure 4—figure supplement 2
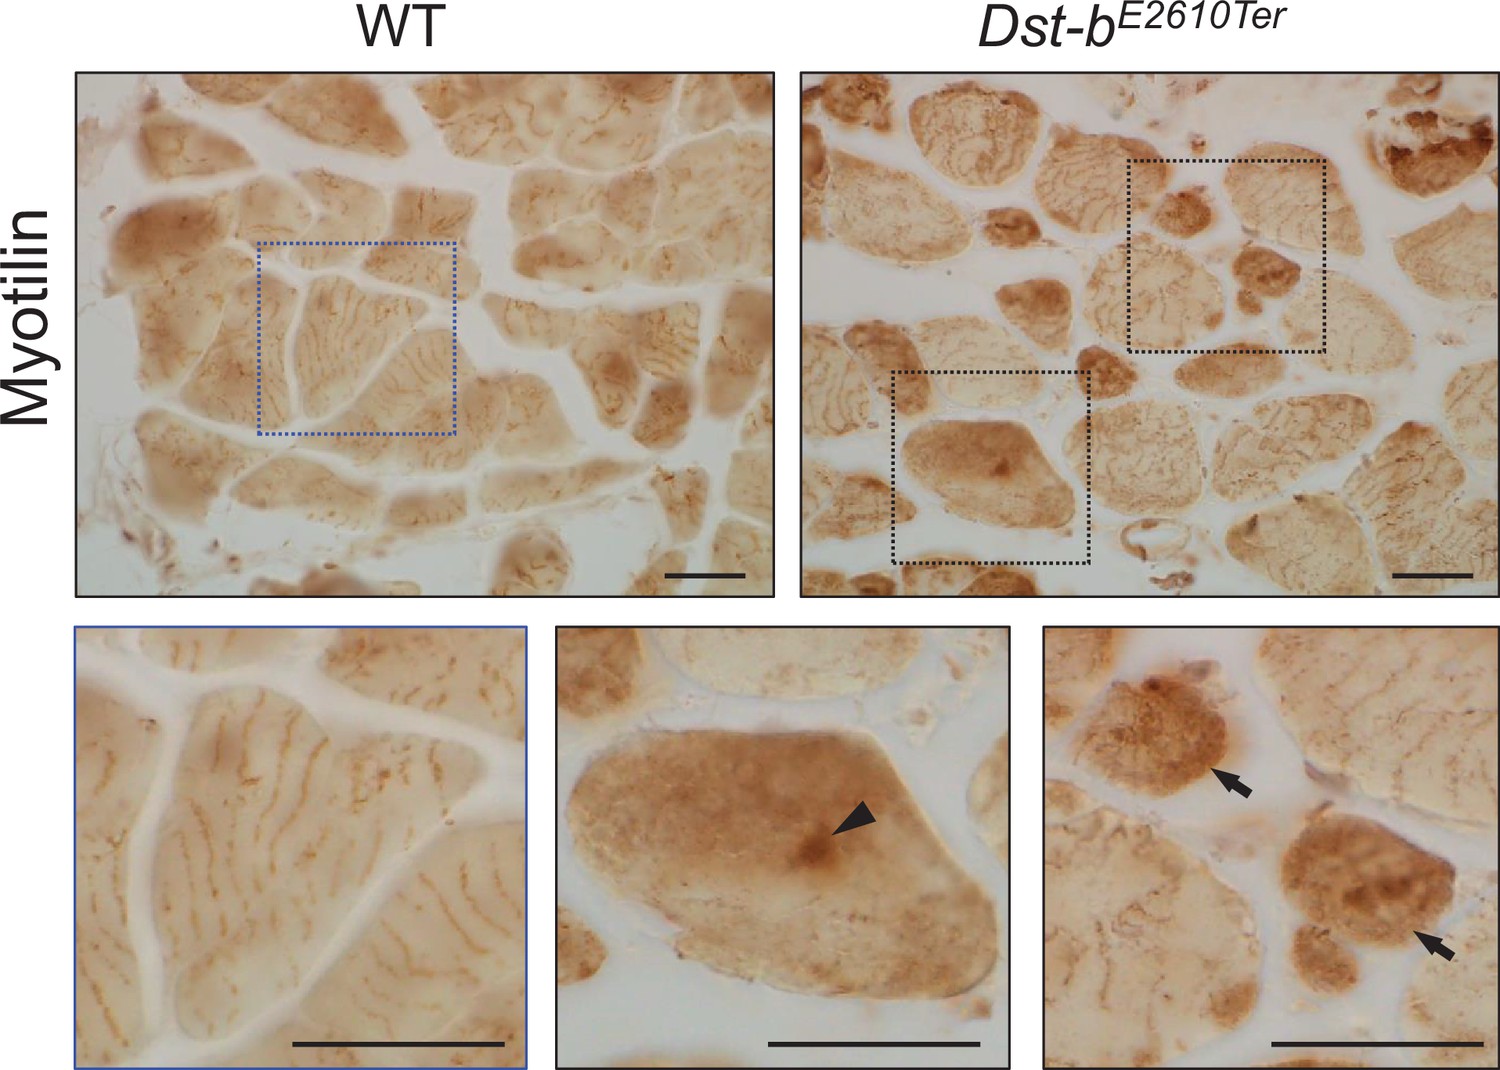
Myotilin immunohistochemistry (IHC) on the cross sections of soleus from WT and Dst-bE2610Ter/E2610Ter mice.
The dotted boxes are shown below as enlarged views. Myotilin was distributed in a striped pattern shown as enlarged view of WT muscle. Enlarged views in Dst-bE2610Ter/E2610Ter soleus indicate myotilin accumulation. Myotilin accumulations were frequently observed in small-caliber myofibers (arrows), and sarcoplasmic accumulations were also observed (arrowhead). Scale bars: 25 μm.
Figure 5
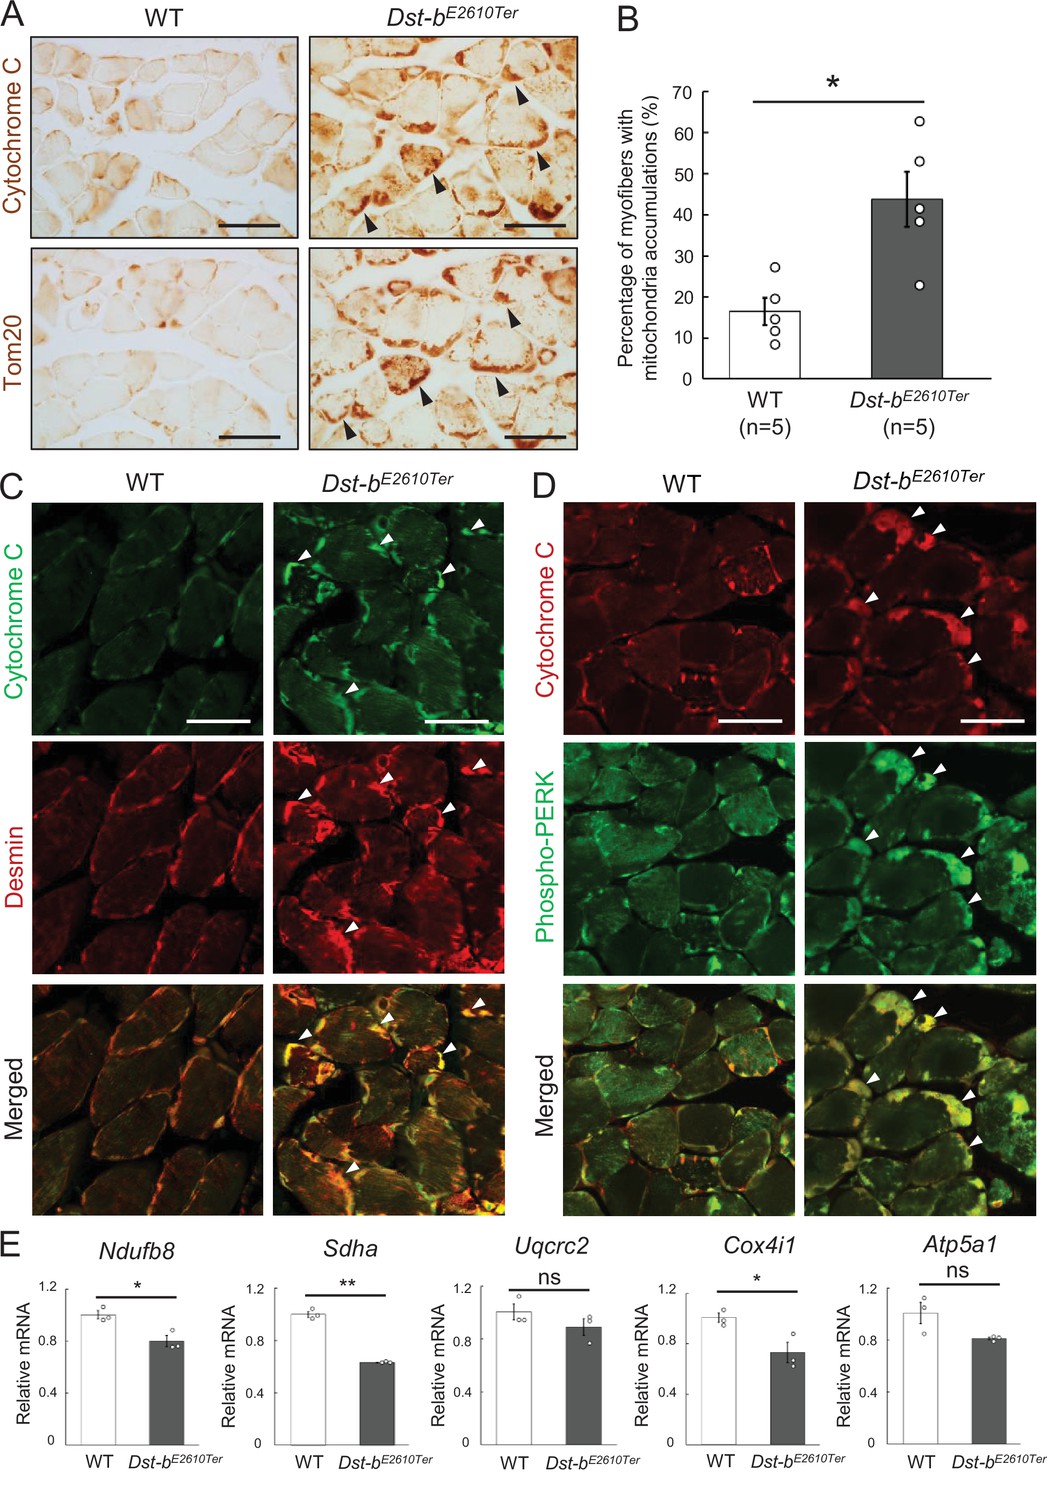
Dst-bE2610Ter mutation leads mitochondrial alterations in skeletal muscle fibers.
(A) Cytochrome C and Tom20 immunohistochemistry (IHC) on the serial cross sections of the soleus at 23 months of age. In WT soleus, mitochondria were mainly stained underneath the sarcolemma. Dst-bE2610Ter/E2610Ter soleus showed accumulated mitochondria in subsarcolemmal regions (arrowheads). (B) Quantitative data of the percentage of myofibers with accumulated mitochondria in soleus of WT and Dst-bE2610Ter/E2610Ter mice (n = 5 mice, each genotype, at 16–23 months old). * denotes statistically significant difference at p<0.05 (p=0.0109), using Student’s t-test. (C) Double IHC of cytochrome C and desmin in cross sections of the soleus. Each protein was stained in subsarcolemmal spaces of WT soleus. In Dst-bE2610Ter/E2610Ter soleus, cytochrome C-positive mitochondria were accumulated at the same positions with desmin aggregates (arrowheads). (D) Double IHC of cytochrome C and phospho-PERK. Phospho-PERK signals were strongly detected in subsarcolemmal regions in which cytochrome C-positive mitochondria accumulated (arrowheads). (E) qPCR analysis of genes responsible for oxidative phosphorylation in the soleus (n = 3 mice, each genotype, 21 months of age). * and ** denote statistically significant difference at p<0.05 (Ndufb8, p=0.0191; Cox4i1, p=0.0335) and p<0.01 (Sdha, p=0.0001), respectively, and ns means not statistically significant (Uqcrc2, p=0.2546; Atp5a1, p=0.0769), using Student’s t-test. Data are presented as mean ± SE. Scale bars: (A, C, D) 50 μm.
Figure 6
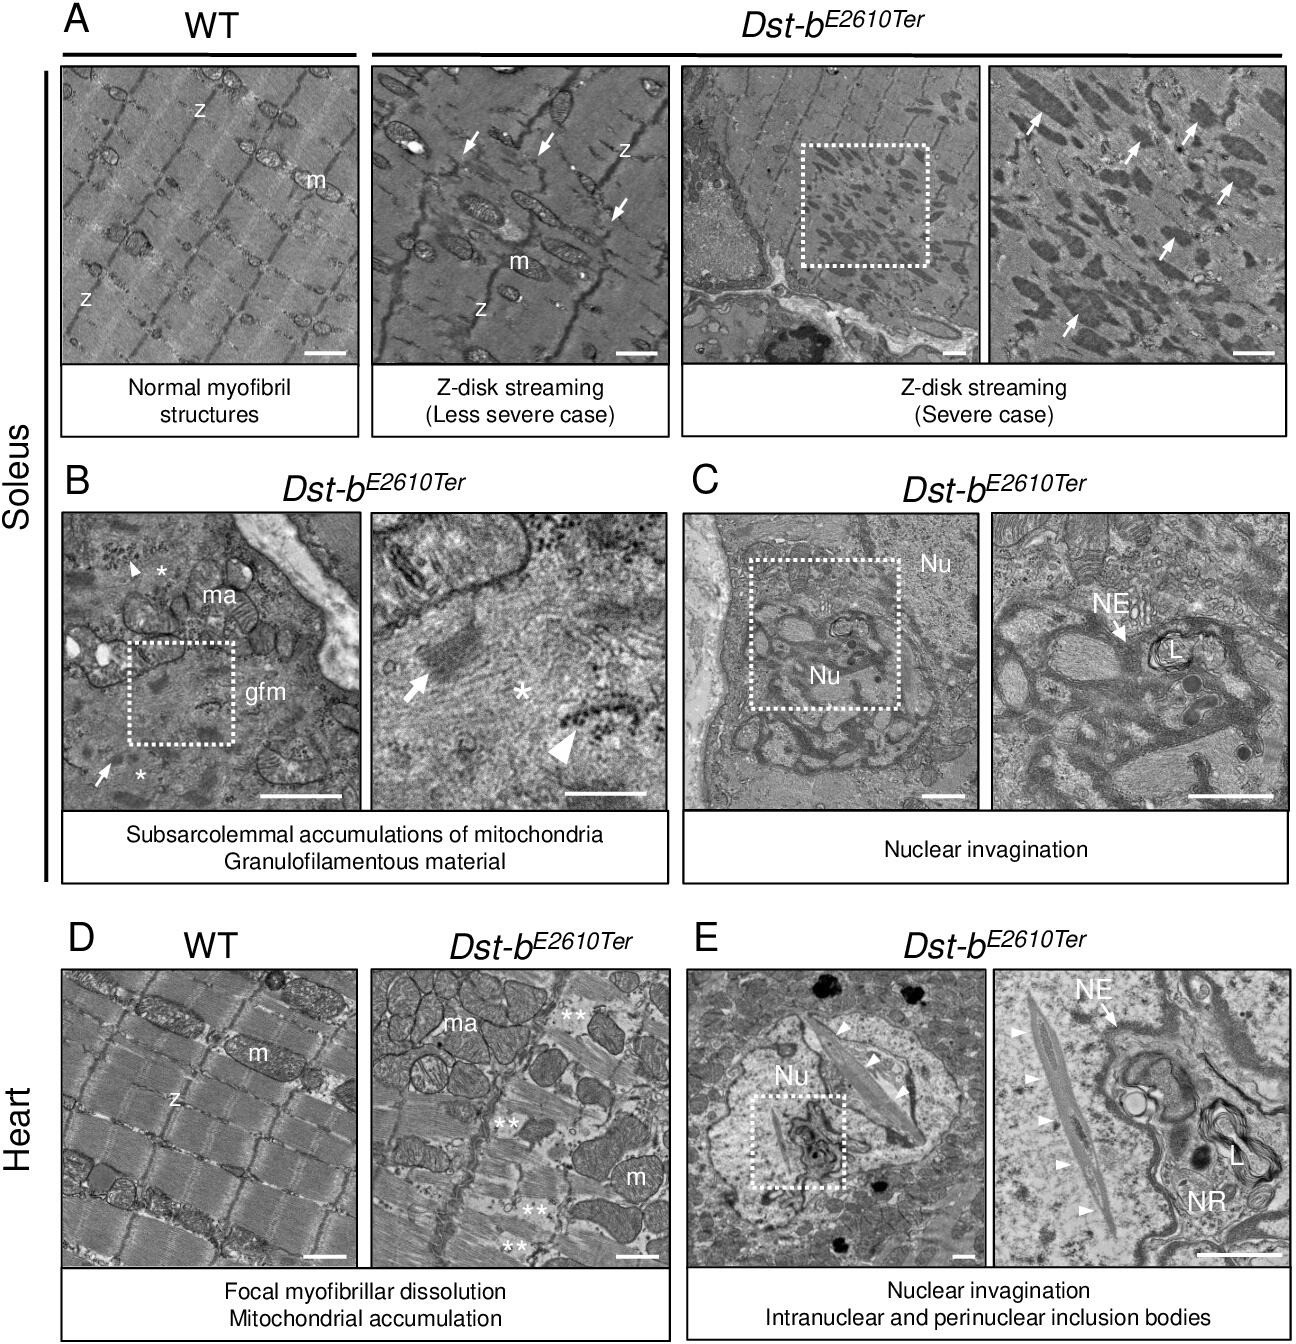
Transmission electron microscopy (TEM) analyses on the soleus and heart of Dst-bE2610Ter mice.
(A–C) TEM images on longitudinal soleus ultrathin sections of WT and Dst-bE2610Ter/E2610Ter mice at 22 months of age (n = 2 mice, each genotype). (A) Normal myofibril structure with well-aligned Z-disks (z) and mitochondria (m) in WT soleus. In Dst-bE2610Ter/E2610Ter soleus, Z-disk streaming (arrows) was observed as displacements of Z-disks (less severe case) and focal myofibrillar dissolution (severe case). Dotted box in Dst-bE2610Ter/E2610Ter soleus indicates the severely disrupted myofibrillar structures associated with abnormally thickened Z-disks (arrows) shown as the inset. (B) Subsarcolemmal accumulations of mitochondria and granulofilamentous material (gfm) in Dst-bE2610Ter/E2610Ter soleus. Gfm consists of glycogen granule deposits (arrowheads) and filamentous materials with electron-dense Z-disk streaming (arrows) and filamentous pale area (asterisk). Accumulated mitochondria (ma) are adjacent to the gfm. Dotted box shows the enlarged structure of gfm. (C) Nuclear invaginations in Dst-bE2610Ter/E2610Ter soleus. Dotted box in the cell nucleus (Nu) indicates the deeply invaginated nuclear envelope (NE, arrow) involving lysosomes (L) shown as the inset. (D, E) TEM images on heart ultrathin sections (n = 2 mice, each genotype). (D) Normal myofibril structure with well-aligned Z-disks (z) and mitochondria (m) in WT cardiomyocytes (left panel). In Dst-bE2610Ter/E2610Ter cardiomyocytes, focal myofibrillar dissolution (double asterisks) was observed and accumulated mitochondria (ma) were evident there (right panel). (E) Abnormal shape of nucleus (Nu) and intranuclear inclusions were frequently observed in Dst-bE2610Ter/E2610Ter cardiomyocytes. Dotted box indicates that the NE (arrow) deeply invaginated and involved cytoplasmic components such as lysosomes (L) to form nucleoplasmic reticulum (NR) shown as inset. Dysmorphic nucleus harbored the crystalline inclusions in intranuclear and perinuclear regions (arrowheads). Scale bars: (A-E) 1μm; (B (right magnified images)) 400 nm.
Figure 7 with 1 supplement

Defects in nuclear structure and intranuclear inclusions in cardiomyocytes of Dst-bE2610Ter mice.
(A) H&E staining of cardiomyocyte nuclei. Eosinophilic structures (arrows) were observed inside the nucleus of Dst-bE2610Ter/E2610Ter cardiomyocytes. (B) Nuclear lamina was immunolabeled with anti-lamin-A/C antibody. In dysmorphic nuclei of Dst-bE2610Ter/E2610Ter cardiomyocytes, invaginated nuclear lamina did not contain DAPI signals (arrowheads). (C–G) Transmission electron microscope (TEM) images of cardiomyocyte nuclei of Dst-bE2610Ter/E2610Ter mice (n = 2 mice, each genotype). (C) Crystalline inclusions (asterisk) and cytoplasmic organelles such as lysosomes (L) surrounded by the nuclear envelope (NE, arrow) were observed inside nucleus (Nu). (D) Crystalline inclusions are lattice structure. (E) The NE surrounded various components such as organelles (arrow) or presumably liquid (arrowheads). There was a vacuole (V) seemed to contain liquid. (F) Dotted box (E) indicates mitochondria (m) surrounded by a membrane. (G) An organelle surrounded by the NE (arrow) contained endoplasmic reticulum and ribosomes. Such structure was discriminated as nucleoplasmic reticulum (NR). (H) Immunofluorescent images of heart sections labeled with anti-p62 and anti-lamin A/C antibodies. p62 was deposited inside nuclei surrounded by lamin A/C-positive lamina in Dst-bE2610Ter/E2610Ter cardiomyocytes (arrowheads). (I) Quantitative data representing percentages of cardiomyocyte nuclei harboring p62-positive inclusions (n = 3 WT mice; n = 4 Dst-bE2610Ter/E2610Ter mice). ** denotes statistically significant difference at p<0.01 (p=0.0062), using Student’s t-test. Data are presented as mean ± SE. (J) Super-resolution microscopy images showed co-localization of p62 and ubiquitin in the nucleus of Dst-bE2610Ter/E2610Ter cardiomyocytes. Immunohistochemistry (IHC) analysis of molecular features of nuclear inclusions are shown in Figure 7—figure supplement 1. Scale bars: (A, B, H (insets), J) 5μm; (C, G) 1μm; (D) 100nm; (E) 2μm; (F) 600 nm; (H) 50μm.
Figure 7—figure supplement 1
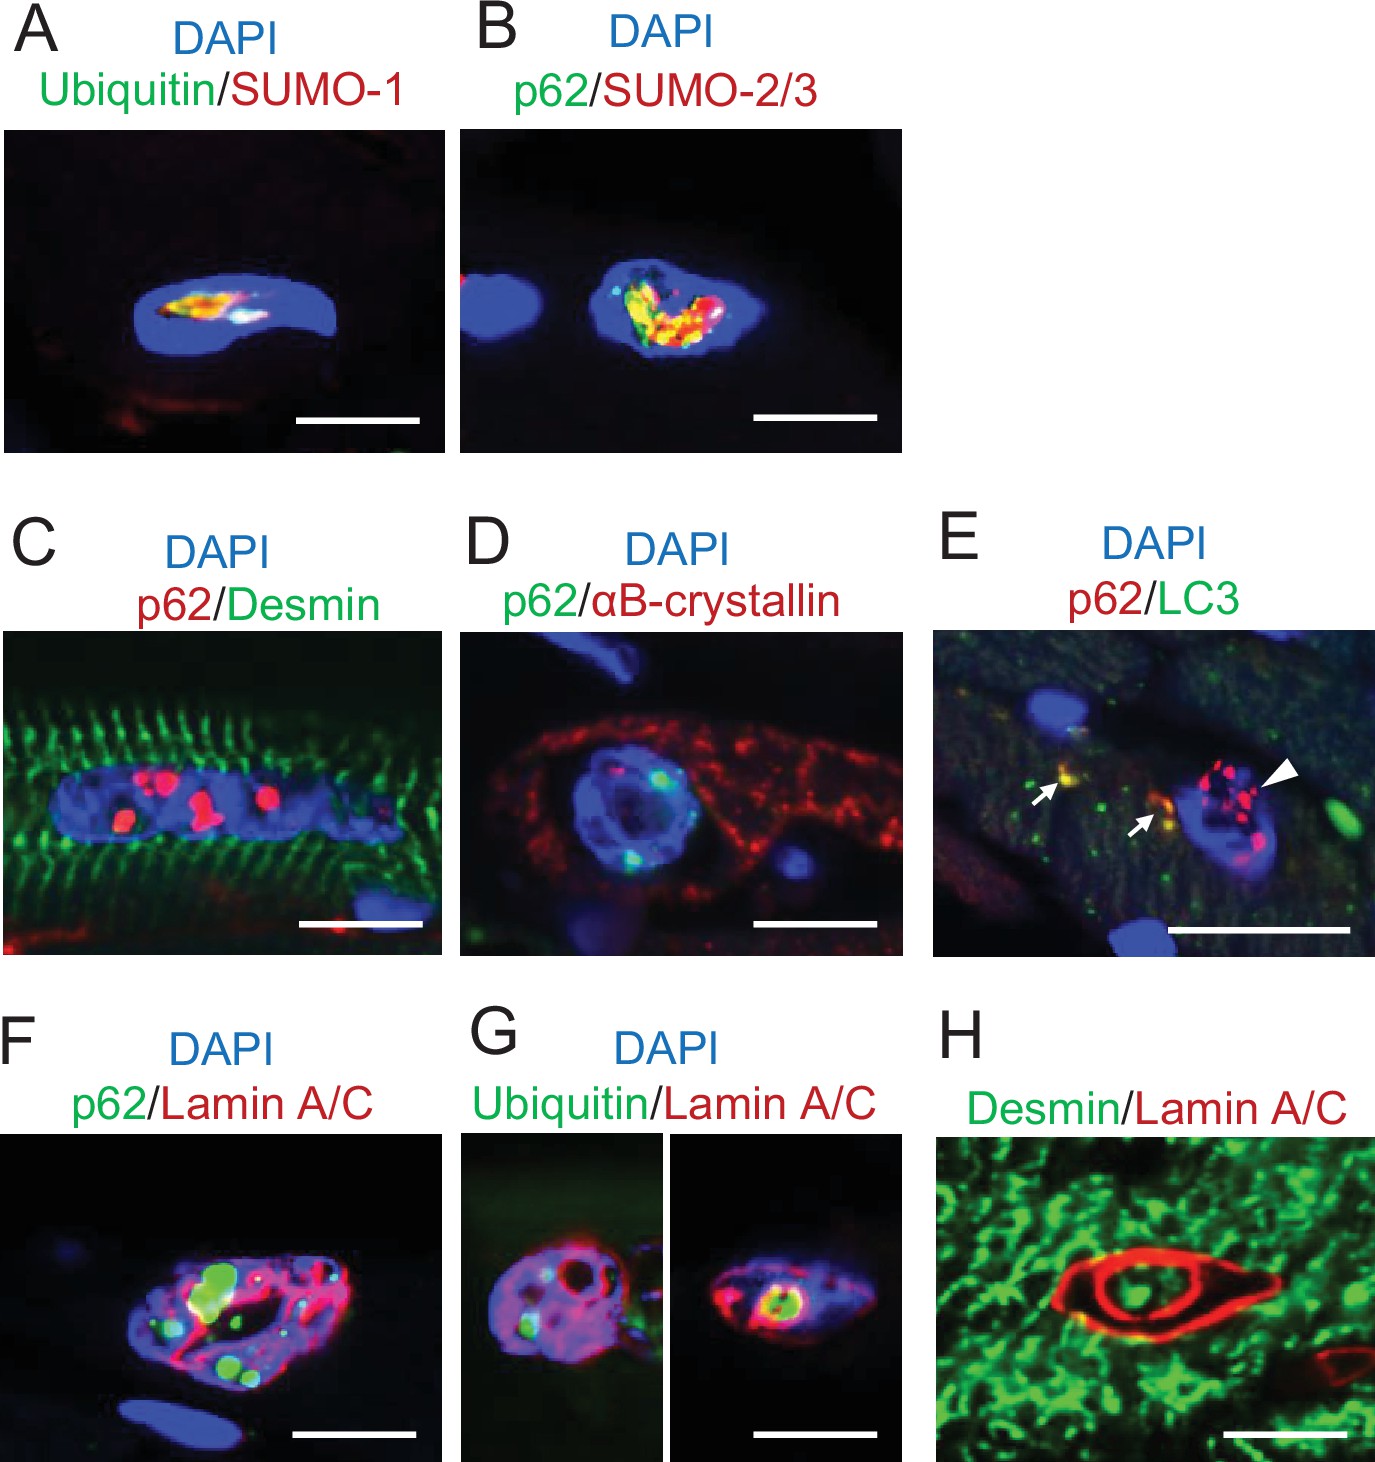
Histological features of intranuclear structures in Dst-bE2610Ter/E2610Ter cardiomyocytes.
Immunofluorescent images in cardiomyocytes of Dst-bE2610Ter/E2610Ter mice. (A, B) Small ubiquitin-related modifier-1 (SUMO-1) and SUMO-2/3 were contained by intranuclear structures labeled with ubiquitin or p62. (C, D) p62-positive intranuclear structures were devoid of cytoskeletal proteins such as desmin and αB-crystallin. (E) Intranuclear structures- labeled with p62 were devoid of LC3 (arrowhead). Dot signals co-labeled with p62 and LC3 (arrows) were occasionally observed in the cytoplasm of cardiomyocytes. (F, G) p62/ubiquitin-positive structures in dysmorphic nuclei were located adjacent to the lamin A/C-positive nuclear lamina, which deeply invaginated inside nuclei. (H) Intranuclear spaces surrounded by invaginated nuclear lamina occasionally included desmin. Scale bars: 5 μm.
Figure 8 with 1 supplement
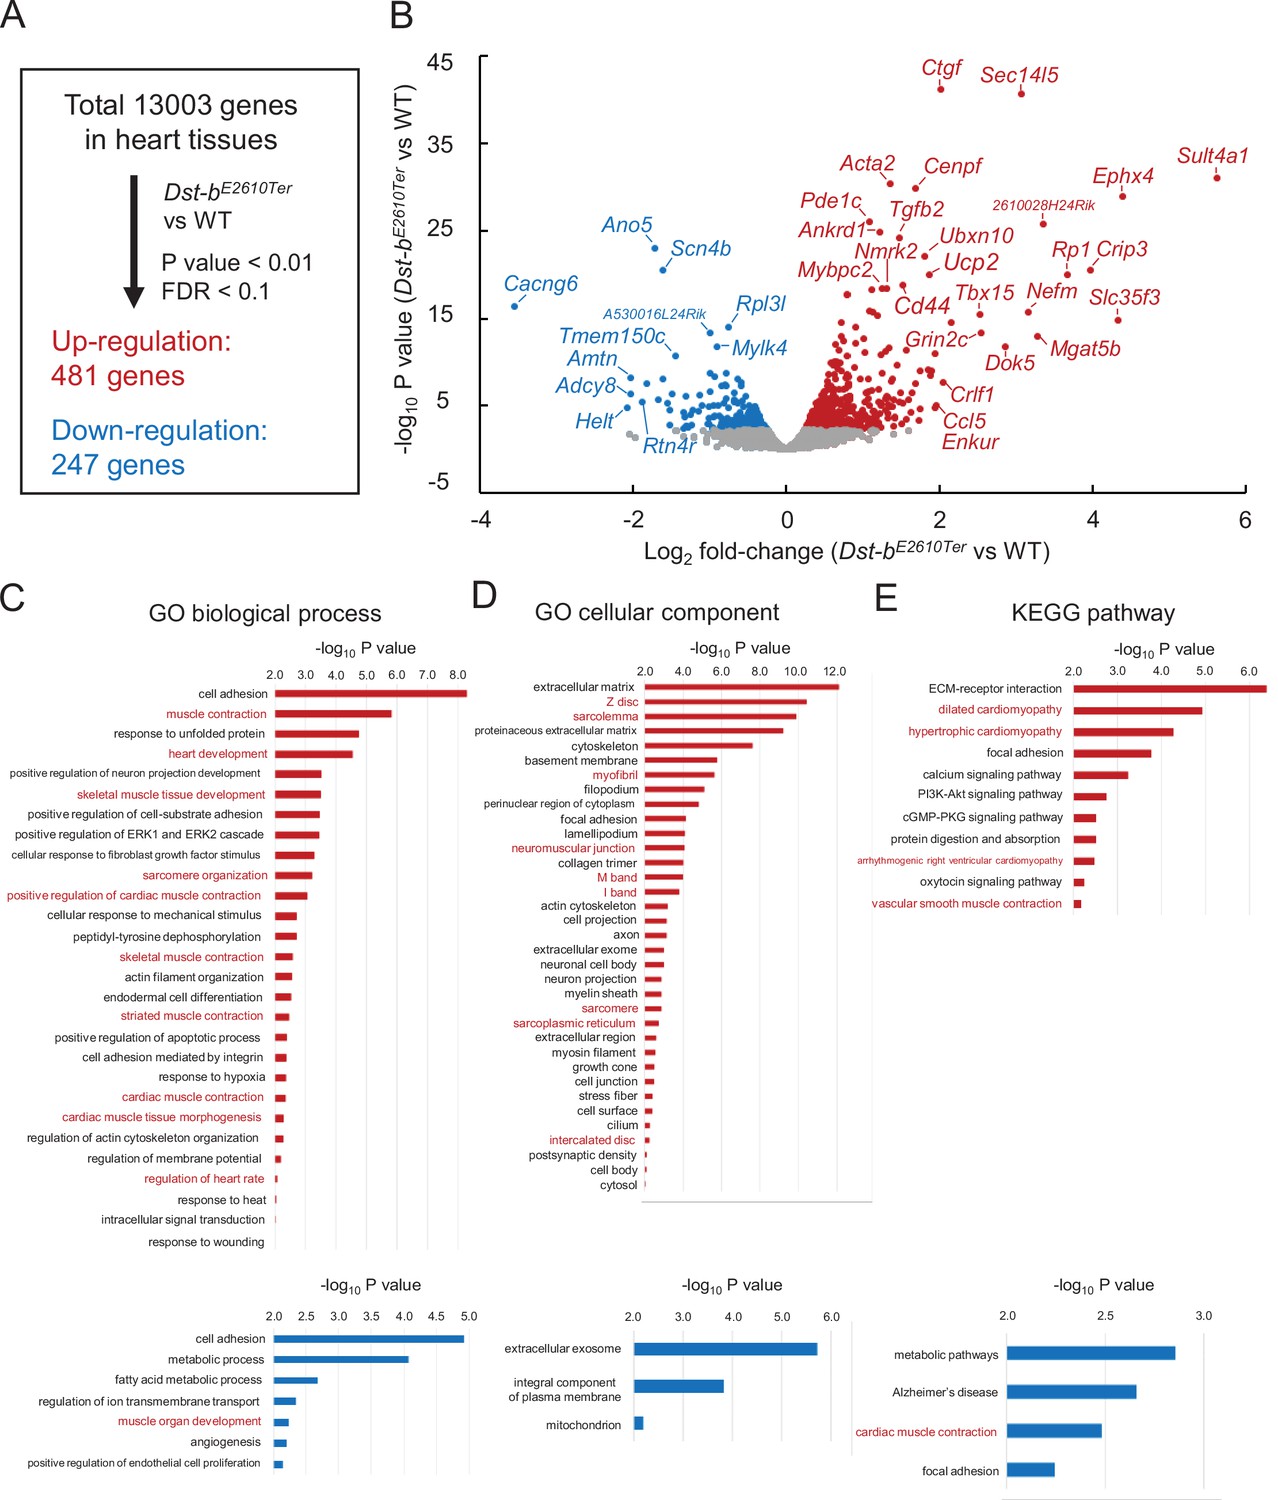
RNA-seq-based transcriptome of hearts from Dst-bE2610Ter mice.
RNA-seq analysis was performed in ventricular myocardium tissues from 14- to 19-month-old Dst-bE2610Ter/E2610Ter mice and WT mice (n = 3, each genotype). Principal component analysis (PCA) and hierarchical clustering of RNA-seq data are shown in Figure 8—figure supplement 1. (A) Among the 13,003 genes expressed in the heart, 481 genes were upregulated and 247 genes were downregulated. Thresholds were set at p<0.01 and false discovery rate (FDR) < 0.1, respectively. (B) Volcano plot shows differentially expressed genes. Red and blue dots represent genes upregulated and downregulated, respectively. Dots of highly changed genes were labeled with gene symbols. Changes of gene expressions were validated by qPCR in Figure 8—figure supplement 1. Bar graphs show Gene Ontology (GO) biological process (C), GO cellular component (D), and Kyoto Encyclopedia of Genes and Genomics (KEGG) pathway (E) enriched in genes that are upregulated and downregulated in the heart of Dst-bE2610Ter/E2610Ter mice. Red and blue bars represent genes upregulated and downregulated, respectively. Items in red words are specific to skeletal muscle and heart. List of genes resulting from GO analysis and KEGG pathway analysis is shown in Supplementary file 1A–F. RNA-seq data can be accessed from the Gene Expression Omnibus under accession # GSE184101.
Figure 8—figure supplement 1
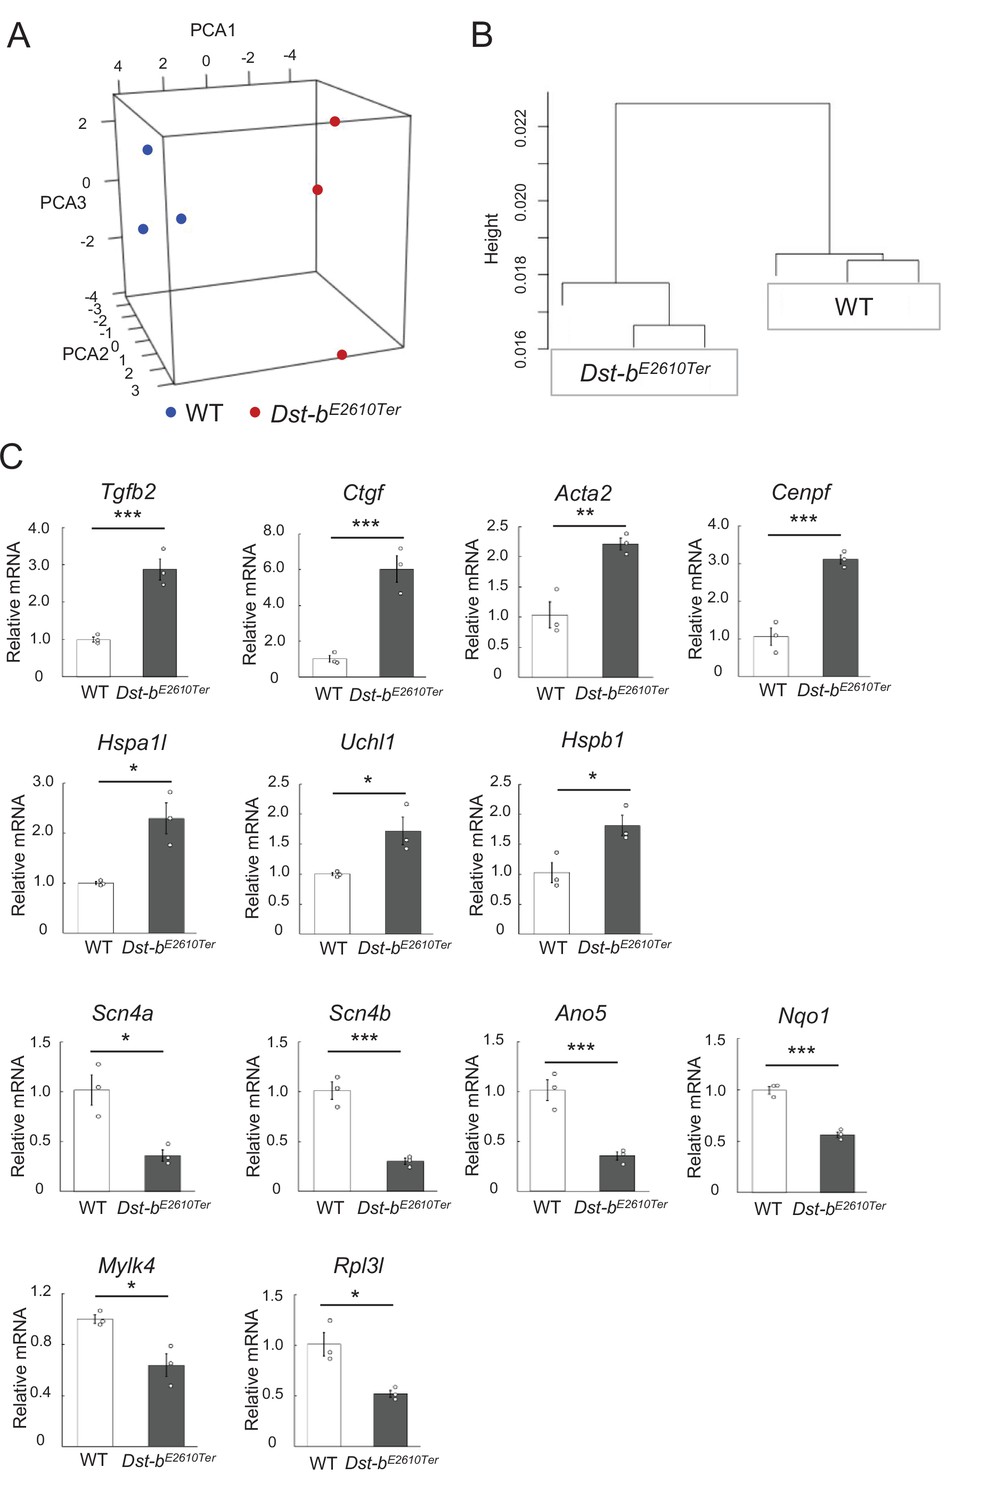
Transcriptomes of hearts from WT and Dst-bE2610Ter mice.
(A, B) Three-dimensional scatterplot of the first three principal components (PCA1: 36.3%; PCA2: 17.1%; and PCA3: 16.2%) (A) and hierarchical clustering (B) show the relationship between that WT and Dst-bE2610Ter groups based on each three different transcriptome datasets. (C) Expression of genes selected from RNA-seq were subjected to validation using the qPCR. *, **, and *** denote statistically significant difference at p<0.05 (Uchl1, p=0.0351; Hspb1, p=0.0305; Hspa1l, Pp0.0135; Scn4a, p=0.0154; Mylk4, p=0.0198; Rpl3l, p=0.0155), p<0.01 (Acta2, p=0.0075), and p<0.005 (Tgfb, p=0.0029; Ctgf, p=0.0027; Cenpf, p=0.0015; Scn4b, p=0.0016; Ano5, p=0.0042; Nqo1, p=0.0007), using Student’s t-test. Data are presented as mean ± SE.
Figure 9
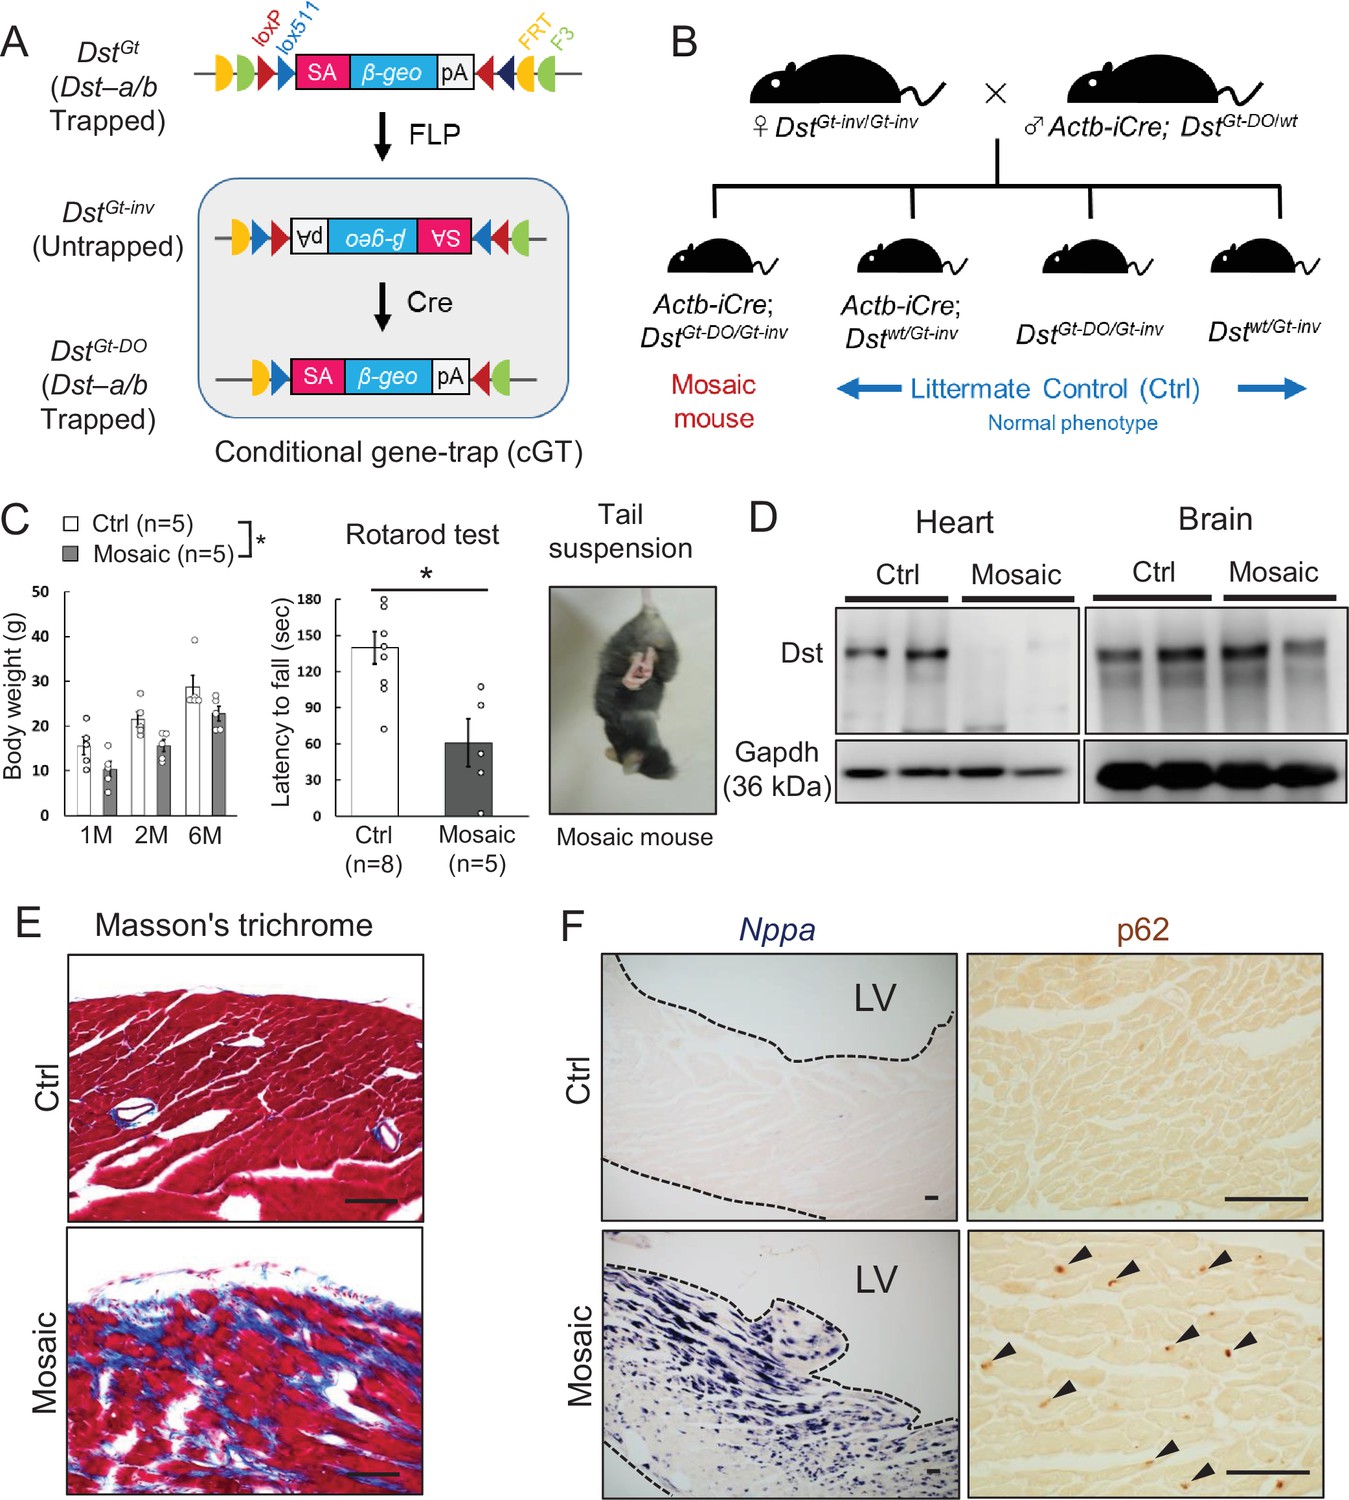
Cardiomyopathy in conditional Dst conditional gene trap (cGT) mice.
(A) Scheme of mosaic analysis by cGT of Dst-a/b. The gene trap cassette contains splice acceptor (SA) sequence, the reporter gene βgeo, and poly-A (pA) termination signal. The gene trap cassette is flanked by pairs of inversely oriented target sites of FLP recombinase (Frt and F3: half circles) and Cre recombinase (loxP and lox5171: triangles). FLP- and Cre-mediated recombination induce irreversible inversion from mutant DstGt allele to untrapped DstGt-inv allele and DstGt-inv allele to mutant DstGt-DO allele, respectively. (B) For generation of Actb-iCre; DstGt-DO/Gt-inv (mosaic) mice, female DstGt-inv/Gt-inv mice were mated with male Actb-iCre; DstGt-DO/WT mice. (C) Body weight of male mosaic mice reduced than Ctrl mice in several months of age (n = 5 mice, each genotype; two-way ANOVA; genotype effect: p=0.0493; age effect: p=0.0000; genotype × age interaction: p=0.9126). Impairment of motor coordination in mosaic mice is shown by rotarod test (n = 8 Ctrl mice, n = 5 mosaic mice). * denotes statistically significant difference at p<0.05 (p=0.0110), using Student’s t-test. Mosaic mice displayed hindlimb clasping and twist movements during tail suspension. (D) Representative data of Western blot analysis showed a deletion of Dst band in heart lysates from mosaic mice, while residual Dst bands were detected in those brain lysates (n = 2 mice, each genotype, 5–7 months of age). (E) Masson’s trichrome staining showed extensive fibrosis in heart sections of mosaic mice at 10 months of age. (F) Nppa mRNA and p62-positive depositions (arrowheads) were evident in the left ventricular myocardium of mosaic mice than Ctrl mice. Data are presented as mean ± SE. Scale bars: (E, F) 50 μm.
Figure 10

Nonsense mutations in the DST-b-specific exons.
(A) Locations of nonsense mutations in the DST-b-specific exons on human chromosome 6 (NM_001374736.1). DST-b-specific exons are indicated blue rectangles. Nonsense mutations identified in the dbSNP database were distributed in all five DST-b specific exons. (B) Pie chart shows the frequency distribution of nonsense mutations of DST-b-specific exons in different populations. The colors indicate different populations. The numbers in the pie chart indicate the frequency of identified mutations in each population. DST variants identified in Japanese patients with myopathy are shown in Supplementary file 1G.
Author response image 1
Author response image 2
Videos
Video 1
Super-resolution microscopy image showing co-localization of p62 and ubiquitin in the nucleus of Dst-b mutant cardiomyocytes.
Tables
Table 1
List of identified nonsense mutations in DST-b.
| No. | SNP_ID | DST-b-specific exon(Ex40-Ex44) | Base substitution(NM_001374736.1) | Amino acid substitution(NP_001361651.1) | Database | Global frequency | Specific population frequency |
|---|---|---|---|---|---|---|---|
| 1 | 780727375 | Ex40 | c.5513_5514insTTAGA, | p.Ser1839_Ly1a840insTer | ExAC | 1/120712 | European: 1/73330 |
| 2 | 775037762 | Ex40 | c.5581C>T | p.Gln1861Ter | ExAC | 1/120756 | European: 1/73346 |
| 3 | 267601090 | Ex40 | c.6106C>T | p.Gln2036Ter | None | None | None |
| 4 | 763489373 | Ex40 | c.6199C>T | p.Arg2067Ter | GnomAD_exome GnomAD ExAC ALFA | 5/248332 1/140170 1/120410 0/10680 | Asian: 3/48548; American: 2/34434, European: 1/75902 American: 1/11450 None |
| 5 | 980428529 | Ex40 | c.6413T>A | p.Leu2138Ter | TOPMED ALFA | 1/264690 1/35428 | None European: 1/26584 |
| 6 | 2098511415 | Ex40 | c.6846T>A | p.Cy1b282Ter | ALFA | 2/21326 | European: 2/16854 |
| 7 | 1416256967 | Ex40 | c.6907G>T | p.Glu2303Ter | TOPMED ALFA | 1/264690 0/14050 | None None |
| 8 | 1563150977 | Ex40 | c.6952C>T | p.Gln2318Ter | GnomAD_exome | 1/248356 | European: 1/133910 |
| 9 | 2098509730 | Ex40 | c.7045C>T | p.Gln2349Ter | GnomAD ALFA | 1/140156 0/10680 | African: 1/42028 None |
| 10 | 536128073 | Ex40 | c.7120C>T | p.Arg2374Ter | TOPMED GnomAD_exome GnomAD ALFA KOREAN GoNL | 1/264690 3/222812 1/139940 3/32028 1/2922 1/998 | None European: 3/118158 African: 1/41914 European: 1/23832; Other: 2/4554 KOREAN: 1/2922 None |
| 11 | 747917821 | Ex40 | c.7171C>T | p.Gln2391Ter | GnomAD ExAC | 1/140100 2/83458 | African: 1/41990 Asian: 1/19128; African: 1/7454 |
| 12 | 1261702898 | Ex40 | c.7214C>G, c.7214C>A, | p.Ser2405Ter | TOPMED GnomAD_exome ALFA | 1/264690 (C>A) 1/245012 (C>G) 0/10680 (C>A) | None European: 1/131624 None |
| 13 | 757004287 | Ex40 | c.7316T>G | p.Leu2439Ter | GnomAD_exome ExAC | 1/248436 1/120426 | Asian: 1/48550 Asian: 1/25104 |
| 14 | 559852499 | Ex40 | c.7459C>T | p.Gln2487Ter | GnomAD_exome ExAC 1000G | 1/247718 1/119556 1/5008 | Asian: 1/48546 Asian: 1/25084 South Asian: 1/978 |
| 15 | 1437052580 | Ex40 | c.7510C>T | p.Gln2504Ter | GnomAD_exome ALFA | 1/247692 1/8988 | Asian: 1/48526 Asian: 1/56 |
| 16 | 751368429 | Ex40 | c.7531_7534del | p.Leu2510_Asn2511insTer | GnomAD_exome ExAC | 1/247498 1/120056 | American: 1/34358 American: 1/11378 |
| 17 | 1563144635 | Ex40 | c.7447_7534del | p.Ile2482_Gly2483insTer | GnomAD_exome | 1/247498 | Asian: 1/48522 |
| 18 | 747767227 | Ex40 | c.7552C>T | p.Gln2518Ter | None | None | None |
| 19 | 1243608666 | Ex40 | c.7578C>G | p.Tyr2526Ter | GnomAD_exome | 1/247554 | European: 1/133118 |
| 20 | 1190095913 | Ex40 | c.7627C>T | p.Gln2543Ter | TOPMED GnomAD_exome ALFA | 1/264690 1/247988 0/10680 | None African: 1/15478 None |
| 21 | 756643045 | Ex40 | c.8014C>T | p.Gln2672Ter | TOPMED GnomAD_exome ExAC ALFA ALSPAC TWINSUK | 2/264690 2/248730 1/120578 0/14050 0/3854 1/3708 | None European: 2/134142 European: 1/73284 None None TWIN COHORT: 1/3708 |
| 22 | 1208663117 | Ex40 | c.8294G>A | p.Trp2765Ter | GnomAD_exome ALFA | 1/245286 1/21368 | European: 1/131776 European: 1/16886 |
| 23 | 2098496754 | Ex40 | c.8374G>T | p.Glu2792Ter | GnomAD ALFA | 1/140098 0/10680 | African: 1/42014 None |
| 24 | 1314301705 | Ex40 | c.8485C>T | p.Gln2829Ter, | TOPMED GnomAD ALFA | 1/264690 1/139898 0/14050 | None Ashkenazi Jewish: 1/3318 None |
| 25 | 1563133123 | Ex40 | c.8623del | p.Arg2874_Val2875insTer | None | None | None |
| 26 | 2098493114 | Ex40 | c.8635C>T | p.Gln2879Ter | 8.3KJPN | 1/16760 | JAPANESE: 1/16760 |
| 27 | 1458968582 | Ex40 | c.8900C>G | p.Ser2967Ter | None | None | None |
| 28 | 1048157544 | Ex40 | c.9076C>T | p.Gln3026Ter | TOPMED ALFA | 1/264690 0/14050 | None None |
| 29 | 910403635 | Ex40 | c.9172G>T | p.Gly3058Ter | TOPMED ALFA | 2/264690 0/14050 | None None |
| 30 | 747173454 | Ex40 | c.9202G>T | p.Glu3068Ter | GnomAD_exome ExAC | 1/248348 1/120120 | European: 1/133958 European: 1/73002 |
| 31 | 751807675 | Ex40 | c.9227_9237del | p.Leu3075_Leu3076insTer | ExAC | 1/119230 | European: 1/72390 |
| 32 | 749282620 | Ex40 | c.9439A>T | p.Ly1c147Ter | GnomAD ALFA | 1/140058 0/10680 | African: 1/42014 None |
| 33 | 1301999896 | Ex40 | c.9549C>G | p.Tyr3183Ter | TOPMED GnomAD_exome ALFA | 2/264690 1/247036 0/10680 | None European: 1/132884 None |
| 34 | 1411974489 | Ex40 | c.9580A>T | p.Ly1c194Ter | GnomAD_exome ALFA | 1/247422 1/8988 | Ashkenazi Jewish: 1/10018 European: 1/6062 |
| 35 | 2098482258 | Ex40 | c.9586del | p.Asp3195_Val3196insTer | None | None | None |
| 36 | 972168431 | Ex40 | c.9818C>G, c.9818C>A | p.Ser3273Ter | TOPMED ALFA | 2/264690 (C>A) 0/14050 (C>A) | None None |
| 37 | 200867945 | Ex40 | c.9824T>A | p.Leu3275Ter | None | None | None |
| 38 | 1346974625 | Ex40 | c.10045C>T | p.Gln3349Ter | TOPMED GnomAD_exome ALFA | 1/264690 2/247418 1/33212 | None European: 2/133356 European: 1/24496 |
| 39 | 1229343851 | Ex40 | c.10114G>T | p.Glu3372Ter | None | None | None |
| 40 | 2098476192 | Ex40 | c.10166T>A | p.Leu3389Ter | TOPMED ALFA | 1/264690 0/10680 | None None |
| 41 | 2098474844 | Ex40 | c.10271C>A | p.Ser3424Ter, | TOPMED ALFA | 1/264690 0/10680 | None None |
| 42 | 2098473553 | Ex40 | c.10391del | p.Glu3463_Leu3464insTer | TOPMED ALFA | 1/264690 0/10680 | None None |
| 43 | 1249289191 | Ex40 | c.10516G>T | p.Glu3506Ter | 8.3KJPN | 1/16760 | JAPANESE: 1/16760 |
| 44 | 1428617557 | Ex40 | c.10570G>T | p.Glu3524Ter | TOPMED GnomAD ALFA | 1/264690 1/139986 0/11862 | None European: 1/75810 None |
| 45 | 1586342297 | Ex40 | c.10633G>T | p.Glu3545Ter | KOREAN | 1/2922 | KOREAN: 1/2922 |
| 46 | 2098467261 | Ex41 | c.10807C>T | p.Gln3603Ter | GnomAD | 2/140068 | European: 2/75876 |
| 47 | 1586330106 | Ex41 | c.10815T>A | p.Cy1c605Ter | Korea1K | 1/1832 | KOREAN: 1/1832 |
| 48 | 2098463511 | Ex42 | c.10958_10959insTTA | p.Leu3653delinsPheTer | ALFA | 0/11862 | None |
| 49 | 2098462327 | Ex42 | c.11071C>T | p.Gln3691Ter | GnomAD ALFA | 1/139940 0/10680 | American: 1/13576 None |
| 50 | 1245541628 | Ex43 | c.11204C>G | p.Ser3735Ter | GnomAD ALFA | 1/139898 0/10680 | European: 1/75804 None |
| 51 | 1363675987 | Ex43 | c.11210C>G | p.Ser3737Ter | TOPMED GnomAD ALFA | 1/264690 1/139886 0/14050 | None African: 1/41950 None |
| 52 | 2098459417 | Ex43 | c.11217G>A | p.Trp3739Ter | ALFA | 0/10680 | None |
| 53 | 1230102996 | Ex43 | c.11222C>G | p.Ser3741Ter | GnomAD ALFA | 2/139836 0/10680 | European: 2/75762 None |
| 54 | 2098459238 | Ex43 | c.11251G>T | p.Glu3751Ter | None | None | None |
| 55 | 1305040869 | Ex44 | c.11392C>T | p.Gln3798Ter | None | None | None |
| 56 | 2098446552 | Ex44 | c.11419C>T | p.Gln3807Ter | 8.3KJPN | 1/16760 | JAPANESE: 1/16760 |
| 57 | 1467862852 | Ex44 | c.11521C>T | p.Gln3841Ter | 8.3KJPN ALFA | 1/16760 0/14050 | JAPANESE: 1/16760 None |
| 58 | 776397027 | Ex44 | c.11536C>T | p.Gln3846Ter | GnomAD_exome ExAC | 1/205888 1/34048 | European: 1/107654 European: 1/18438 |
Table 2
Primer list for qPCR.
| Gene name | Forward (5′ to 3′) | Reverse (5′ to 3′) |
|---|---|---|
| Acta2 | GTCCCAGACATCAGGGAGTAA | TCGGATACTTCAGCGTCAGGA |
| Actb | GGCTGTATTCCCCTCCATCG | CCAGTTGGTAACAATGCCATGT |
| Ano5 | TCCAAAGAGACCAGCTTTCTCA | GTCGATCTGCCGGATTCCAT |
| Atp5a1 | TCTCCATGCCTCTAACACTCG | CCAGGTCAACAGACGTGTCAG |
| Cenpf | GCACAGCACAGTATGACCAGG | CTCTGCGTTCTGTCGGTGAC |
| Cox4i1 | ATTGGCAAGAGAGCCATTTCTAC | CACGCCGATCAGCGTAAGT |
| Ctgf | GGGCCTCTTCTGCGATTTC | ATCCAGGCAAGTGCATTGGTA |
| Dst-a | AACCCTCAGGAGAGTCGAAGGT | TGCCGTCTCCAATCACAAAG |
| Dst-b | ACCGGTTAGAGGCTCTCCTG | ATCACACAGCCCTTGGAGTTT |
| Dst isoform1 | TCCAGGCCTATGAGGATGTC | GGAGGGAGATCAAATTGTGC |
| Dst isoform2 | AATTTGCCCAAGCATGAGAG | CGTCCCTCAGATCCTCGTAG |
| Dst isoform3 | CACCGTCTTCAGCTCACAAA | AGTTTCCCATCTCTCCAGCA |
| Gapdh | AGGTCGGTGTGAACGGATTTG | TGTAGACCATGTAGTTGAGGTCA |
| Gpx1 | CCACCGTGTATGCCTTCTCC | AGAGAGACGCGACATTCTCAAT |
| Gpx4 | GCCTGGATAAGTACAGGGGTT | CATGCAGATCGACTAGCTGAG |
| Hmox1 | AAGCCGAGAATGCTGAGTTCA | GCCGTGTAGATATGGTACAAGGA |
| Hspa1l | TCACGGTGCCAGCCTATTTC | CGTGGGCTCATTGATTATTCTCA |
| Hspb1 | CGGTGCTTCACCCGGAAATA | AGGGGATAGGGAAAGAGGACA |
| Myh7 | ACTGTCAACACTAAGAGGGTCA | TTGGATGATTTGATCTTCCAGGG |
| Mylk4 | GGGCGTTTTGGTCAGGTACAT | ACGCTGATCTCGTTCTTCACA |
| Ndufb8 | TGTTGCCGGGGTCATATCCTA | AGCATCGGGTAGTCGCCATA |
| Nppa | GCTTCCAGGCCATATTGGAG | GGGGGCATGACCTCATCTT |
| Nppb | CATGGATCTCCTGAAGGTGC | CCTTCAAGAGCTGTCTCTGG |
| Nqo1 | AGCGTTCGGTATTACGATCC | AGTACAATCAGGGCTCTTCTCG |
| Rpl3l | GAAGGGCCGGGGTGTTAAAG | AGCTCTGTACGGTGGTGGTAA |
| Scn4a | AGTCCCTGGCAGCCATAGAA | CCCATAGATGAGTGGGAGGTT |
| Scn4b | TGGTCCTACAATAACAGCGAAAC | ACTCTCACCTTAGGGTCAGAC |
| Sdha | GGAACACTCCAAAAACAGACCT | CCACCACTGGGTATTGAGTAGAA |
| Sod1 | AACCAGTTGTGTTGTCAGGAC | CCACCATGTTTCTTAGAGTGAGG |
| Tgfb2 | TCGACATGGATCAGTTTATGCG | CCCTGGTACTGTAGATGGA |
| Tnni1 | ATGCCGGAAGTTGAGAGGAAA | TCCGAGAGGTAACGCACCTT |
| Tnni2 | AGAGTGTGATGCTCCAGATAGC | AGCAACGTCGATCTTCGCA |
| Tnnt1 | CCTGTGGTGCCTCCTTTGATT | TGCGGTCTTTTAGTGCAATGAG |
| Tnnt3 | GGAACGCCAGAACAGATTGG | TGGAGGACAGAGCCTTTTTCTT |
| Uchl1 | AGGGACAGGAAGTTAGCCCTA | AGCTTCTCCGTTTCAGACAGA |
| Uqcrc2 | AAAGTTGCCCCGAAGGTTAAA | GAGCATAGTTTTCCAGAGAAGCA |
Table 3
Primary antibodies for immunohistochemistry.
| Antigen name | Host | Dilution | Clone name | Source, Cat#, or reference |
|---|---|---|---|---|
| α-Actin | Mouse | 1:200 | Alpha Sr-1 | BioLegend, MMS-467S |
| αB-Crystallin | Rabbit | 1:1000 | BioLegend, PRB-105P | |
| ATF3 | Rabbit | 1:1000 | Santa Cruz Biotechnology, sc-188 | |
| Cytochrome C | Mouse | 1:500 | A-8 | Santa Cruz Biotechnology, sc-13156 |
| Desmin | Mouse | 1:100 | RD301 | Santa Cruz Biotechnology, sc-23879 |
| Desmin | Rabbit | 1:1000 | Novus Biologicals, NBP1-85549 | |
| Dst | Rabbit | 1:1000 | Dr. Ronald K Liem, Goryunov et al., 2007 | |
| Lamin A/C | Mouse | 1:100 | E-1 | Santa Cruz Biotechnology, sc-376248 |
| LC3A/B | Rabbit | 1:1000 | D3U4C | Cell Signaling Technology, #12741 |
| Myotilin | Rabbit | 1:500 | ProteinTech, 10731-1-AP | |
| NF-M | Mouse | 1:200 | 1C8 | Dr. Katsuhiko Ono, Horie et al., 2014 |
| p62 | Mouse | 1:200 | 1B5.H9 | BioLegend, MMS-5034 |
| p62 | Rabbit | 1:400 | ABclonal, A19700 | |
| Phospho-PERK (phospho T982) | Rabbit | 1:500 | Abcam, ab192591 | |
| Plectin | Mouse | 1:100 | 10F6 | Santa Cruz Biotechnology, sc-33649 |
| SUMO-1 | Mouse | 1:200 | D-11 | Santa Cruz Biotechnology, sc-5308 |
| SUMO-2/3 | Rabbit | 1:200 | ABclonal, A5066 | |
| Tom20 | Rabbit | 1:1000 | Santa Cruz Biotechnology, sc-11415 | |
| Ubiquitin | Rabbit | 1:1000 | Dako; Agilent Technologies Z0458 |
Additional files
-
Supplementary file 1
(A) List of upregulated genes of Gene Ontology (GO) biological process, (B) list of upregulated genes of GO cellular component, (C) list of upregulated genes of Kyoto Encyclopedia of Genes and Genomics (KEGG) pathway, (D) list of downregulated genes of GO biological process, (E) list of downregulated genes of GO cellular component, (F) list of downregulated genes of KEGG pathway, and (G) variants of DST gene identified in Japanese patients with myopathy.
- https://cdn.elifesciences.org/articles/78419/elife-78419-supp1-v1.docx
-
Transparent reporting form
- https://cdn.elifesciences.org/articles/78419/elife-78419-transrepform1-v1.pdf
Download links
A two-part list of links to download the article, or parts of the article, in various formats.
Downloads (link to download the article as PDF)
Open citations (links to open the citations from this article in various online reference manager services)
Cite this article (links to download the citations from this article in formats compatible with various reference manager tools)
Isoform-specific mutation in Dystonin-b gene causes late-onset protein aggregate myopathy and cardiomyopathy
eLife 11:e78419.
https://doi.org/10.7554/eLife.78419


