Solute exchange through gap junctions lessens the adverse effects of inactivating mutations in metabolite-handling genes
- Department of Physiology, Anatomy & Genetics, University of Oxford, United Kingdom
- MRC Weatherall Institute for Molecular Medicine, John Radcliffe Hospital, United Kingdom
Figures
Figure 1 with 2 supplements
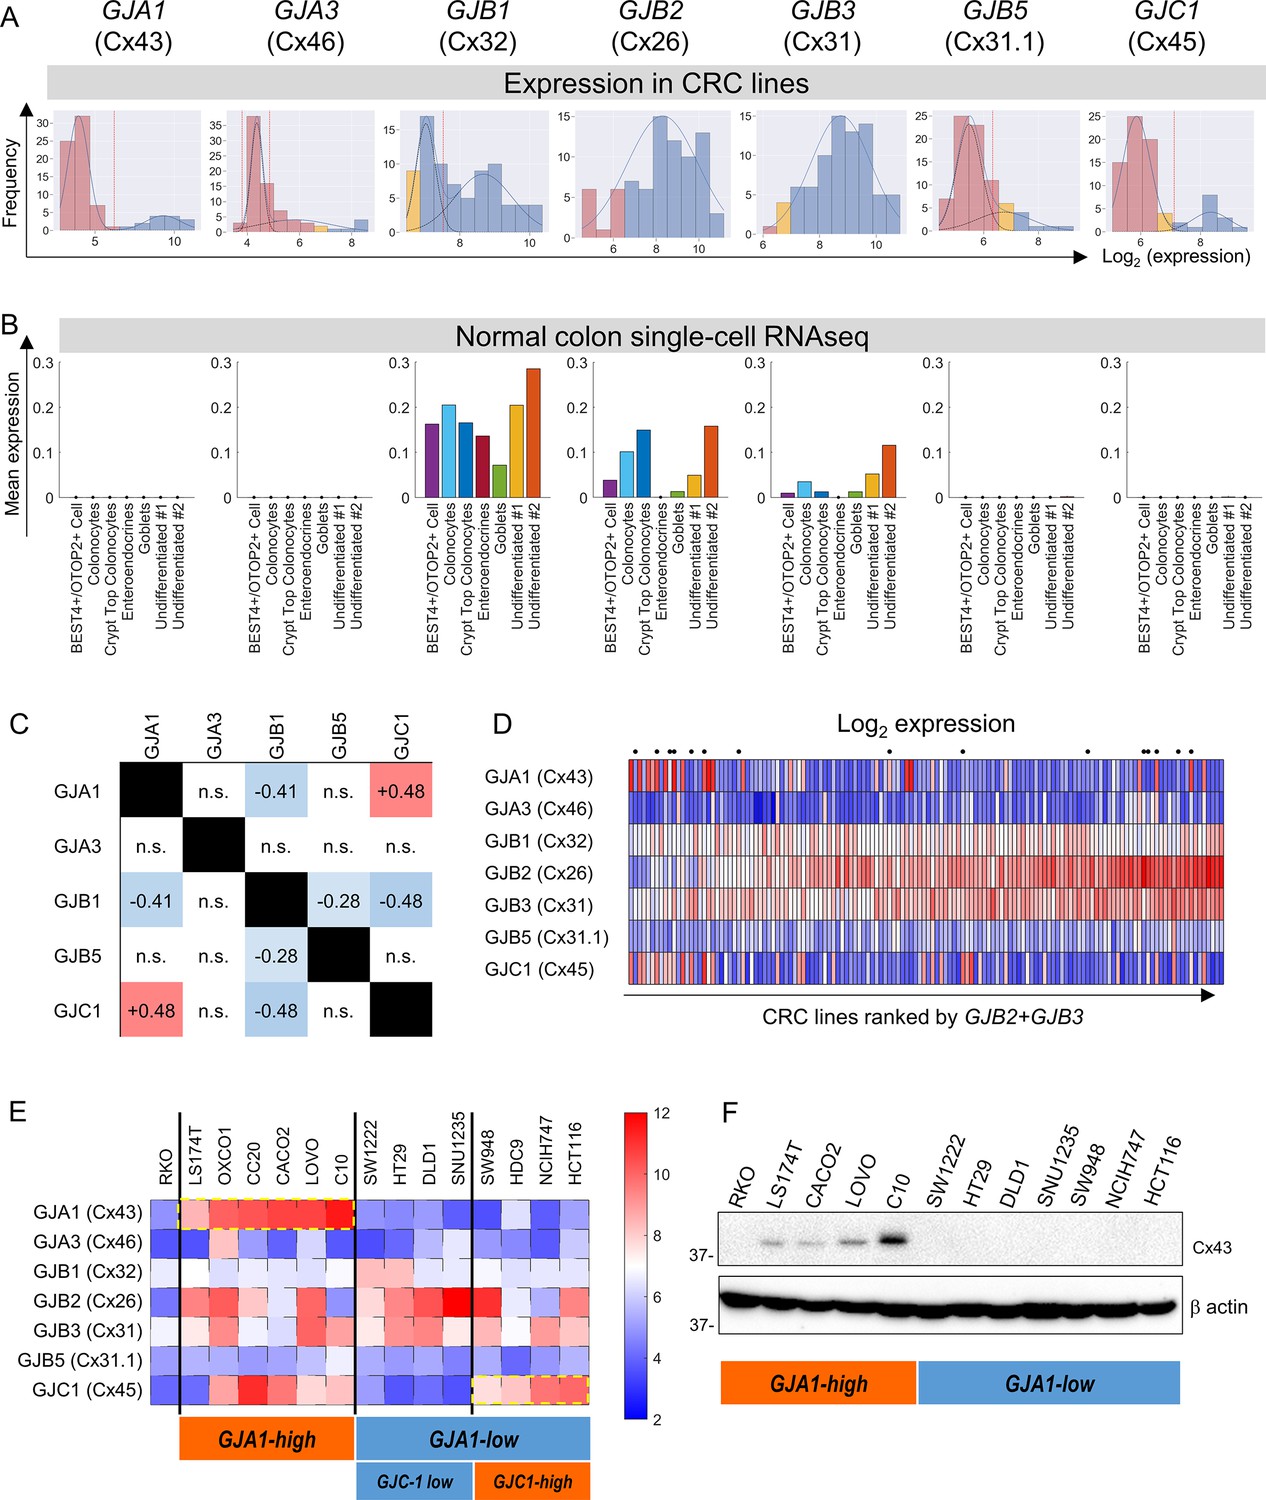
Connexin isoform expression in colorectal cancer (CRC) cells.
(A) Microarray data from 79 CRC cell lines analyzed for message level of seven connexin genes. Frequency distributions for log2-transformed data. A Gaussian mixture modeling (GMM)-based analysis (GMMchi) is used to determine whether the distributions are bimodal or unimodal. Vertical red line is the cutoff threshold separating low/high groups. Pink bars refer to background levels, and yellow bars refer to near-background levels, based on a separate analysis of the overall pattern of gene expression observed in the cell lines. The cutoff thresholds for the difference between low and high expression are 26.2, 24.9, 27.5, 26.3, and 27.1 for GJA1, GJA3, GJB1, GJB5, and GJC1, respectively. (B) Analysis of single-cell RNAseq datasets for normal colon obtained from the GSE116222 dataset available at the Gene Expression Omnibus. Bars show mean expression levels by cell type. (C) Two-by-two table shows correlation between bimodally distributed connexin genes. Numbers refer to correlation coefficient for significant (p<0.05) gene pairs (Fisher’s exact test). (D) Log2-transformed expression data ranked by the sum of GJB2 and GJB3 expression. Cells selected for further studies are indicated by a dot above the heatmap. (E) Heatmap replotted for the selected 15 cell lines, grouped by GJA1 and GJC1 expression, relative to threshold determined from GMM analysis. (F) Western blot for Cx43, showing agreement between protein levels and gene expression profiles.
-
Figure 1—source data 1
Full-length scans of blots for Figure 1F.
- https://cdn.elifesciences.org/articles/78425/elife-78425-fig1-data1-v2.xlsx
Figure 1—figure supplement 1
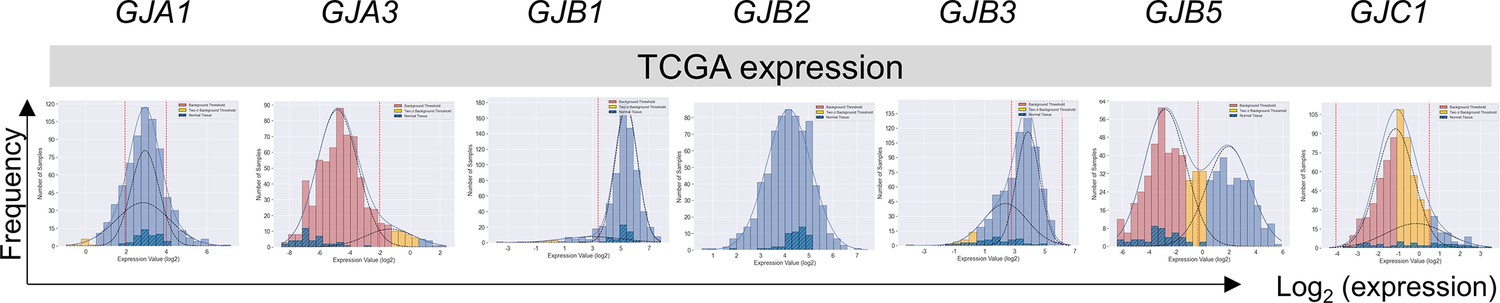
Application of the GMMchi pipeline in purifying non-tumor expression from bulk tumor expression in the TCGA patient samples.
This revealed that out of 689 TCGA colorectal cancer (CRC) samples, 51 are paired normal samples and 637 are tumor samples. Graphs show the expression distribution of GJA1, GJA3, GJB1, GJB2, GJB3, GJB5, and GJC1 genes combining paired tumor and normal samples. Hatched bars indicate normal tissue; red bars denote background level; yellow bars denote two standard deviations from the background level.
Figure 1—figure supplement 2
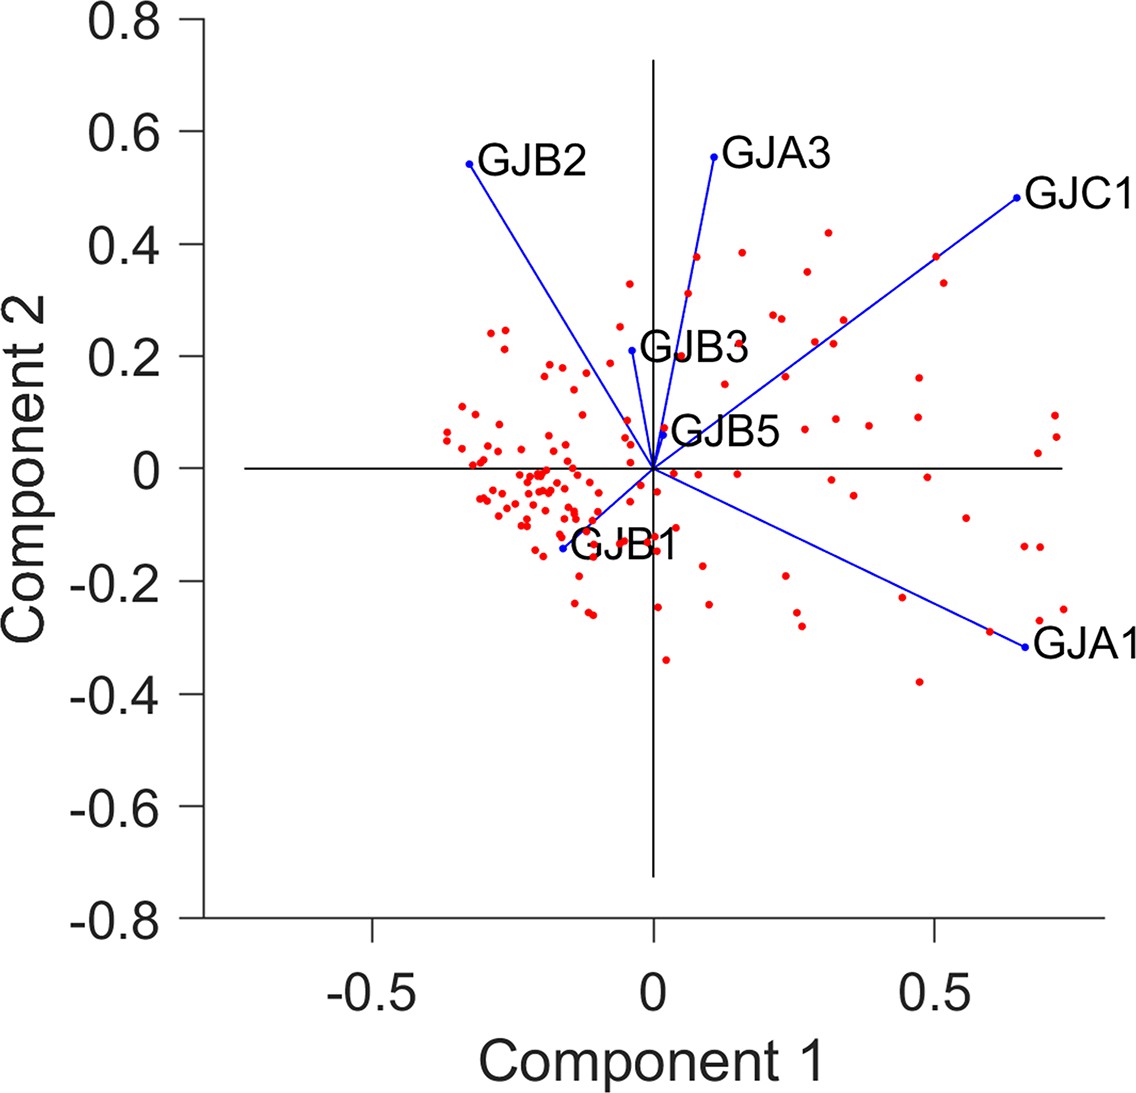
Principal component analysis (PCA) of microarray data for connexin gene expression, covering 79 colorectal cancer (CRC) lines.
This analysis, performed by MATLAB’s pca function, describes the connexin expression pattern for each cell line (each point representing one line). The first and second principal components (PC1 and PC2) account for 52% and 16% of variability, respectively. Note the correlation between GJB2 and GJB3.
Figure 2 with 2 supplements
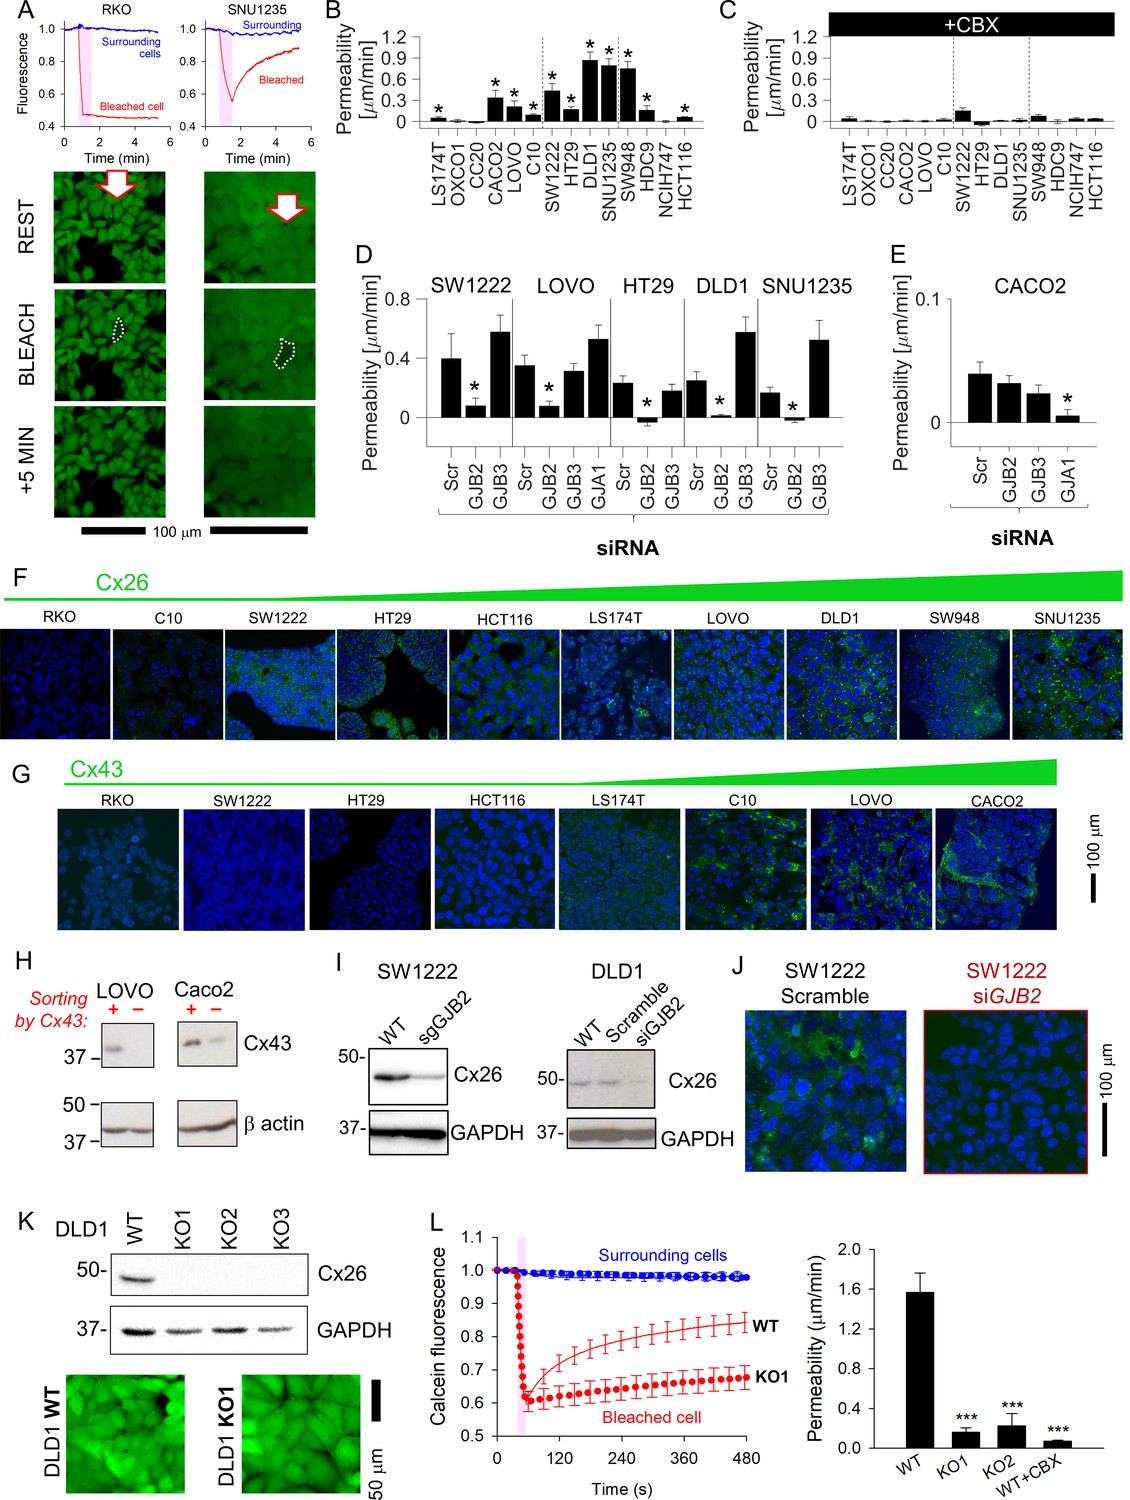
Connexin isoforms underpinning cell-to-cell coupling in colorectal cancer (CRC) cells.
(A) Fluorescence recovery after photobleaching (FRAP) protocol for interrogating the apparent cell-to-cell permeability to calcein in RKO cells (connexin-null) and SNU1235 cells (Cx26-positive). Images taken before bleaching (resting), immediately after bleach, and 5 min after bleach. (B) Apparent permeability to calcein (mean ± SEM) in CRC monolayers; * denotes significant coupling (t-test). For each experiment, measurements were obtained from at least five independently grown monolayers, with multiple technical repeats each. N = 15–80 per line. (C) FRAP measurements repeated in the presence of 100 μM carbenoxolone (CBX). (D, E) FRAP measurements on cells transfected with siRNA to knockdown GJA1, GJB3, or GJB2. Data normally distributed (Kolmogorov–Smirnov test). Statistical test by one-way ANOVA. * denotes significant decrease in permeability relative to scrambled construct control. (F) Immunofluorescence in monolayers showing nuclei stained with DAPI (blue) and connexin Cx26 (green), where present. (G) Immunofluorescence performed with Cx43 antibody (green). Images ranked by increasing connexin signal at cell-cell contacts. (H) Western blot of LOVO and Caco2 sub-populations following FAC-sorting by Cx43-status. (I) Confirmation that sgRNA or siRNA against GJB2 decreases the expression of Cx26 in DLD1 and SW1222 cells. (J) siRNA knockdown of GJB2 eliminates Cx26 immunofluorescence signal at cell-to-cell contacts in SW1222 cells. (K) Blot for Cx26 in DLD1 cells and knockout (KO1-3) clones, and confocal image of calcein-loaded monolayers established from wild-type (WT) or KO1 cells. (L). Confluent DLD1 GJB2 KO (clone 1) monolayers had substantially reduced cell-to-ell connectivity, as determined by FRAP. Mean ± SEM of 20 cells from three monolayers for each genotype. Data normally distributed (Kolmogorov–Smirnov test). Statistical test by one-way ANOVA. *** denotes significant difference (p<0.001) from WT.
-
Figure 2—source data 1
Full-length scans of blots for Figure 2H, I and K.
- https://cdn.elifesciences.org/articles/78425/elife-78425-fig2-data1-v2.xlsx
Figure 2—figure supplement 1
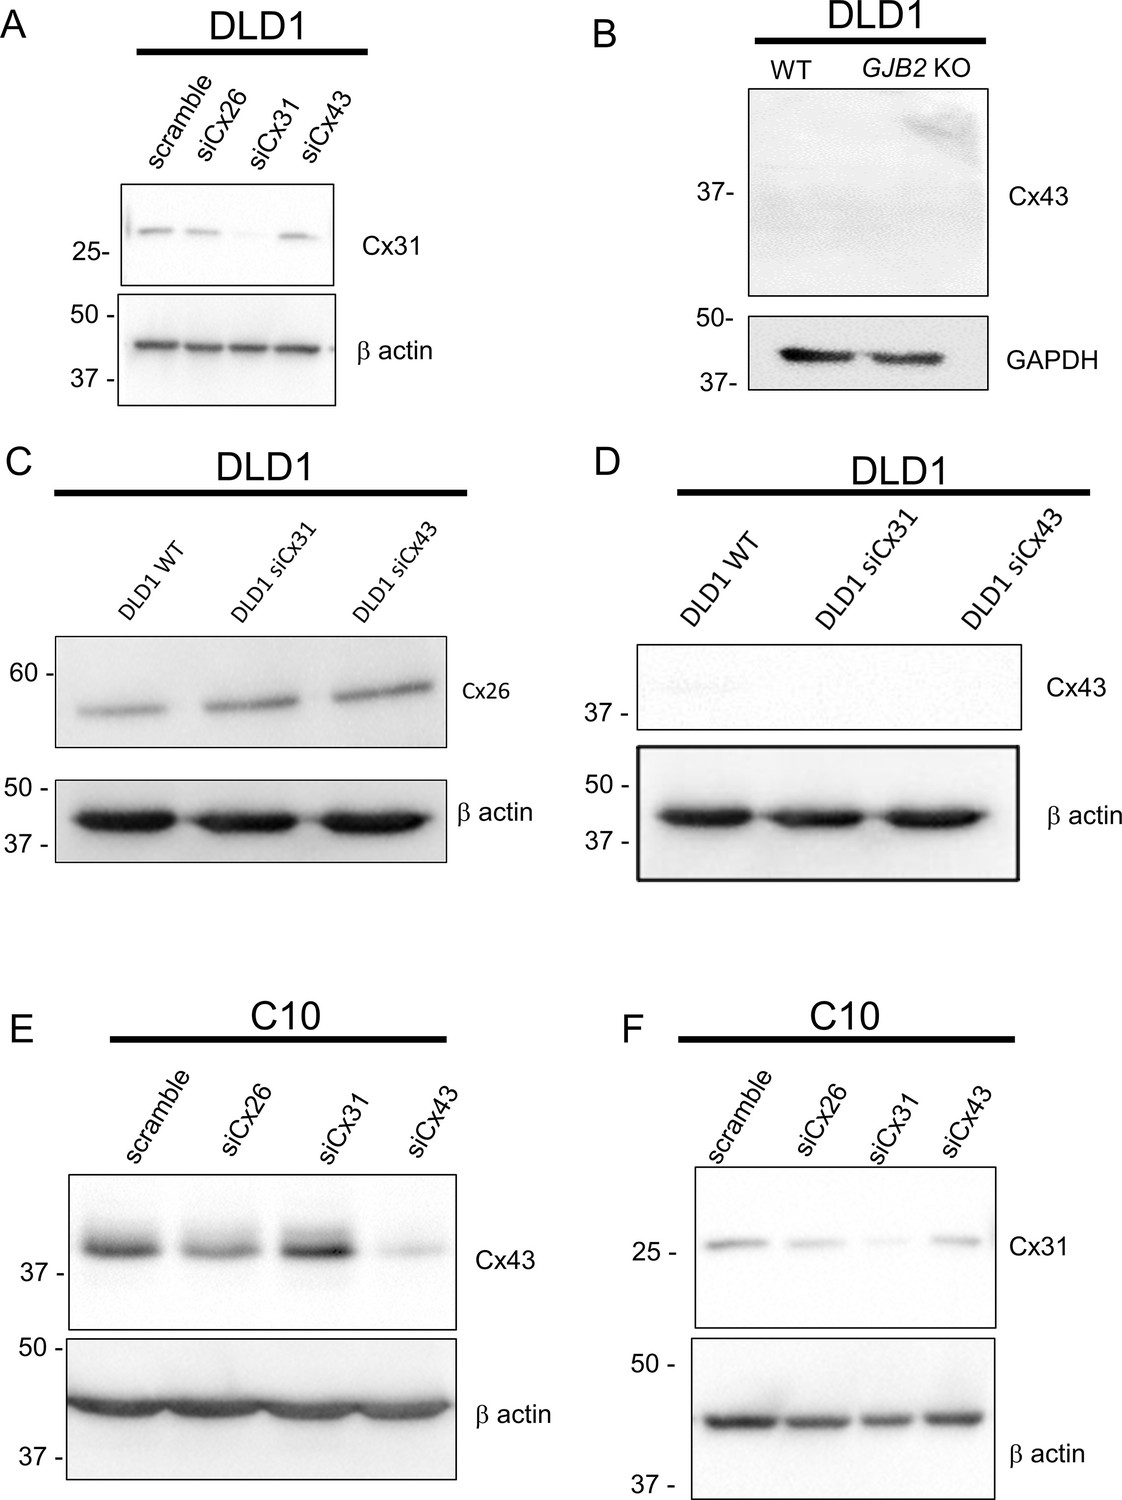
Western blot analysis of the effects of connexin gene ablation on the expression of selected connexin isoforms in DLD1 and C10 cells, including confirmation of knockdown efficacy.
(A) Effect of Cx26 (GJB2), Cx31 (GJB3) or Cx43 (GJA1) siRNA knockdown on Cx31 expression in DLD1 cells. (B) Effect of GJB2 knockout on Cx43 expression in DLD1 cells. (C) Effect of Cx31 (GJB3) or Cx43 (GJA1) siRNA knockdown on Cx26 expression in DLD1 cells. (D) Effect of Cx31 (GJB3) or Cx43 (GJA1) siRNA knockdown on Cx43 expression in DLD1 cells. (E) Effect of Cx26 (GJB2), Cx31 (GJB3) or Cx43 (GJA1) siRNA knockdown on Cx43 expression in C10 cells. (F) Effect of Cx26 (GJB2), Cx31 (GJB3) or Cx43 (GJA1) siRNA knockdown on Cx31 expression in C10 cells.
-
Figure 2—figure supplement 1—source data 1
Full-length scans of blots for Figure 2—figure supplement 1A–F.
- https://cdn.elifesciences.org/articles/78425/elife-78425-fig2-figsupp1-data1-v2.zip
Figure 2—figure supplement 2
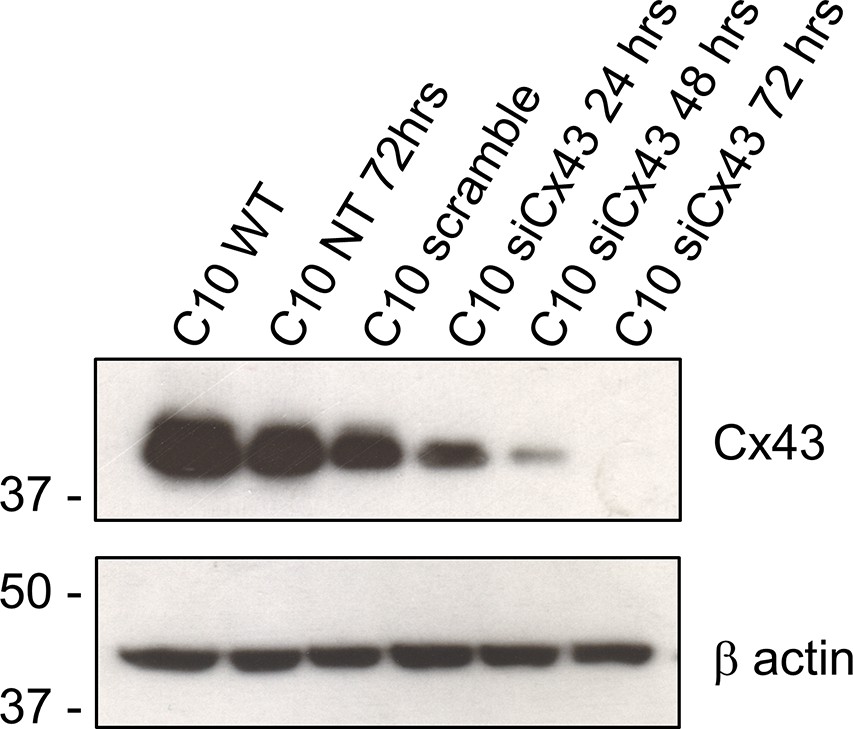
Confirmation of the knockdown efficiency of siRNA construct against GJA1 (Cx43) in C10 cells.
-
Figure 2—figure supplement 2—source data 1
Full-length scans of blots for Figure 2—figure supplement 2.
- https://cdn.elifesciences.org/articles/78425/elife-78425-fig2-figsupp2-data1-v2.zip
Figure 3 with 1 supplement
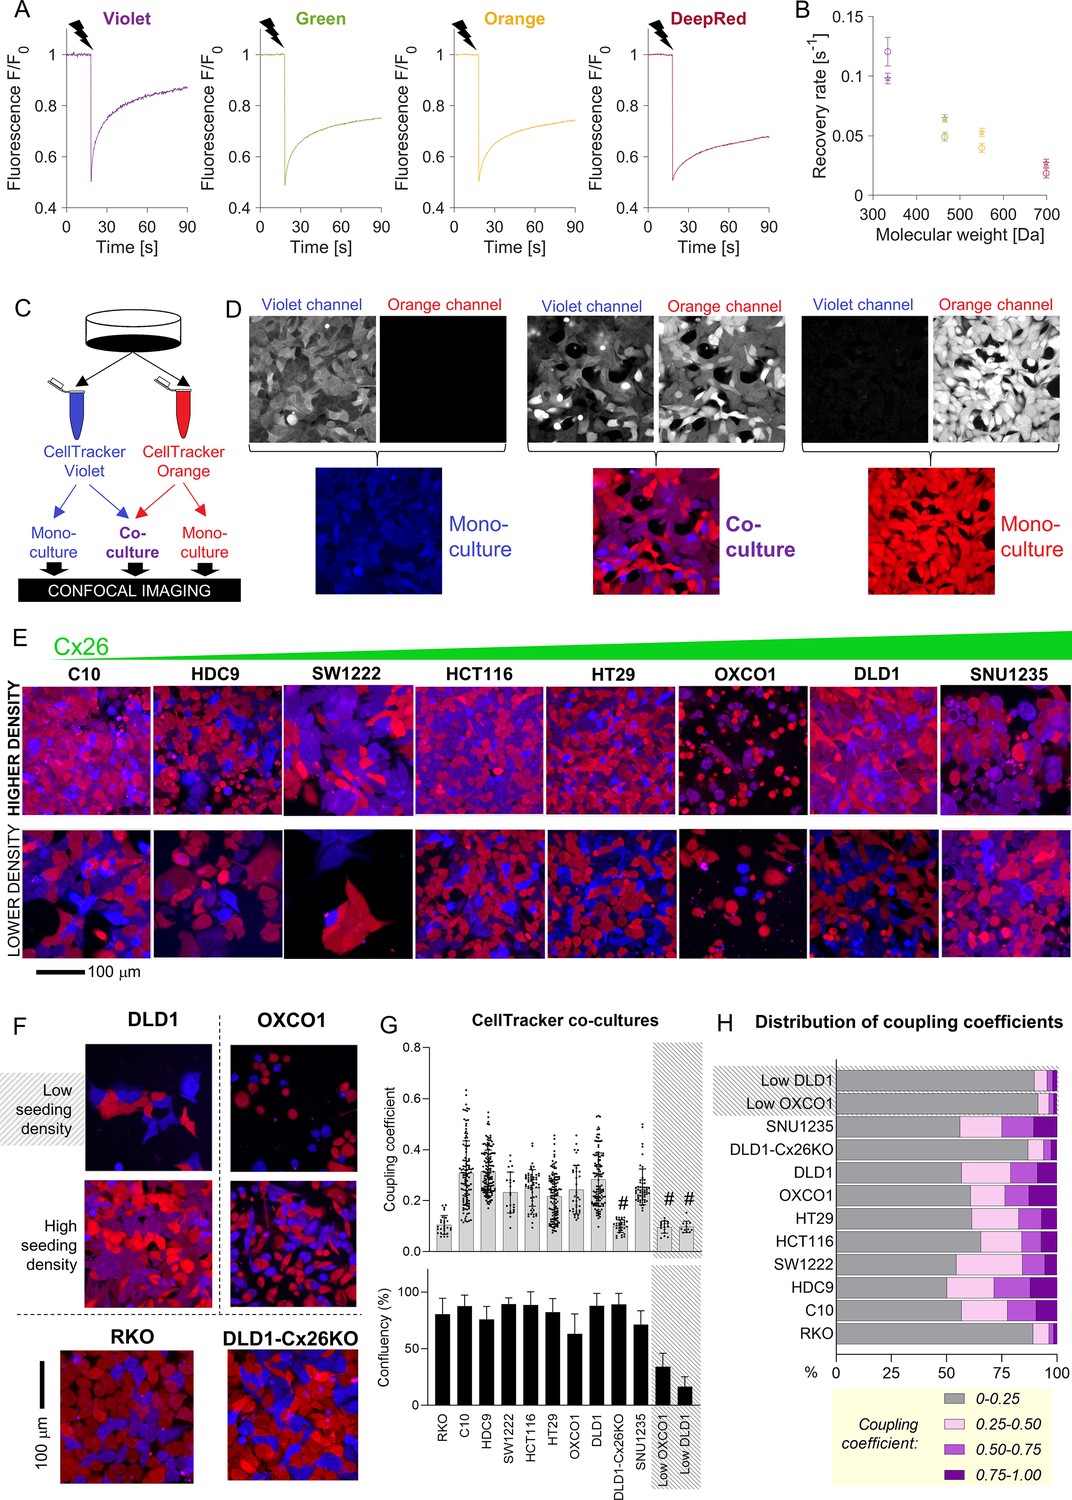
Fluorescent molecules equilibrate between coupled cells: imaging.
(A) Representative time courses of fluorescence recovery after photobleaching (FRAP) protocol for measuring cytoplasmic diffusivity of CellTracker dyes in DLD1 cells in sparse culture. (B) Mean recovery rate constant as a function of the molecular weight of the CellTracker dye. Mean ± SEM; N = 20–25 DLD1 cells (star symbol), 7–15 LOVO cells (circles). (C) Schematic for preparing co-cultures or mono-cultures loaded with CellTracker dyes. (D) Confocal imaging of DLD1 monolayers. CellTracker Orange is pseudocolored red and CellTracker Violet is pseudocolored blue; mixing produces purple appearance. (E) Images of co-cultures from eight colorectal cancer (CRC) lines, ranked by increasing GJB2 message, acquired from confluent and low-confluency regions. (F) Exemplar images of monolayers established from high- and low-density cultures, showing more exchange where cells make extensive cell-to-cell contacts. For comparison, RKO cells shown at high density; these cells do not express connexin genes. (G) Quantification of dye exchange in terms of coupling coefficient. Note that mono-cultures produce no (Violet) or very low (Orange) coupling coefficients (see Figure 3—figure supplement 1). Mean ± SEM of multiple fields of view from 4 to 7 biological repeats. Shaded data indicate data from ‘low’ seeding density, that is, low coupling. # denotes significant (p<0.05) difference between low and high seeding density, performed pairwise for OXCO1 and DLD1 cells. (H) Frequency distribution of coupling coefficient ranked by decreasing coupling strength.
-
Figure 3—source data 1
Permeability data from FRAP experiments.
- https://cdn.elifesciences.org/articles/78425/elife-78425-fig3-data1-v2.xlsx
-
Figure 3—source data 2
Coupling coefficient data from CellTracker exchange experiments.
- https://cdn.elifesciences.org/articles/78425/elife-78425-fig3-data2-v2.xlsx
Figure 3—figure supplement 1
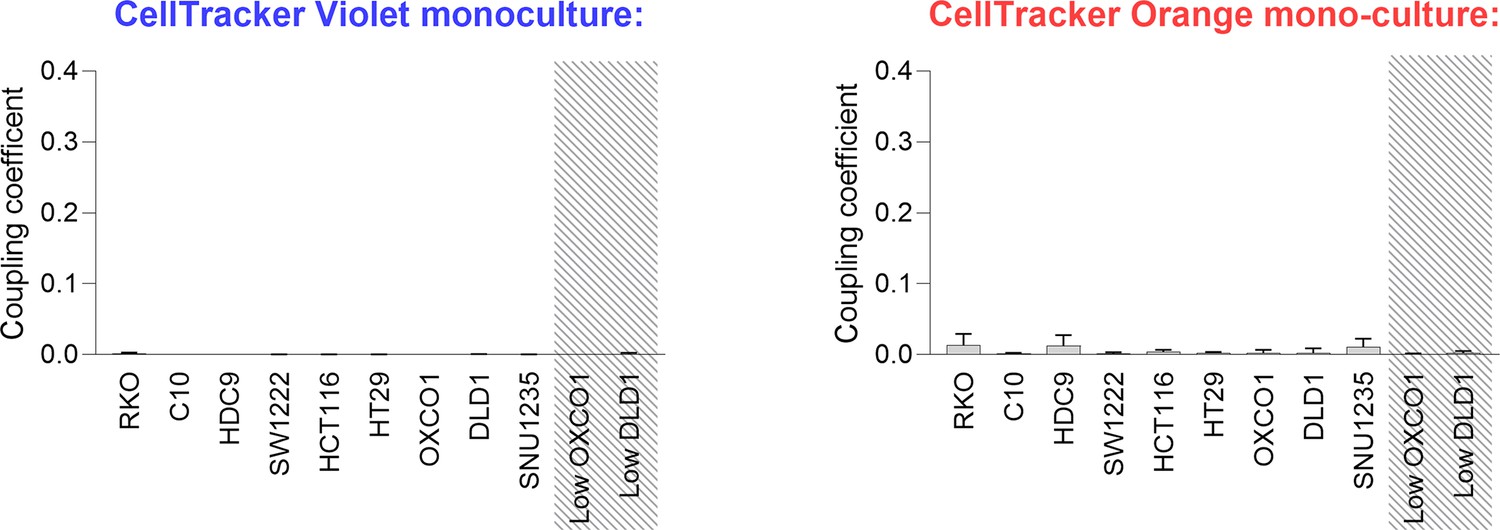
Confirmation that mono-cultures established using one CellTracker dye only produce negligible coupling coefficients, as expected from the absence of a second dye.
Figure 4
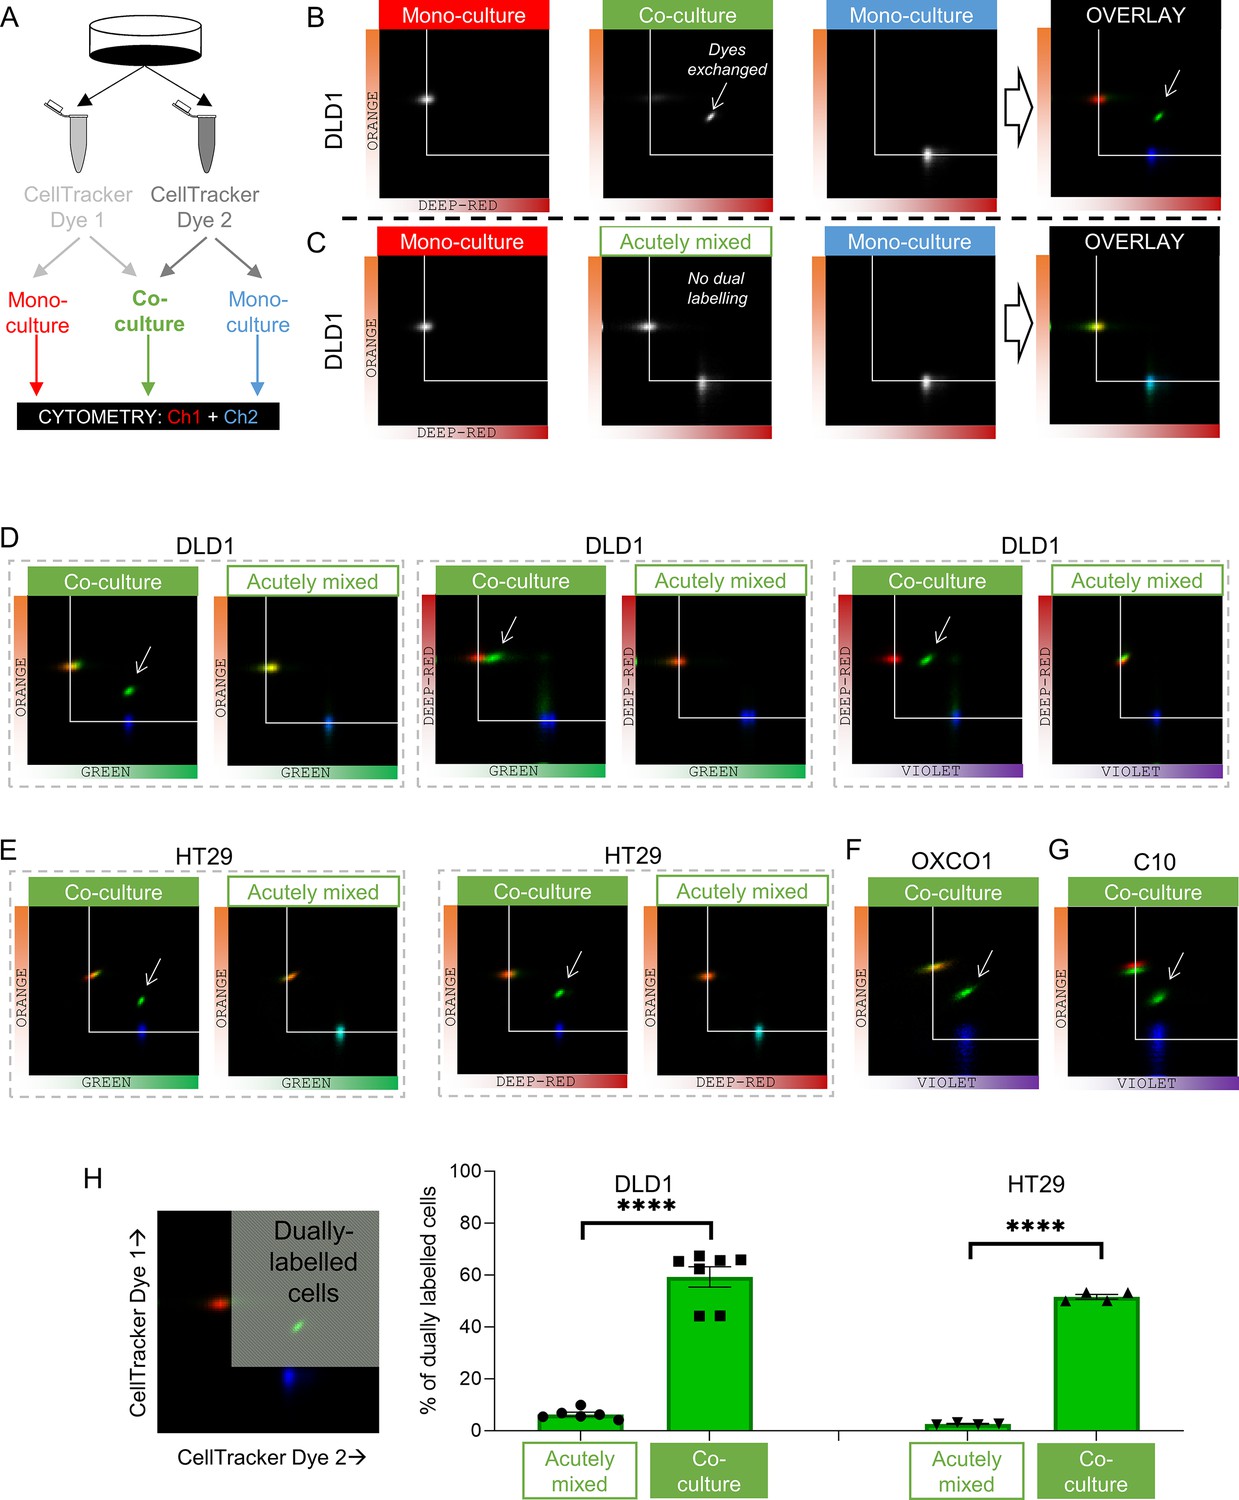
Fluorescent molecules equilibrate between coupled cells: cytometry.
(A) Schematic for producing mono-cultures or co-cultures with pairs of CellTracker dyes. (B) Cytometry of DLD1 mono-cultures grown from cells loaded with either DeepRed or Orange, or co-cultures grown from 1:1 mix of cells loaded with DeepRed and Orange. Logarithmic axes showing signal on the relevant detection channels. CellTracker Orange mono-cultures emit signal on the orange detection channel only; CellTracker DeepRed mono-cultures emit signal on the DeepRed detection channel only; co-cultures emit fluorescence on both detection channels (indicating that dye exchange had taken place). Overlay shows pseudocolored bivariate density maps: red for Orange mono-cultures, blue for DeepRed mono-cultures and green for co-cultures. Arrow points to cluster showing evidence for dye exchange. (C) Flow cytometry of DLD1 cells that were grown as mono-cultures labeled with either DeepRed or Orange. Aliquots of DeepRed- and Orange-labeled cells were mixed prior to flow cytometry to test for acute dye exchange. Analyses show no evidence for dye exchange between acutely mixed cell suspensions. (D) Cytometry of co-cultured or acutely mixed DLD1, (E) HT29, (F) OXCO1, or (G) C10 cells loaded with various pairs of CellTracker dyes. (H) Quantification of the fraction of cells that had exchanged CellTracker dyes. Region thresholds defined by 95th percentile of signal detected on channels. Significant dye exchange took place only in co-cultured cells but not acutely mixed cells. Mean ± SEM. Significance testing by t-test: ****p<0.0001. Each data point represents a separate batch of cells processed for flow cytometry.
-
Figure 4—source data 1
Quantification of flow cytometry results.
- https://cdn.elifesciences.org/articles/78425/elife-78425-fig4-data1-v2.xlsx
Figure 5 with 1 supplement

Diffusive coupling rescues genetically inactivated Na+/H+ exchange function.
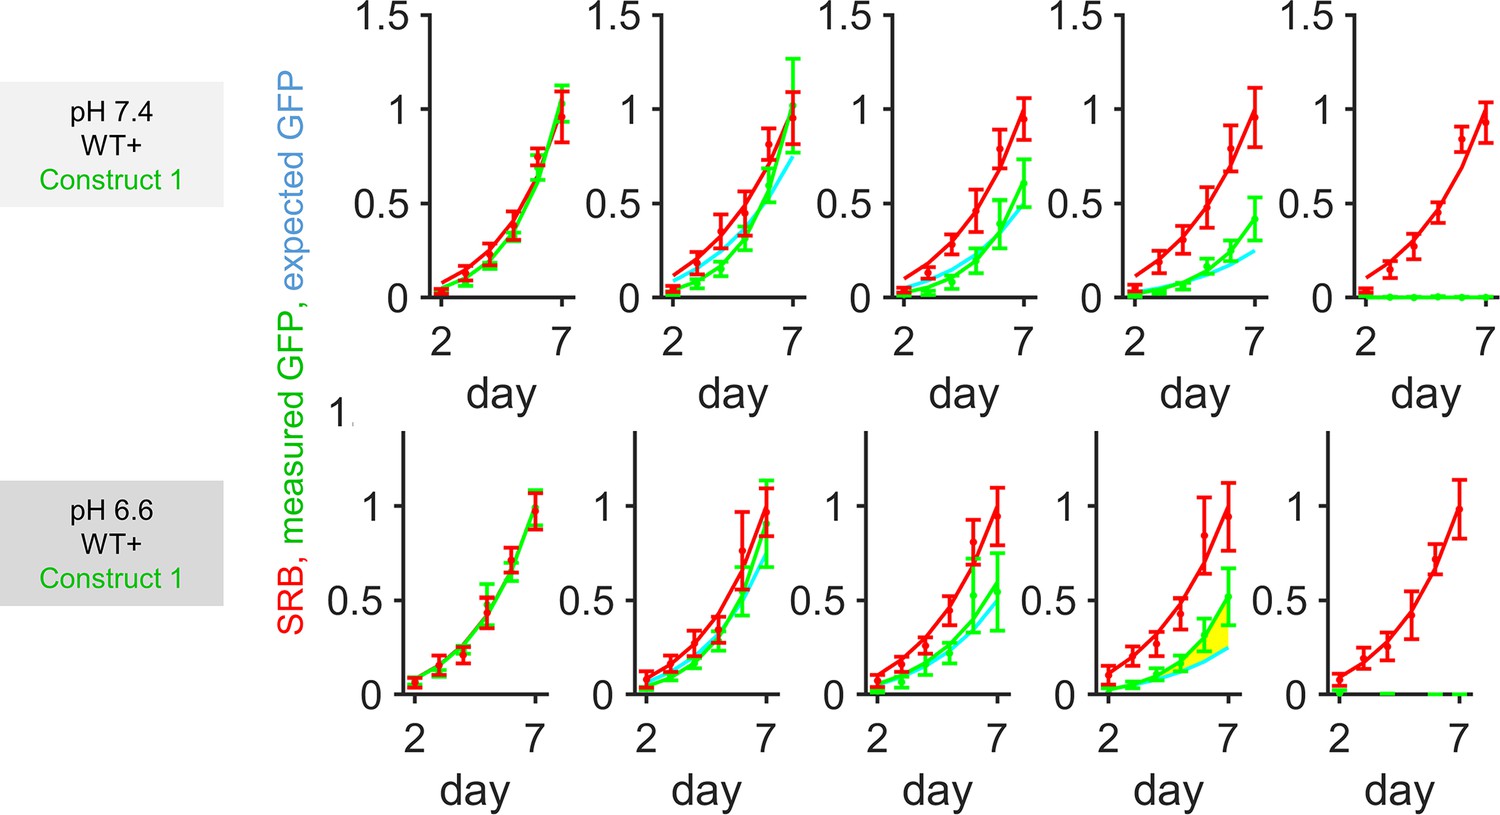
(A) Western blot for NHE1, product of SLC9A1 in wild-type (WT) HCT116 and two knockout (KO) clones. gRNA for KO1 produced a truncated protein, whereas gRNA for KO2 produced complete ablation of expression. (B) Functional confirmation of genetic inactivation of SLC9A1. Measurements of intracellular pH (pHi) in HCT116 monolayers: following acid-loading by ammonium prepulse (absence of CO2/HCO3- buffer), NHE1 activity in WT (+) cells mediates recovery of pHi (N = 13 biological repeats, with three technical repeats each), blocked pharmacologically with cariporide (30 µM; N = 6 biological repeats, with three technical repeats each). KO clones (N = 7–9 biological repeats, with three technical repeats each) produce no NHE1 activity. Mean ± SEM. (C) Co-culture of WT and KO HCT116 cells. Cells loaded with cSNARF to stain cytoplasm; GFP fluorescence emitted from KO cells. (D) Ammonium prepulse performed on co-cultures, separating signal from WT (GFP-negative: black) and KO cells (GFP-positive: green). Mean ± SEM (N = 9–13 biological repeats, with three technical repeats each). For comparison, dotted line shows results from WT or KO mono-cultures. (E) Relationship between extracellular and intracellular pH measured in HEPES-MES buffered media (absence of CO2/HCO3- buffer) for WT cells, GJB2 knockdown cells, or SLC9A1 KO cells. Results from clones 1 and 2 were not significantly different and pooled together. Measurements were performed for mono-cultures or co-cultures. Mean ± SEM (clockwise: N = 6 WT and 6 WT sgGJB2 mono-cultures; 6 WT and 7 KO mono-cultures; 8 WT + KO co-cultures; 6 WT sgGJB2 + KO co-cultures; each with six technical repeats). Statistical testing by two-way ANOVA for pH and genotype; effect of genotype reported in figure (***p<0.001). (F) Analysis of pHi data from (E) in terms of frequency distribution of pHi, offset to the mode. (G) Growth curves for HCT116 cells grown as co-cultures of various ratios of WT and KO2 cells, quantified in terms of GFP fluorescence (KO compartment) and sulforhodamine B (SRB) absorbance (total biomass) over 7 days of culture, starting from a seeding density of 2000 cells/well. Mean ± SEM (N = 5 per construct, with four technical repeats each). Significant enrichment indicates that the KO compartment expanded faster than expected from the SRB curve and seeding ratio (2000:0, 1500:500, 1000:1000, 500:1500, and 0:2000), indicating that KO cells benefited from coupling onto WT neighbors. Statistical testing by two-way ANOVA between GFP time course and SRB time course scaled by initial seeding ratio (e.g., 0.5 for 1:1 co-culture); p-value reported for difference between measured growth of KO2 cells (GFP) and prediction growth (SRB, scaled by KO2:WT seeding ratio). Significance at p<0.05 indicated by shading between measured (green) and predicted (cyan) time course. Media were at pH 7.4. Bar graph shows GFP signal at day 7 of culture. Gray line is predicted signal. Significant enrichment of GFP cells for seeding ratios of 1:1 and 1:3 (KO2:WT). (H) Experiments repeated using media at pH 6.6.
-
Figure 5—source data 1
Full-length scans of blots for Figure 5A.
- https://cdn.elifesciences.org/articles/78425/elife-78425-fig5-data1-v2.xlsx
Figure 5—figure supplement 1
Growth curves for HCT116 cells grown as co-cultures of various ratios of wild-type (WT) and knockout (KO) 1 cells, quantified in terms of GFP fluorescence (KO compartment) and sulforhodamine B (SRB) absorbance (total biomass) over 7 days of culture, starting from a seeding density of 2000 cells/well.
Mean ± SEM (N = 5 per construct, with three technical repeats each). Significant enrichment indicates that the KO compartment expanded faster than expected from the SRB curve and seeding ratio (2000:0, 1500:500, 1000:1000, 500:1500, and 0:2000), indicating that KO cells benefited from coupling onto WT neighbors. Statistical testing by two-way ANOVA; p-value reported for difference between measured growth of KO cells (GFP) and prediction growth (SRB, scaled by KO:WT seeding ratio). Yellow shading denotes significance at p<0.05. Media were at pH 7.4 or 6.6.
Figure 6 with 3 supplements
Diffusive coupling rescues genetically inactivated glycolysis.
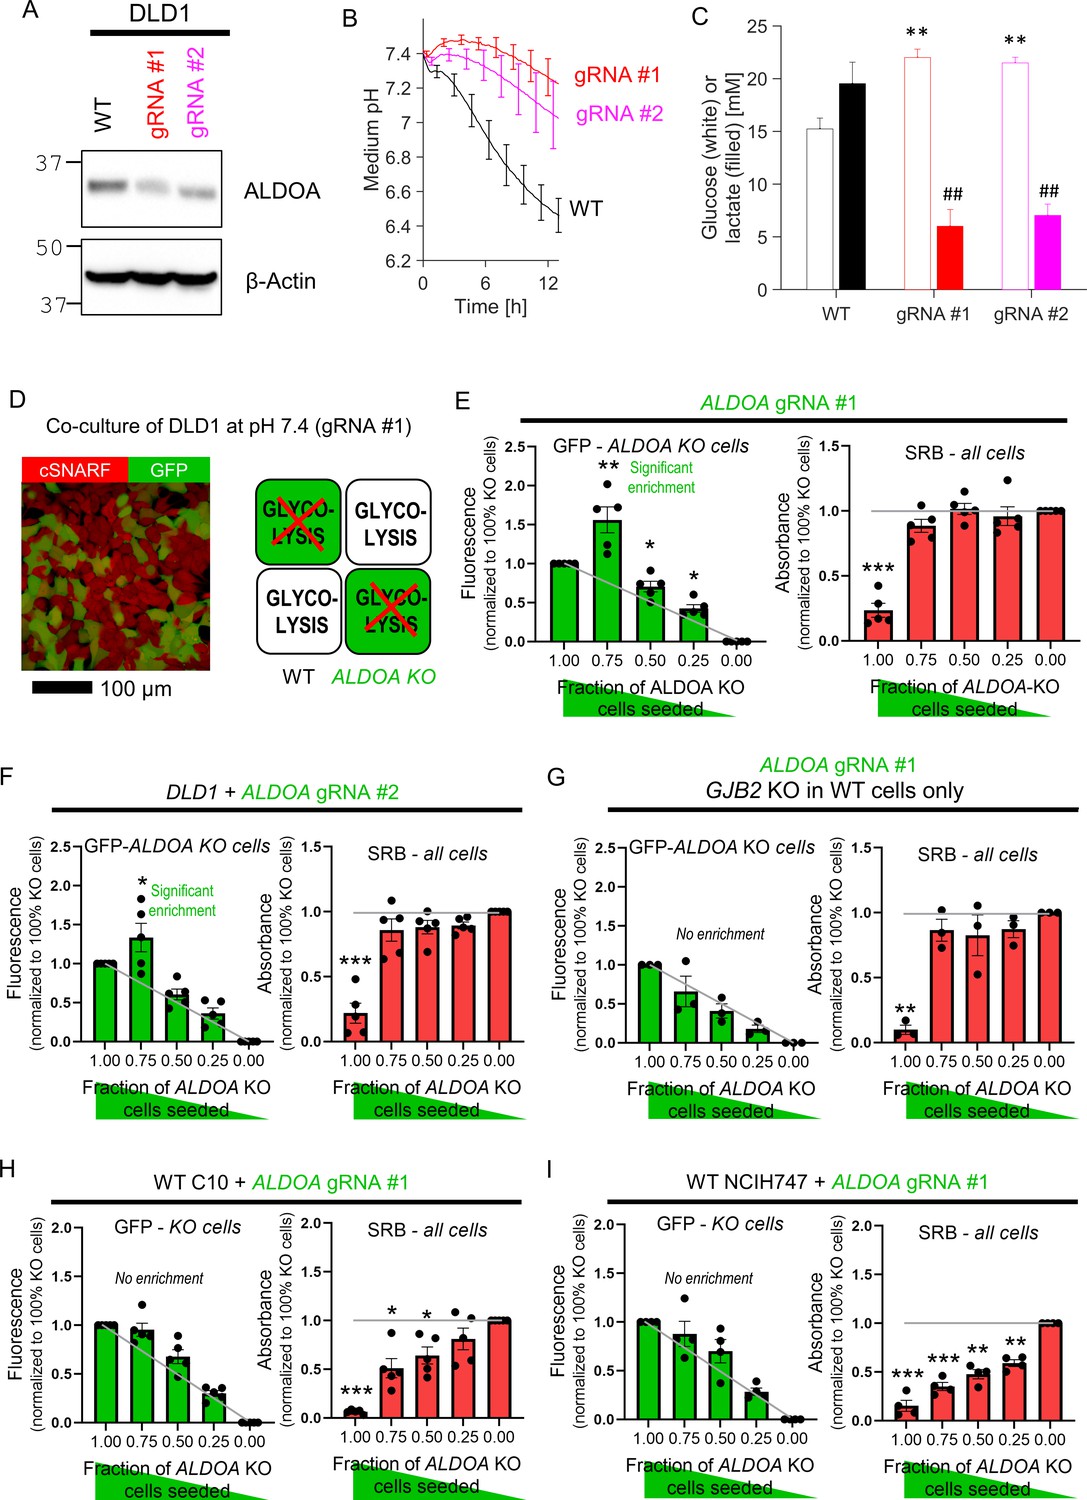
(A) Western blot for aldolase A (ALDOA) in wild-type (WT) DLD1 cells and cells infected with one of two guide RNA constructs to genetically inactivate ALDOA. (B) Medium acidification measured in confluent DLD1 cells in low-buffer power media (2 mM HEPES+MES). WT cells are highly glycolytic, as measured from the acidification time course. Glycolytic rate is greatly reduced by ALDOA ablation. Mean ± SEM (N = 4 plates, each with three technical repeats). (C) DLD1 cells cultured for 4 days in CO2/HCO3- buffered media. Media collected at endpoint were assayed for glucose and lactate. Mean ± SEM (N = 3 plates, each three technical repeats pooled per assay). ** denotes significant difference (p<0.01) in glucose consumption relative to WT; ## denotes significant difference (p<0.01) in lactate production relative to WT; testing by one-way ANOVA and multiple-comparisons test. Normality test by Kolmogorov–Smirnov test. (D) Co-culture of WT and ALDOA-deficient DLD1 cells. Cells loaded with cSNARF-1 to indicate cytoplasm; GFP fluorescence emitted from gRNA-infected cells. (E). GFP fluorescence and sulforhodamine B (SRB) absorbance after 6 days of culture of various seeding ratios of WT and ALDOA-deficient cells infected with construct #1: 2000:0, 1500:500, 1000:1000, 500:1500, and 0:2000. Left: gray line shows expected GFP signals if growth of WT and ALDOA-deficient cells was no different. Right: gray line shows expected SRB signal if growth of WT and ALDOA-deficient cells was no different. Significance testing by t-test relative to gray line. Mean ± SEM (N = 5 plates, six technical repeats each). Normality test by Kolmogorov–Smirnov test. Significance testing by one-sample t-test relative to expected value (shown as gray line). (F) Experiment repeated with construct 2. Mean ± SEM (N = 5 plates, six technical repeats each). (G) Experiment repeated using GJB2 knockout DLD1 cells in place of WT DLD1 cells. This substitution has the effect of preventing connexin-dependent coupling between glycolytic DLD1 and ALDOA-deficient cells. Mean ± SEM (N = 3 plates, six technical repeats each). (H) Co-culture experiment of WT C10 cells with GFP-labeled ALDOA-deficient C10 cells (gRNA #1). Mean ± SEM (N = 5 plates, six technical repeats each). (I) Co-culture experiment of WT NCIH747 cells with GFP-labeled ALDOA-deficient NCIH747 cells (gRNA #1). Mean ± SEM (N = 4 plates, six technical repeats each).
-
Figure 6—source data 1
Full-length scans of blots for Figure 6A.
- https://cdn.elifesciences.org/articles/78425/elife-78425-fig6-data1-v2.xlsx
Figure 6—figure supplement 1
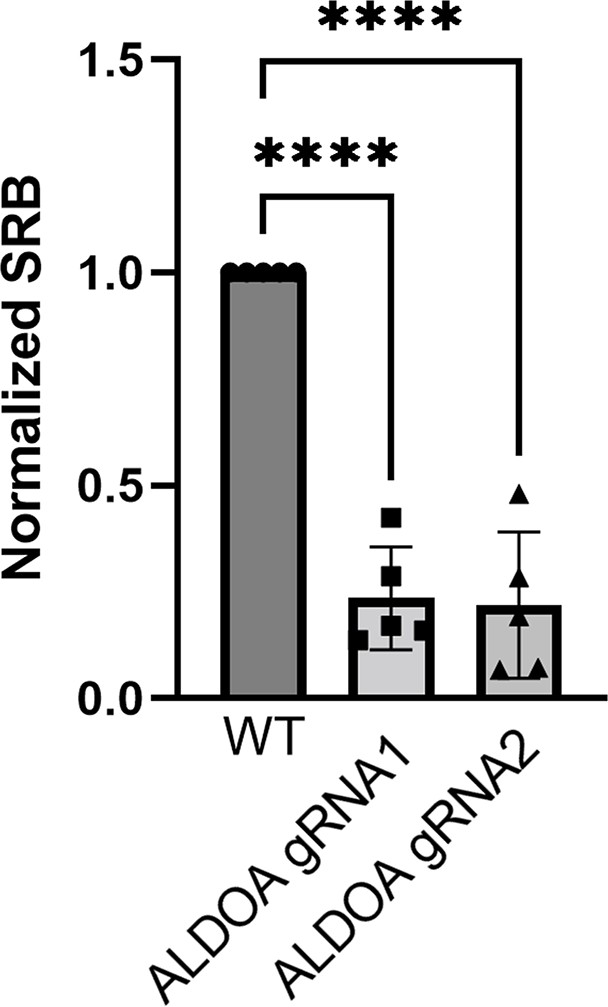
Sulforhodamine B (SRB) absorbance after 6 days of culture of ALDOA-deficient cells infected with construct #1 or #2, normalized to time-matched wild-type (WT) cells.
One-way ANOVA, pairwise testing.
Figure 6—figure supplement 2
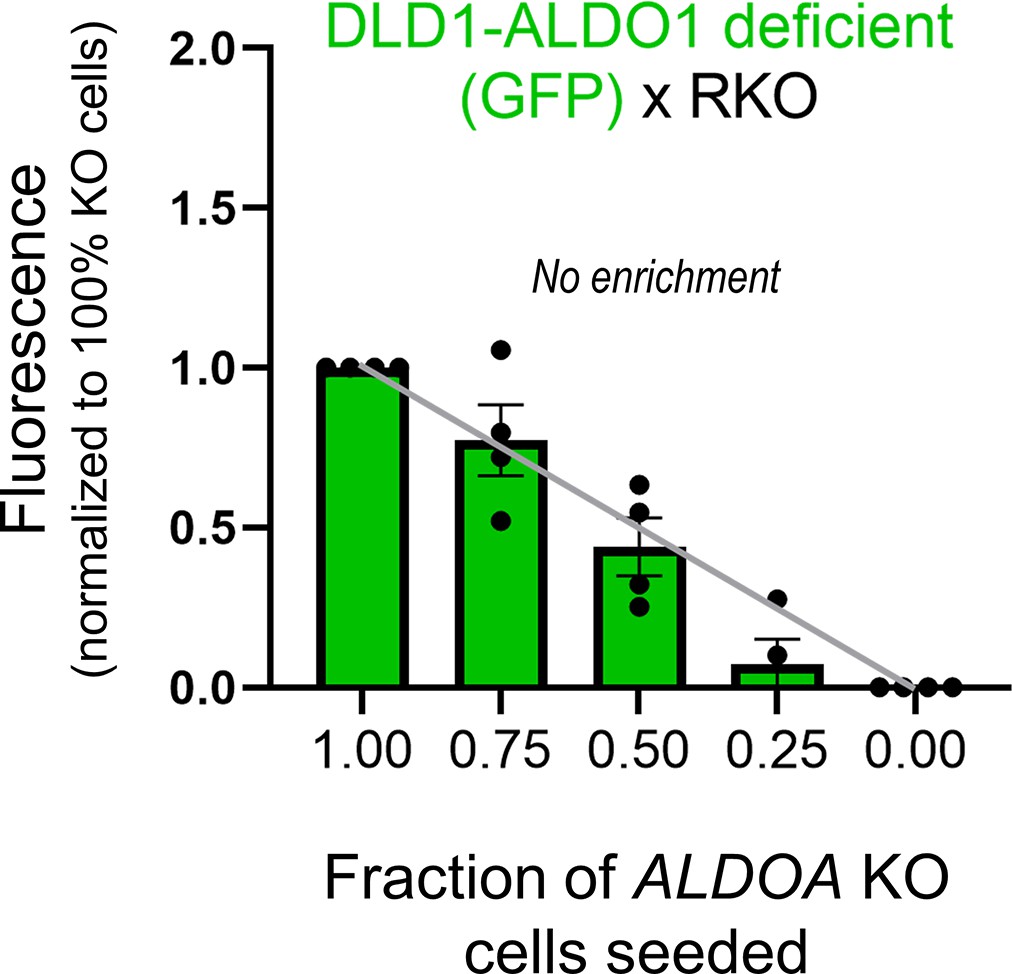
GFP fluorescence after 6 days of culture of various seeding ratios of wild-type (WT) RKO cells with ALDOA-deficient DLD1 cells: 2000:0, 1500:500, 1000:1000, 500:1500, and 0:2000.
Gray line shows expected GFP signals if growth of ALDOA-deficient cells was not supported by coupling onto WT cells. Media pH set to 7.4. Significance testing by t-test relative to gray line. Mean ± SEM (N = 4 plates, four technical repeats each). Normality test by Kolmogorov–Smirnov test. Significance testing by one-sample t-test relative to expected value (shown as gray line).
Figure 6—figure supplement 3
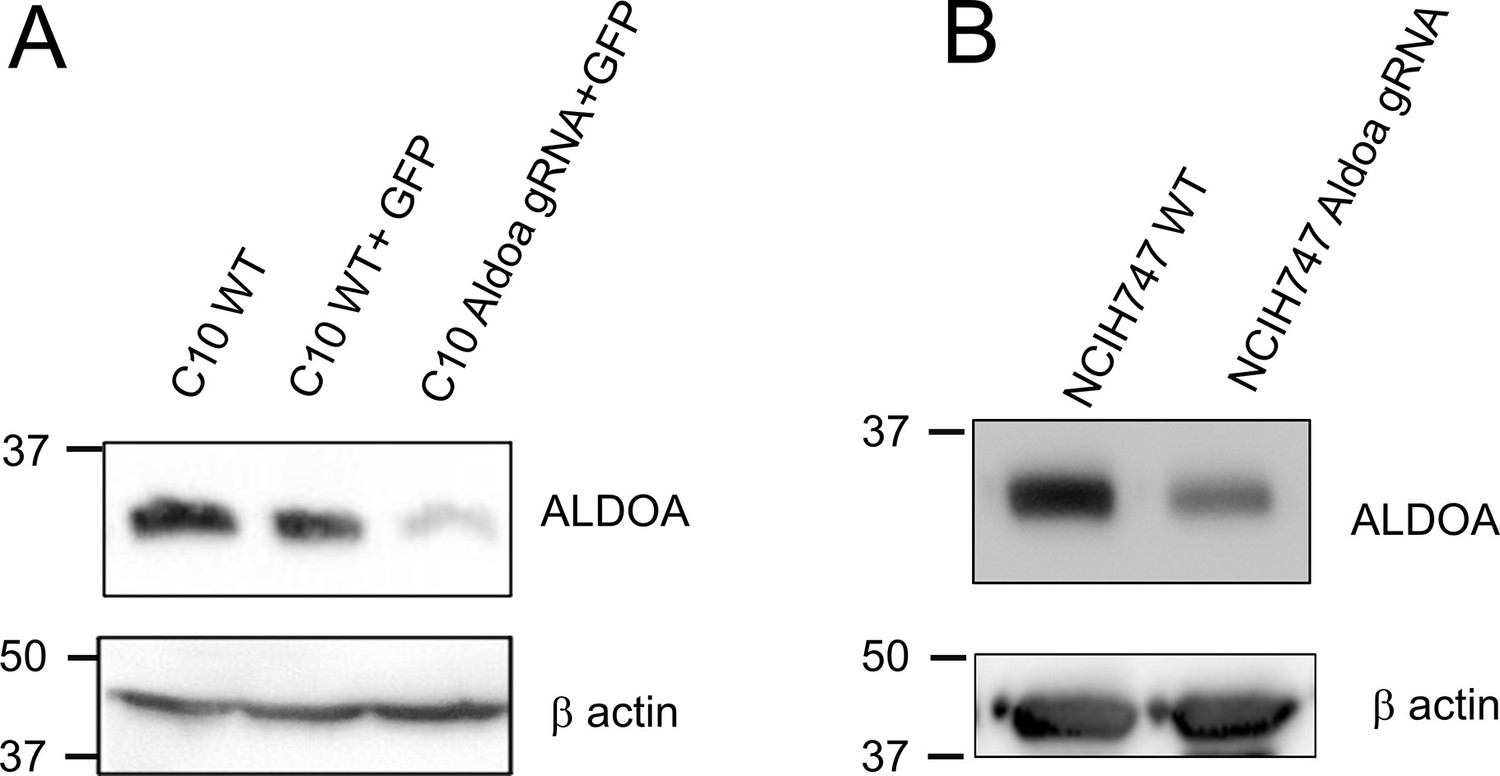
Western blot confirmation of the effect of siRNA knockdown of ALDOA on protein levels n (A) C10 and (B) NCIH747 cells.
-
Figure 6—figure supplement 3—source data 1
Full-length scans of blots for Figure 6—figure supplement 3A and B.
- https://cdn.elifesciences.org/articles/78425/elife-78425-fig6-figsupp3-data1-v2.zip
Figure 7 with 1 supplement
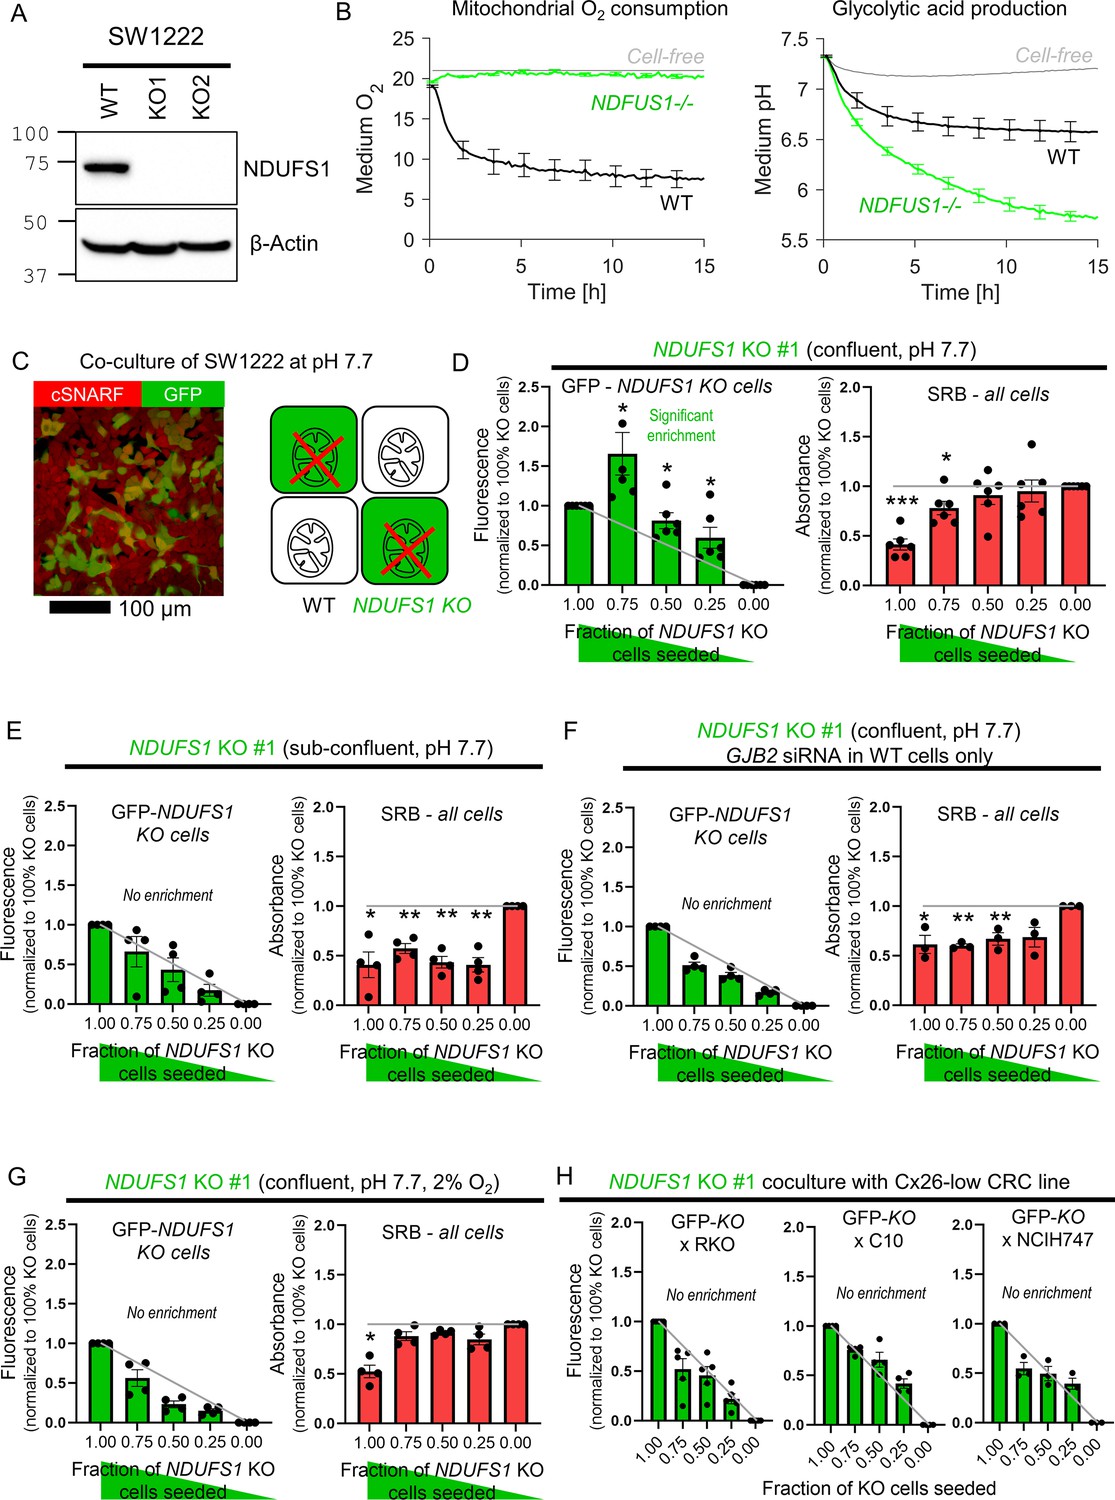
Diffusive coupling rescues genetically inactivated mitochondrial respiration.
(A) Western blot for NDUFS1 in wild-type (WT) SW1222 cells and NDUFS1 knockout (KO) clones established using one of two guide RNAs. (B) Fluorimetric measurements of oxygen consumption and acid production (assays of respiratory and glycolytic rates) in WT and NDUFS1 KO SW1222 cells. Mean ± SEM (N = 3 plates, three technical repeats each). (C) Co-culture of WT and NDUFS1 KO cells. Cells loaded with cSNARF-1 to indicate cytoplasm; GFP fluorescence emitted from KO cells. (D) GFP fluorescence and sulforhodamine B (SRB) absorbance after 6 days of culture of various seeding ratios of WT and NDUFS1-deficient cells infected with construct #1: 2000:0, 1500:500, 1000:1000, 500:1500, and 0:2000. Left: gray line shows expected GFP signals if growth of WT and NDUFS1-deficient cells was no different. Right: gray line shows expected SRB signal if growth of WT and NDUFS1-deficient cells was no different. Media pH set to 7.7. Significance testing by t-test relative to gray line. Mean ± SEM (N = 4 plates, four technical repeats each). Normality test by Kolmogorov–Smirnov test. Significance testing by one-sample t-test relative to expected value (shown as gray line). (E) Experiment repeated at lower (1000/well) seeding density to reduce incidence of cell coupling. Mean ± SEM (N = 4 plates, six technical repeats each). (F) Experiment repeated with WT cells GJB2 KD via siRNA, that is, inactivating connexin coupling between WT and NDUFS1-deficient cells. Mean ± SEM (N = 3 plates, six technical repeats each). (G) Experiment repeated under hypoxic conditions, which suppresses mitochondrial function. Mean ± SEM (N = 4 plates, six technical repeats). (H) Co-culture of GFP-labeled NDUFS1 KO cells (#1) with one of three Cx26-negative cells: WT RKO, C10, or NCIH747 cells.
-
Figure 7—source data 1
Full-length scans of blots for Figure 7A.
- https://cdn.elifesciences.org/articles/78425/elife-78425-fig7-data1-v2.xlsx
Figure 7—figure supplement 1
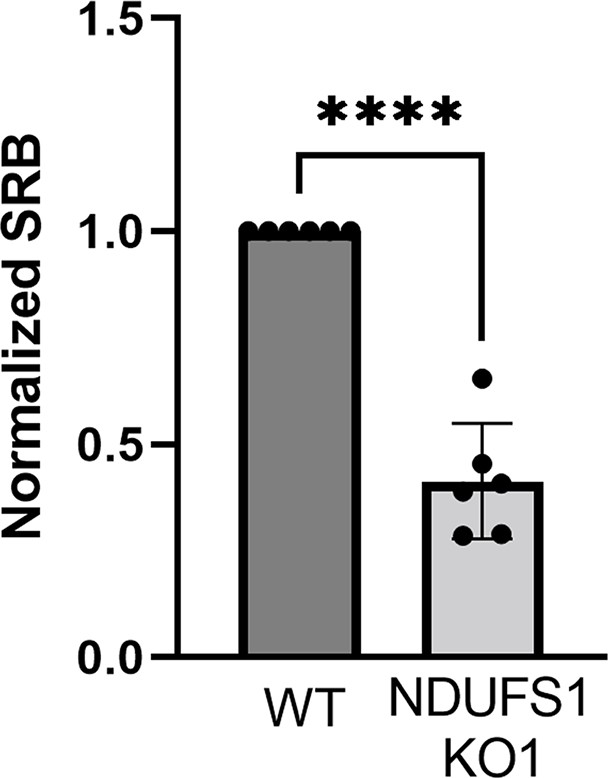
Sulforhodamine B (SRB) absorbance after 6 days of culture of NDUFS1-deficient cells, normalized to time-matched wild-type (WT) cells (t-test).
Figure 8 with 1 supplement
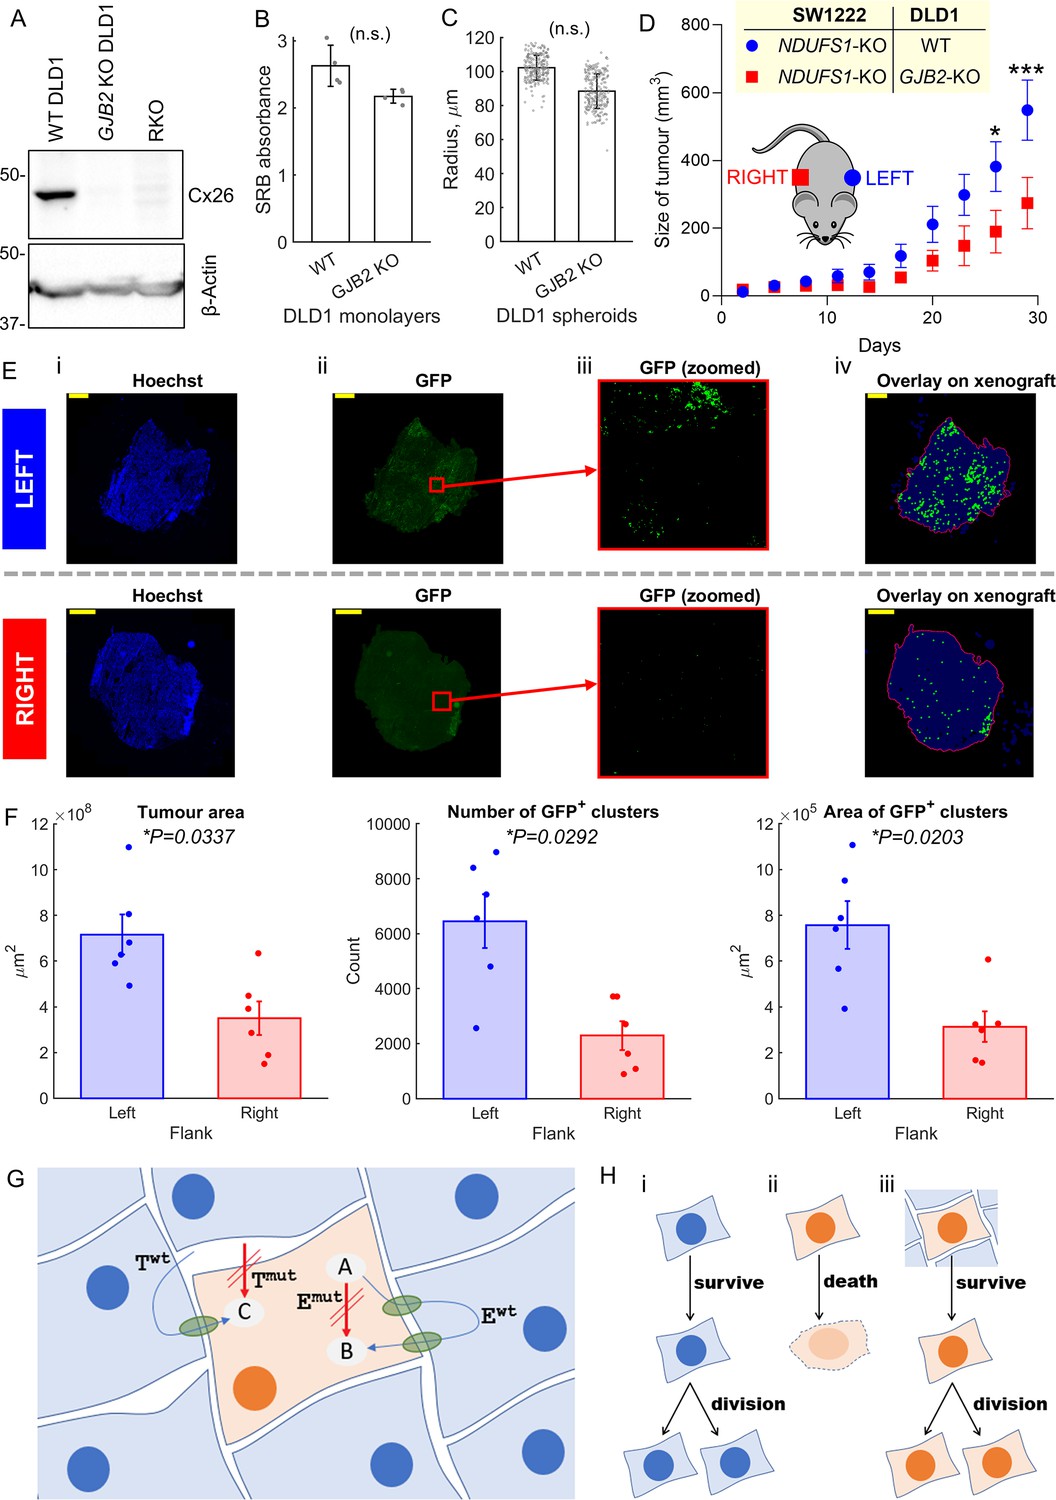
Metabolic rescue by connexins channels.
(A) Western blot for Cx26, showing absence of protein in GJB2 knockout (KO) DLD1 cells. RKO used as negative control. (B) Effect of Cx26 (GJB2) knockout on DLD1 cell growth in 2-D monolayer (n = 4; not significant, paired t-test). Seeded at 2000/well, growth after 6 days measured by sulforhodamine B (SRB) assay (absorbance, 520 nm). (C) Effect of Cx26 (GJB2) knockout on ability of DLD1 cell to form spheroids (n = 3 platings, each yielding 60–80 spheroids; not significant, nested paired t-test). (D) Growth curves of xenografts on left and right flank of nude female mice (n = 6). Analysis by repeated-measures two-way ANOVA (*p<0.05, ***p<0.001). Time courses aligned to endpoint. (E) Histology of selected 5 μm slices through the middle of a xenograft on the left or right flank (matched animal). Panels show (i) staining for Hoechst, (ii) GFP signal from antibody, (iii) GFP signal in a central area of the field of view, after removing background (thresholding), and (iv) analysis of GFP-positive clusters (indicated by green dot) within outline (red) of tumor mass. Scale bar is 1 mm. (F) Results of analysis of left and right flank xenografts from six mice in terms of tumor area, number of GFP-positive clusters, and ensemble area of GFP-positive clusters. (G) Cartoon summary of the role of connexin channels, particularly Cx26 (green conduits) in rescuing cell carrying mutations in an enzyme (Emut) and membrane transporter (Tmut). Itself, the mutation-bearing cell is unable to convert substrate A to B (by enzyme E) and take up substance C. However, these functions can be rescued by diffusive exchange of A, B, and C with neighboring cells that express wild-type (WT) Twt and Ewt. (H) Scenario i: a WT cell survives and divides. Scenario ii: in isolation or in mono-culture, a mutation-bearing cell cannot survive and fails to divide and therefore carry on its genetic mutation. In a human tumor, this would lead to negative selection of such loss-of-function mutations in important genes (coding for E and T). Scenario iii: coupling onto WT cells can rescue the metabolic defect of the mutation-bearing cell, hence allowing survival. These mutations will carry on to daughter cells and therefore not lead to negative selection.
-
Figure 8—source data 1
Full-length scans of blots for Figure 8A.
- https://cdn.elifesciences.org/articles/78425/elife-78425-fig8-data1-v2.xlsx
Figure 8—figure supplement 1
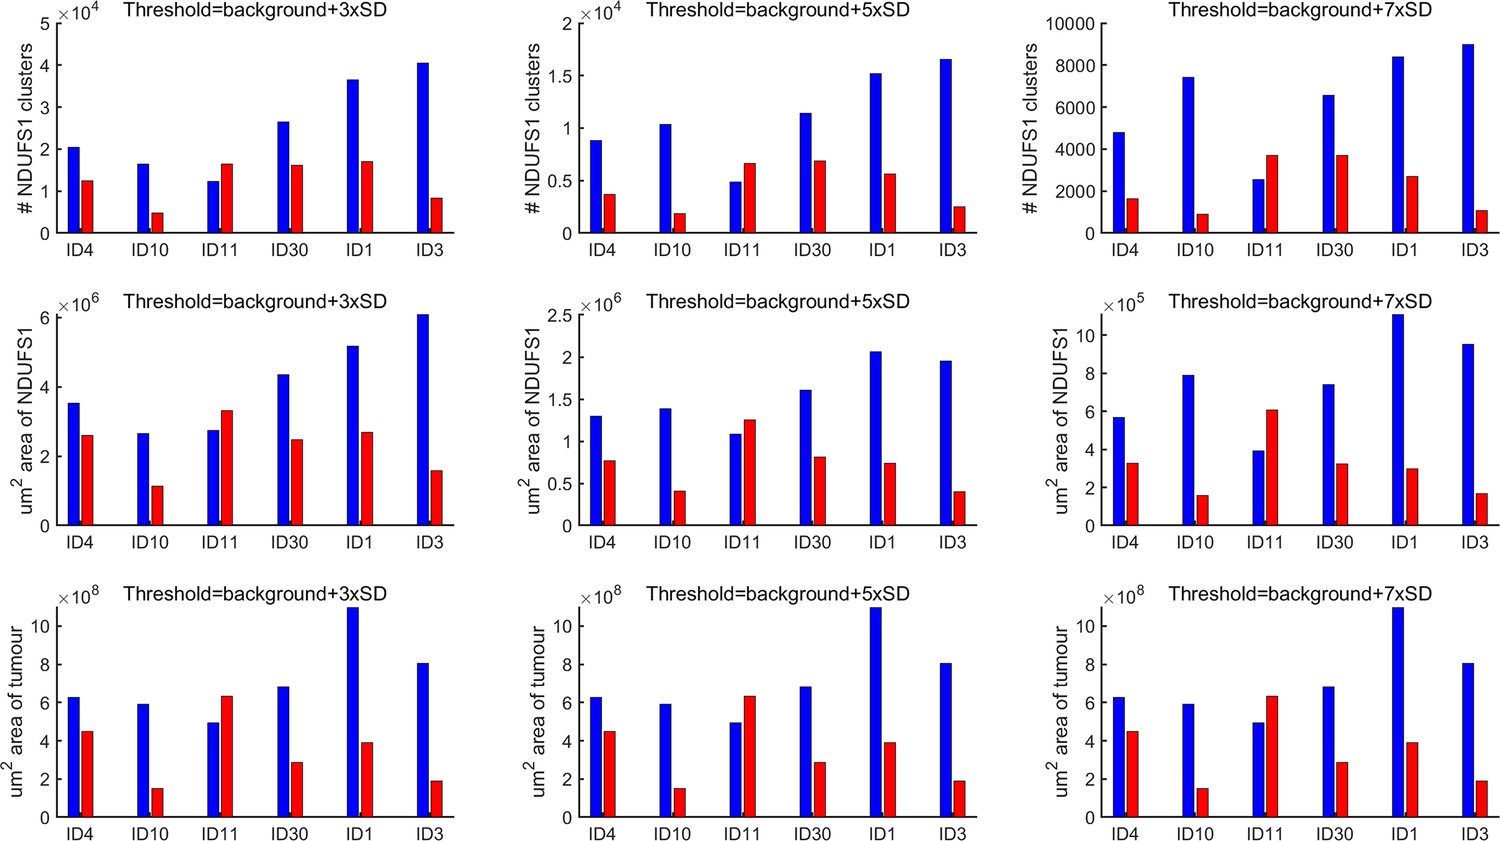
Analysis of xenograft histology using three levels of threshold to define GFP-positive areas.
The overall conclusions are not affected by the choice of threshold. Threshold of 5 standard deviation above mean background was selected for analysis in Figure 8. ID on x-axis denotes mouse; blue are data from left flank, red are data from right flank.
Tables
Key resources table
| Reagent type (species) or resource | Designation | Source or reference | Identifiers | Additional information |
|---|---|---|---|---|
| Chemical compound, drug | Anti-adherence rinsing solution | STEMCELL Technologies | 07010 | |
| Chemical compound, drug | SULPHORODAMINE for SRB Assay | Sigma-Aldrich | 3520-42-1 | |
| Chemical compound, drug | cSNARF1 | Thermo Fisher | C1271 | |
| Antibody | Anti-Cx31 (mouse monoclonal) | Proteintech | 12880-1-AP | 1:1000 |
| Antibody | Anti-Cx26 (mouse monoclonal) | Invitrogen | 33-5800 | 1:1000 |
| Antibody | Anti-Cx26 (mouse monoclonal) | Proteintech | 14842-1-AP | |
| Antibody | Anti-Cx43 (mouse monoclonal) | Cell Signalling Technology | 3512 | |
| Antibody | Anti-Cx43 (rabbit polyclonal) | Cell Signalling Technologies | 13-8300 | 1:1000 |
| Antibody | Anti-GAPDH (mouse monoclonal) | Proteintech | HRP-60004 | 1:6000 |
| Antibody | Anti-beta actin (mouse monoclonal) | Proteintech | HRP-60008 | 1:6000 |
| Antibody | Anti-Cx43 APC-conjugated (mouse monoclonal) | R&D Systems | FAB7737A | 1:500 |
| Antibody | Anti-NDUFS1 (rabbit polyclonal) | Thermo Fisher | PA5-22309 | 1:3000 |
| Antibody | Anti-aldolase A (rabbit polyclonal) | Novus Biologicals | NBP1-87488 | 1:3000 |
| Antibody | Anti-GFP (rabbit polyclonal) | Thermo Fisher | A-11122 | 1:1000 |
| Chemical compound, drug | Cariporide | Tocris | 5358 | |
| Chemical compound, drug | Lipofectamine RNAiMAX | Invitrogen | 2373383 | |
| Sequence-based reagent | siRNA | Dharmacon | siGENOME SMARTpool M-011042-01-0005 | Silencer Select |
| Sequence-based reagent | siRNA | Dharmacon | siGENOME SMARTpool L-019285-00-0005 | Silencer Select |
| Sequence-based reagent | siRNA | Dharmacon | siGENOME SMARTpool M-019948-02-0005 | Silencer Select |
| Sequence-based reagent | siRNA | Dharmacon | siGENOME NONtargeting control D-001210-01-05 | Silencer Select |
| Chemical compound, drug | CellTracker Fluorescent Dye Violet | Invitrogen | C10094 | |
| Chemical compound, drug | CellTracker Fluorescent Dye Orange | Invitrogen | C34551 | |
| Chemical compound, drug | CellTracker Fluorescent Dye Green | Invitrogen | C2925 | |
| Chemical compound, drug | CellTracker Fluorescent Dye DeepRed | Invitrogen | 34565 | |
| Sequence-based reagent | LentiCRISPR v.2 NDUFS1 gRNA1 | http://genome-engineering.org/gecko/wp-content/uploads/2013/12/lentiCRISPRv2-and-lentiGuide-oligo-cloning-protocol.pdf | TAGAATGTATGCCTACTTGG | Targeting gRNA sequence |
| Sequence-based reagent | LentiCRISPR v.2 ALDOA gRNA1 | http://genome-engineering.org/gecko/wp-content/uploads/2013/12/lentiCRISPRv2-and-lentiGuide-oligo-cloning-protocol.pdf | CATTGGCACCGAGAACACCG | Targeting gRNA sequence |
| Sequence-based reagent | LentiCRISPR v.2 SLC9A1 gRNA1 | http://genome-engineering.org/gecko/wp-content/uploads/2013/12/lentiCRISPRv2-and-lentiGuide-oligo-cloning-protocol.pdf | GAGCAGGGTGCTGATGACGA | Targeting gRNA sequence |
| Sequence-based reagent | LentiCRISPR v.2 GJB2 gRNA1 | http://genome-engineering.org/gecko/wp-content/uploads/2013/12/lentiCRISPRv2-and-lentiGuide-oligo-cloning-protocol.pdf | GACATAGAAGACGTACATGA | Targeting gRNA sequence |
| Cell line (human) | Colorectal cancer cell lines | Bodmer laboratory, WIMM, Oxford | ||
| Other | Athymic Nude Crl:NU(NCr)-Foxn1nu | Charles River |
Additional files
-
Supplementary file 1
Correlation between connexin expression and functional coupling.
- https://cdn.elifesciences.org/articles/78425/elife-78425-supp1-v2.docx
-
Transparent reporting form
- https://cdn.elifesciences.org/articles/78425/elife-78425-transrepform1-v2.docx
-
Source data 1
Contains full length scans of western blots included in this publication.
- https://cdn.elifesciences.org/articles/78425/elife-78425-data1-v2.zip
Download links
A two-part list of links to download the article, or parts of the article, in various formats.
Downloads (link to download the article as PDF)
Open citations (links to open the citations from this article in various online reference manager services)
Cite this article (links to download the citations from this article in formats compatible with various reference manager tools)
Solute exchange through gap junctions lessens the adverse effects of inactivating mutations in metabolite-handling genes
eLife 11:e78425.
https://doi.org/10.7554/eLife.78425


