Targeting A-kinase anchoring protein 12 phosphorylation in hepatic stellate cells regulates liver injury and fibrosis in mouse models
- Karsh Division of Gastroenterology and Hepatology, Cedars-Sinai Medical Center, United States
- Applied Cell Biology Division, Department of Biomedical Sciences, Cedars-Sinai Medical Center, United States
Figures
Figure 1 with 1 supplement
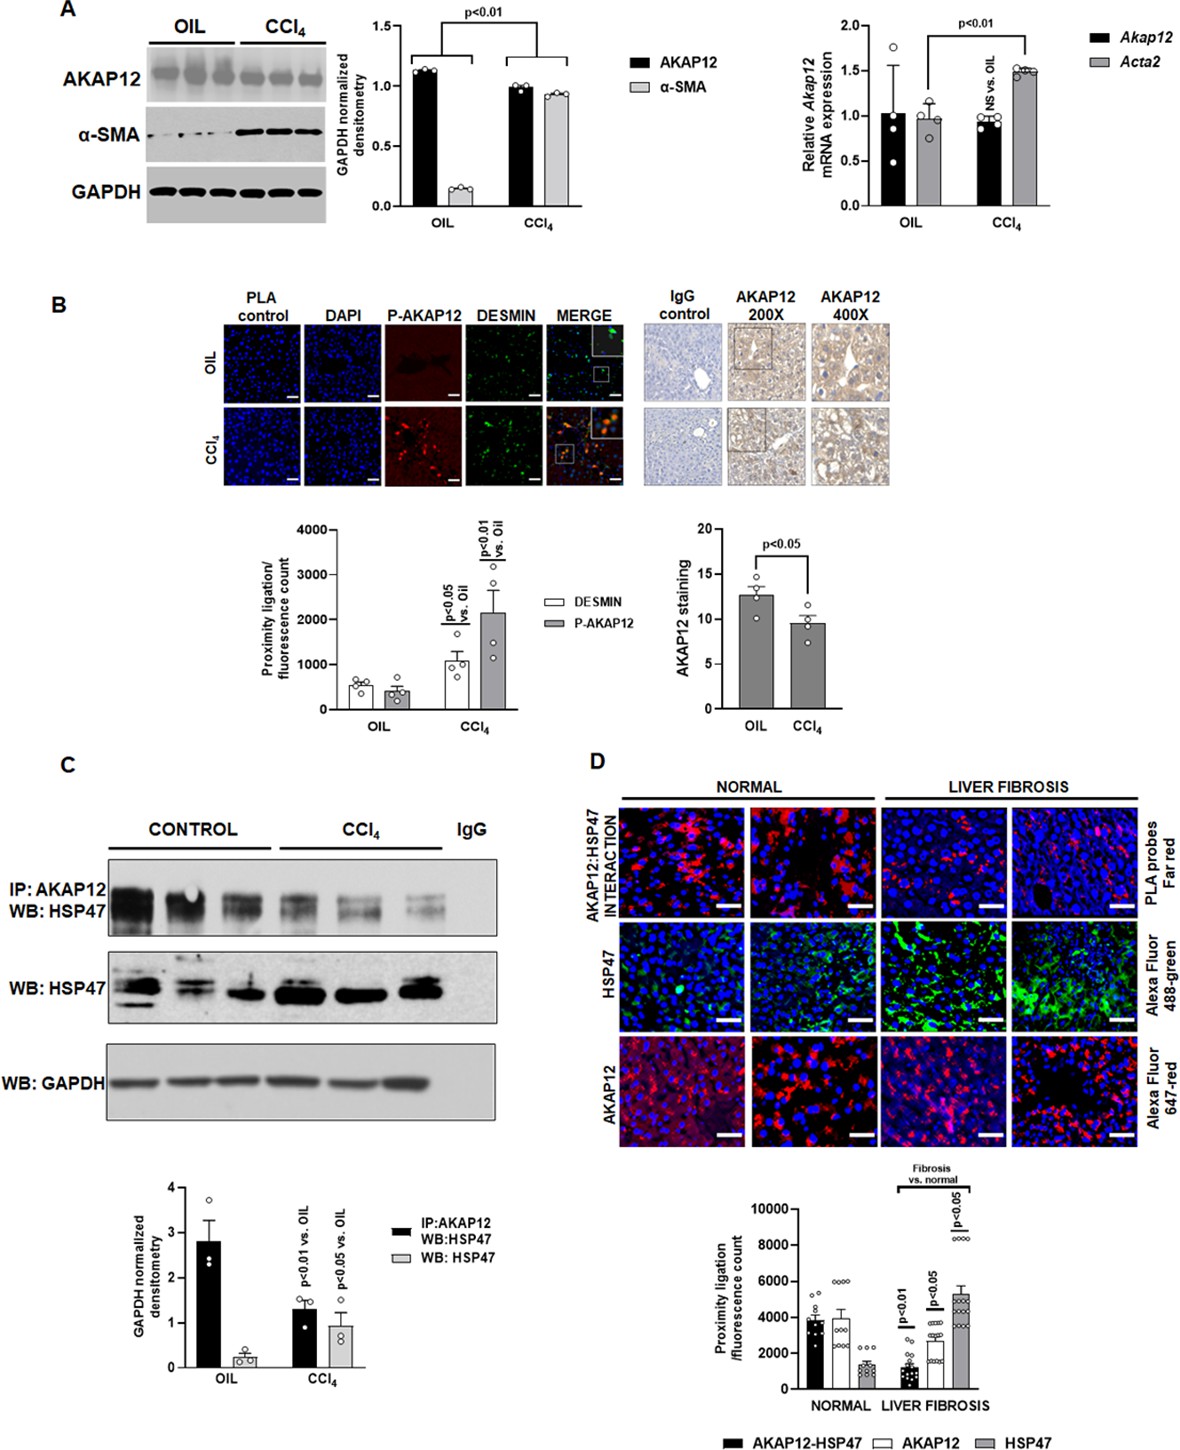
Expression, phosphorylation, and scaffolding activity of AKAP12 is altered in CCl4-treated mouse liver and human liver fibrosis.
Mice were administered CCl4 or mineral oil (control) as in methods. (A) Total protein (left panel) was immunoblotted with AKAP12, α-SMA, or GAPDH (control) antibody and blots were quantified by ImageJ densitometry. Data represented by GAPDH normalized densitometry is mean ± SE from three experimental groups. Source data are presented in Figure 1—source data 1. P values are calculated in Figure 1—source data 4. Total RNA (right panel) from mouse liver was subjected to real-time RT-PCR to evaluate the expression of Akap12, Acta2, or Gapdh (normalizing control) mRNA (mean ± S.E from four experimental groups). P values are calculated in Figure 1—source data 4. (B) Sections of control or CCl4 livers stained with the HSC marker, desmin was overlayed with antibodies to detect ligation of AKAP12 with the phospho-serine antibody by PLA as in methods. 200× magnification, scale bar=50 µm. Total AKAP12 expression was detected by HRP/DAB staining as in Materials and methods. Images were quantified using ImageJ and represented as the proximity ligation/fluorescence/HRP count. Mean ± SE from four experimental groups. Source data are presented in Figure 1—source data 2. P values are calculated in Figure 1—source data 4. (C) Control or CCl4 liver protein was immunoprecipitated with AKAP12 antibody and probed for HSP47 by western blotting. Normal mouse IgG was a negative control. Data represented by GAPDH normalized densitometry are mean ± SE from three experimental groups. Source data are presented in Figure 1—source data 3. P values are calculated in Figure 1—source data 4. (D) Human tissue arrays were stained with AKAP12 and HSP47 far red PLA probes as in methods. AlexaFluor antibodies (see Key resource table) were used to detect expression of AKAP12 or HSP47 in these arrays. A representative area is shown at 400× magnification, scale bar=100 µm. Each tissue within the array was quantified by densitometry using ImageJ and represented as the proximity ligation/fluorescence count (Figure 1—figure supplement 1). Mean ± SE, from 11 normal livers and 16 liver fibrosis tissues. P values are calculated in Figure 1—source data 4.
-
Figure 1—source data 1
Raw blots for Figure 1A.
- https://cdn.elifesciences.org/articles/78430/elife-78430-fig1-data1-v2.zip
-
Figure 1—source data 2
Individual images for Figure 1B.
- https://cdn.elifesciences.org/articles/78430/elife-78430-fig1-data2-v2.pptx
-
Figure 1—source data 3
Raw blots for Figure 1C.
- https://cdn.elifesciences.org/articles/78430/elife-78430-fig1-data3-v2.zip
-
Figure 1—source data 4
Post hoc analysis for Figure 1.
- https://cdn.elifesciences.org/articles/78430/elife-78430-fig1-data4-v2.xlsx
Figure 1—figure supplement 1
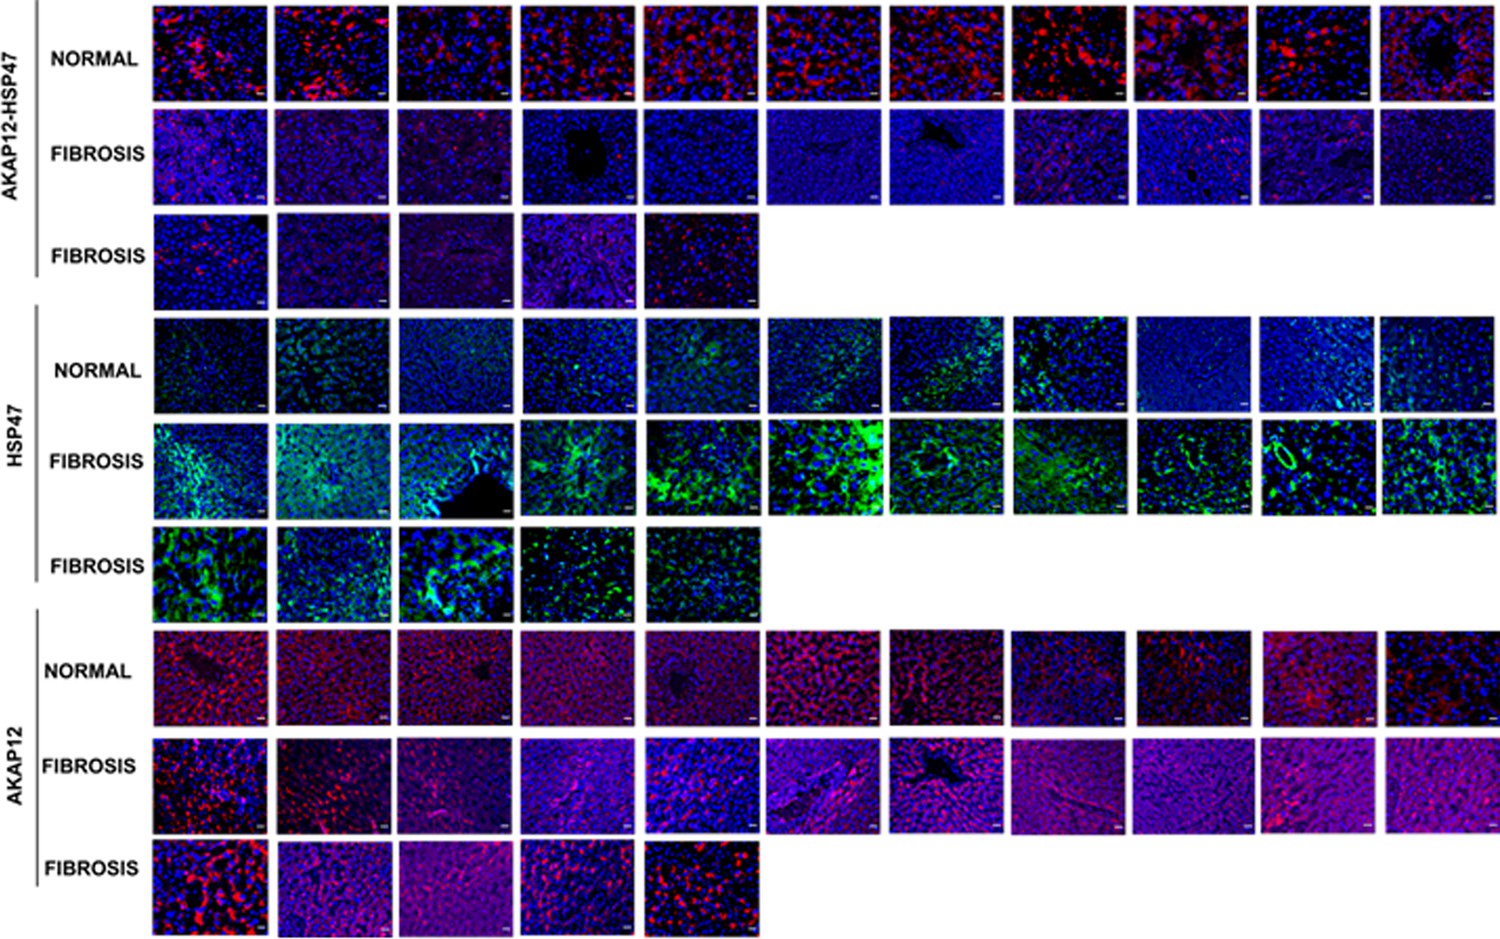
Complete human tissue arrays of 11 normal livers and 16 liver fibrosis tissues stained with PLA probes to detect AKAP12-HSP47 interaction and Alexa fluor probes to detect HSP47 (green) or AKAP12 (red) as described under Materials and methods.
Magnification at 60×; scale bar=25 µm. PLA, proximity ligation assay.
Figure 2 with 1 supplement
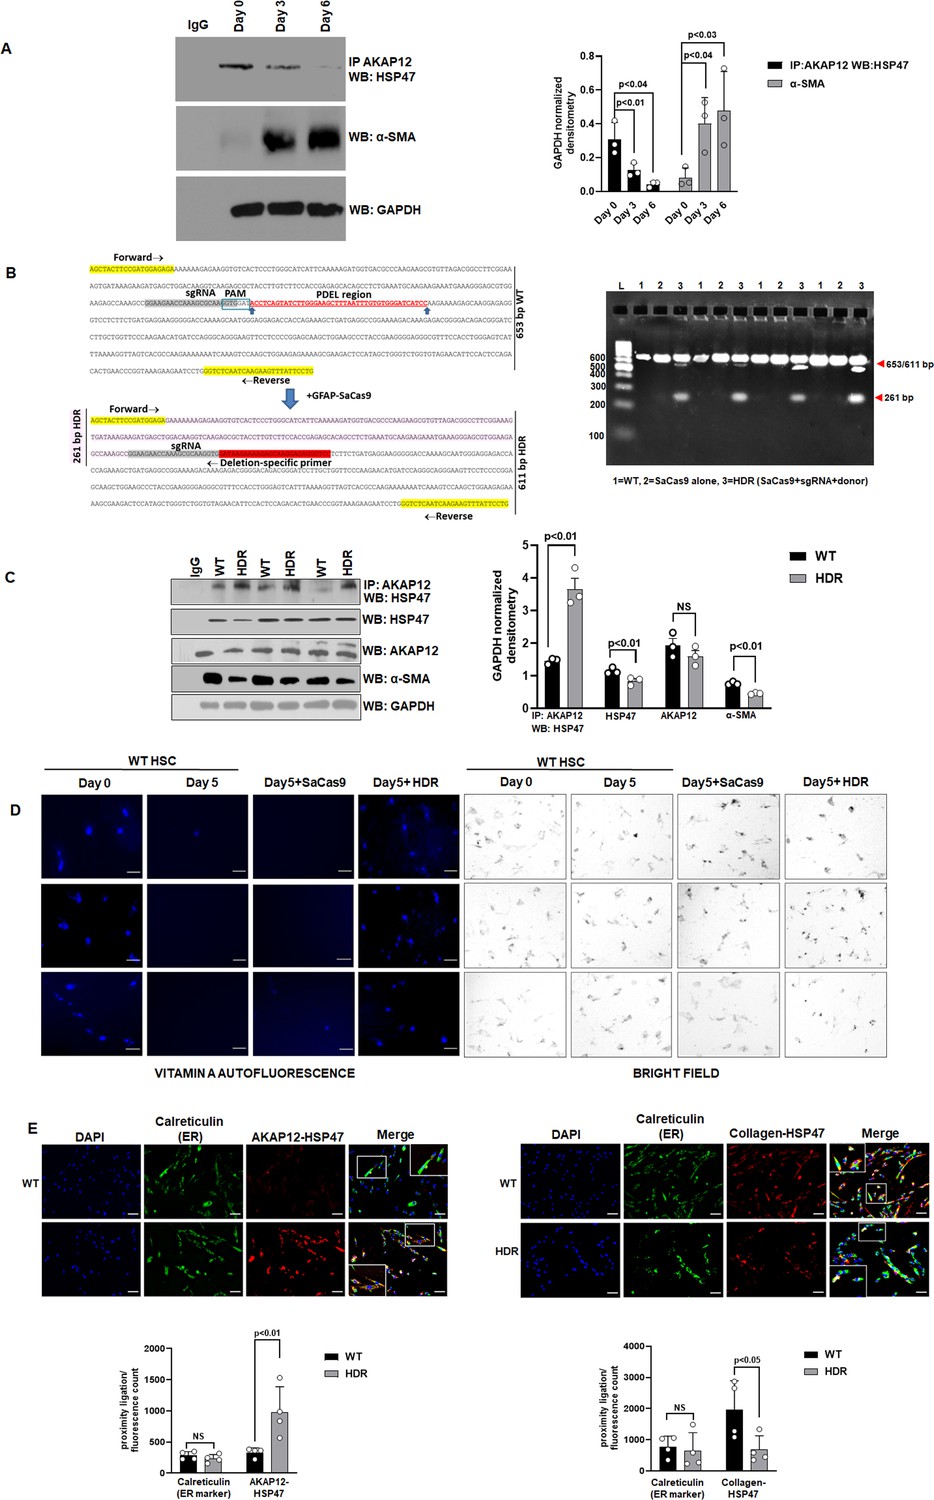
CRISPR-directed editing of AKAP12’s activation-responsive phospho-sites enhances AKAP12’s scaffolding activity and inhibits HSC activation.
(A) Cell extracts from human HSCs cultured for 0, 3, or 6 days (see Materials and methods) were processed for co-immunoprecipitation of AKAP12 and HSP47 or for α-SMA western blotting. Data represented as GAPDH normalized densitometry is mean ± SE from three experiments. Source data are presented in Figure 2—source data 1. P values are calculated in Figure 2—source data 4. (B) Activated human HSCs were transfected with CRISPR reagents and GFAP-SaCas9 vector to cause CRISPR-directed HDR as in Materials and methods. Untransfected (WT) or cells with SaCas9 alone were used as controls. CRISPR editing at the AKAP12 locus (left panel) was confirmed by performing PCR (right panel) using primers that specifically detected the edited region as listed in Key resource table. Four independent experiments are shown. (C) CRISPR-edited (HDR) or WT cells as in (B) above were assessed for AKAP12-HSP47 co-immunoprecipitation, HSP47, AKAP12, and α-SMA (HSC activation marker) western blotting. Data represented as GAPDH normalized densitometry is mean ± SE from three experiments. Source data are presented in Figure 2—source data 2. P values are calculated in Figure 2—source data 4. (D) Day 0 attached HSCs were culture activated till Day 3 and then transfected with CRISPR vectors till Day 5. The autofluorescence of vitamin A as a marker of HSC quiescence was visualized by fluorescence microscopy and compared to brightfield images of cells as in Materials and methods. Three independent experiments are shown. Scale bar=80 µm. Source data is presented in Figure 2—source data 5. (E) AKAP12-HSP47 interaction (left panel) and HSP47-collagen interaction (right panel) in the ER was compared between WT and HDR cells by PLA staining and co-staining with the ER marker, calreticulin as in methods. Magnification at 200×, scale bar=60 µm. Data represented as proximity ligation/fluorescence count are mean ± SE from four experiments. Source data are presented in Figure 2—source data 3. P values are calculated in Figure 2—source data 4. ER, endoplasmic reticulum; HDR, homology-directed repair; HSC, hepatic stellate cell; PLA, proximity ligation assay; WT, wild-type.
-
Figure 2—source data 1
Source blots for Figure 2A.
- https://cdn.elifesciences.org/articles/78430/elife-78430-fig2-data1-v2.zip
-
Figure 2—source data 2
Source blots for Figure 2C.
- https://cdn.elifesciences.org/articles/78430/elife-78430-fig2-data2-v2.zip
-
Figure 2—source data 3
Source data for Figure 2E.
- https://cdn.elifesciences.org/articles/78430/elife-78430-fig2-data3-v2.pptx
-
Figure 2—source data 4
Post-hoc analysis for Figure 2.
- https://cdn.elifesciences.org/articles/78430/elife-78430-fig2-data4-v2.xlsx
-
Figure 2—source data 5
Source data for Figure 2D.
- https://cdn.elifesciences.org/articles/78430/elife-78430-fig2-data5-v2.pptx
Figure 2—figure supplement 1
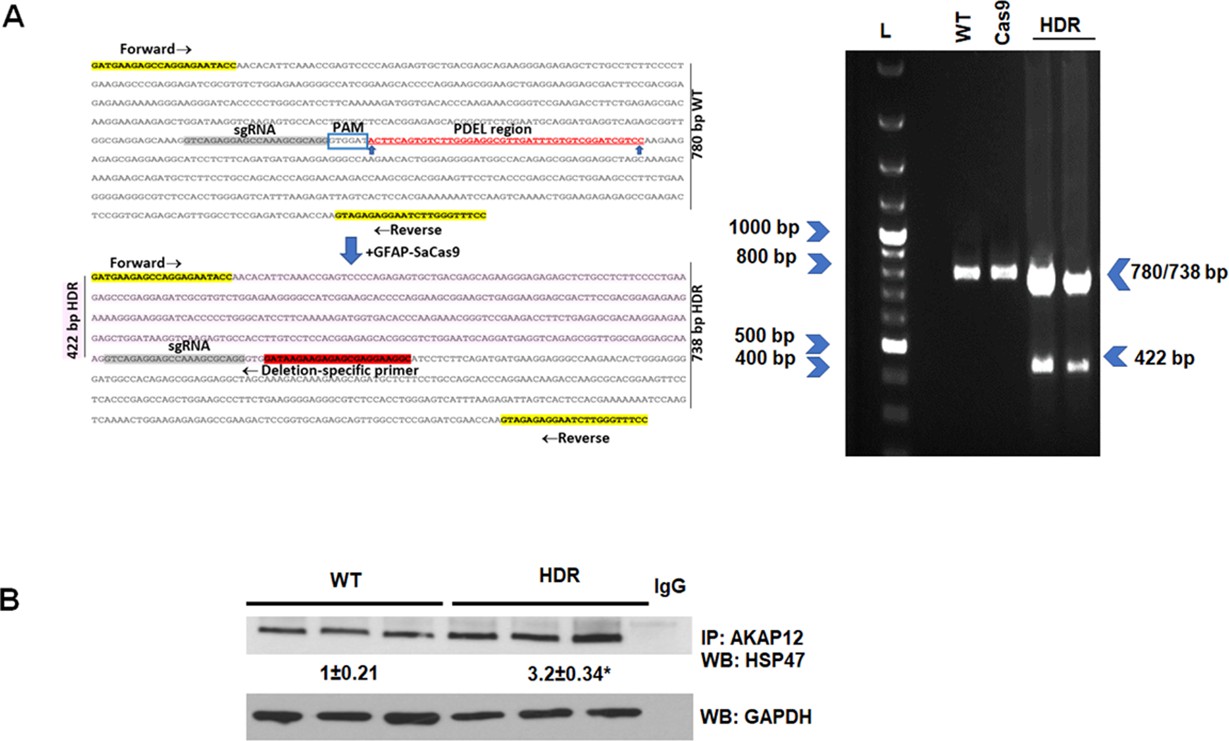
CRISPR-directed editing of AKAP12’s activation-responsive phospho-sites enhances AKAP12’s HSP47 scaffolding activity in mouse HSCs.
Activated mouse HSCs were transfected with CRISPR reagents and GFAP-Cas9 vector to cause CRISPR-directed HDR as described under Materials and methods. Untransfected (WT) or cells with Cas9 alone were used as controls. (A) CRISPR editing at the AKAP12 locus (left panel) was confirmed by performing PCR (right panel) using primers that specifically detected the edited region as listed inTable S1key resource table. A representative image from three experiments is shown. (B) CRISPR-edited (HDR) or WT cells were assessed for AKAP12-HSP47 interaction by co-immunoprecipitation-immunoblotting. Data represented as GAPDH normalized densitometry are mean ± SE from three experiments. *p=0.03 versus WT. HDR, homology-directed repair; HSC, hepatic stellate cell; WT, wild-type.
-
Figure 2—figure supplement 1—source data 1
Source blots (Figure 2—figure supplement 1—source data 2).
- https://cdn.elifesciences.org/articles/78430/elife-78430-fig2-figsupp1-data1-v2.zip
-
Figure 2—figure supplement 1—source data 2
Original gel image.
- https://cdn.elifesciences.org/articles/78430/elife-78430-fig2-figsupp1-data2-v2.zip
Figure 3
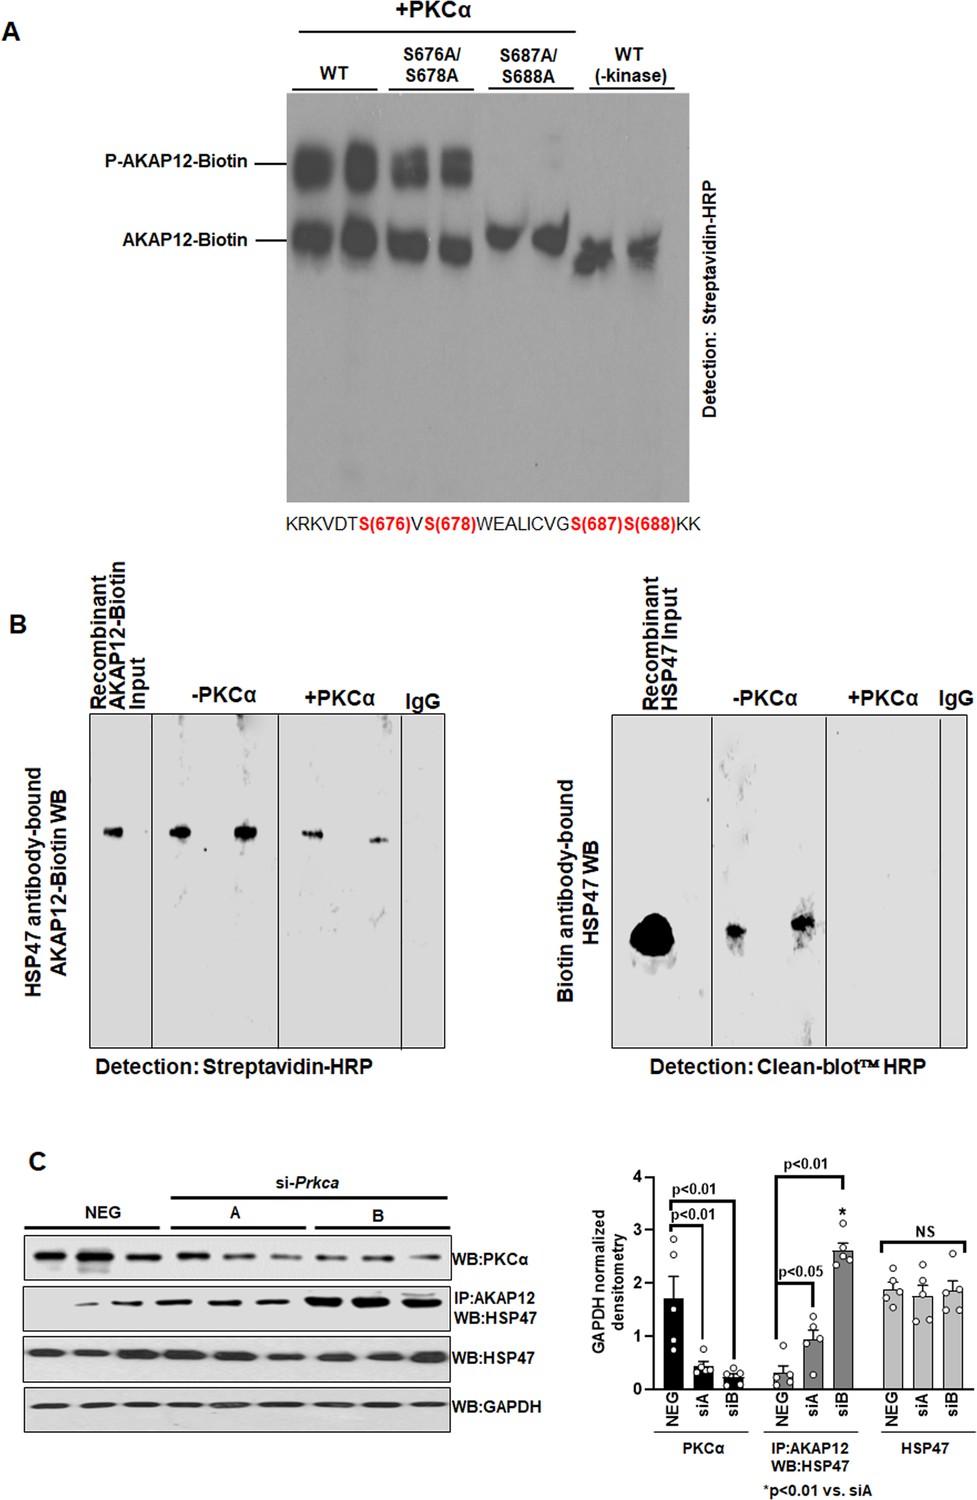
PKCα phosphorylates AKAP12 and inhibits its interaction with HSP47.
(A) AKAP12 is phosphorylated by PKCα at its activation-responsive phospho-sites. Recombinant WT or AKAP12 phospho-mutants were in vitro translated from their vectors and subjected to in vitro kinase assay in the presence of active PKCα enzyme as in Materials and methods. The reactions were run on a phostag gel to detect phosphorylated AKAP12 or its mutants. Representative phostag gels from three experiments are shown. Source data are presented in Figure 3—source data 1. P values are calculated in Figure 3—source data 4. (B) Direct Interaction between AKAP12 and HSP47 in recombinant system in the absence or presence of active PKCα enzyme. In vitro translated biotinylated AKAP12 was incubated with recombinant HSP47 antibody column containing bound HSP47 (left) or recombinant HSP47 was incubated with Biotin antibody column containing bound AKAP12-Biotin (right) in the presence or absence of active PKCα as in Materials and methods. Two representative data out of four experiments are shown. Source data are presented in Figure 3—source data 2. (C) Silencing Prkca in activated human HSCs enhances AKAP12-HSP47 interaction. Culture-activated human HSCs were transfected with a universal negative control siRNA (Neg) or two Prkca siRNAs (A or B) as in Materials and methods. Total protein was assessed for AKAP12-HSP47 co-immunoprecipitation or PKCα, HSP47, and GAPDH immunoblotting. Data represented as GAPDH normalized densitometry are mean ± SE from five experiments. Source data are presented in Figure 3—source data 3. P values are calculated in Figure 3—source data 4. HSC, hepatic stellate cell; WT, wild-type.
-
Figure 3—source data 1
Source blots for Figure 3A.
- https://cdn.elifesciences.org/articles/78430/elife-78430-fig3-data1-v2.zip
-
Figure 3—source data 2
Source blots for Figure 3B.
- https://cdn.elifesciences.org/articles/78430/elife-78430-fig3-data2-v2.zip
-
Figure 3—source data 3
Source blots for Figure 3C.
- https://cdn.elifesciences.org/articles/78430/elife-78430-fig3-data3-v2.zip
-
Figure 3—source data 4
Post hoc analysis for Figure 3C.
- https://cdn.elifesciences.org/articles/78430/elife-78430-fig3-data4-v2.xlsx
Figure 4 with 1 supplement
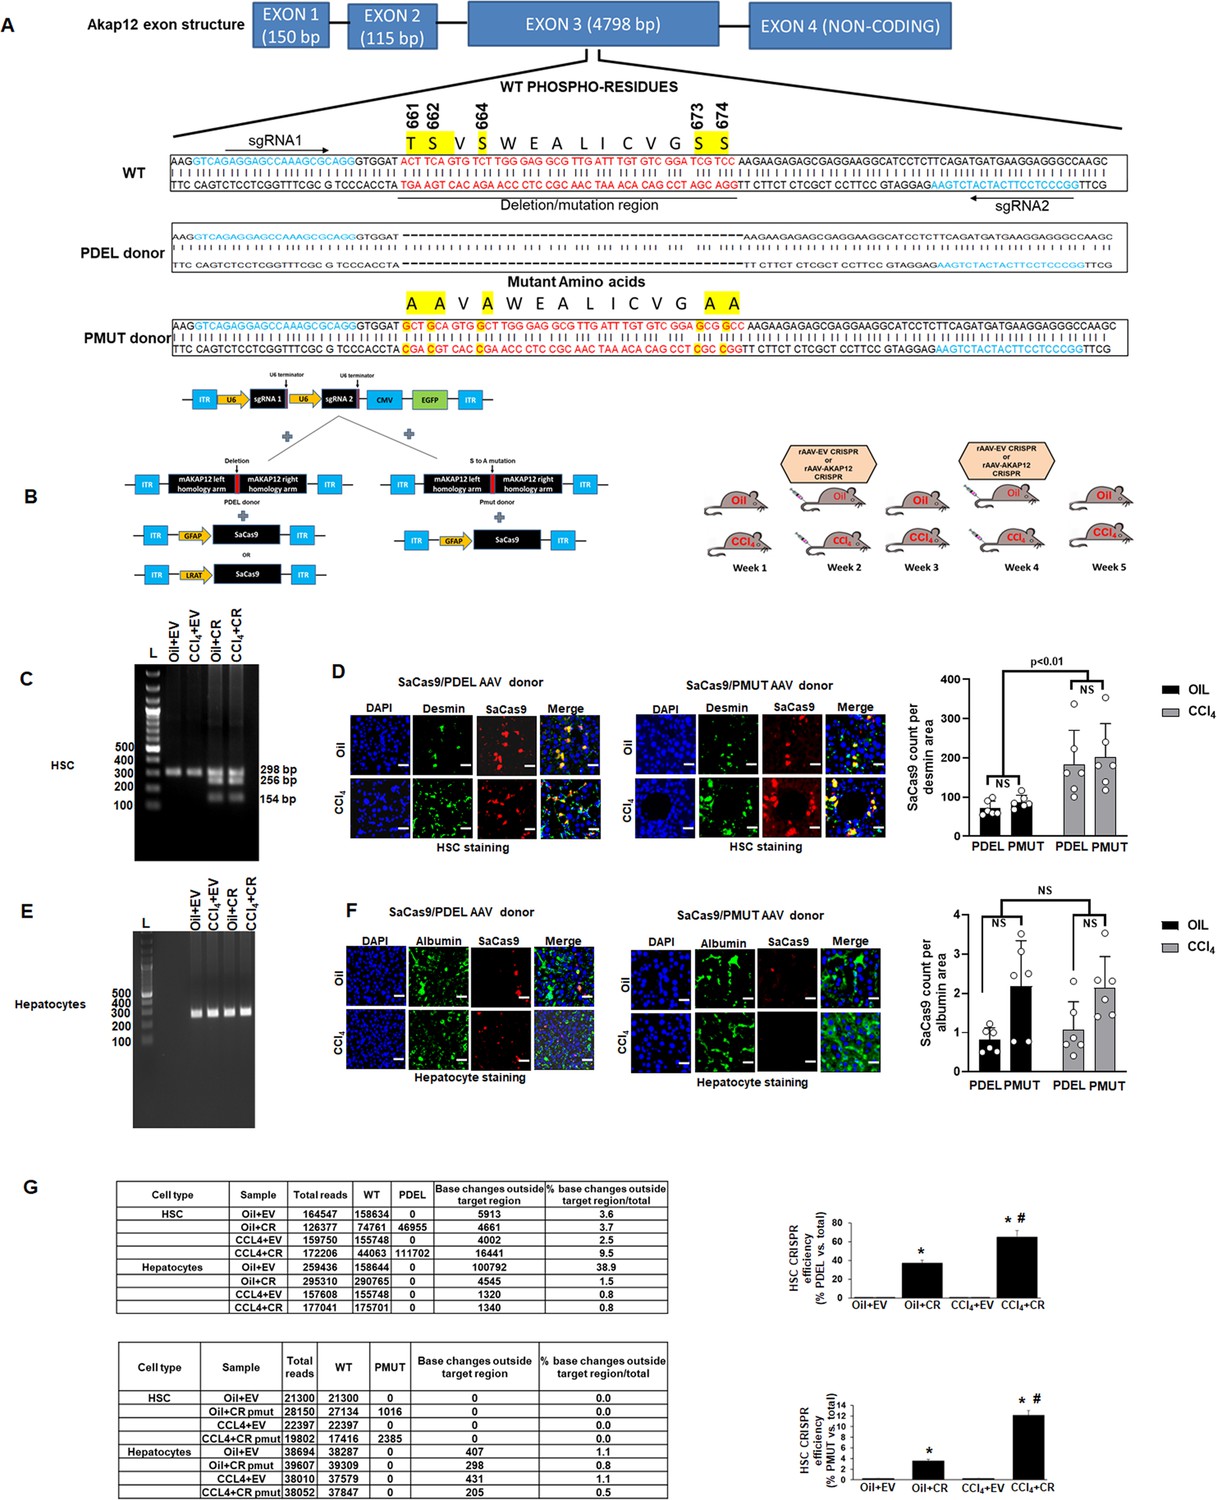
In vivo gene editing of the Akap12 region corresponding to its activation-responsive phospho-sites in the CCL4 mouse model using GFAP-SaCas9.
(A) Schematic diagram of the mouse Akap12 locus showing the exon 3 region containing AKAP12’s activation-responsive phospho-site regions and two SaCas9 target sgRNAs (1 and 2). The PDEL mutation contains a 42 bp deletion in the donor that deletes the phospho-sites after CRISPR editing. The PMUT donor has a mutation in five codons that changes the S/T (serine/threonine) activation-responsive phospho-sites to A (alanine). (B) Left panel: AAV-CRISPR cloning scheme. SgRNA1/2, PDEL or PMUT donor and SaCas9 under control of the HSC-specific GFAP promoter were cloned into AAV6 serotype vectors and AAV particles were generated as in methods. Control vector (EV) contained a non-targeting sgRNA as in methods. Combinations of sgRNA1/2-AAV or EV with the pDEL or pMUT donor-AAV and GFAP-SaCas9-AAV were injected into mice as in Materials and methods. Right panel: Scheme of AAV vector injections into the tail vein at second and fourth weeks of oil or CCL4 administration as in methods. (C) Specificity of PDEL CRISPR for HSCs was evaluated by multiplex PCR amplification of genomic DNA from HSCs using a PDEL-specific primer and two primers around the PDEL primer site (see Key resource table). A representative gel image from six experimental groups is shown. Source data are presented in Figure 4—source data 1. (D) Efficiency of PDEL (left) or PMUT (right) AAV in HSCs was ascertained by co-localization of SaCas9 with desmin-positive HSCs in oil or CCL4-treated groups. Data represented by SaCas9 count per desmin area are mean ± SE from six experimental groups. 200× magnification; scale bar=50 µm. P values are calculated in Figure 4—source data 3. (E) Multiplex PCR of hepatocytes genomic DNA as in (C) above did not show PDEL specific amplicons. A representative gel image from six experiments is shown. Source data are presented in Figure 4—source data 2. (F) SaCas9 co-localization with albumin-positive hepatocytes was insignificant in oil or CCL4 livers transduced with PDEL or PMUT AAV compared to HSCs in (D) above. Data represented by fluorescence signal count are mean±SE from six experimental groups. 200× magnification; scale bar=50 µm. P values are calculated in Figure 4—source data 3. (G) The efficiency of CRISR was evaluated by NGS using a 298-bp PCR amplicon derived from genomic DNA of HSCs or hepatocytes of PDEL mice group (top panel) or PMUT mice group (bottom panel). Total amplicon reads, WT reads, and PDEL or PMUT reads within the target region or base changes outside the target region from each experimental group are shown. The CRISPR editing efficiency is the represented by the percentage of mutant reads versus total. Oil+CR or CCL4+CR-PDEL/PMUT: *p<0.01 versus oil+EV; #p<0.01 versus CCL4+EV. EV, empty vector; HSC, hepatic stellate cell; WT, wild-type.
-
Figure 4—source data 1
Original gel for Figure 4C.
- https://cdn.elifesciences.org/articles/78430/elife-78430-fig4-data1-v2.zip
-
Figure 4—source data 2
Original gel for Figure 4E.
- https://cdn.elifesciences.org/articles/78430/elife-78430-fig4-data2-v2.zip
-
Figure 4—source data 3
Post hoc analysis for Figure 4D, F.
- https://cdn.elifesciences.org/articles/78430/elife-78430-fig4-data3-v2.xlsx
Figure 4—figure supplement 1
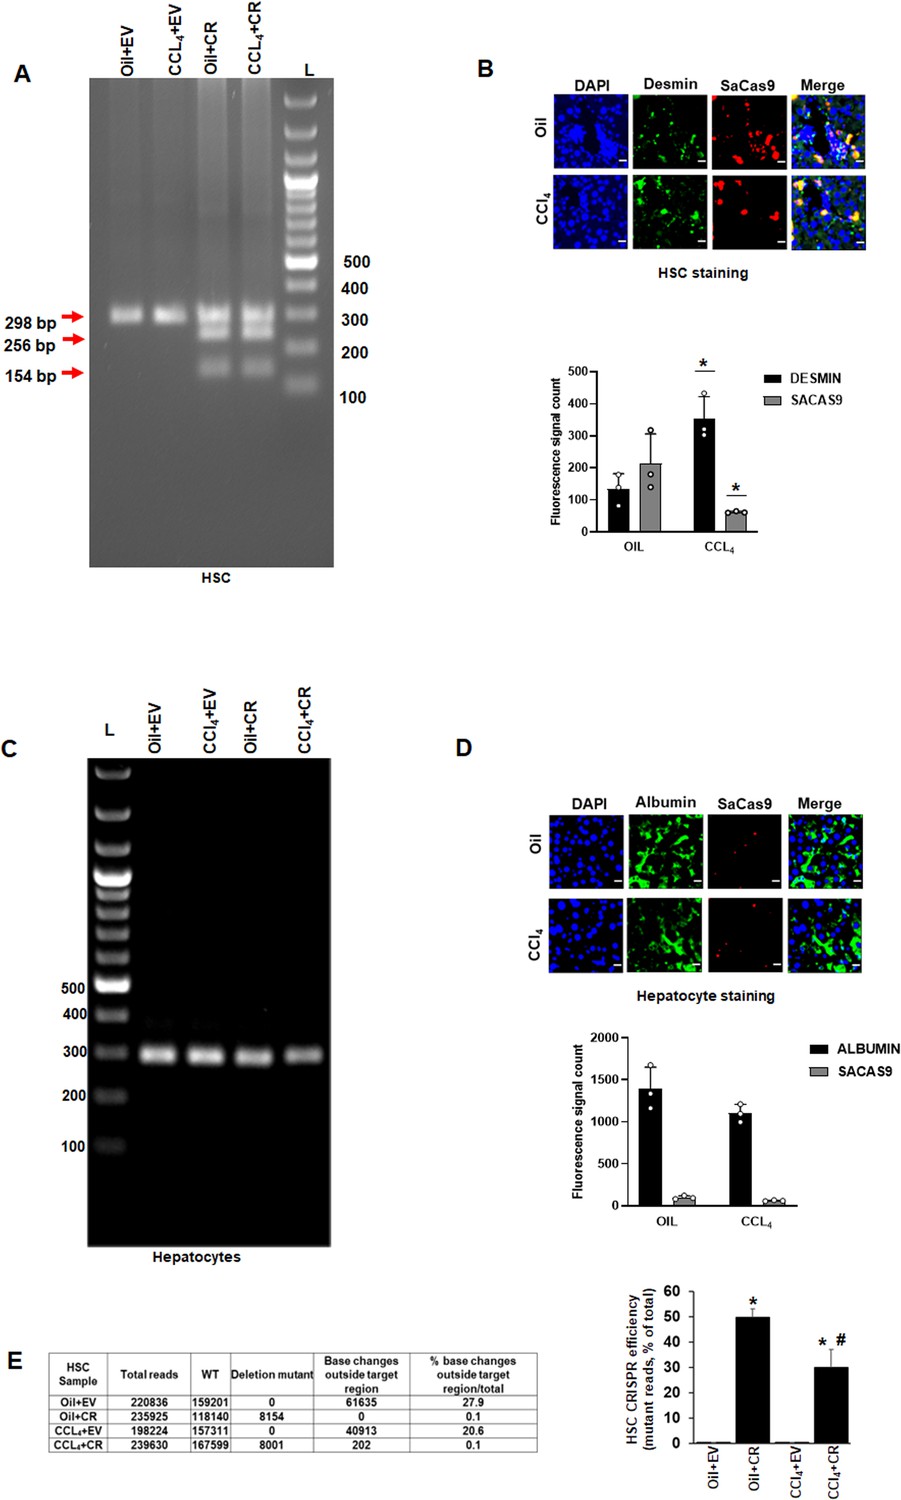
In vivo gene editing of the Akap12 region corresponding to its activation-responsive phospho-sites in the CCl4 mouse model using LRAT-Cas9.
(A) Specificity of PDEL CRISPR for HSCs using LRAT-SaCas9 was evaluated by multiplex PCR amplification of genomic DNA from HSCs using a PDEL-specific primer and two primers around the PDEL primer site (Table S1). A representative gel image from three experimental groups is shown. Source data are presented in Figure 4—figure supplement 1—source data 1. (B) Specificity of HSC CRISPR was ascertained by co-localization of SaCas9 with desmin-positive HSCs in oil or CCl4-treated groups. Data are representative of three experiments (200× magnification, 50 µm scale). Desmin staining: *p<0.05 versus oil. (C) Multiplex PCR of hepatocytes genomic DNA as in (A) above did not show PDEL specific amplicons. A representative gel image from three experiments is shown. Source data are presented in Figure 4—figure supplement 1—source data 2. (D) SaCas9 co-localization with albumin-positive hepatocytes was insignificant in oil or CCl4 livers compared to HSCs in (B) above. Data are representative of three experiments (200× magnification, 50 µm scale). (E) The efficiency of CRISR in HSCs was evaluated by next-generation amplicon sequencing using a 298-bp PCR amplicon derived from genomic DNA. Total amplicon reads, WT reads, and PDEL reads within the target region or base changes outside the target region from each experimental group are shown. The CRISPR editing efficiency represented by the percentage of mutant reads versus total is mean±SE from three PDEL experiments. *p<0.01 versus oil+EV, #p<0.01 versus CCl4+EV. EV, empty vector; HSC, hepatic stellate cell; WT, wild-type.
-
Figure 4—figure supplement 1—source data 1
Original gel of Figure 4—figure supplement 1A .
- https://cdn.elifesciences.org/articles/78430/elife-78430-fig4-figsupp1-data1-v2.zip
-
Figure 4—figure supplement 1—source data 2
Original gel of Figure 4—figure supplement 1C.
- https://cdn.elifesciences.org/articles/78430/elife-78430-fig4-figsupp1-data2-v2.zip
Figure 5 with 1 supplement
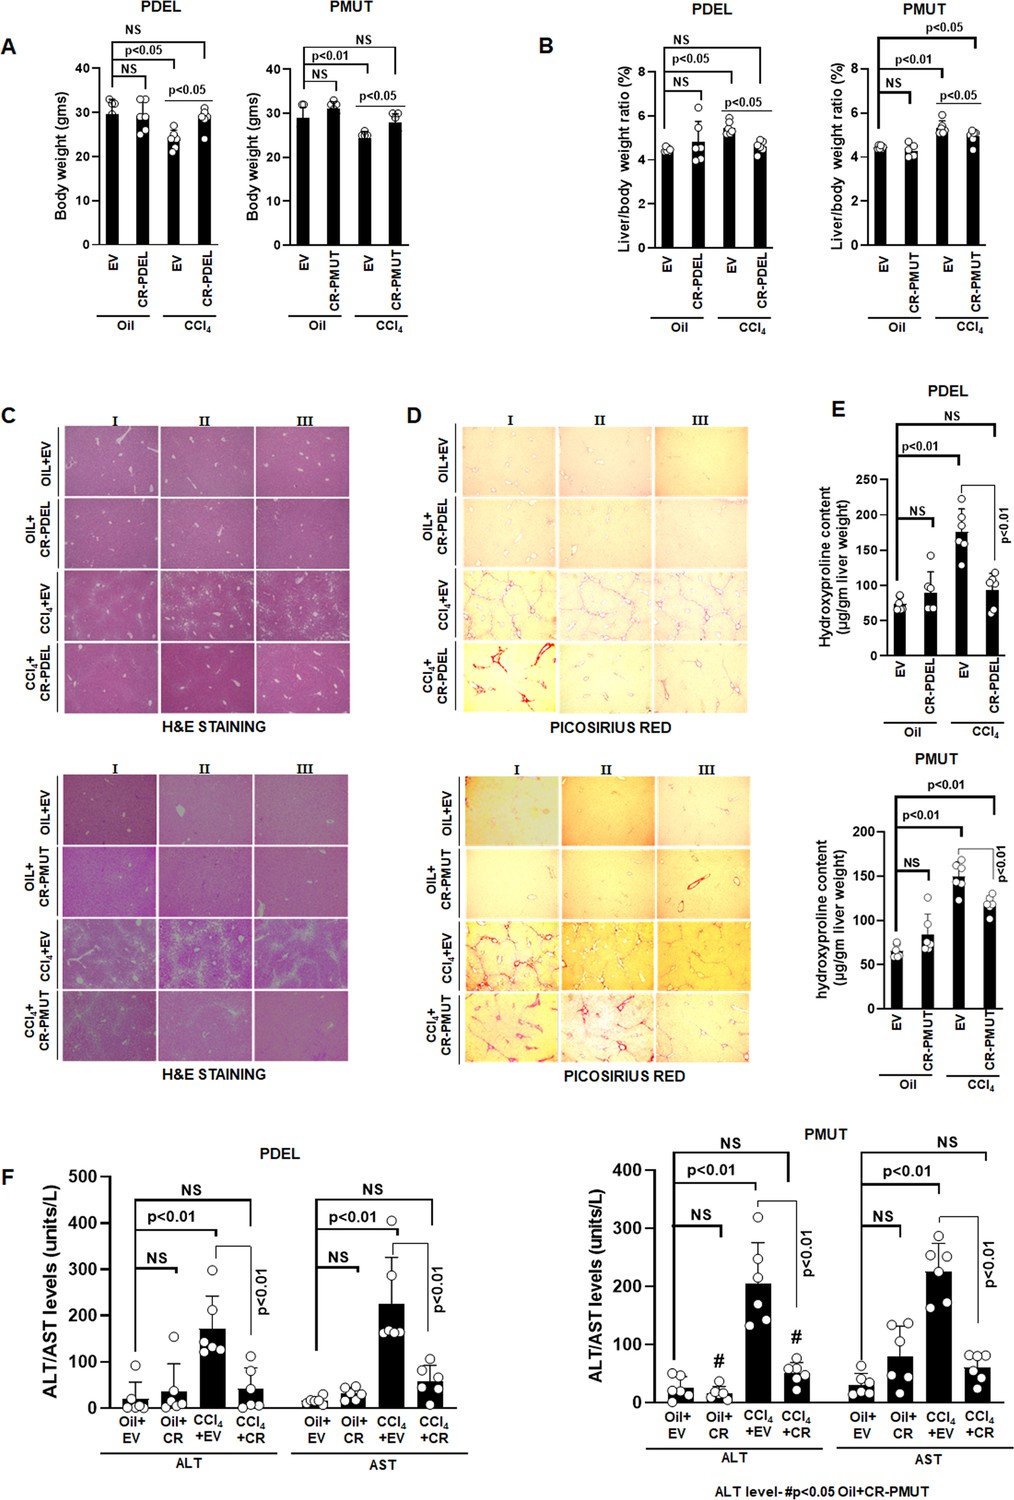
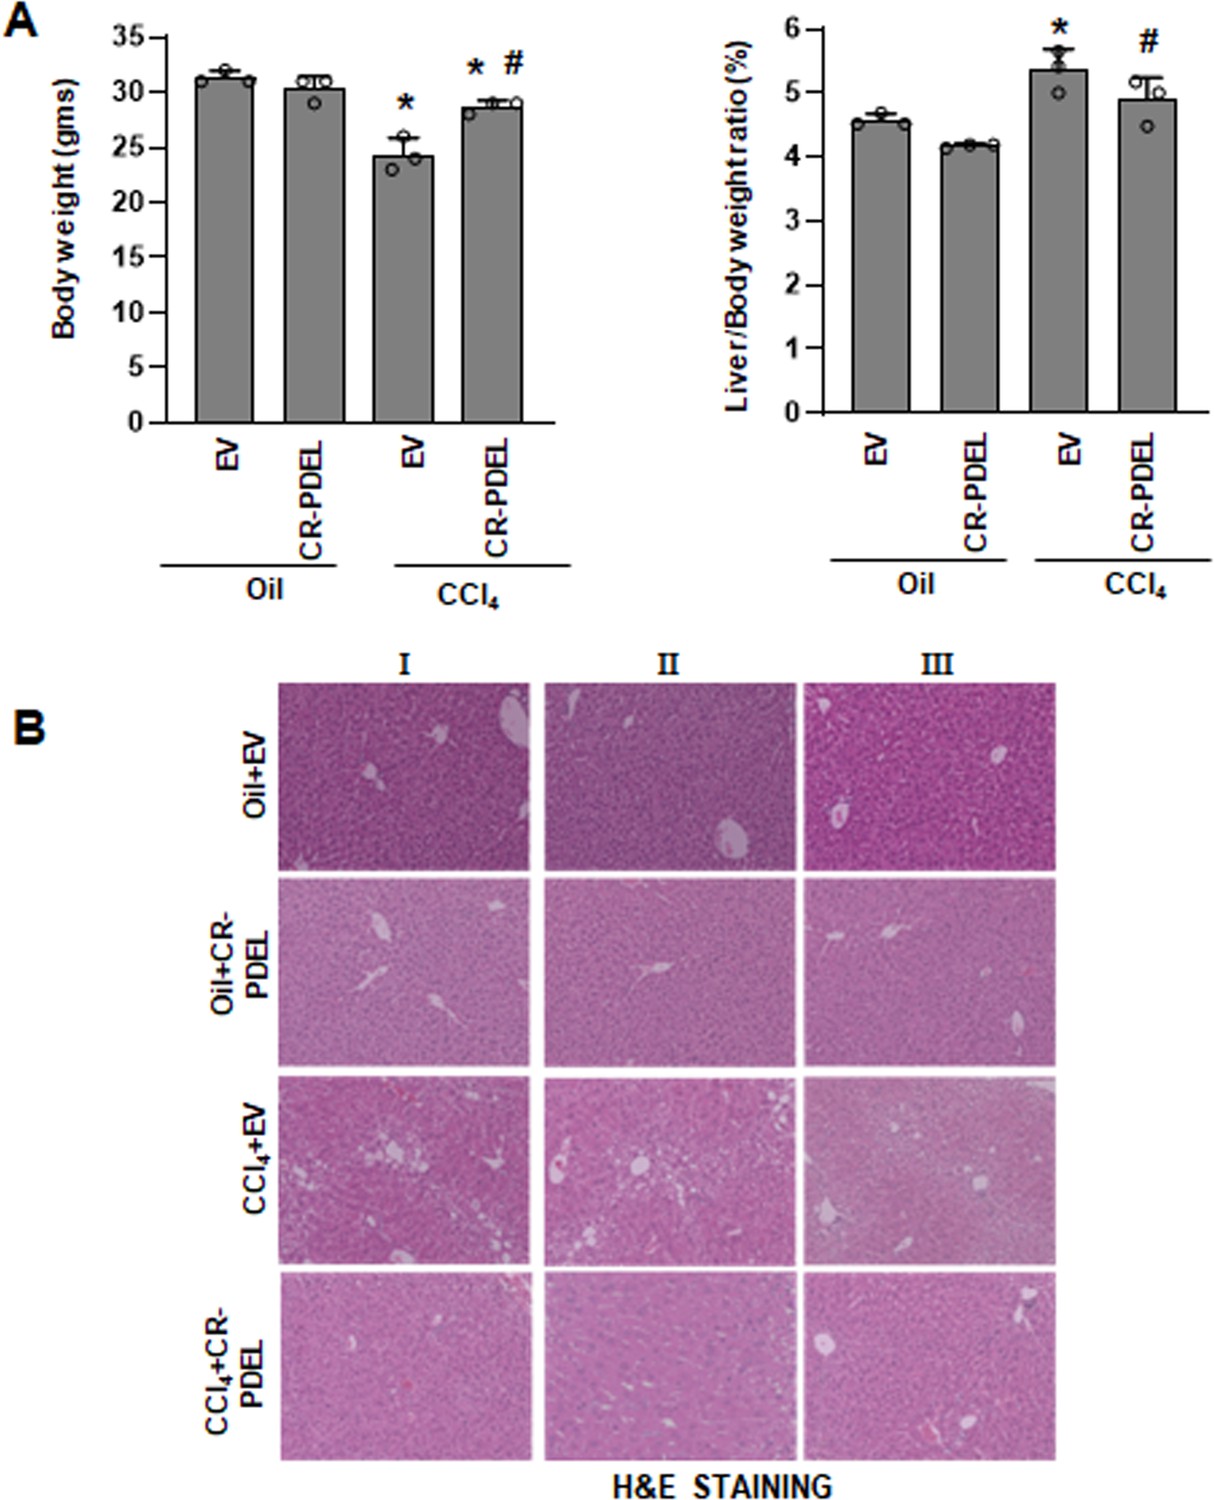
Phospho-editing of AKAP12 regulates liver injury and fibrosis in the CCL4 mouse model.
Gross changes in mouse body weight (A) and liver/body weight ratio (B) after PDEL or PMUT GFAP-SaCas9-mediated CRISPR editing of AKAP12’s phospho-sites under oil or CCL4 treatment conditions. Mean±SE from six PDEL or PMUT experiments. P values are calculated in Figure 5—source data 3. (C) Histological evaluation of CRISPR-edited livers by H&E staining as in methods for six PDEL (top) or PMUT (bottom) experiments. Source data are presented in Figure 5—source data 1. (D) Picosirius red staining of CRISPR-edited livers for collagen from six PDEL (top) or PMUT (bottom) experiments. Source data are presented in Figure 5—source data 2. (E) Hydroxyproline quantification of collagen (mean±SE) from six PDEL (top) or PMUT experiments. P values are calculated in Figure 5—source data 3. (F) Measurement of ALT and AST levels in plasma after CRISPR-editing as in Materials and methods. Mean±SE from six PDEL (left panel) or PMUT (right panel) experiments. P values are calculated in Figure 5—source data 3. H&E, hematoxylin and eosin.
-
Figure 5—source data 1
Individual images for Figure 5C.
- https://cdn.elifesciences.org/articles/78430/elife-78430-fig5-data1-v2.pptx
-
Figure 5—source data 2
Individual images for Figure 5D.
- https://cdn.elifesciences.org/articles/78430/elife-78430-fig5-data2-v2.pptx
-
Figure 5—source data 3
Post hoc analysis for Figure 5.
- https://cdn.elifesciences.org/articles/78430/elife-78430-fig5-data3-v2.xlsx
Figure 5—figure supplement 1
Phospho-editing of AKAP12 using LRAT-Cas9 regulates liver fibrosis in the CCl4 mouse model.
(A) Gross changes in mouse body weight (left panel) and liver/body weight ratio (right panel) after PDEL LRAT-Cas9-mediated CRISPR editing of AKAP12’s phospho-sites under oil or CCl4 treatment conditions. Mean±S.E from 3 PDEL experiments. CCl4+EV: *p<0.01 vs. Oil+EV, #p<0.01 vs. CCl4+EV. (B) Histological evaluation of CRISPR-edited livers by H&E staining as described under methods. Three PDEL experiments with LRAT-Cas9 are shown.
Figure 6
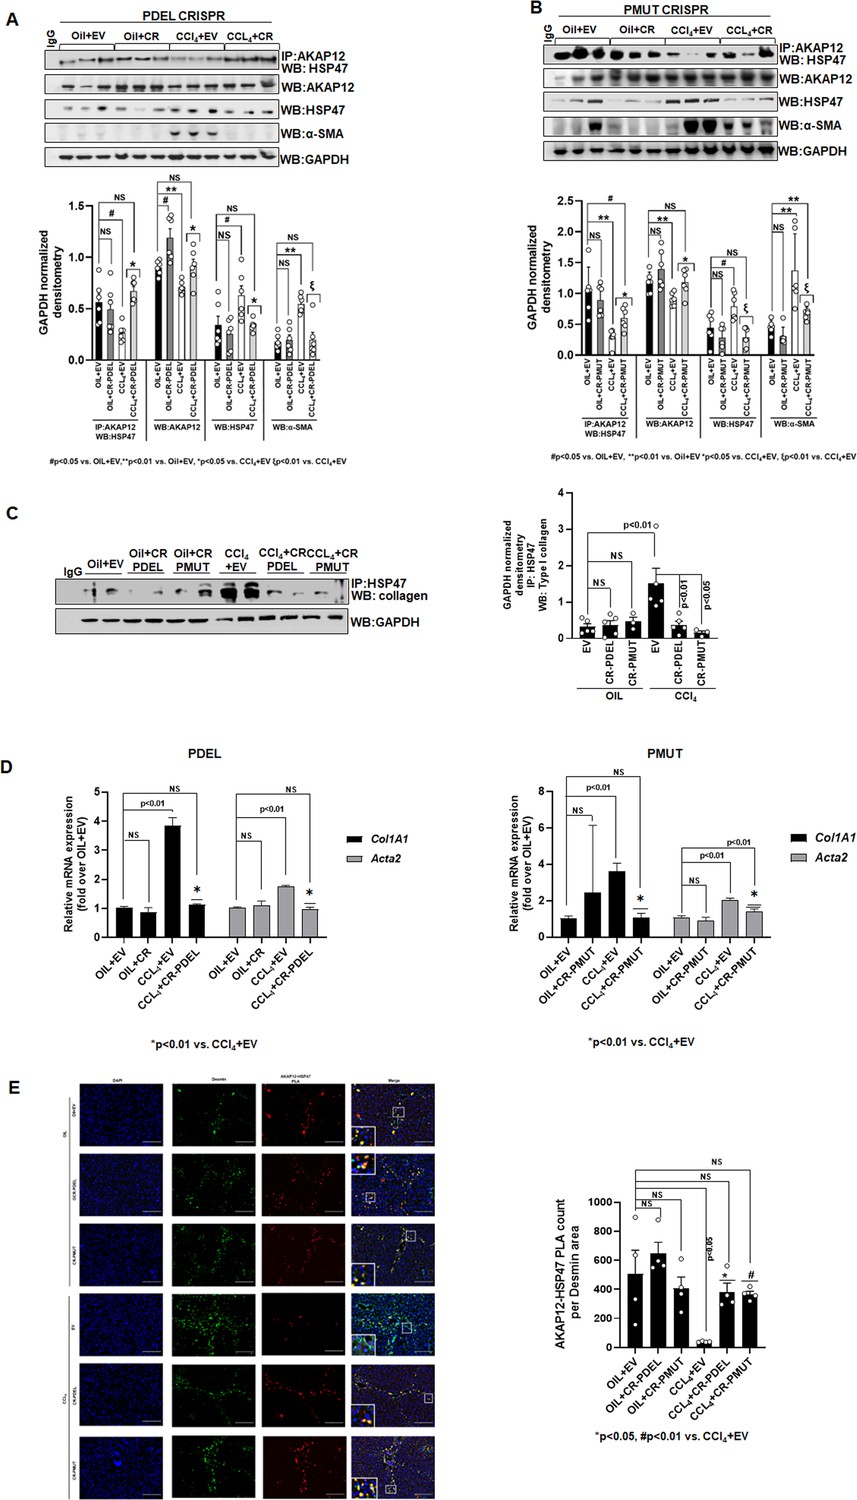
Phospho-editing of AKAP12 regulates AKAP12’s HSP47-scaffolding activity, HSC activation, and HSP47’s collagen-chaperoning activity in the CCl4 mouse model.
(A) AKAP12-HSP47 co-immunoprecipitation, AKAP12, HSP47, and α-SMA western blotting from liver protein of CR-PDEL experiment. Data represented as GAPDH normalized densitometry are mean±SE from six experiments. Three representatives are shown. Source data are presented in Figure 6—source data 1. P values are calculated in Figure 6—source data 4. (B) AKAP12-HSP47 co-immunoprecipitation, AKAP12, HSP47, and α-SMA western blotting from liver protein of CR-PMUT experiment. Data represented as GAPDH normalized densitometry are mean±SE from six experiments. Three representatives are shown. Source data are presented in Figure 6—source data 1. P values are calculated in Figure 6—source data 4. (C) Co-immunoprecipitation of collagen with HSP47 in CRISPR-edited livers are mean±SE from five PDEL and three PMUT experiments. Source data are presented in Figure 6—source data 3. P values are calculated in Figure 6—source data 4. (D) Col1A1 or Acta2 mRNA levels by real-time PCR from PDEL (left) or PMUT (right) mouse livers. Data are mean±SE from six experimental groups. P values are calculated in Figure 6—source data 4. (E) Interaction between AKAP12 and HSP47 in desmin-positive HSCs of CRISPR model by PLA staining. Data representative of the AKAP12-HSP47 PLA count per desmin area are mean±SE from four PDEL or PMUT experiments. 200× magnification, scale bar=100 µm. P values are calculated in Figure 6—source data 4. HSC, hepatic stellate cell; PLA, proximity ligation assay.
-
Figure 6—source data 1
Source blots for Figure 6A.
- https://cdn.elifesciences.org/articles/78430/elife-78430-fig6-data1-v2.zip
-
Figure 6—source data 2
Source blots for Figure 6B.
- https://cdn.elifesciences.org/articles/78430/elife-78430-fig6-data2-v2.zip
-
Figure 6—source data 3
Source blots for Figure 6C.
- https://cdn.elifesciences.org/articles/78430/elife-78430-fig6-data3-v2.zip
-
Figure 6—source data 4
Post hoc analysis for Figure 6.
- https://cdn.elifesciences.org/articles/78430/elife-78430-fig6-data4-v2.xlsx
Figure 7 with 2 supplements
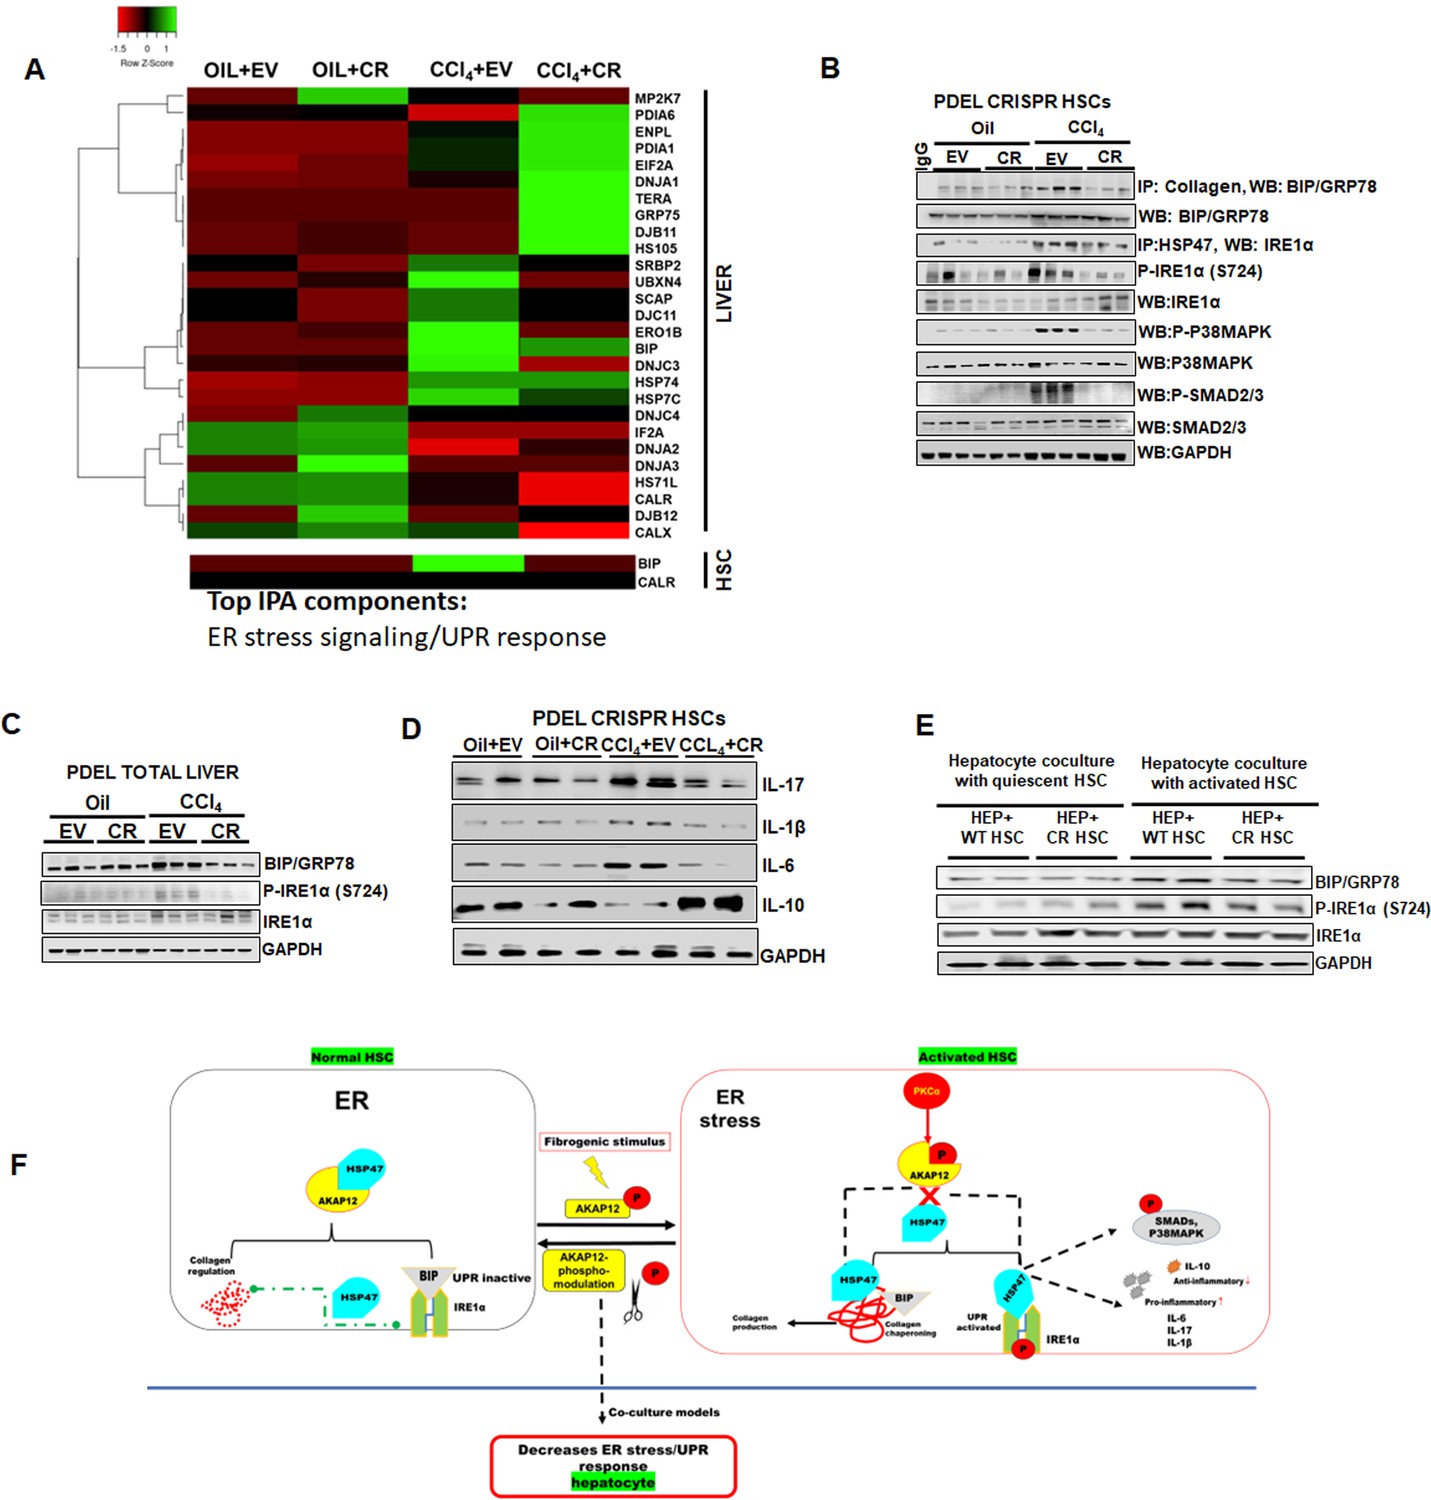
HSC-specific phospho-editing of AKAP12 regulates the ER stress response.
(A) Heat map of total liver and HSCs ER stress/UPR signaling components in four groups, oil+EV, oil+CR, CCl4+EV and CCL4+CR. Proteomics data utilized to prepare the heatmap are presented in Supplementary file 4. Alterations in ER stress responsive elements in HSCs from AKAP12 PDEL CRISPR model (B) and total liver (C). GAPDH normalized densitometry is mean±SE from three experiments. Raw densitometry of each experiment is presented in Figure 7—figure supplement 1. Source data are presented in Figure 7—source data 1 and Figure 7—source data 2. P values are calculated in Figure 7—source data 5. (D) Inflammatory cytokine expression in HSCs from oil+EV, oil+CR, CCl4+EV and CCL4+CR groups. GAPDH normalized densitometry is mean±SE from four experiments. Raw densitometry of each experiment is presented in Figure 7—figure supplement 1. Source data are presented in Figure 7—source data 3. P values are calculated in Figure 7—source data 5. (E) ER stress response in hepatocytes co-cultured with quiescent or activated WT HSCs with or without AKAP12 PDEL CRISPR editing (CR). GAPDH normalized densitometry represented as fold over hepatocytes +WT quiescent HSCs is mean±SE from three experiments. Raw densitometry of each experiment is presented in Figure 7—figure supplement 1. Source data are presented in Figure 7—source data 4. P values are calculated in Figure 7—source data 5. (F) Summary of findings. AKAP12 interacts with HSP47 in the ER of normal HSCs and negatively regulates HSP47’s collagen-chaperoning activity and its ability to promote ER stress-directed IRE1α branch of UPR signaling. AKAP12 negatively regulates HSC activation. Pro-fibrogenic stimuli that cause HSC activation allow AKAP12’s PKCα-dependent site-specific phosphorylation. By AKAP12 CRISPR phospho-editing, we show that AKAP12 phosphorylation inhibits AKAP12’s HSP47 scaffolding activity, increases HSP47-collagen chaperoning activity and induces HSP47’s interaction with UPR signals (IRE1α and P-IRE1α). AKAP12 phosphorylation may lead to increased downstream events associated with the UPR signaling such as BIP-collagen chaperoning, phosphorylation of SMADs/P38MAPK and UPR-regulated inflammatory signaling. Blocking AKAP12 phosphorylation in activated HSCs prevents the ER stress response in hepatocytes co-cultured with activated HSCs. ER, endoplasmic reticulum; HSC, hepatic stellate cell; UPR, unfolded protein response; WT, wild-type.
-
Figure 7—source data 1
Source blots for Figure 7B.
- https://cdn.elifesciences.org/articles/78430/elife-78430-fig7-data1-v2.zip
-
Figure 7—source data 2
Source blots for Figure 7C.
- https://cdn.elifesciences.org/articles/78430/elife-78430-fig7-data2-v2.zip
-
Figure 7—source data 3
Source blots for Figure 7D.
- https://cdn.elifesciences.org/articles/78430/elife-78430-fig7-data3-v2.zip
-
Figure 7—source data 4
Source blots for Figure 7E.
- https://cdn.elifesciences.org/articles/78430/elife-78430-fig7-data4-v2.zip
-
Figure 7—source data 5
Post hoc analysis for Figure 7.
- https://cdn.elifesciences.org/articles/78430/elife-78430-fig7-data5-v2.xlsx
Figure 7—figure supplement 1
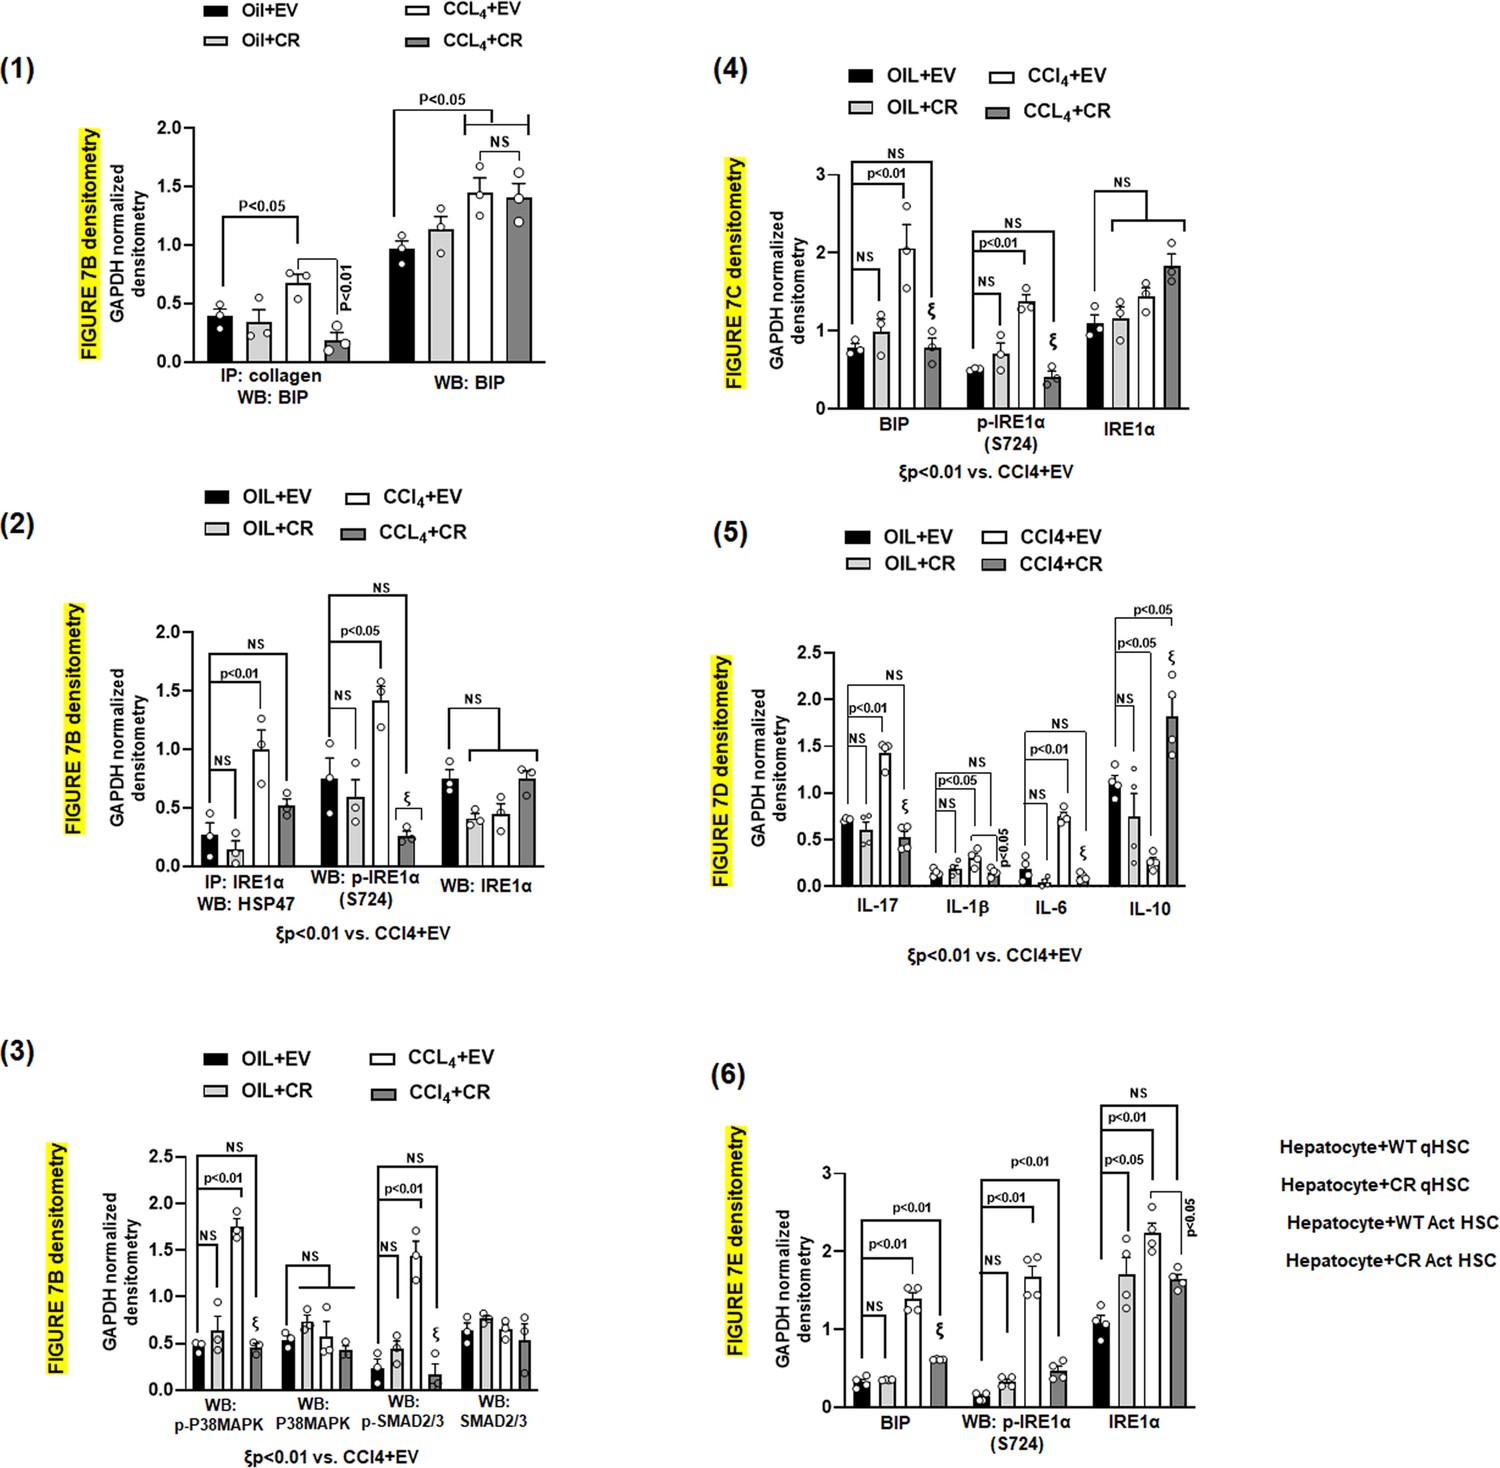
Densitometric quantification of blots from Figure 7B–E.
Figure 7B blots densitometry—Friedman, 2008; Hernández-Gea et al., 2013; Li et al., 2008; Figure 7C blots densitometry—Kawasaki et al., 2015; Figure 7D blots densitometry—Sepulveda et al., 2018; Figure 7E blots densitometry—Brown et al., 2005.
Figure 7—figure supplement 2
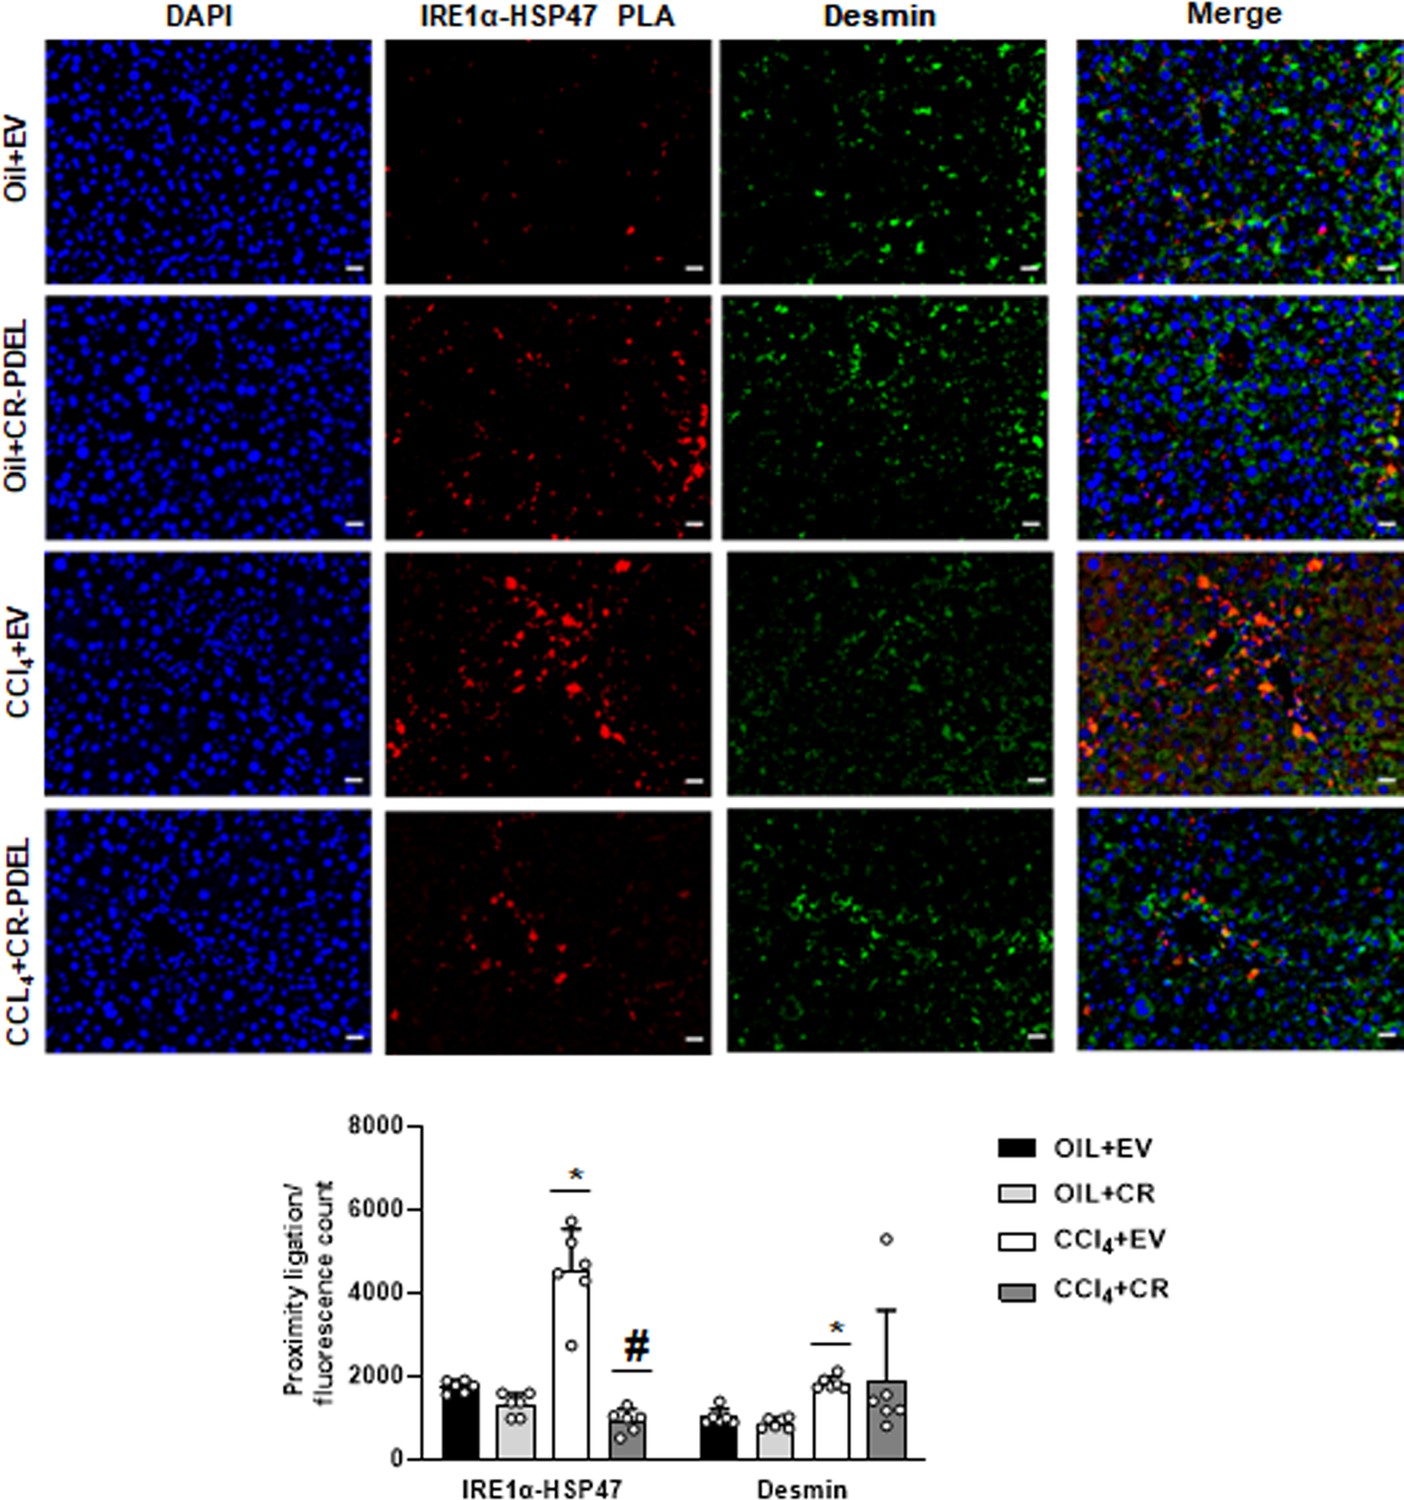
Interaction between IRE1α and HSP47 in desmin-positive HSCs of CRISPR-PDEL model by PLA staining.
Data representative of the PLA/fluorescence count is mean±SE from six experiments (200× magnification, scale bar=40 µm). *p<0.01 versus oil+EV, #p<0.01 versus CCl4+EV. EV, empty vector; HSC, hepatic stellate cell; PLA, proximity ligation assay.
Tables
Table 1
Phospho-peptide mapping of human HSCs, mouse HSCs, and mouse hepatocytes.
| Cell type | Observed precursor mass | Neutral loss of phosphate mass | Phospho-peptide sequence | Peptide modification |
|---|---|---|---|---|
| Day 0 human HSC | 1988.7812 | 1890.0297 | KRKVDTSVSWEALICVGSSKK | Phospho (ST)[16] |
| Day 7 human HSC | 2148.9758 | 1854.9 | KRKVDTSVSWEALICVGSSK | Phospho (ST)[16,17], |
| Day 7 human HSC | 2148.9932 | 1855.3141, 1854.9 | KRKVDTSVSWEALICVGSSKK | Phospho (ST)[4,6,16] |
| Day 0 mouse HSC | ND | ND | KRKVDTSVSWEALICVGSSKK | ND |
| Day 7 mouse HSC | 1998.13 | 1801.7952 | KRKVDTSVSWEALICVGSSK | Phospho (ST)[3,6] |
| Day 7 mouse HSC | 2054.22 | 1857.9027 | KRKVDTSVSWEALICVGSSKK | Phospho (ST)[14,15] |
| Mouse hepatocytes | ND | ND | KRKVDTSVSWEALICVGSSK | ND |
-
S=Serine, T=Threonine, ND=not detected.
-
Table 1—source data 1
Phospho-peptide map for Table 1.
- https://cdn.elifesciences.org/articles/78430/elife-78430-table1-data1-v2.pptx
Key resources table
| Reagent type (species) or resource | Designation | Source or reference | Identifiers | Additional information |
|---|---|---|---|---|
| Gene (Human) | AKAP12 | GenBank | Accession ID: NM_005100.4 | |
| Gene (Mus musculus) | Akap12 | GenBank | Accession ID: NM_031185.3 | |
| Transfected construct (Human) | Negative control siRNA | Thermo Fisher Scientific | Cat# 4404021 | silencerselect siRNA |
| Transfected construct (Human) | Prkca siRNA-A | Thermo Fisher Scientific | Cat# s11092 | silencerselect siRNA |
| Transfected construct (Human) | Prkca siRNA-B | Thermo Fisher Scientific | Cat# s11094 | silencerselect siRNA |
| Sequence-based reagent | Human PDEL region forward primer-653 bp amplicon | This paper | PCR primer | AGCTACTTCCGATGGAGAGA |
| Sequence-based reagent | Human PDEL region reverse primer-653 bp amplicon | This paper | PCR primer | CAGGAATAAACTTCTTGATTGAGACC |
| Sequence-based reagent | Human PDEL-specific primer | This paper | PCR primer | GACCCTCTCCTTGCTCTTTTCTTATC |
| Sequence-based reagent | Mouse PDEL region forward primer-780 bp amplicon | This paper | PCR primer | GATGAAGAGCCAGGAGAATACC |
| Sequence-based reagent | Mouse PDEL region reverse primer-780 bp amplicon | This paper | PCR primer | GGAAACCCAAGATTCCTCTCTAC |
| Sequence-based reagent | Mouse PDEL region amplicon sequencing forward primer-298 bp amplicon | This paper | PCR primer | ACAAGGAAGAAGAGCTGGATAAG |
| Sequence-based reagent | Mouse PDEL region amplicon sequencing reverse primer-298 bp amplicon | This paper | PCR primer | CTGGCAGGAAGAGCATCTG |
| Sequence-based reagent | Mouse PDEL -specific primer | This paper | PCR primer | GCCTTCCTCGCTCTCTTCTTATC |
| Sequence-based reagent | Human guide sequence | This paper | CRISPR guide RNA sequence | GGAAGAACCAAAGCGCAAGGTG |
| Sequence-based reagent | Mouse guide sequence #1 | This paper | CRISPR guide RNA sequence | GTCAGAGGAGCCAAAGCGCAGG |
| Sequence-based reagent | Mouse guide sequence #2 | This paper | CRISPR guide RNA sequence | GGCCCTCCTTCATCATCTGAA |
| Sequence-based reagent | Human PDEL HDR donor | This paper | CRISPR donor RNA sequence | GCCAAAGCCGGAAGAACCAAAGCGCAAGGTCGATAAGAAAAGAGCAAGGAGAGGGTCCTCTTCT |
| Sequence-based reagent | Mouse PDEL HDR donor | This paper | CRISPR donor RNA sequence | GAGGAGCAAAGGTCAGAGGAGCCAAAGCGCCGGGTGGATAAGAAGAGAGCGAGGAAGGCATCCTCTTCA |
| Sequence-based reagent | Mouse pMUT HDR donor | This paper | CRISPR donor RNA sequence | AGGTCAGAGGAGCCAAAGCGCAGGGTGGATGCTGCAGTGGCTTGGGAGGCGTTGATTTGTGTCGGAGCGGCCAAGAAGAGAGCGAGGAAGGCATCCTCTTCA |
| Recombinant DNA reagent | OmicsLink expression clone of human AKAP12 in pRECEIVER-WG16 vector | Genecopoeia, MD | EX-H3212-WG16 | Vector for in vitro translation of AKAP12 controlled by T7 promoter |
| Recombinant DNA reagent | AAV-GFAP-Sacas9 | Vector Biolabs, PA | Cat #7125 | HSC-specific gene editing AAV vector |
| Recombinant DNA reagent | AAV-LRAT-Sacas9 | Vector Builder cloning service | HSC-specific gene editing AAV vector | |
| Peptide, recombinant protein | PKCα protein, active | MilliporeSigma, MA | 14-484 | In vitro kinase assay |
| Peptide, recombinant protein | HSP47 recombinant, human | Prospec NJ | HSP-047 | Recombinant binding assay |
| Chemical compound, drug | Carbon tetrachloride (CCl4) | Sigma-Aldrich | Cat #270652 | HPLC grade |
| Other | Lipofectamine RNAiMAX | Thermo Fisher Scientific | Cat #13778075 | Transfection of siRNA |
| Other | Dharmafect Duo reagent | Dharmacon, CO | Cat #T-2010-02 | Transfection of CRISPR components |
| Commercial assay or kit | QuikChange II site-directed mutagenesis Kit | Agilent Technologies, CA | Cat #200521 | Mutagenesis of AKAP12 plasmid |
| Commercial assay or kit | Non-radioactive TNT Coupled Transcription/Translation system | Promega, WI | Cat #L4610 | In vitro translation |
| Commercial assay or kit | Hydroxyproline Assay Kit | Cell Biolabs Inc, CA | Cat #STA-675 | Hydroxyproline measurement in liver |
| Commercial assay or kit | ALT colorimetric activity assay kit | Cayman Chemical, MA | Cat #700260 | ALT measurement in plasma |
| Commercial assay or kit | AST colorimetric activity assay kits | Cayman Chemical, MA | Cat #701640 | ALT measurement in plasma |
| Biological sample (Homo sapiens) | Primary human hepatic stellate cells | ScienCell Incorporation | Cat #5300 | |
| Biological sample (H. sapiens) | Human tissue array | Human tissue biorepository, US Biolabs Inc MD | XLiv086-01 | |
| Antibody | Anti-AKAP12 antibody (JP74 clone, mouse monoclonal) | Abcam | ab49849 | Immunoprecipitation: (1 µg/500 µg) extract; western: (1:2000) in 5% milk/TBS-Tween-20; PLA: (1:250) dilution in PLA buffer |
| Antibody | Anti-Phosphoserine antibody (rabbit polyclonal) | Abcam | ab9332 | PLA: (1:250) dilution |
| Antibody | Anti-α-SMA antibody (rabbit polyclonal) | Abcam | ab5694 | Western: (1:2000) in 5% milk/TBS-Tween-20 |
| Antibody | Anti-PKCα antibody (rabbit polyclonal) | Genetex | GTX130453 | Western: (1:2000) in 5% milk/TBS-Tween-20 |
| Antibody | Anti-Collagen I alpha (Friedman, 2008) antibody (COL-1 clone, mouse monoclonal) | Novus Biologicals | NB600-450 | Western: (1:1000) in 5% milk/TBS-Tween-20; PLA: (1:250) dilution in PLA buffer |
| Antibody | Anti-HSP47 antibody (clone # 950806, mouse monoclonal) | Novus Biologicals | MAB9166-100 | Western: (1:2000) in 5% milk/TBS-Tween; PLA: (1:250) dilution in PLA buffer |
| Antibody | Anti-Biotin antibody (rabbit polyclonal IgG) | Abcam | ab53494 | Western: (1:1000) in 5% milk/TBS-Tween-20 |
| Antibody | Anti-GAPDH antibody (rabbit polyclonal IgG) | Proteintech | 10494-1-AP | Western: (1:2000) in 5% milk/TBS-Tween |
| Antibody | Anti-SaCas9 antibody (Clone 11C12, mouse monoclonal) | Genetex | A01951 | Western: (1:2000) in 5% milk/TBS-Tween |
| Antibody | Anti-desmin antibody (rabbit polyclonal IgG) | Proteintech | 16520-1-AP | Immunostaining: (1:250) dilution in PLA buffer |
| Antibody | Anti-albumin antibody (rabbit polyclonal IgG) | Proteintech | 16475-1-AP | Immunostaining: (1:250) dilution in PLA buffer |
| Antibody | Anti-IRE1α antibody (rabbit polyclonal IgG) | Proteintech | 27528-1-AP | Western: (1:1000) in 5% milk/TBS-Tween-20; PLA: (1:250) dilution in PLA buffer |
| Antibody | Anti-Phospho-IRE1α (S724) antibody (rabbit polyclonal IgG) | Abcam | ab124945 | Western: (1:1000) in 5% BSA/TBS-Tween-20 |
| Antibody | Anti-phospho-Smad2 (Ser465/467)/Smad3 (Ser423/425) (rabbit polyclonal IgG) | Cell Signaling Technology | 8828 | Western: (1:2000) in 5% BSA/TBS-Tween-20 |
| Antibody | Anti-SMAD2 antibody (rabbit polyclonal IgG) | Proteintech | 12570-1-AP | Western: (1:2000) in 5% BSA/TBS-Tween-20 |
| Antibody | Anti-SMAD3 antibody (rabbit polyclonal IgG) | Proteintech | 25494-1-AP | Western: (1:2000) in 5% BSA/TBS-Tween-20 |
| Antibody | Phospho-p38 MAPK (Thr180/Tyr182) Antibody (rabbit polyclonal IgG) | Cell Signaling Technology | 9211 | Western: (1:2000) in 5% BSA/TBS-Tween-20 |
| Antibody | P38 MAPK Antibody (rabbit polyclonal IgG) | Cell Signaling Technology | 9212 | Western: (1:2000) in 5% BSA/TBS-Tween-20 |
| Antibody | Anti-BIP/GRP78 antibody (rabbit polyclonal IgG) | Proteintech | 11587-1-AP | Western: (1:2000) in 5% milk/TBS-Tween-20 |
| Antibody | Anti-IL1β antibody (rabbit polyclonal IgG) | Proteintech | 26048-1-AP | Western: (1:2000) in 5% milk/TBS-Tween-20 |
| Antibody | Anti-IL6 antibody (rabbit polyclonal IgG) | Proteintech | 21865-1-AP | Western: (1:2000) in 5% milk/TBS-Tween-20 |
| Antibody | Anti-IL17 antibody (Clone 1B3D5, mouse monoclonal) | Proteintech | 66148-1-Ig | Western: (1:2000) in 5% milk/TBS-Tween-20 |
| Antibody | Anti-IL10 antibody (rabbit polyclonal IgG) | Proteintech | 20850-1-AP | Western: (1:2000) in 5% milk/TBS-Tween-20 |
| Antibody | Anti-calreticulin antibody (clone EPR3924, rabbit monoclonal) | Abcam | ab92516 | Immunostaining: (1:250) dilution in PLA buffer |
| Antibody | Clean-Blot IP Detection (HRP) (secondary antibody) | Life Technologies | 21230 | Detection: co-immunoprecipitation-immunoblot: (1:1000) in 5% milk/TBS-Tween-20 |
| Antibody | Streptavidin-HRP (secondary antibody) | Cell Signaling Technology | 3999 | Detection: Biotin western blots: (1:5000) in 5% milk/TBS-Tween-20 |
| Antibody | Goat anti rabbit IgG H&L (Alexa Fluor 488 green) (secondary antibody) | Abcam | ab150077 | Detection: immunoflorescence: (1:1000) in PLA buffer |
| Antibody | Goat Anti-Mouse IgG H&L (Alexa Fluor 488 green) (secondary antibody) | Abcam | ab150113 | Detection: immunoflorescence: (1:1000) in PLA buffer |
| Antibody | Goat Anti-Mouse IgG H&L (Alexa Fluor 647 far red) (secondary antibody) | Abcam | ab150115 | Detection: immunoflorescence: (1:1000) in PLA buffer |
| Antibody | Goat Anti-Rabbit IgG H&L (Alexa Fluor 647 far red) (secondary antibody) | Abcam | ab150079 | Detection: immunoflorescence: (1:1000) in PLA buffer |
| Antibody | Duolink In Situ PLA Probe Anti-Mouse PLUS (secondary antibody) | MilliporeSigma | DUO92001 | Detection: PLA: (1:600) in PLA buffer |
| Antibody | Duolink In Situ PLA Probe Anti-Mouse MINUS (secondary antibody) | MilliporeSigma | DUO92004 | Detection: PLA: (1:600) in PLA buffer |
Additional files
-
Supplementary file 1
Kinase-prediction for AKAP12’s activation-responsive phospho-sites.
- https://cdn.elifesciences.org/articles/78430/elife-78430-supp1-v2.docx
-
Supplementary file 2
Datasets of next-generation amplicon sequencing (NGS) from PDEL CRISPR mouse model.
Genomic DNA of HSCs isolated from oil or CCl4 injected mice treated with AKAP12 PDEL CRISPR +GFAP-Cas9 or LRAT-Cas9 were submitted for NGS to Azenta Life Sciences as described under methods. Hepatocytes from PDEL CRISPR +GFAP-Cas9 were also processed as above for NGS. Representative raw reads of WT, deletion or base changes are shown for each data set and summarized in the first summary tab of the excel.
- https://cdn.elifesciences.org/articles/78430/elife-78430-supp2-v2.xlsx
-
Supplementary file 3
Datasets of next-generation amplicon sequencing (NGS) from PMUT CRISPR mouse model.
Genomic DNA of HSCs or hepatocytes isolated from oil or CCl4 injected mice treated with AKAP12 PMUT CRISPR +GFAP-Cas9 were submitted for NGS to Azenta Life Sciences as described under methods. Representative raw reads of WT or base changes are shown for each data set and summarized in the first summary tab of the excel.
- https://cdn.elifesciences.org/articles/78430/elife-78430-supp3-v2.xlsx
-
Supplementary file 4
Proteomics analysis of total liver and HSCs from CRISPR PDEL mouse model.
Total protein from the liver or HSCs of AKAP12 PDEL CRISPR +GFAP-Cas9 mice was subjected to mass spectrometry-based proteomics analysis as described under methods. Proteomics dataset of whole liver, ER stress/UPR components of the liver and HSCs is shown. The summary tab in the excel explains each dataset.
- https://cdn.elifesciences.org/articles/78430/elife-78430-supp4-v2.xlsx
-
Supplementary file 5
Mouse sgRNA off-target analysis.
- https://cdn.elifesciences.org/articles/78430/elife-78430-supp5-v2.docx
-
Transparent reporting form
- https://cdn.elifesciences.org/articles/78430/elife-78430-transrepform1-v2.pdf
Download links
A two-part list of links to download the article, or parts of the article, in various formats.
Downloads (link to download the article as PDF)
Open citations (links to open the citations from this article in various online reference manager services)
Cite this article (links to download the citations from this article in formats compatible with various reference manager tools)
Targeting A-kinase anchoring protein 12 phosphorylation in hepatic stellate cells regulates liver injury and fibrosis in mouse models
eLife 11:e78430.
https://doi.org/10.7554/eLife.78430


