Rapid adaptation of a complex trait during experimental evolution of Mycobacterium tuberculosis
- New York Genome Center, United States
- Department of Medical Microbiology and Immunology, School of Medicine and Public Health, University of Wisconsin-Madison, United States
- Microbiology Doctoral Training Program, University of Wisconsin-Madison, United States
- Department of Immunology and Infectious Diseases, Harvard T.H. Chan School of Public Health, United States
- Laboratoire de Biochimie (LBC), Chimie Biologie et Innovation, ESPCI Paris, PSL Université, France
- Department of Medicine (Infectious Diseases), School of Medicine and Public Health, University of Wisconsin-Madison, United States
Figures
Figure 1 with 1 supplement

Whole genome sequence phylogeny of ancestral populations used for passaging and photos of pellicles throughout the experiment.
Populations fall into three clades with single-nucleotide polymorphism distances given for each sub-lineage and strain. Pellicle photos show rapid change in phenotype, followed by stabilization through the rest of the experiment. The star indicates the passage at which point we determined the pellicle phenotype to be stabilized for each population. Photos of pellicles were taken after 5–7 weeks of growth.
Figure 1—figure supplement 1
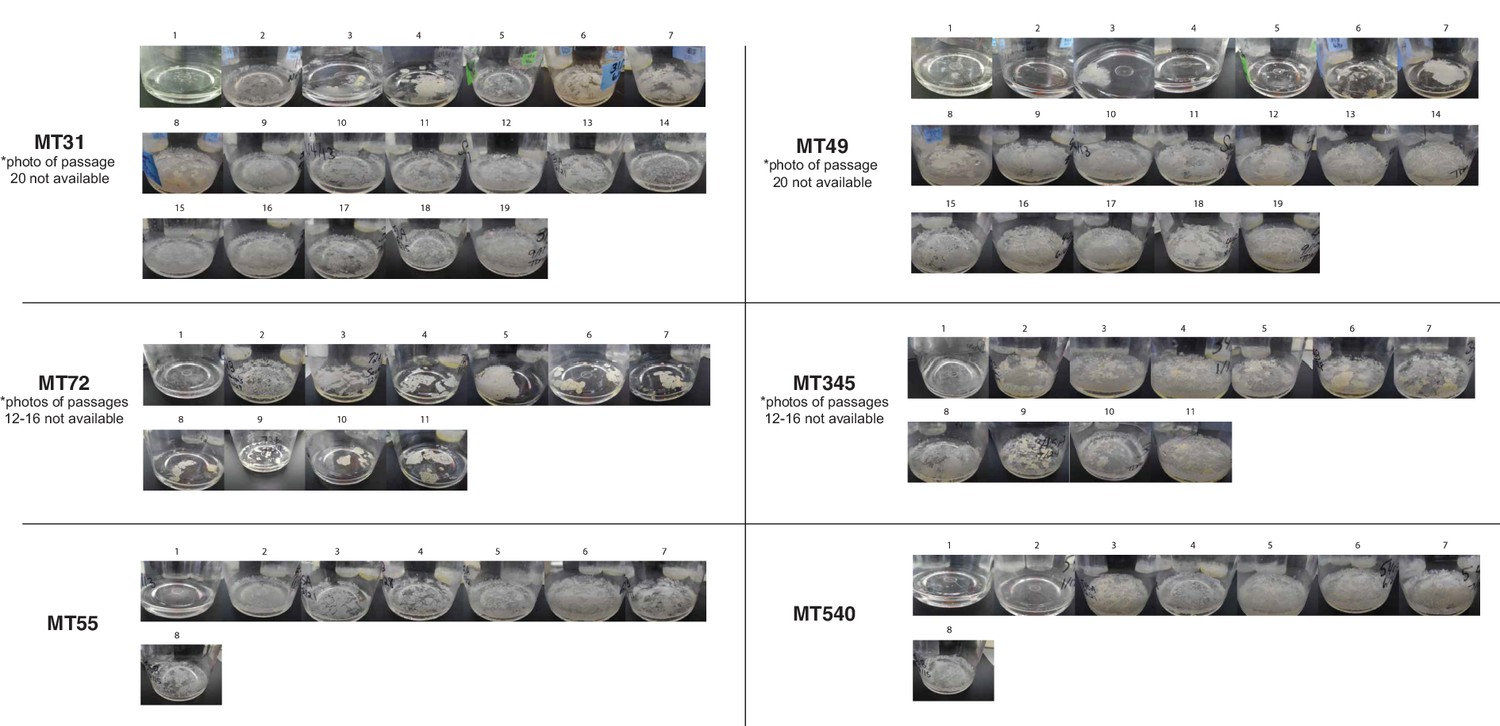
All photos from pellicle passaging experiment.
Photos taken at time of passaging, between 5 and 7 weeks of growth.
Figure 2

Phenotypic changes in evolved bacterial populations: cell size & matrix production.
(A) SEM images of ancestral and evolved biofilms show changes in extracellular matrix and (B) cell length. SEMs were taken after 5 weeks of biofilm growth, shown alongside photo of pellicle from that passage. Cell lengths were measured across two biological replicates for each strain, except MT540-0 for which only one replicate was available. Each dot represents a single cell length measurement. Significant differences (Kruskal–Wallis p-value=3.43e-05) in cell length between ancestral and evolved pairs shown across the top of panel B (Mann-Whitney U test with Benjamini-Hochberg correction). Scale bars in lower right side of SEM images = 1 μm. p-value legend: *p<0.05, **p<0.01, ***p<0.001.
-
Figure 2—source data 1
Cell lengths calculated by SEM for ancestral and pellicle evolved strains shown in Figure 2B.
- https://cdn.elifesciences.org/articles/78454/elife-78454-fig2-data1-v1.csv
Figure 3
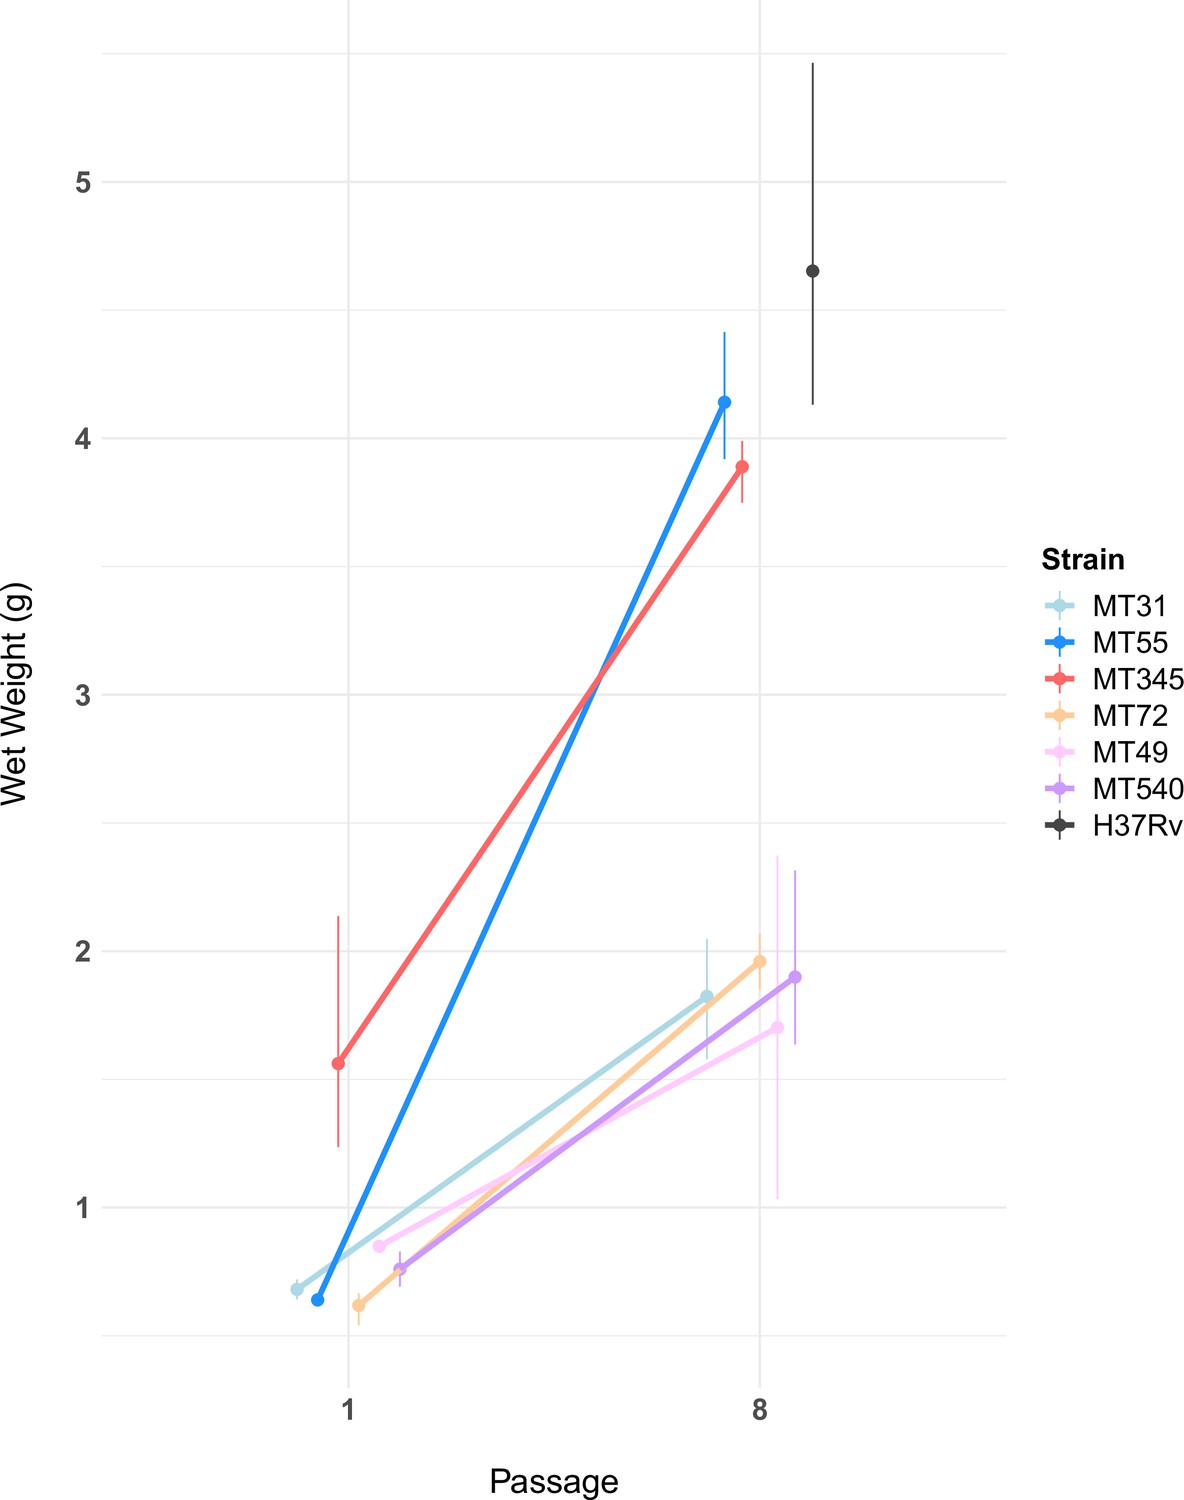
Pellicle wet weights measured after 5 weeks of growth, for ancestral populations and populations after eight passages (n=2–3 per experimental strain, n=5 for H37Rv, see Figure 3—source data 1).
Pellicle wet weights increased for all experimental populations following passaging (Mann-Whitney U test, p-value=1.5e-06). The magnitude of this change varied, with two genetic backgrounds (MT55 & MT345) showing relatively dramatic increases in pellicle weight, approaching the phenotype of lab-adapted strain H37Rv. We also observed a trend towards increased variability in wet weights after passaging as a pellicle. Error bars represent range of wet weights across replicates.
-
Figure 3—source data 1
Pellicle wet weights of ancestral and pellicle evolved strains.
- https://cdn.elifesciences.org/articles/78454/elife-78454-fig3-data1-v1.csv
Figure 4
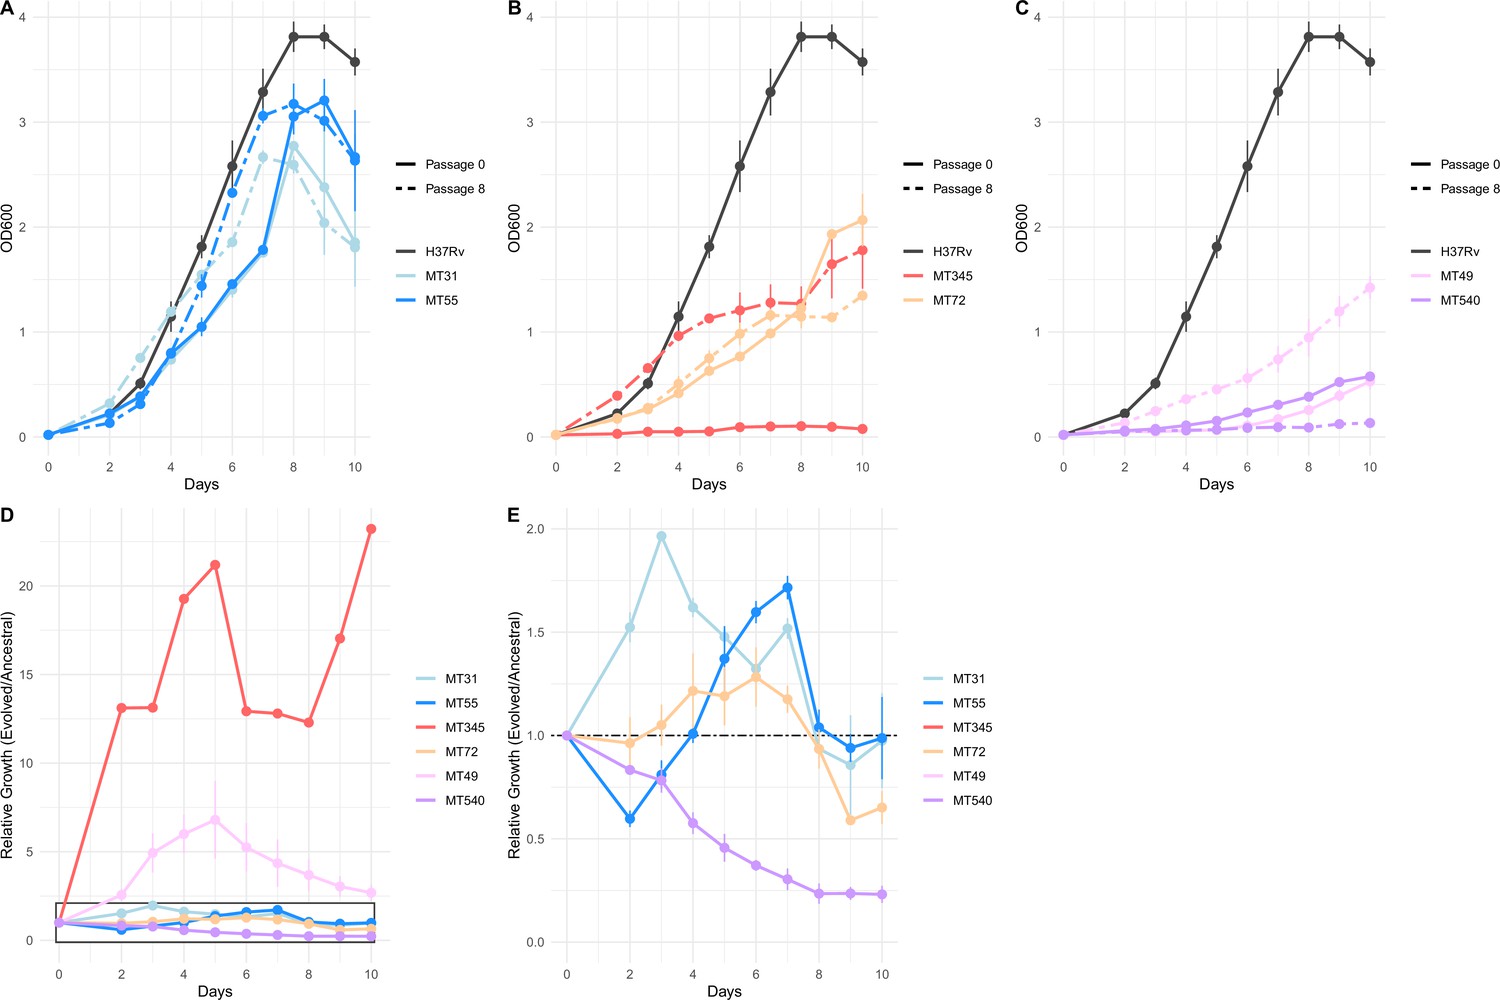
Impacts of pellicle passaging on planktonic growth rate vary by genetic background.
(A, B, C) Planktonic growth and (D, E) relative fitness curves comparing the growth of strains after eight pellicle passages to the ancestral strains. Growth curves were performed in triplicate, and the mean OD600 value is plotted with error bars representing ±1 SD. Relative fitness was calculated at each timepoint as OD600 Passage 8 / OD600 Passage 0. Panel E shows boxed region from panel D in more detail.
-
Figure 4—source data 1
Planktonic growth curves of ancestral and pellicle evolved strains.
- https://cdn.elifesciences.org/articles/78454/elife-78454-fig4-data1-v1.csv
Figure 5
Small number of variants that became fixed (>95 or <5% frequency) throughout the course of the experiment.
Including both single nucleotide polymorphisms and insertions/deletions (INDELs) identified by Popoolation2, Breseq, and/or Pilon. Highlighted in bold are two instances of convergent adaptation we observed within the L4.9 and L4.4.1.1 sub-lineages. These mutations are exclusive to strains passaged as pellicles, see Supplementary file 2 for mutations arising in strains passaged planktonically.
Figure 6 with 2 supplements
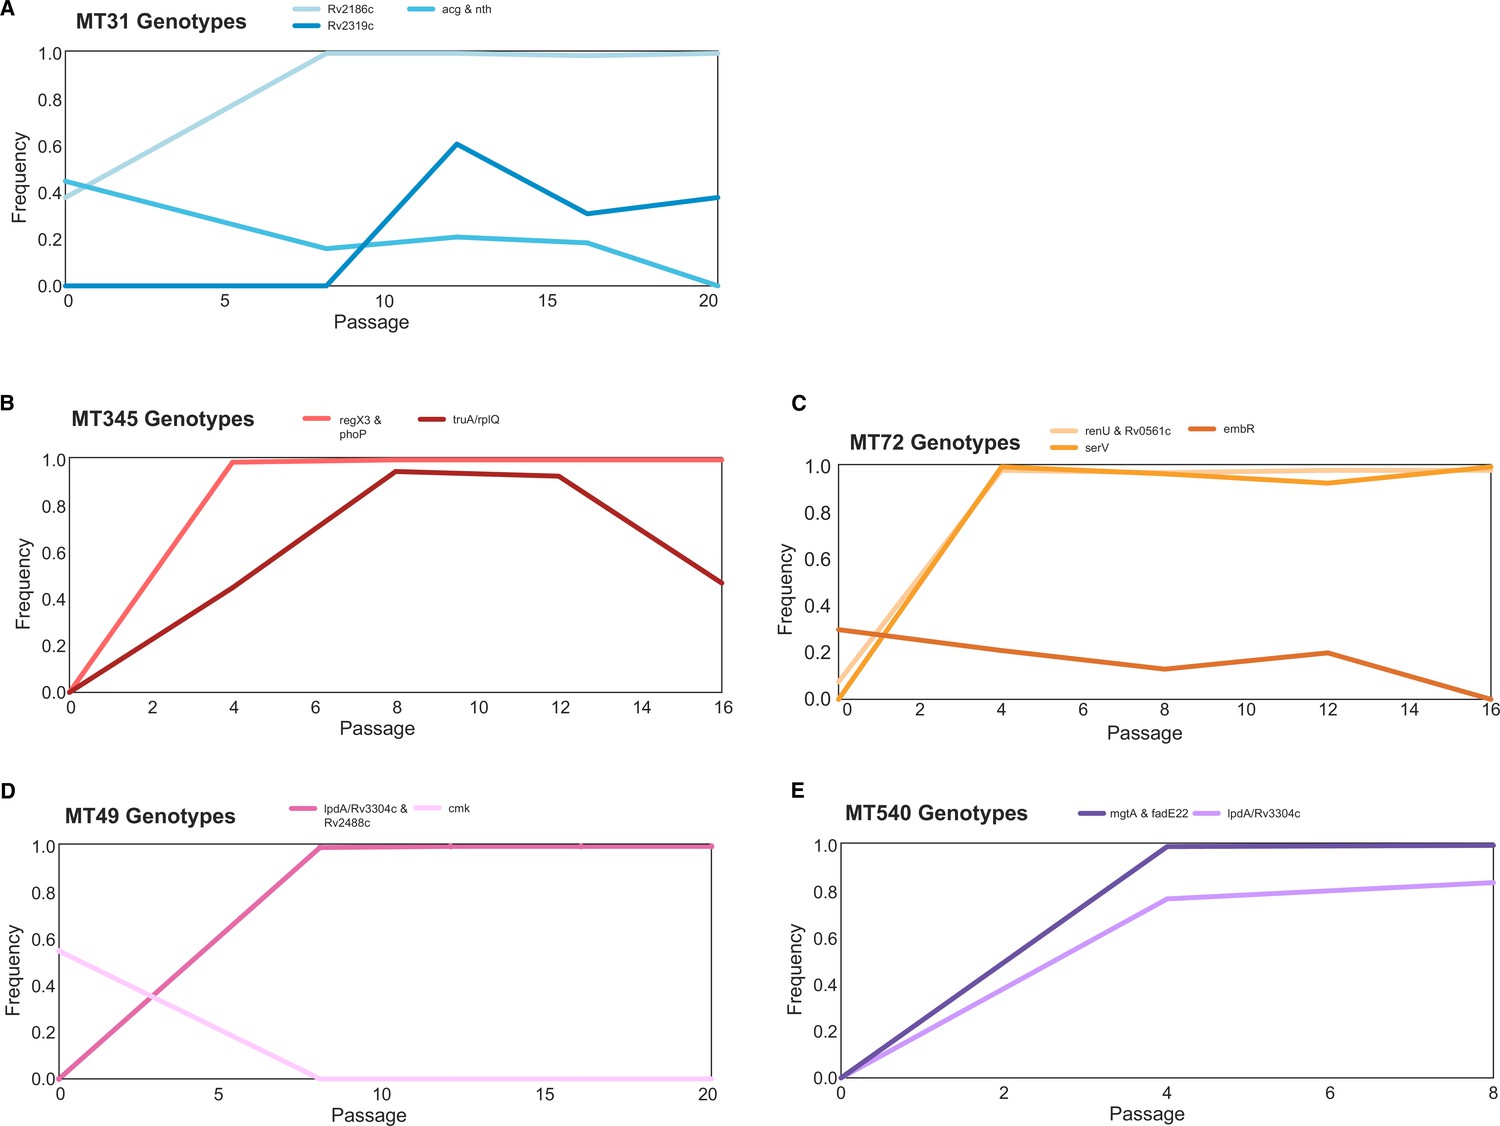
Trajectories of mutations that changed ≥30% over the course of the experiment show few mutations arose during passaging.
The mutations that became fixed almost always did so in the first or second sequenced passage (Supplementary file 1), and we identified very few mutations with substantial declines in frequency. Mutation frequency data were calculated with Popoolation2 and plots were made using Lolipop (see Methods).
Figure 6—figure supplement 1
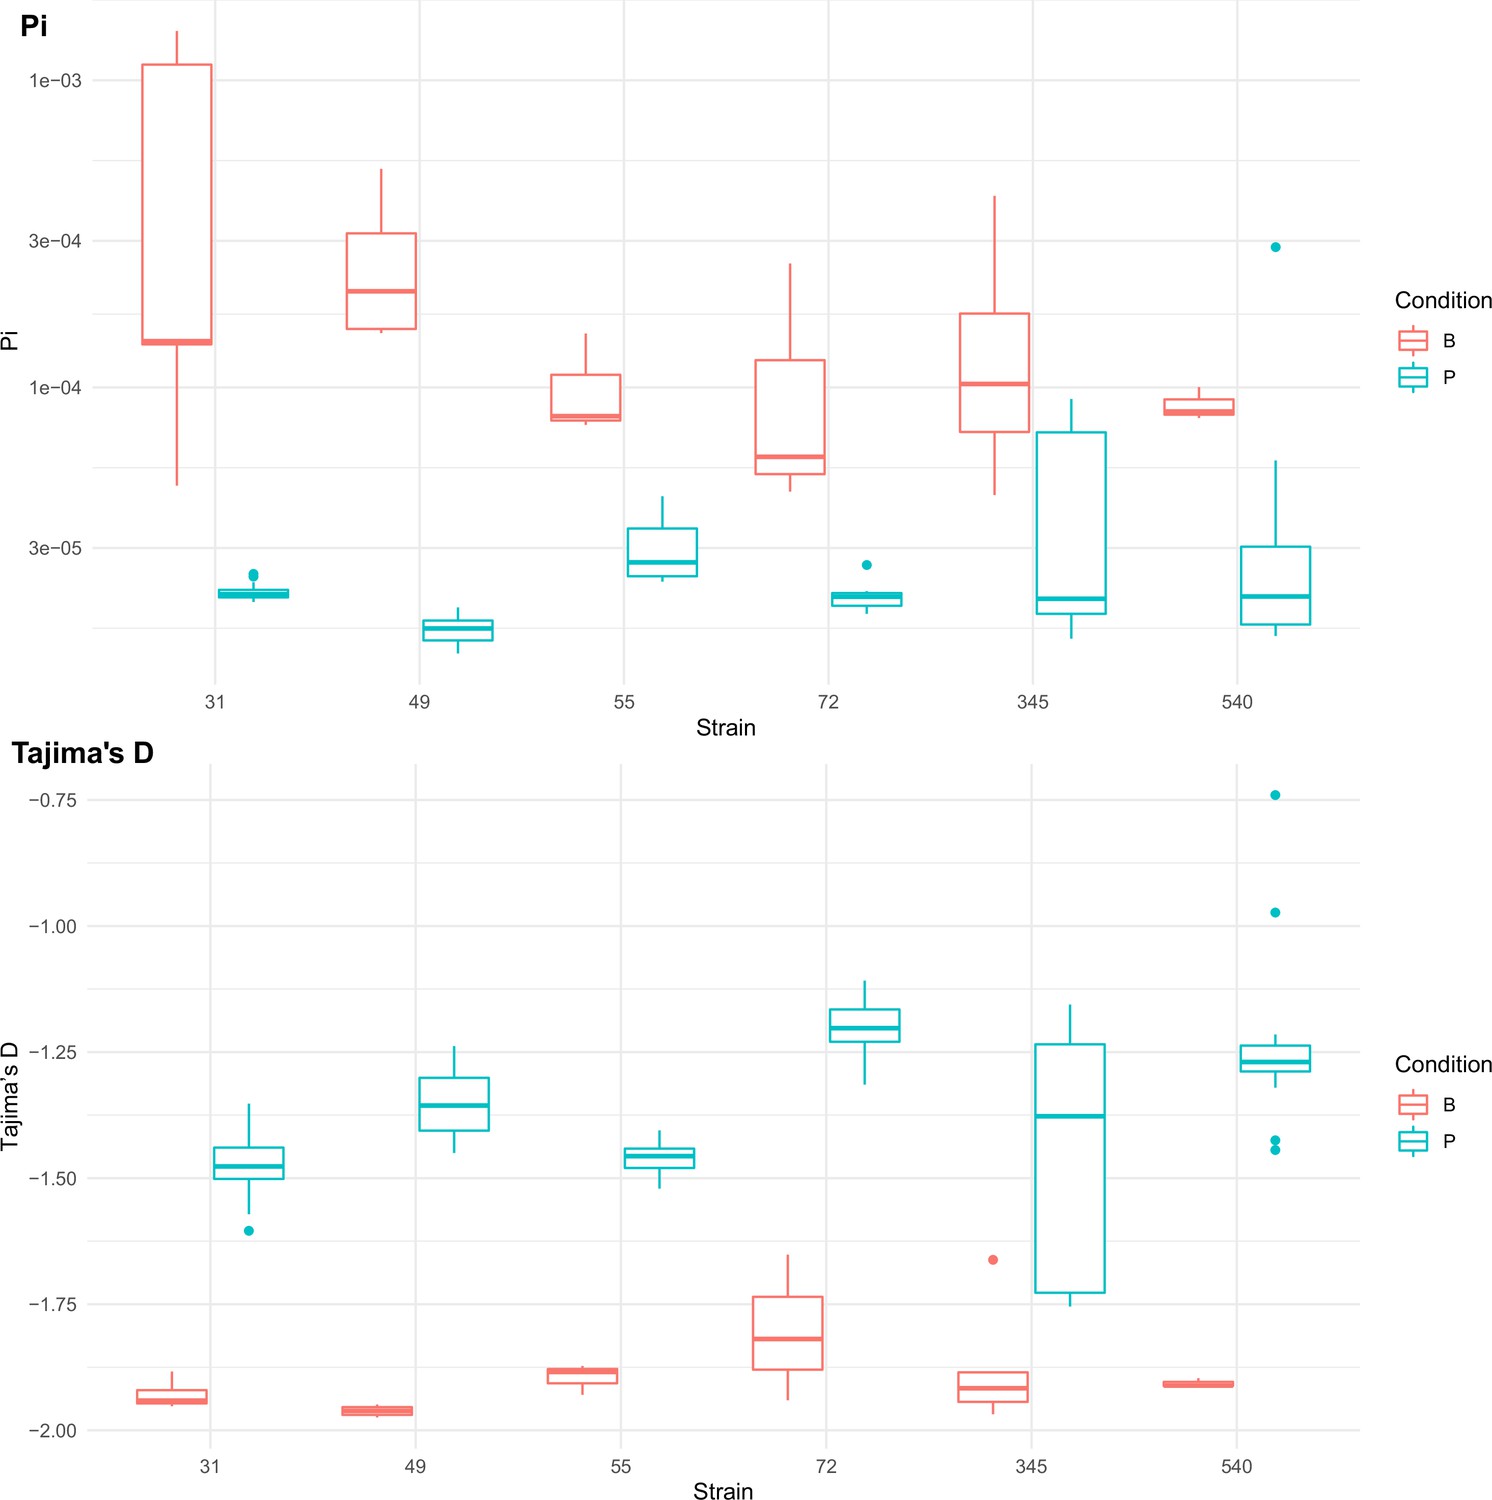
Population genetics statistics calculated from Pool-seq data from all strains at all sequenced passage points.
Range of values across all sequenced passage points given for each statistic. Boxplots are colored by strains passaged as biofilms (red) or passaged as planktonic cultures (blue).
Figure 6—figure supplement 2
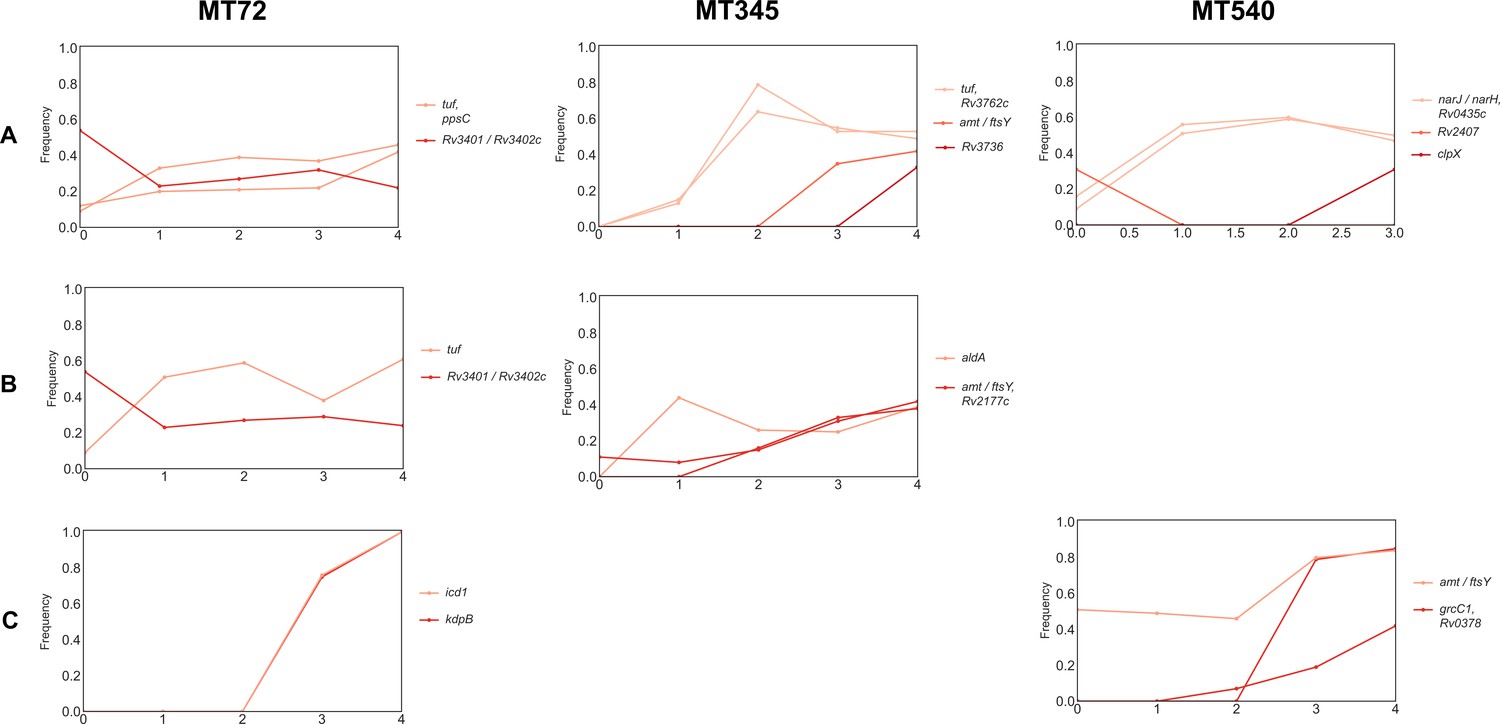
Trajectories of mutations that changed ≥30% over the course of planktonic passaging.
In contrast to strains evolved under biofilm conditions, only two mutations became fixed (both in MT72-C).
Figure 7 with 1 supplement
Adaptation to pellicle growth via increased expression of lpdA.
(A) Diagram of convergent adaptation in L4.4.1.1 strains MT540 and MT49 in the region upstream of lpdA within a transcription factor binding site (TFBS) and non-coding RNA. (B) Expression of lpdA differed significantly between sample groups (Kruskal–Wallis test, p-value=1.89e-04). Pairwise comparisons between groups (n=3, Mann-Whitney U test with Benjamini-Hochberg correction) revealed significantly increased expression in evolved (E) strains when compared with ancestral (A) strains, as well as during biofilm (B) growth when compared with planktonic (P) growth. (C) Overexpression of lpdA in H37Rv results in significantly (n=3 for each construct, Mann-Whitney U test) increased biofilm wet weights. p-value legend: *p<0.05, **p<0.01.
-
Figure 7—source data 1
RT-qPCR of lpdA (raw and log-2 fold changes) and pellicle wet weights from lpdA overexpression constructs shown in Figure 7B–C.
- https://cdn.elifesciences.org/articles/78454/elife-78454-fig7-data1-v1.xlsx
Figure 7—figure supplement 1
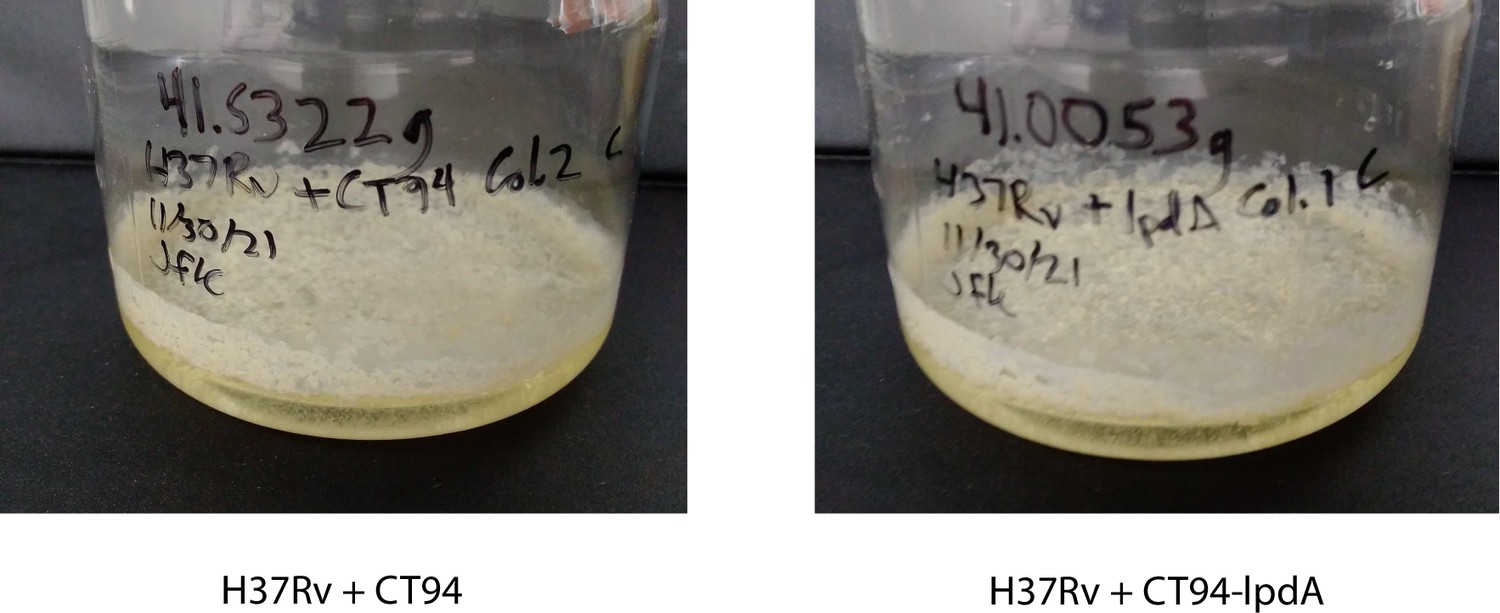
H37Rv pellicles with empty vector (left) and extra copy of lpdA (right) introduced into the chromosome using pCT94.
Qualitative pellicle phenotypes remain the same after introduction of additional lpdA.
Figure 8 with 2 supplements
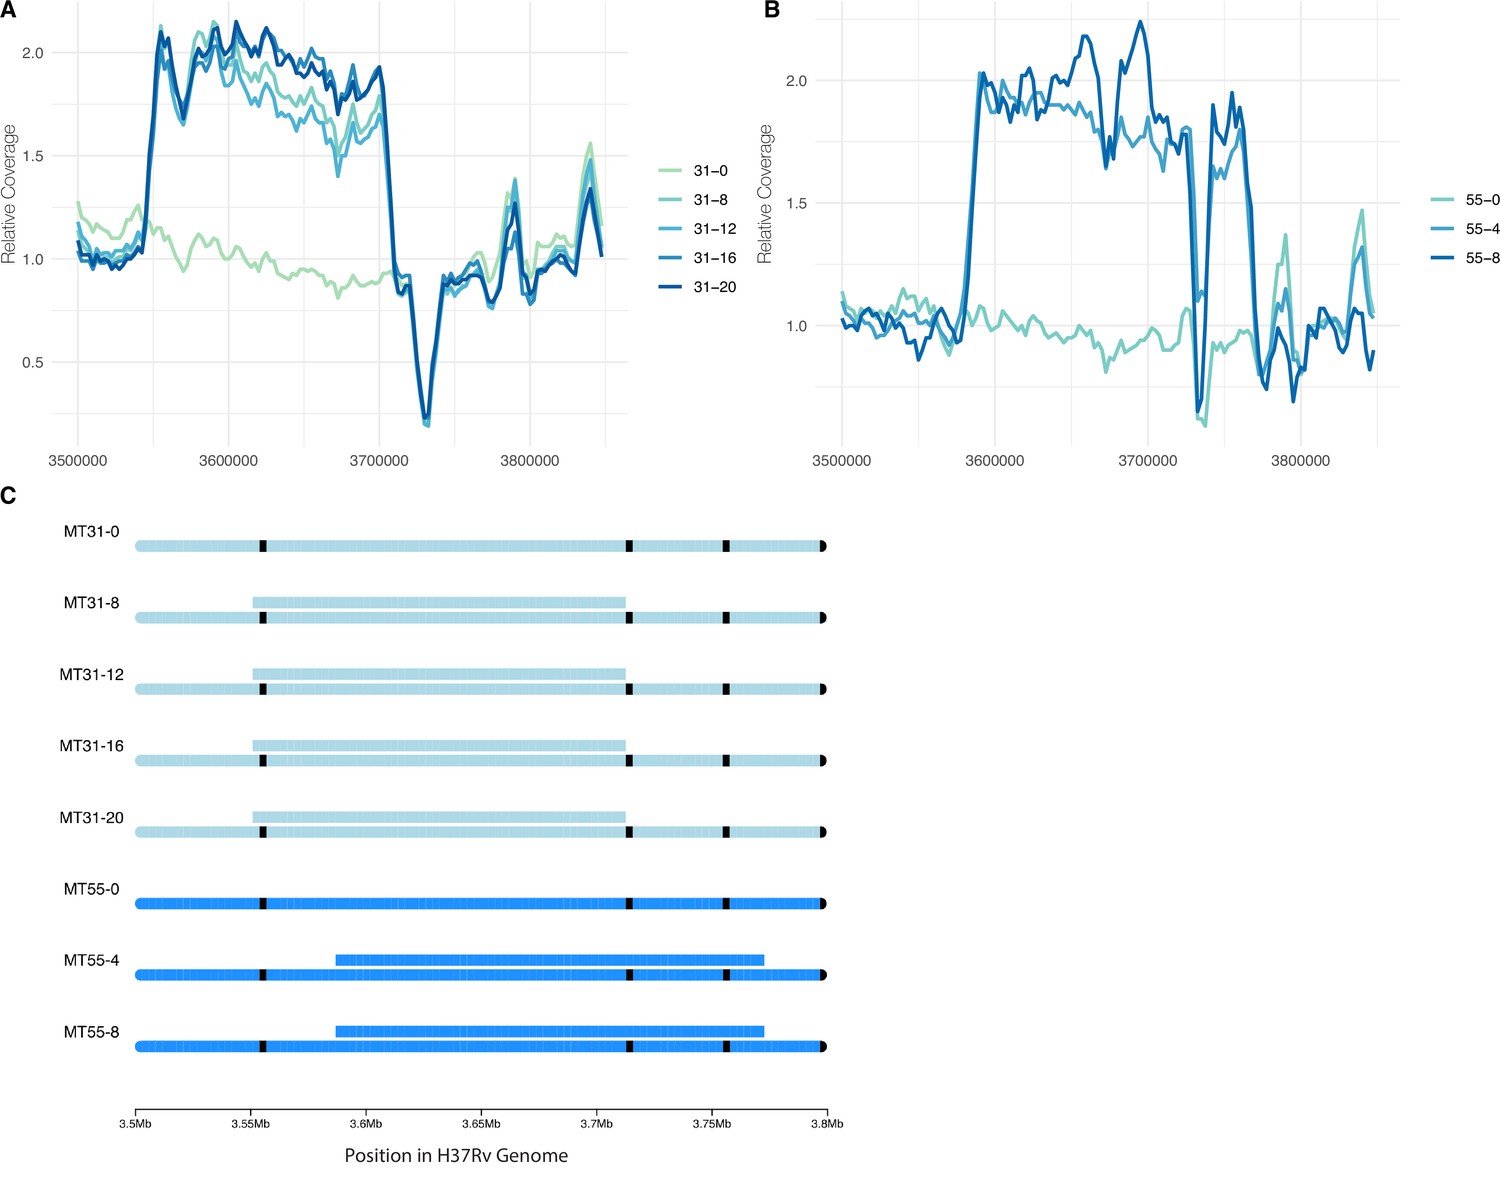
Convergent evolution of a large duplication in L4.9 strains MT31 and MT55, within the same genomic region flanked by mycobacterial IS6110 insertion sequences.
Sliding window coverage plots show the increase in coverage in this region for strain (A) MT31 and (B) MT55, and a chromosome plot (C) shows the duplications’ coordinates and overall stability in both populations over multiple passages along with the location of IS6110 insertion sequences in black.
Figure 8—figure supplement 1
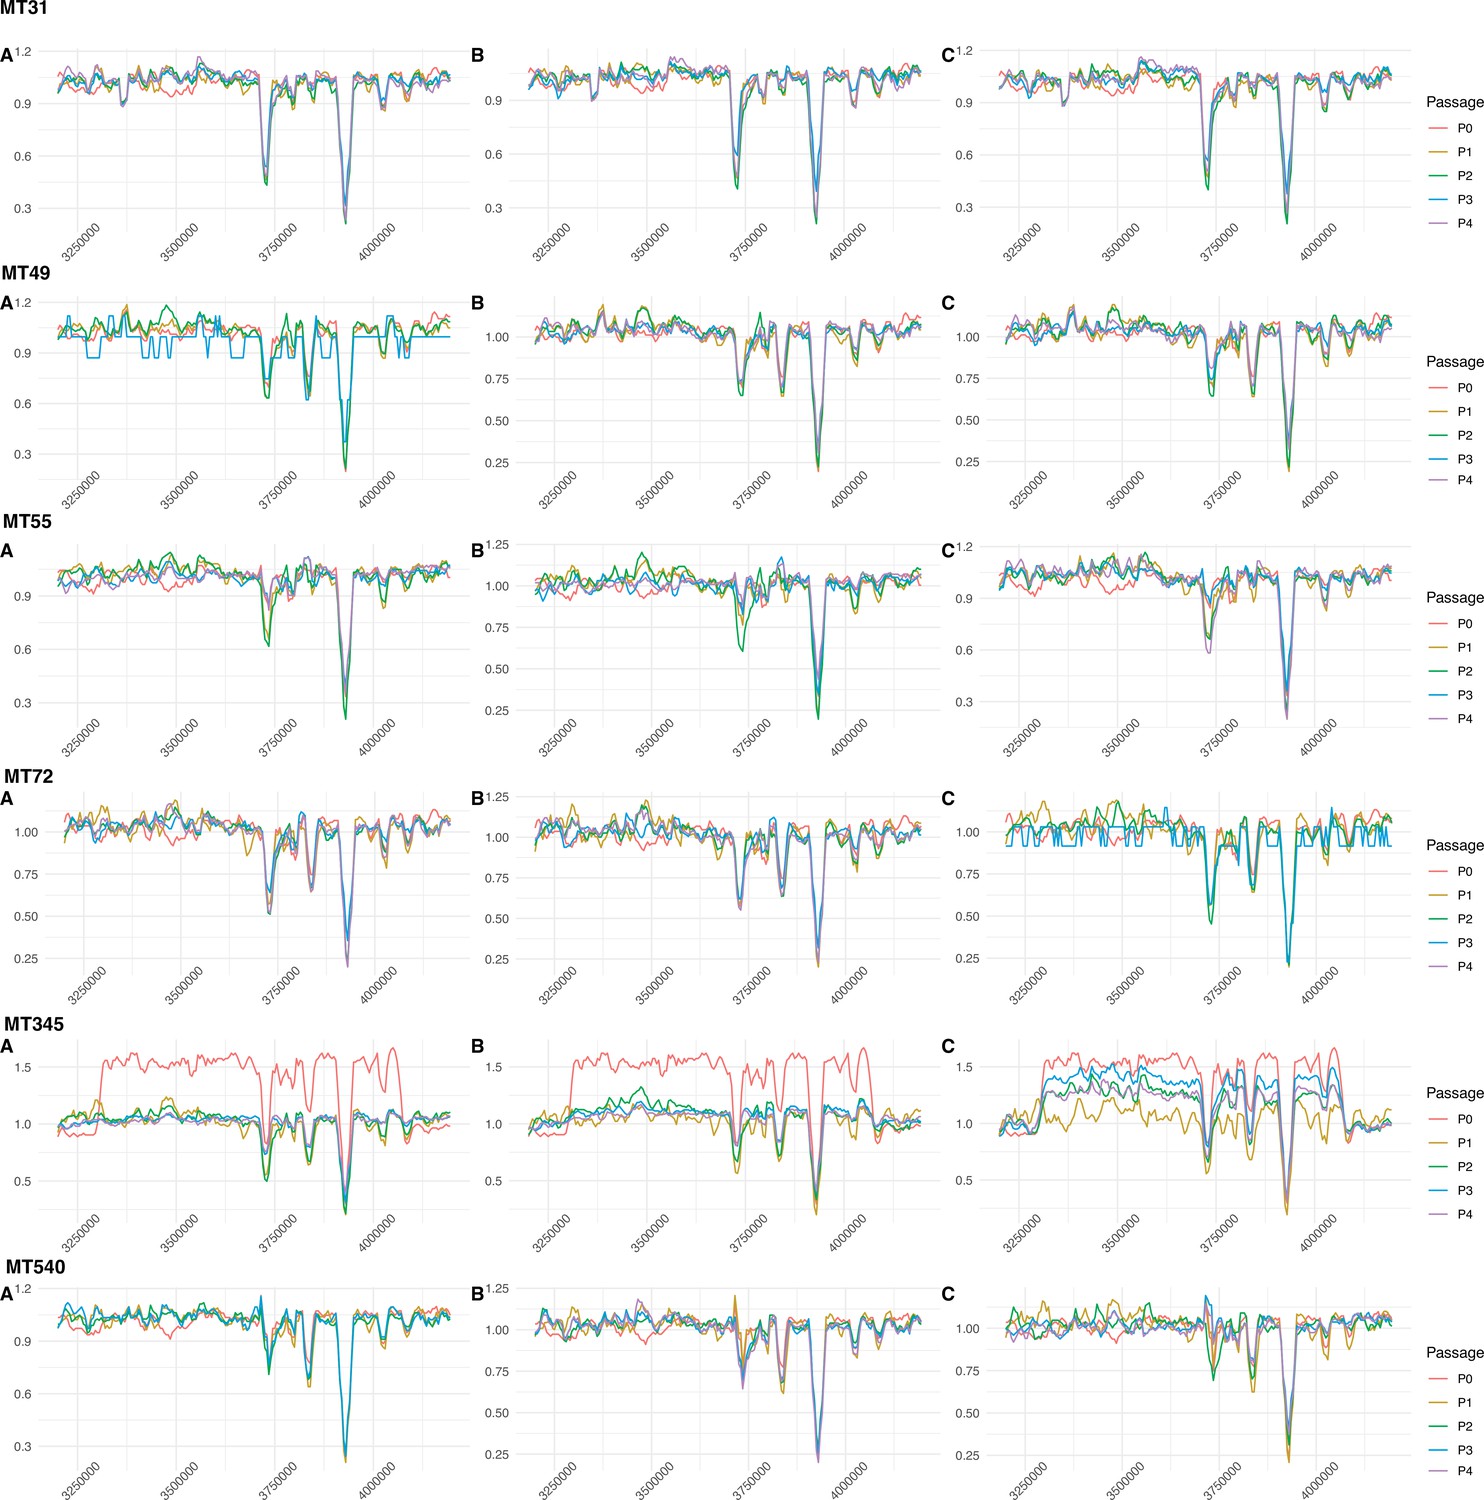
Sliding-window plots showing relative sequencing coverage of planktonically passaged isolates (n=3 independently evolving replicates per strain).
The region in which a convergent ~120 kb duplication was identified in strains MT31 and MT55 after passaging as pellicles doesn’t appear to have been replicated in strains evolved under these conditions. The one exception is MT345 passage 0, which acquired a duplication in this region during regular laboratory handling. This duplication is even larger than that in MT31 and MT55 (~700 kb) and exists at intermediate frequency in the ancestral strain, before disappearing in two of three evolved replicates. In the final replicate, the duplication fluctuates but remains at intermediate frequency after four passages.
Figure 8—figure supplement 2
Results of 100 permutations of random gene ontology (GO) term enrichment analysis (see Methods).
Histograms depicting the number of significantly (Fisher’s-exact, p<0.01) enriched GO terms (A) as well as the number of enriched terms involving nucleotide metabolism processes (B).
Figure 9
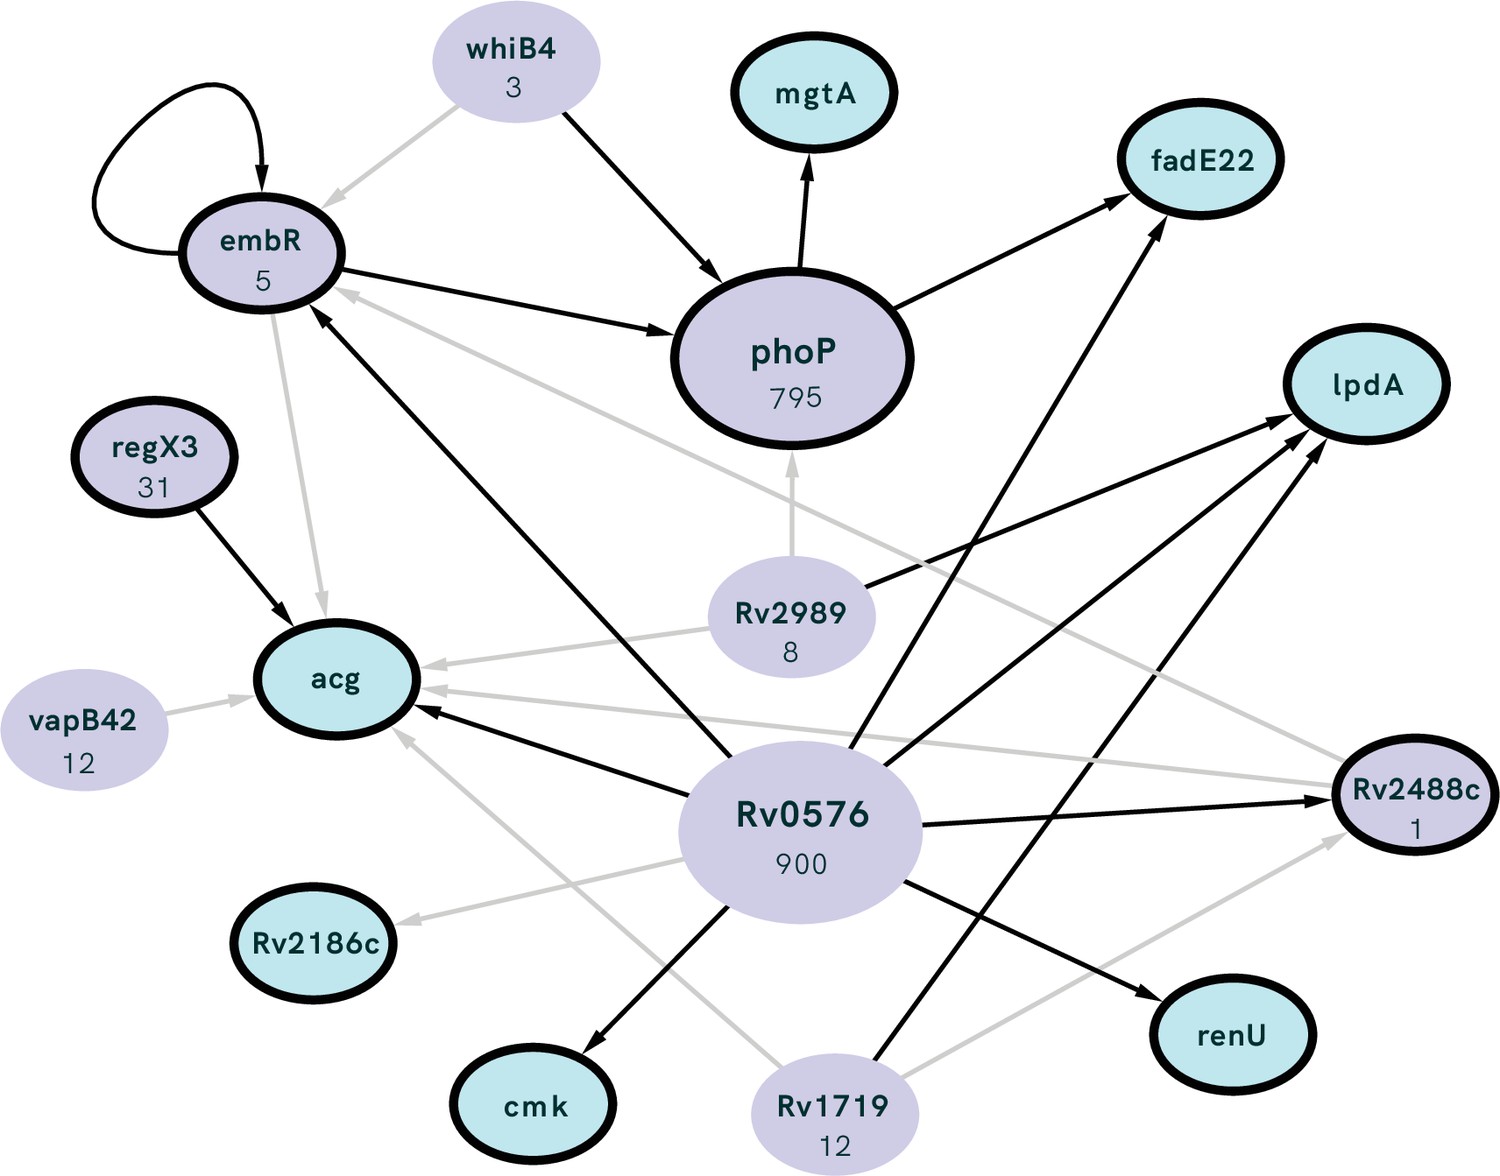
Interconnected regulation of our genes of interest (GOI; outlined in black) by common transcription factors (TFs; purple) with the number of genes regulated by each TF listed under gene name.
TF identified as having significant overlap with our GOI (i.e. the number of GOI regulated by the TF is higher than expected by chance) using the MTB Network Portal (see Methods). Edges between nodes indicate >0.5 log2-fold absolute change in expression in a transcription factor overexpression strain, black lines show statistically significant (p<0.05) differential expression.
Figure 10

Protocol for serial passage of M. tb pellicles.
Additional files
-
Supplementary file 1
Outline of data collection for each strain at each passage point.
- https://cdn.elifesciences.org/articles/78454/elife-78454-supp1-v1.xlsx
-
Supplementary file 2
Variants with a ≥30% frequency change over the course of four planktonic passages.
Grouped by mutations within the same gene and sorted by genes that acquired the most independent SNPs across replicates and strains.
- https://cdn.elifesciences.org/articles/78454/elife-78454-supp2-v1.csv
-
Supplementary file 3
Significantly (Fisher’s-exact, p<0.01) enriched GO terms within the large duplication that arose in L4.9 strains MT31 and MT55.
Of note is enrichment of nucleotide biosynthesis/metabolic processes.
- https://cdn.elifesciences.org/articles/78454/elife-78454-supp3-v1.csv
-
Supplementary file 4
Mutations present in ancestral pairs of strains which went on to develop convergent mutations in response to biofilm growth (MT31/MT55 and MT49/MT540).
‘Ref’ and ‘alt’ refer to the alleles present in the reference strain (H37Rv) and the clinical isolate, respectively. Mutations without an annotation exist in intergenic regions.
- https://cdn.elifesciences.org/articles/78454/elife-78454-supp4-v1.xlsx
-
MDAR checklist
- https://cdn.elifesciences.org/articles/78454/elife-78454-mdarchecklist1-v1.docx
Download links
A two-part list of links to download the article, or parts of the article, in various formats.
Downloads (link to download the article as PDF)
Open citations (links to open the citations from this article in various online reference manager services)
Cite this article (links to download the citations from this article in formats compatible with various reference manager tools)
Rapid adaptation of a complex trait during experimental evolution of Mycobacterium tuberculosis
eLife 11:e78454.
https://doi.org/10.7554/eLife.78454


