Unbiased mosaic variant assessment in sperm: a cohort study to test predictability of transmission
- Rady Children’s Institute for Genomic Medicine, United States
- Department of Neurosciences, University of California, San Diego, United States
- Department of Pediatrics, Section of Clinical Genetics and Metabolism, University of Colorado School of Medicine, United States
- Fertility Specialists Medical Group, United States
Figures
Figure 1 with 1 supplement
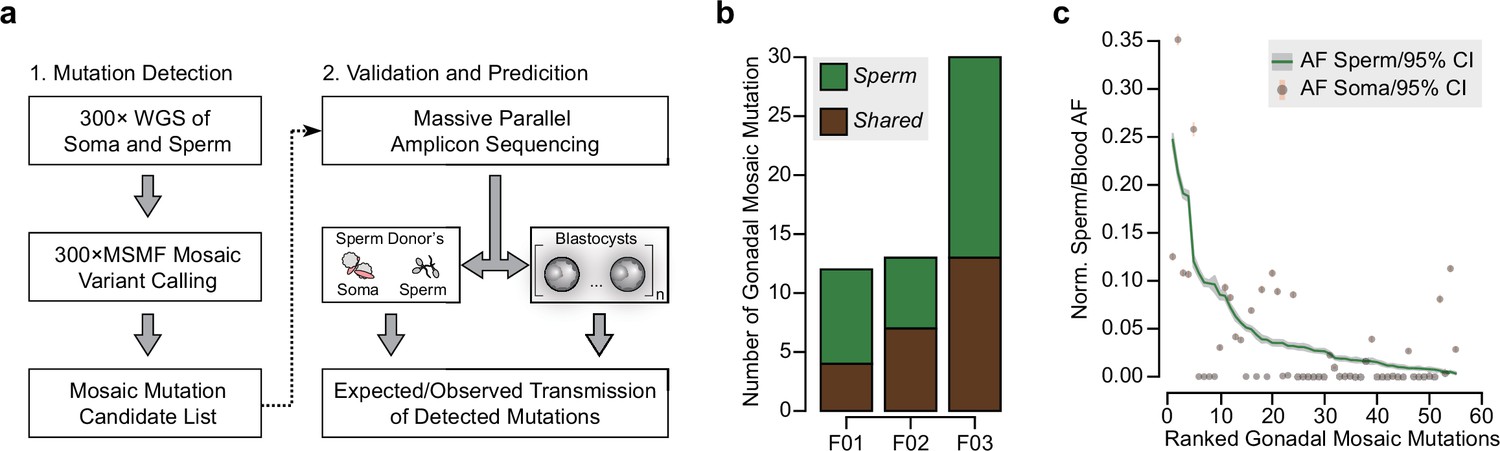
Detection of gonadal mosaicism in three sperm donors.
(a) Overview of the employed workflow from mutation detection to validation and prediction. A single massive parallel amplicon sequencing (MPAS) panel was used for both detections of mutations in parental tissues and in preimplantation blastocysts. WGS: whole-genome sequencing; 300× MSMF: variant calling pipeline on 300× WGS data using MuTect2, Strelka2, and MosaicForecast (Yang et al., 2021). (b) The number of MPAS-validated gonadal mosaic mutations for each sperm donor, distinguished by color into sperm-specific (‘Sperm’, green) and tissue-shared (‘Shared’, brown) mutations. (c) Ranked plot of all gonadal mosaic mutations across the three sperm donors. For each variant, both the allelic fraction (AF; normalized to chromosome count) of the mutation in sperm (green line) and in the soma (brown dot) are shown together with their 95% exact confidence interval. Shared mutations tend to be of higher AF compared to Sperm.
Figure 1—figure supplement 1
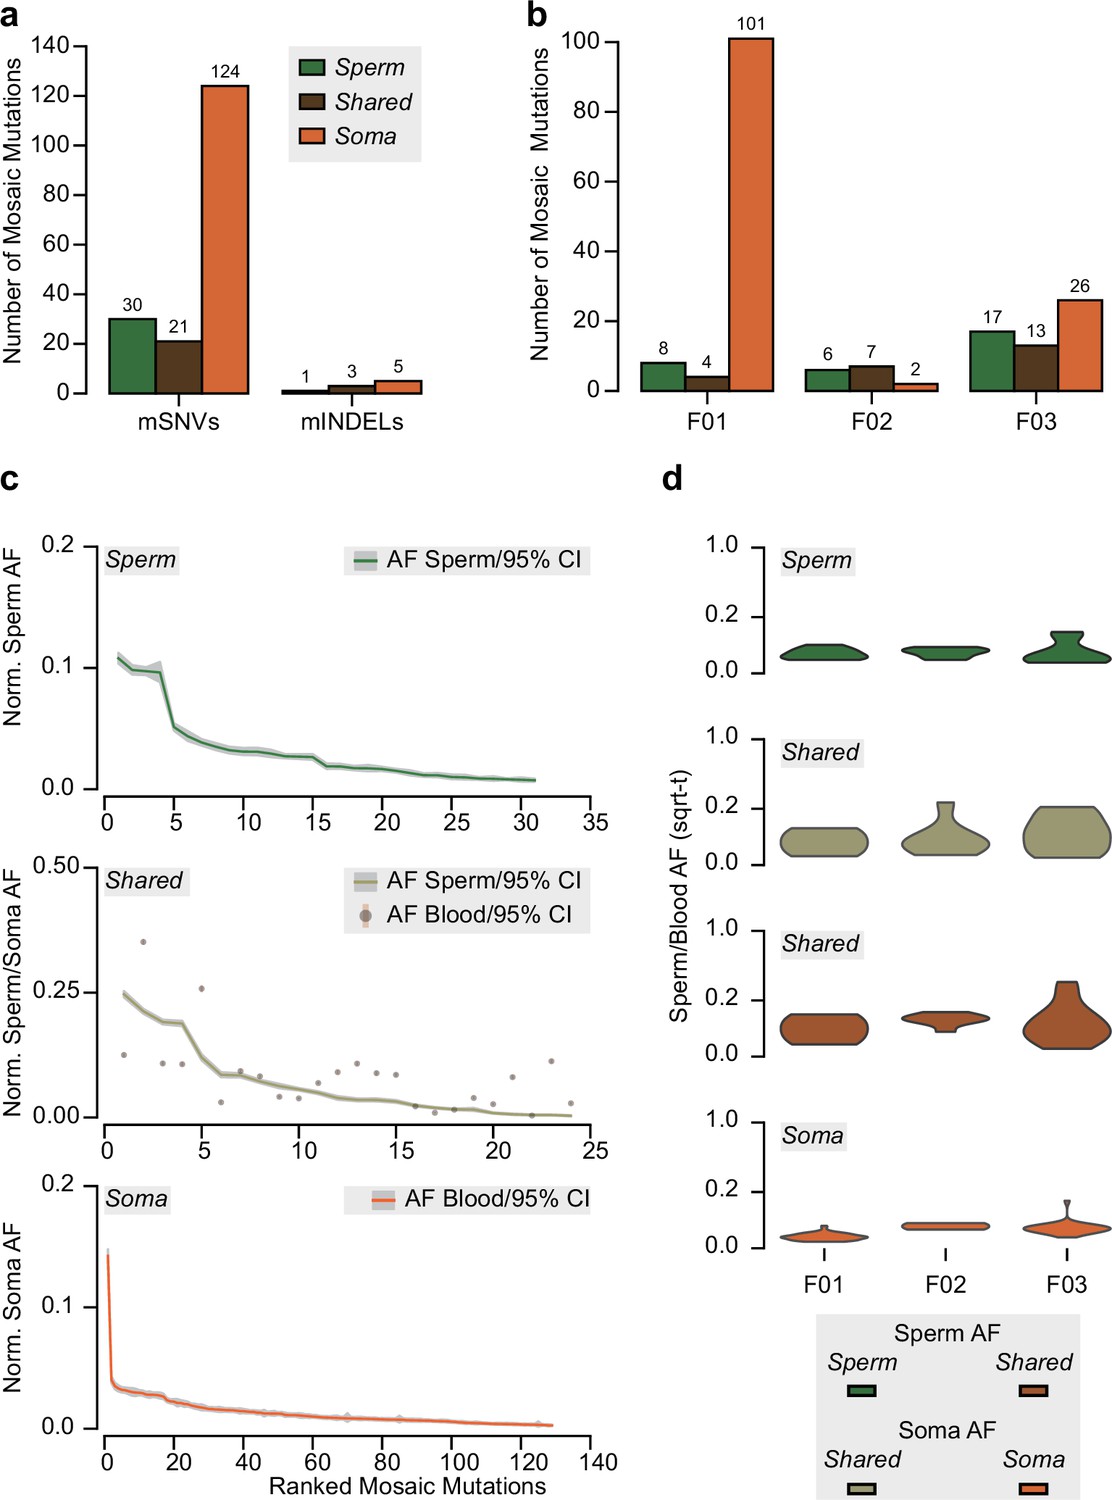
Detection of mosaic mutations in the three sperm donors.
(a) Total number of identified mosaic single-nucleotide mutations (mSNVs) and mosaic small insertions and deletions (mINDELs) across the three sperm donors. Mosaic mutations are divided into those detected only in sperm (‘Sperm’), those detected in both sperm and the somatic tissue (‘Shared’), and those detected only in the somatic tissue (‘Soma’; i.e., blood or saliva). (b) The number of mosaic mutations for each individual for each category. (c) Ranked plots for mosaic mutations across all sperm donors for each category. Shown are the allelic fractions (AFs; normalized to chromosome counts) within the indicated tissue(s) and their 95% exact confidence interval. (d) Distribution of square root-transformed (sqrt-t) AFs for each sperm donor for each category as a violin plot.
Figure 2 with 2 supplements
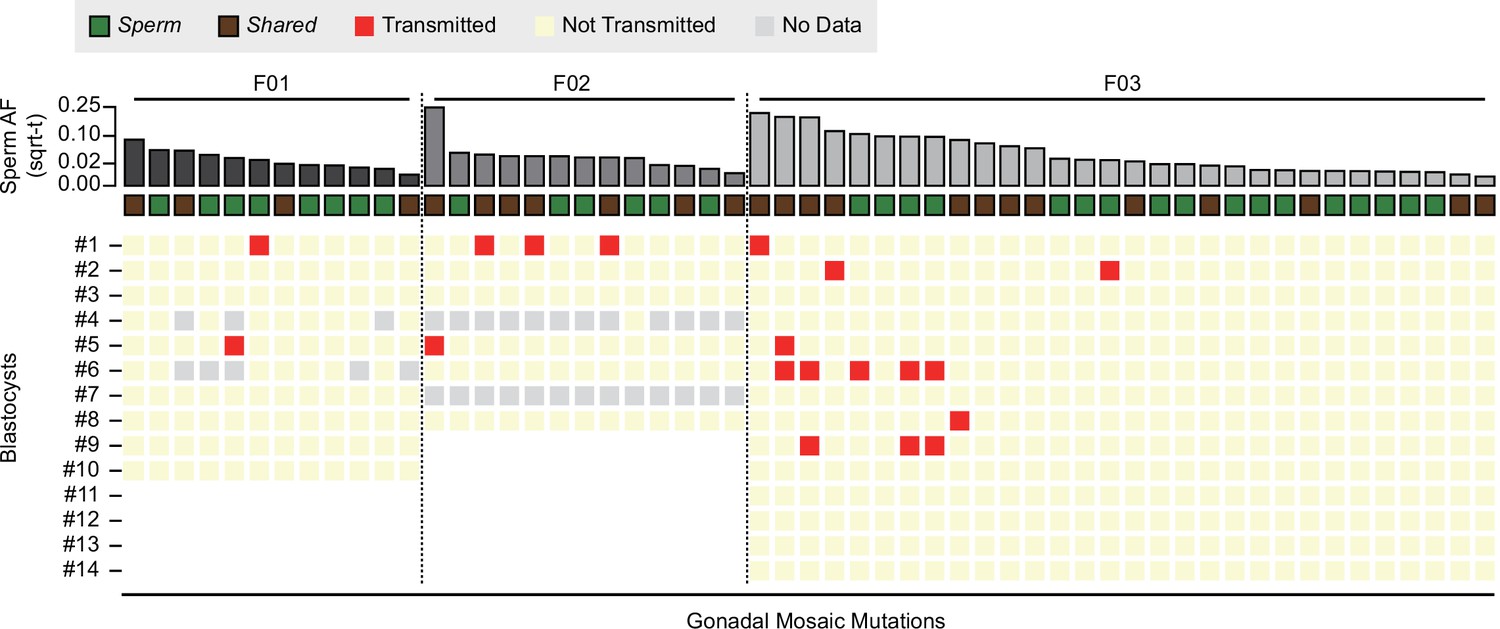
Transmission of gonadal mosaic mutations for each sperm donor.
Mutations are ranked for each sperm donor by allelic fraction (AF) and visualized as square root-transformed (sqrt-t). Shown are the transmission of 12 mutations across 10 blastocysts (F01), of 13 mutations across 6 blastocysts (F02; 2 of 8 blastocysts did not show sufficient read depth across the mosaic mutations), and of 30 mutations across 14 blastocysts. In total, 19 transmissions of 15 unique mutations were observed. As expected, gonadal mosaic mutations of higher AF are more likely to transmit than those of lower AF. No Data: variant blastocyst pairs, for which read depth was below 20×.
Figure 2—figure supplement 1
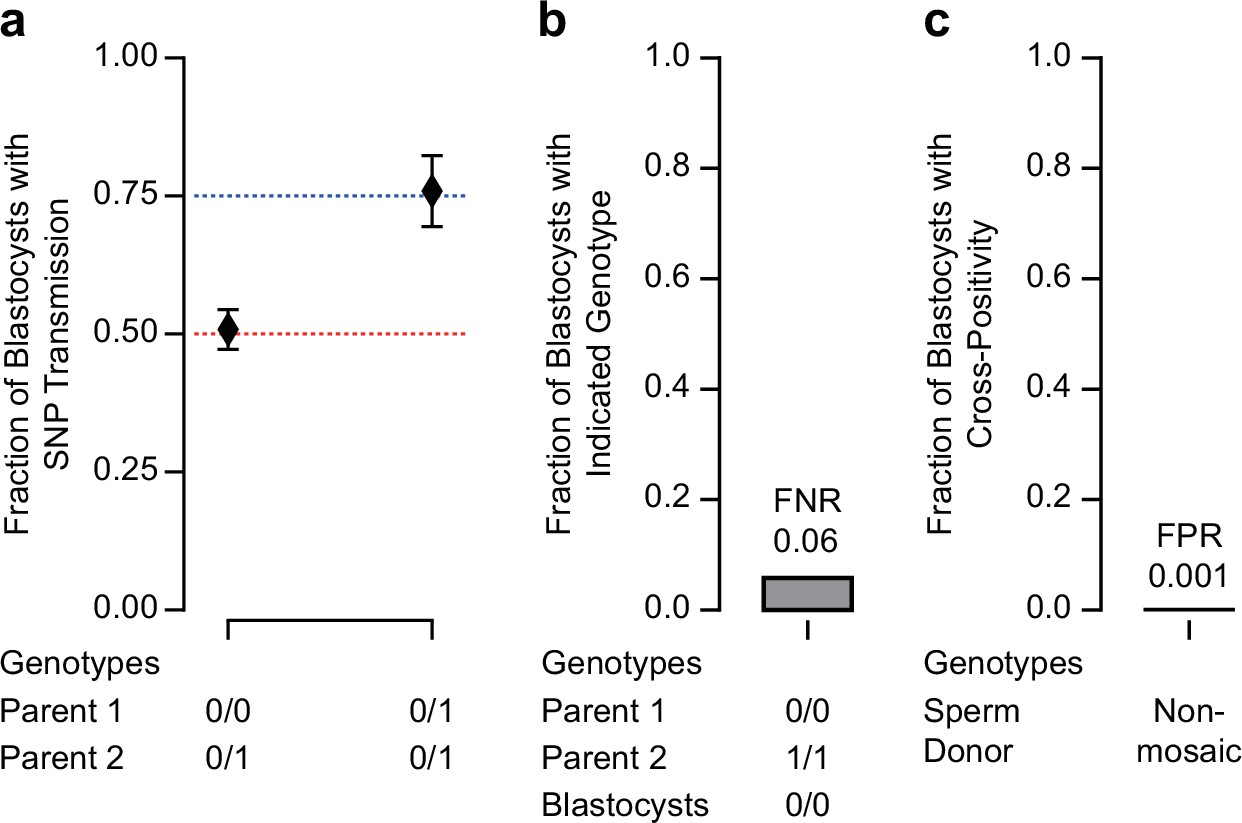
Determination of sensitivity and specificity for mutation detection in blastocysts.
(a) Transmission of heterozygous single-nucleotide polymorphisms (SNPs) detected in at least one parental genome. Parental genotypes are indicated as reference homozygous (0/0) and heterozygous (0/1). The 95% confidence interval of the observed fraction of transmissions overlaps with expectations of 0.5 (parents are heterozygous and reference homozygous, respectively) and 0.75 (parents are both heterozygous). 0/0 and 0/1: n = 374 transmitted of 736 total; 0/1 and 0/1: n = 129 transmitted of 170 total. As egg donor information was missing in F03, this analysis is restricted to F01 and F02. (b) Fraction of blastocysts that were determined to be negative when one of the parental genotypes is homozygous for an SNP (1/1). As a homozygous parent is expected to transmit the SNP to each blastocyst this allows us to determine the false-negative rate (FNR = 0.058). 0/0 and 1/1: n = 81 transmitted of 86 total. As egg donor information was missing in F03, this analysis is restricted to F01 and F02. (c) Fraction of blastocysts that were determined to be positive when the mosaic mutation was identified in one of the unrelated sperm donors. These transmissions are unexpected and can only be explained by a technical artifact, allowing us to determine the false-positive rate (FPR = 0.001). Nonmosaic: n = 1 ‘transmitted’ of 985 total.
Figure 2—figure supplement 2
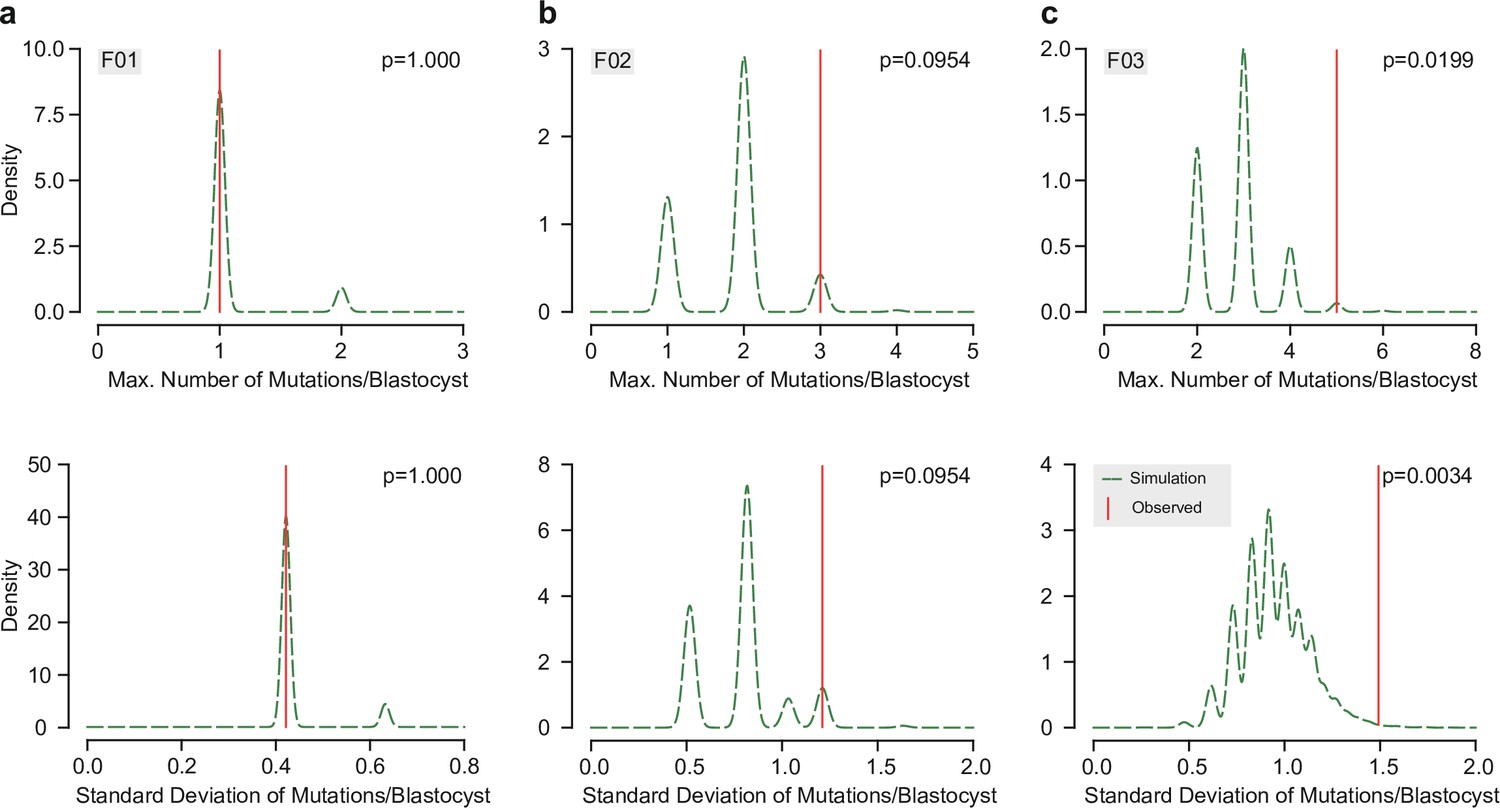
Evenness analysis of the distribution of transmitted mutations across blastocysts.
Permutation analysis for the observed number of transmitted mutations across blastocyst for F01 (a), F02 (b), and F03 (c), respectively. Underlying data points are either the maximum observed number of mutations within one blastocyst (top, Max. Number of Mutations/Blastocyst) or the standard deviation of the observed number of mutations across all blastocysts (bottom, Standard Deviation of Mutations/Blastocyst) (n = 10,000 permutations). Graphs show the density distribution of all permutations (green dashed line) and the corresponding observed value (vertical red line). Note that in F03, both the observed maximum number of transmitted mutations within one blastocyst and the standard deviation of observed transmissions across all blastocysts were significantly different from the random permutations (p < 0.05).
Figure 3 with 2 supplements
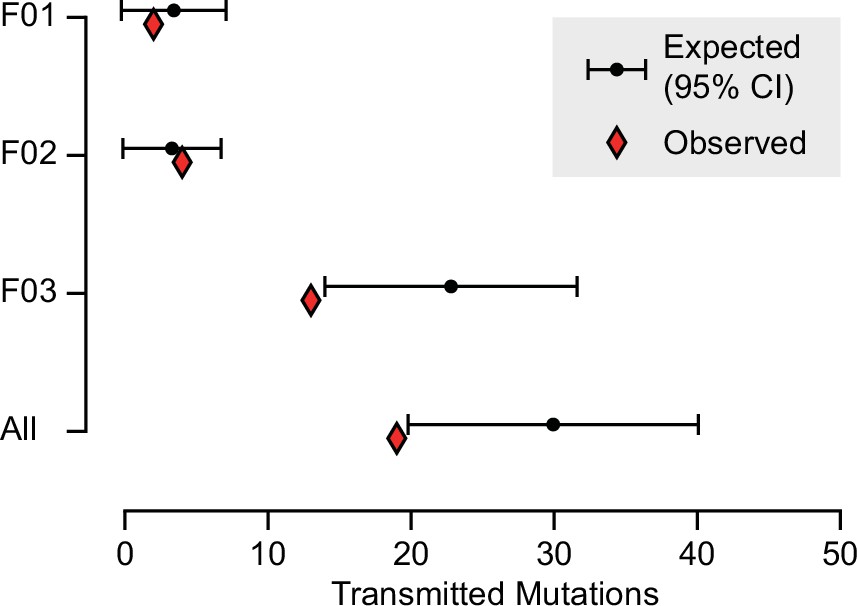
Expected and observed transmission of gonadal mosaic mutations to preimplantation blastocysts.
The expected number of transmissions—based on the allelic fraction (AF) of all detected mutations in sperm and the number of analyzed blastocysts—is indicated with the mean and a 95% confidence interval for each sperm donor and across all sperm donors. Whereas F01 and F02 transmitted as expected, F03 showed a slight undertransmission, likely related to the nonindependence of mutations due to shared lineage.
Figure 3—figure supplement 1
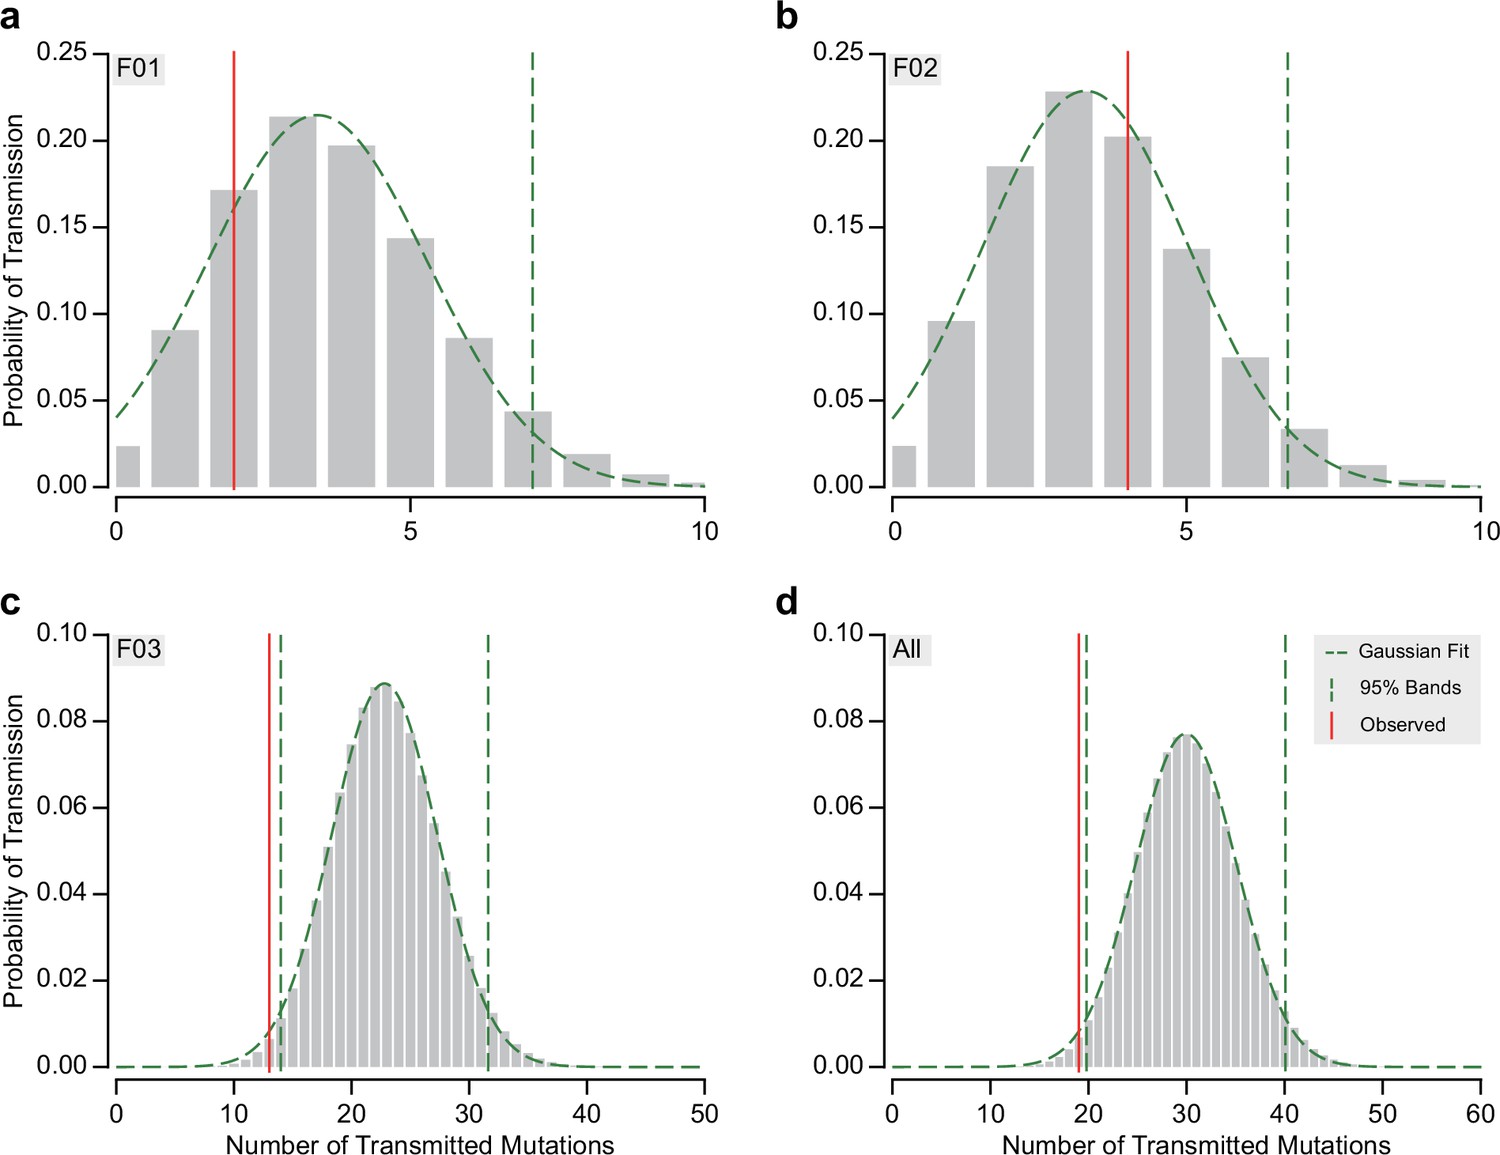
Detailed analysis of expected and observed transmission of gonadal mosaic mutations to preimplantation blastocysts.
(a–d) Probability of the number of expected transmission events (gray bars), a Gaussian fit (green dashed line tracing the bars), the 95% confidence intervals if not 0 (vertical green dashed lines), and the observed number of transmission (vertical red line). This is shown for each sperm donor and blastocysts group (F01, F02, and F03 in a, b, and c, respectively) and across all (d). The mean and standard deviation determined from the Gaussian fit were used to generate data shown in Figure 3.
Figure 3—figure supplement 2
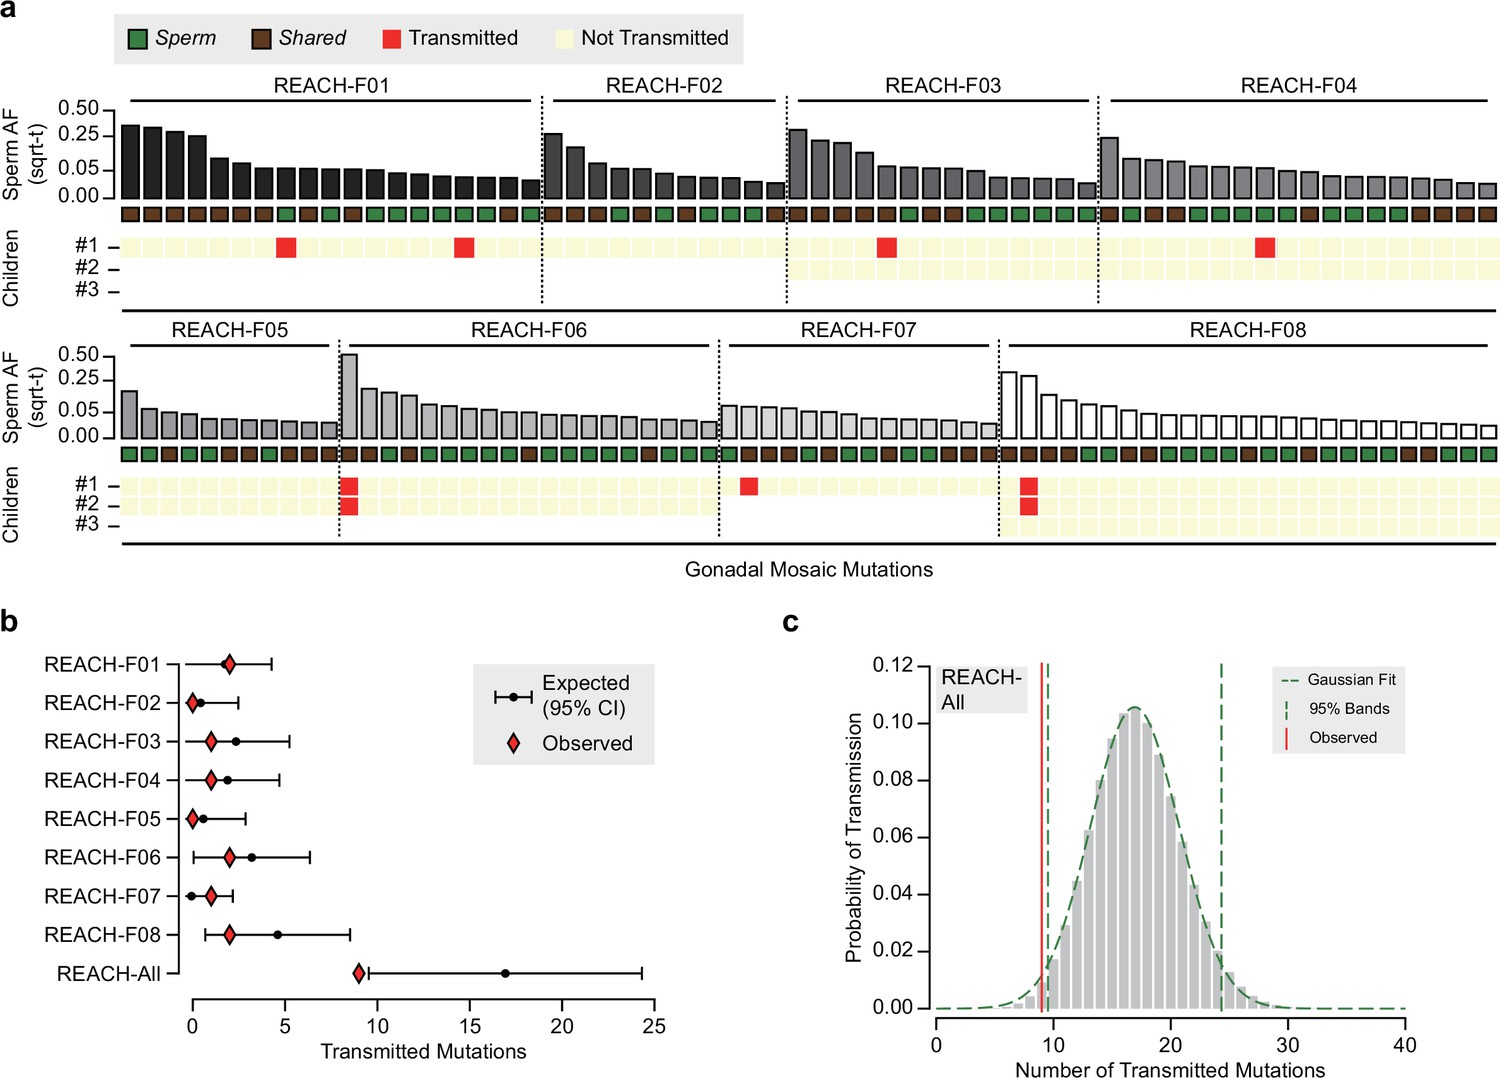
Transmission of gonadal mosaicism in eight previously described families.
(a) Transmission of gonadal mosaic mutations for each of eight fathers whose gonadal mosaicism was previously described (Breuss et al., 2020; Yang et al., 2021). Each family had one to three offspring for whom variants were called from standard whole-genome sequencing (Brandler et al., 2016). Mutations are ranked for each father by allelic fraction (AF) and visualized as square root-transformed (sqrt-t). Shown are the transmission of 19 mutations to 1 child (REACH-F01), of 11 mutations to 1 child (REACH-F02), 14 mutations across 2 children (REACH-F03), 18 mutations across 2 children (REACH-F04), 11 mutations across 2 children (REACH-F05), 19 mutations across 2 children (REACH-F06), 14 mutations to 1 child (REACH-F07), and of 25 mutations across 3 children (REACH-F08). In total, 9 transmissions of 7 unique mutations were observed. (b) Expected number of transmissions—based on the AF of all detected mutations in sperm and the number of analyzed children—is indicated with the mean and a 95% confidence interval for each father and across all fathers. Whereas, individually, each father transmitted within expectations, collectively, all fathers exhibited a slight undertransmission, comparable to what was found for blastocysts and F01–F03. (c) Probability of the number of expected transmission events across all fathers, visualized as in Figure 3—figure supplement 1. The mean and standard deviation determined from the Gaussian fit were used to generate data shown in b.
Additional files
-
Supplementary file 1
Processed data and sequencing depth information tables.
Provided as a separate file; legend contained within.
- https://cdn.elifesciences.org/articles/78459/elife-78459-supp1-v1.xlsx
-
Transparent reporting form
- https://cdn.elifesciences.org/articles/78459/elife-78459-transrepform1-v1.pdf
Download links
A two-part list of links to download the article, or parts of the article, in various formats.
Downloads (link to download the article as PDF)
Open citations (links to open the citations from this article in various online reference manager services)
Cite this article (links to download the citations from this article in formats compatible with various reference manager tools)
Unbiased mosaic variant assessment in sperm: a cohort study to test predictability of transmission
eLife 11:e78459.
https://doi.org/10.7554/eLife.78459


