Derivation and external validation of clinical prediction rules identifying children at risk of linear growth faltering
- Division of Infectious Diseases, University of Utah School of Medicine, United States
- Division of Epidemiology, University of Utah School of Medicine, United States
- Department of Global Health, Global Center for Integrated Health of Women, Adolescents and Children (Global WACh), University of Washington, United States
- International Centre for Diarrhoeal Disease Research, Bangladesh
- Department of Emergency Medicine, Warren Alpert Medical School of Brown University, United States
- Department of Pediatrics and Environmental and Global Health, Emerging Pathogens Institute, University of Florida, United States
- Division of Infectious Diseases and International Health, University of Virginia, United States
- Department of Pediatrics, Center for Vaccine Development, University of Maryland School of Medicine, United States
- Division of Microbiology & Immunology, University of Utah School of Medicine, United States
Figures
Figure 1

Flow diagram of study inclusion.
Figure 2 with 1 supplement
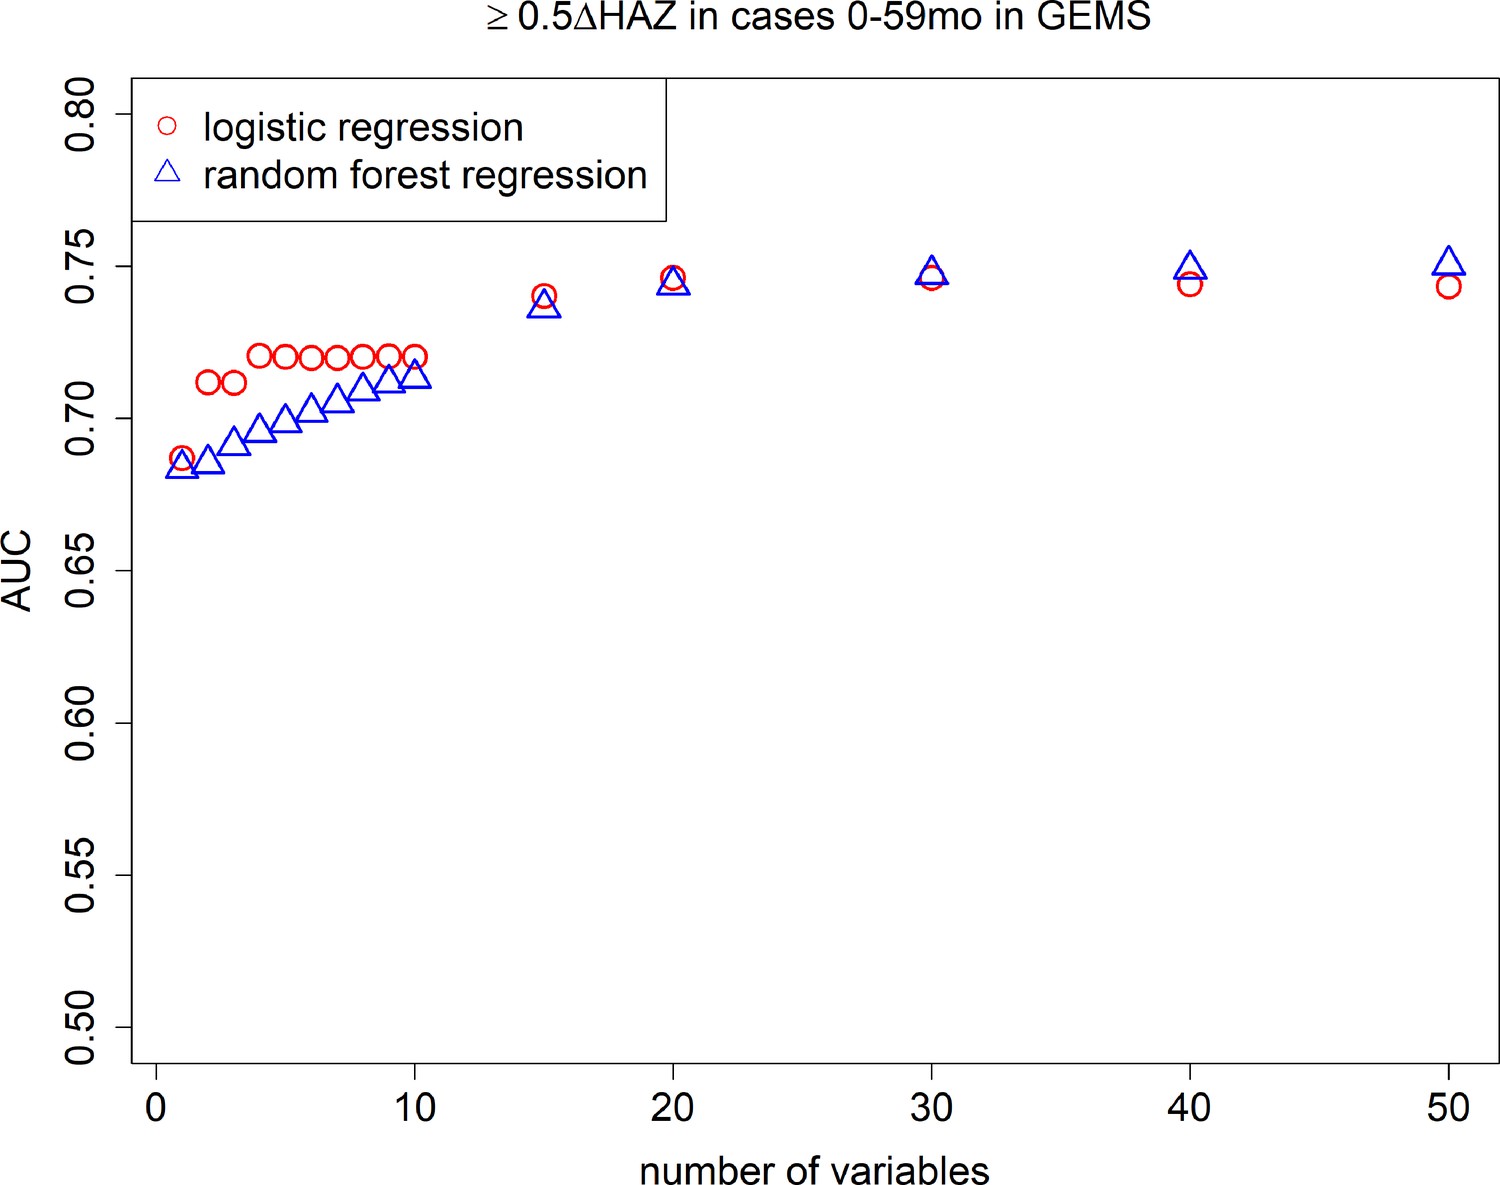
Area under the curves (AUCs).
Cross-validated AUC achieved by number of predictive variables included in random forest regression and logistic regression models predicting growth faltering (≥0.5 decrease in height-for-age z-score [HAZ]) in children 0–59 months of age presenting with diarrhea in the Global Enteric Multicenter Study (GEMS).
Figure 2—figure supplement 1
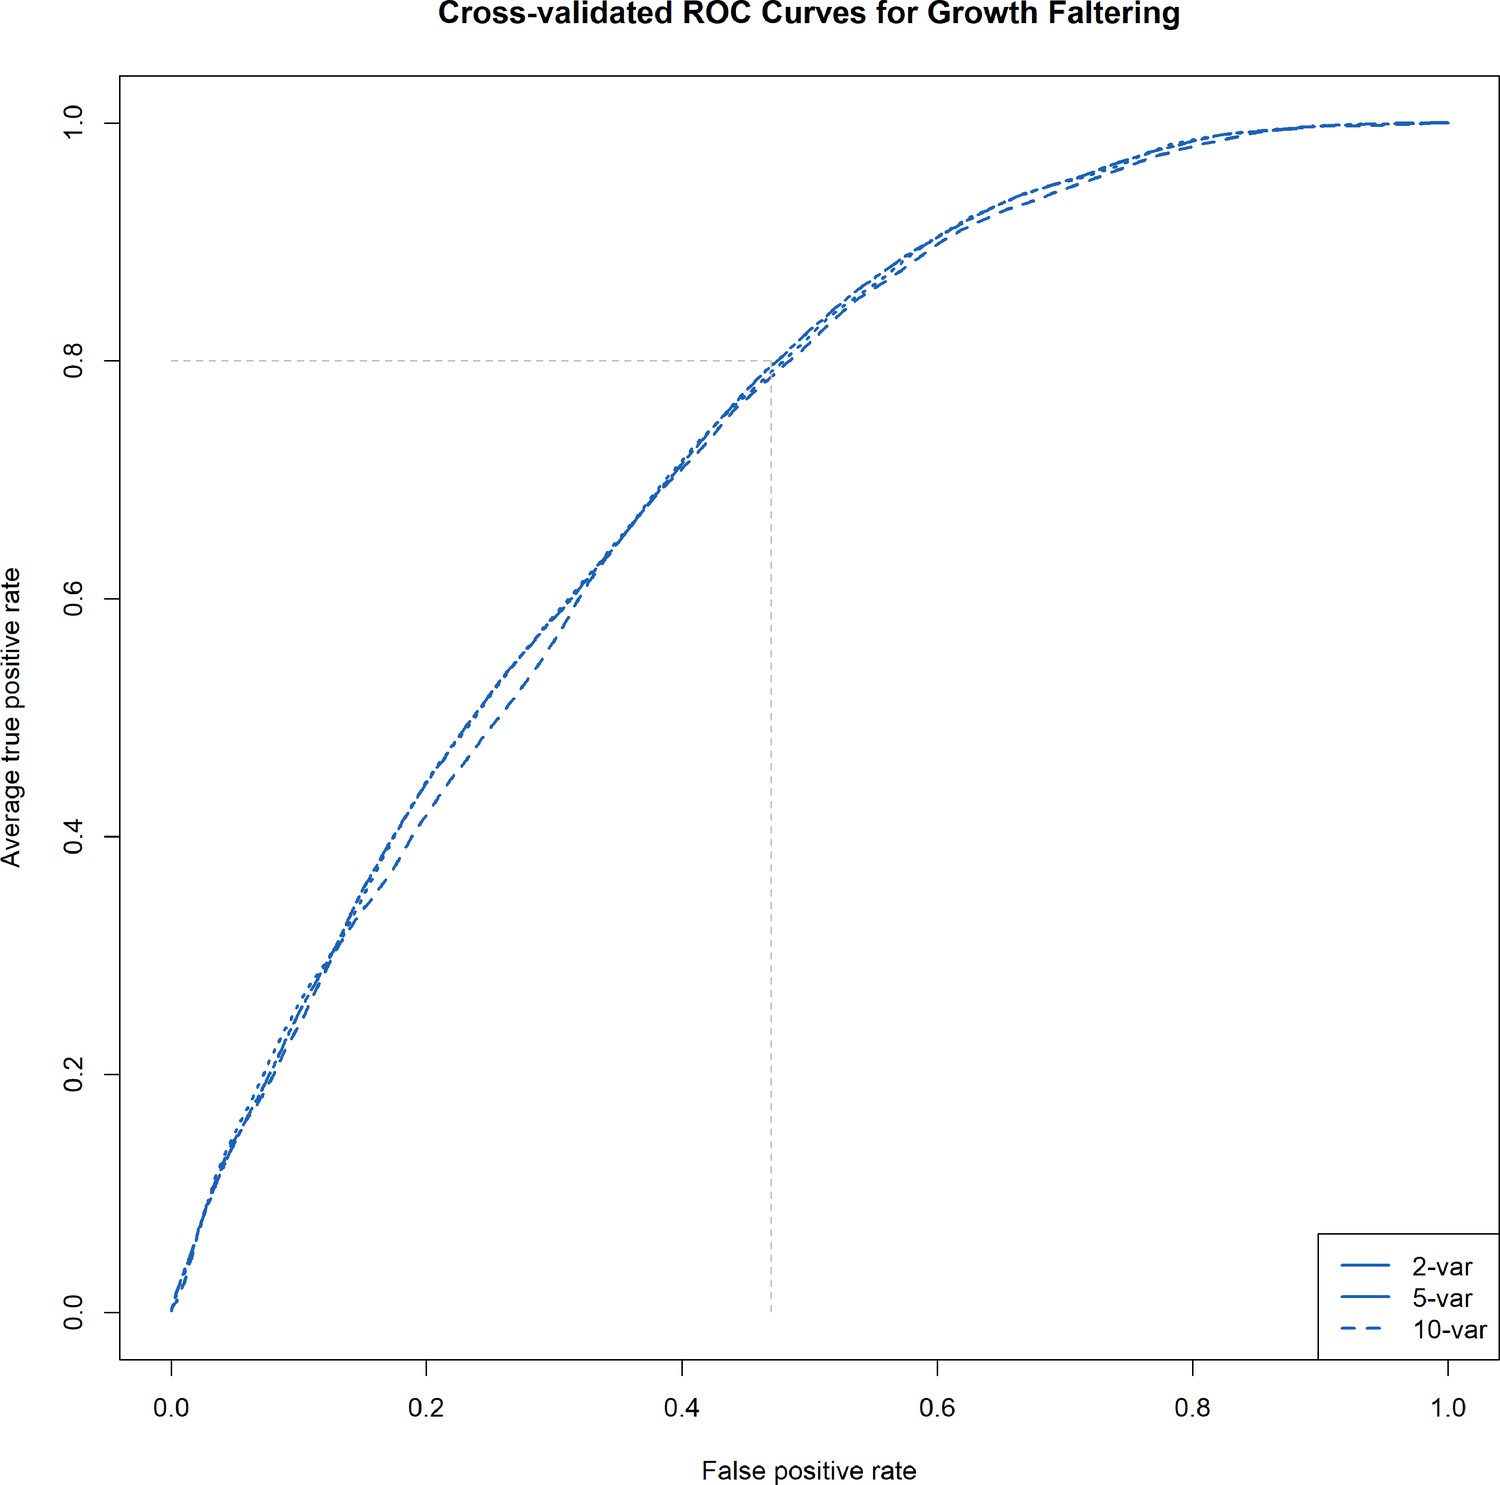
Receiver operating characteristic (ROC) curves: average ROC curves from the cross-validated logistic regression models predicting growth faltering with 2, 5, and 10 predictors.
The faded dashed lines represent specificity (1 − false positive rate) achievable with a sensitivity (true positive rate) of 0.80 for prediction of the outcome.
Figure 3 with 5 supplements
2-Variable clinical prediction rule (CPR) for growth faltering: calibration curve and discriminative ability of 2-varaible (age, height-for-age z-score [HAZ] at enrollment) model predicting growth faltering (≥0.5 decrease in HAZ) in children presenting for acute diarrhea in LMICs.
Figure 3—figure supplement 1
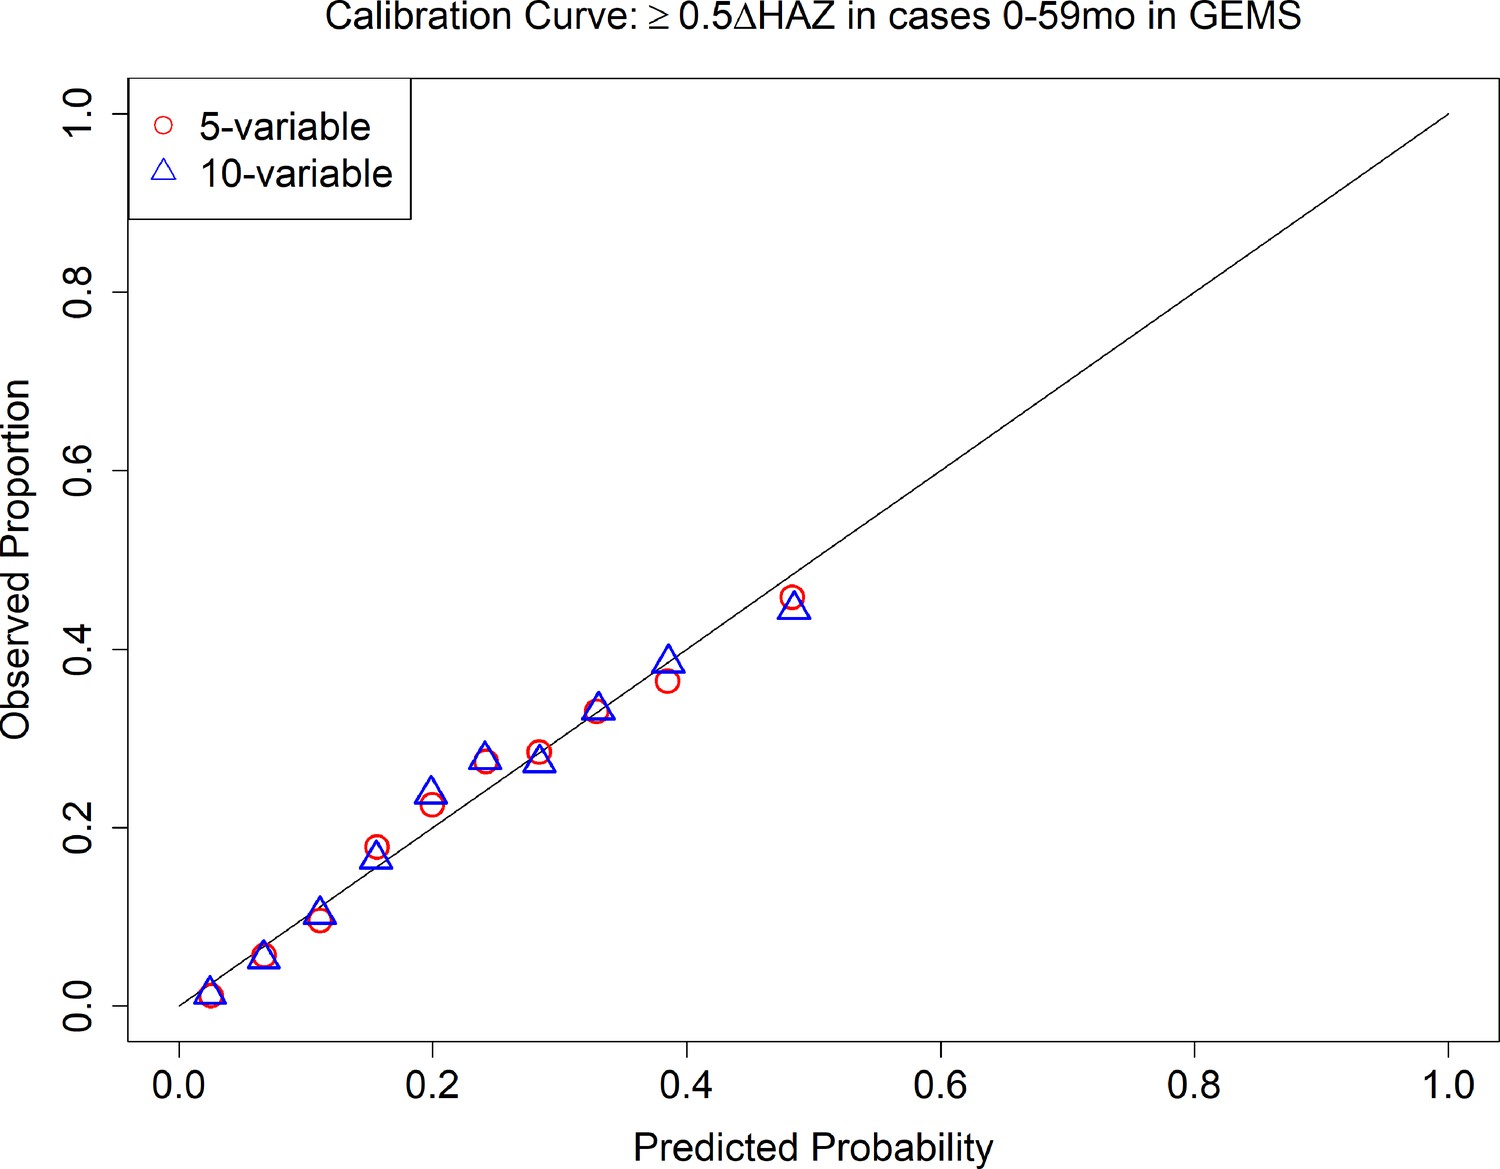
Calibration curve of 5- and 10-variable model predicting growth faltering (≥0.5 decrease in height-for-age z-score [HAZ]) in children 0–59 months of age presenting for acute diarrhea in the Global Enteric Multicenter Study (GEMS).
Figure 3—figure supplement 2
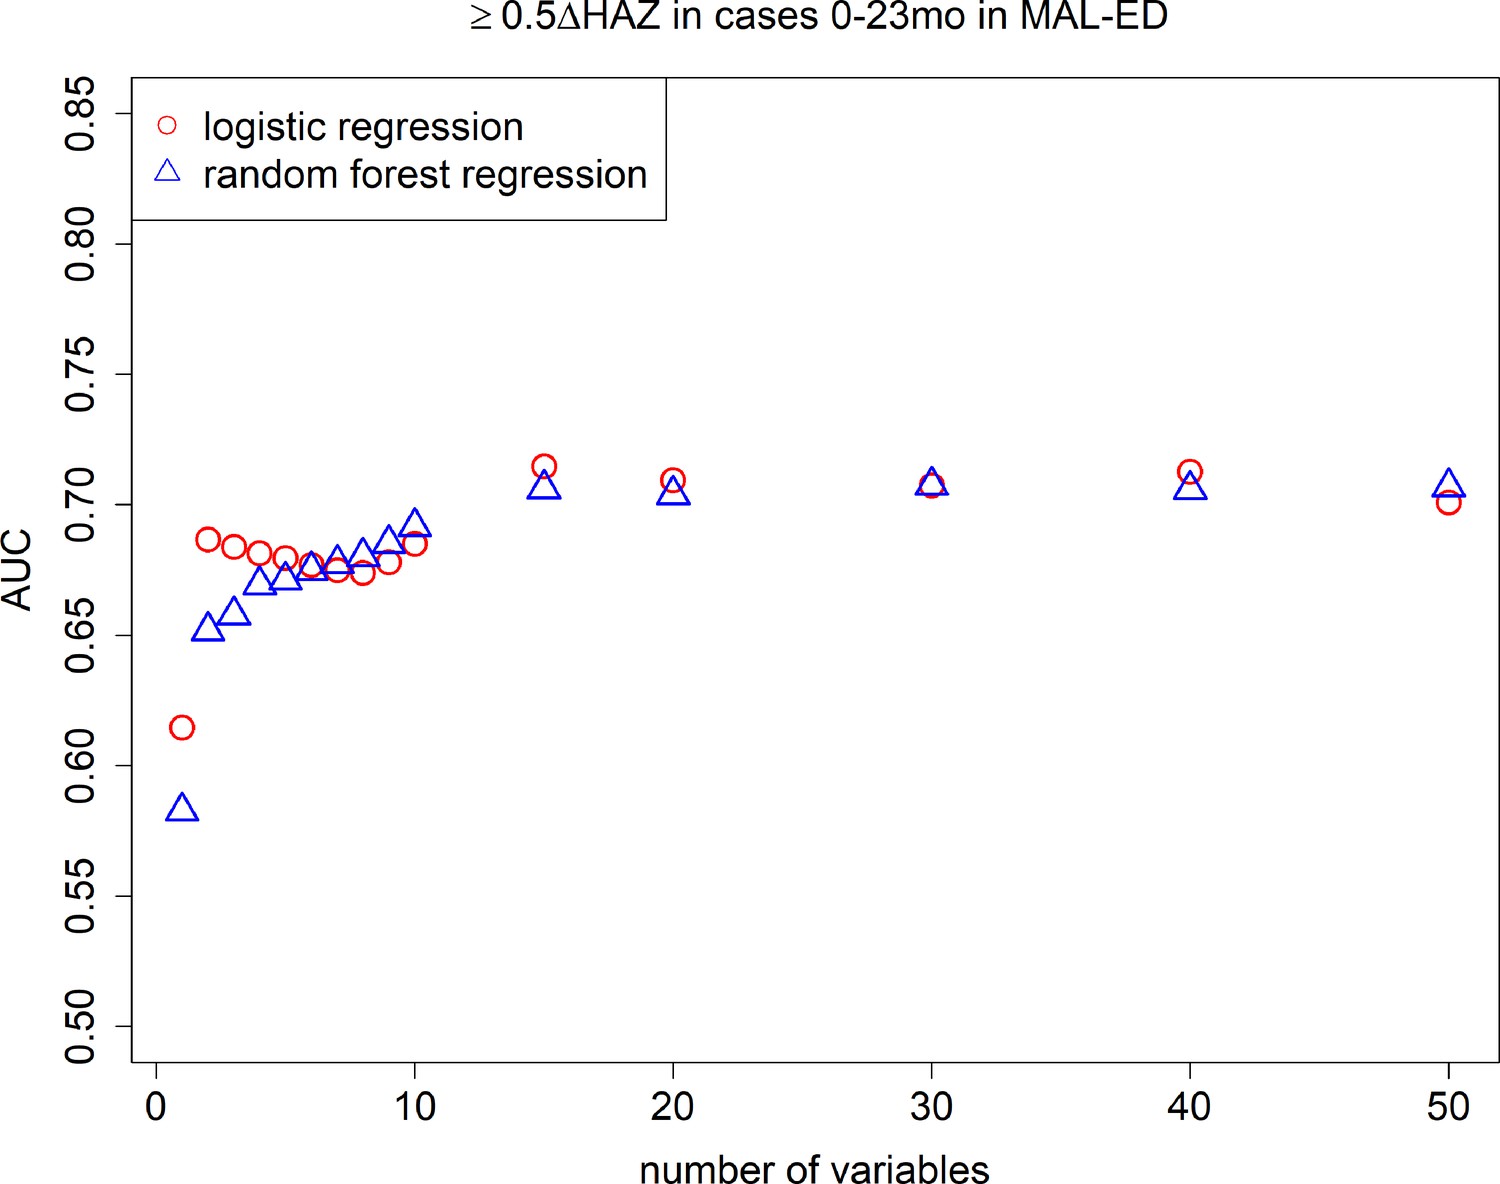
Area under the curves (AUCs): cross-validated AUC achieved by number of predictive variables included in random forest regression and logistic regression models predicting growth faltering (≥0.5 decrease in height-for-age z-score [HAZ]) in children 0–23 months of age presenting with diarrhea in the MAL-ED (the Etiology, Risk Factors, and Interactions of Enteric Infections and Malnutrition and the Consequences for Child Health and Development) study.
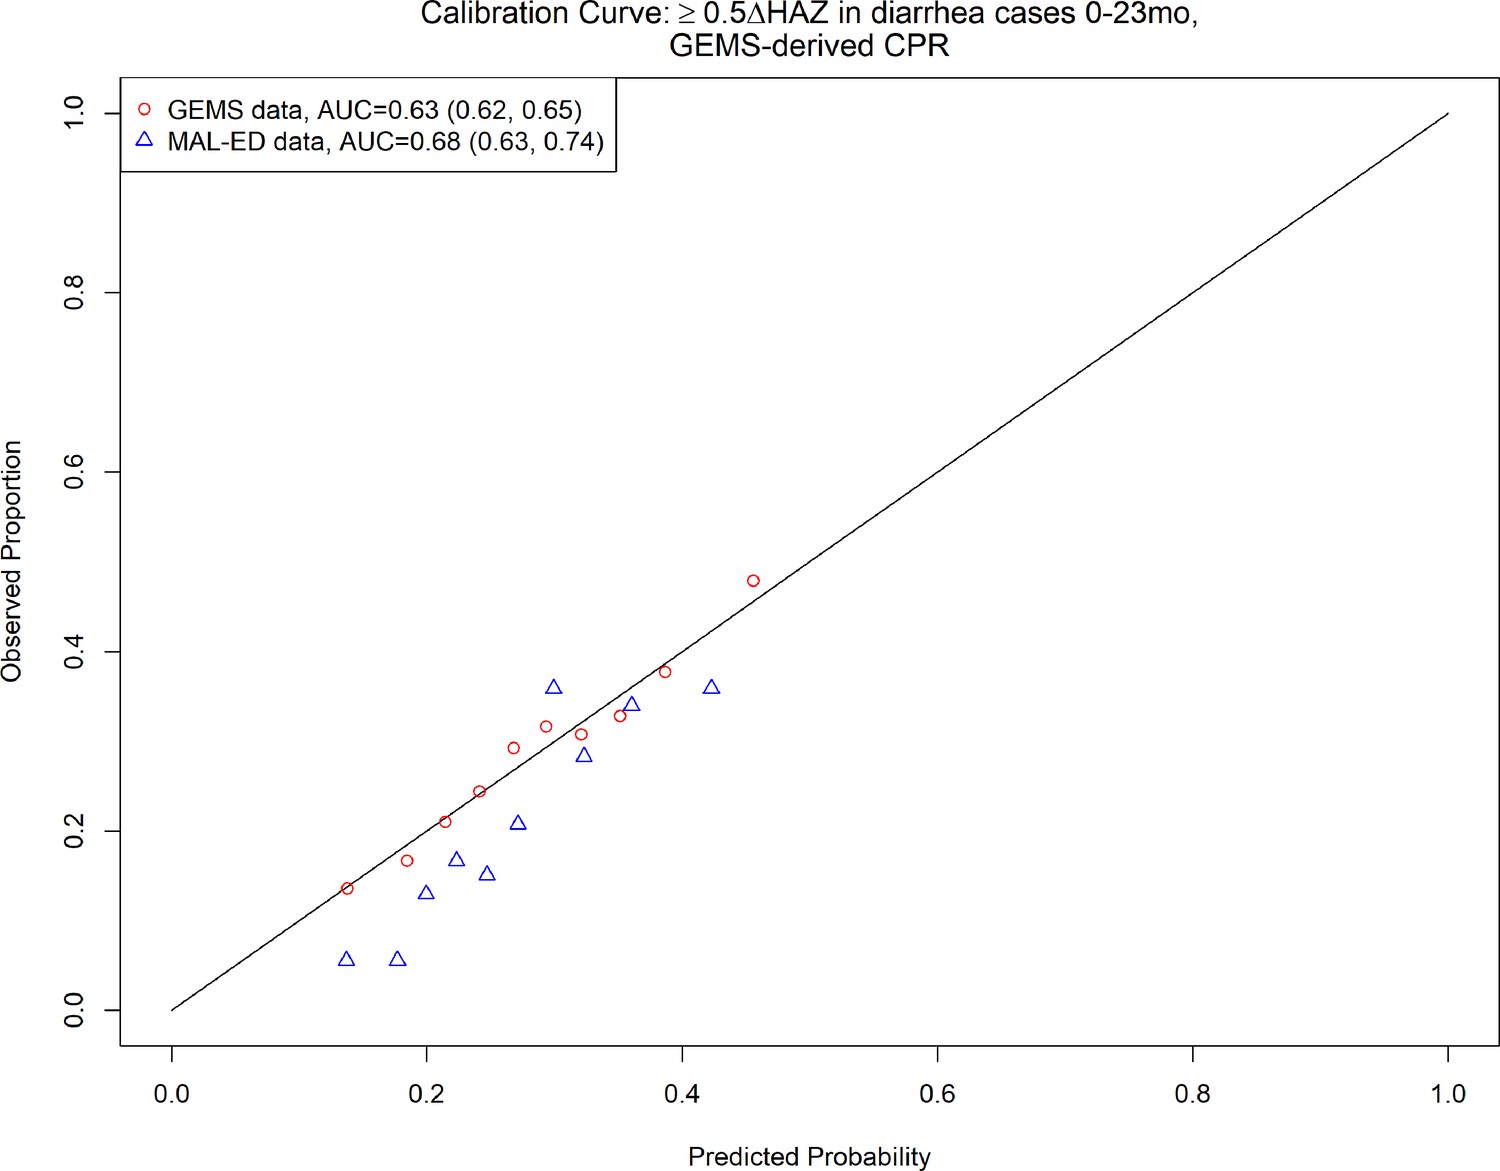
Figure 3—figure supplement 3
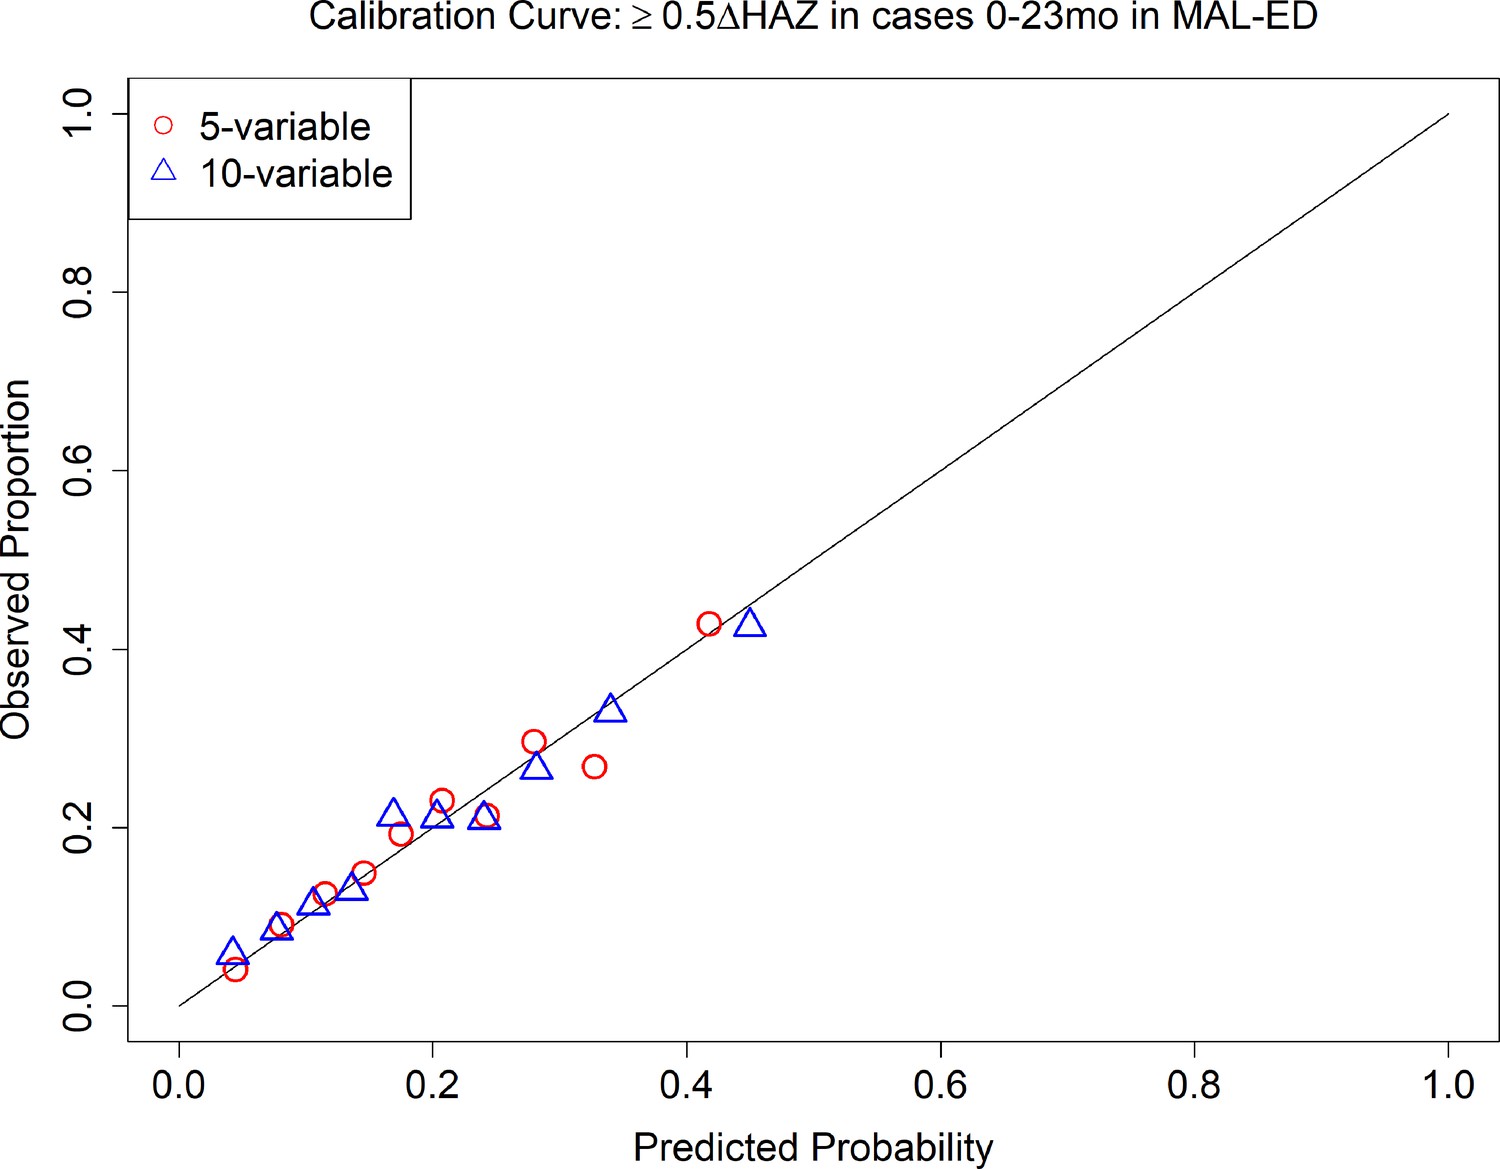
Calibration curves of 5- and 10-variable model predicting growth faltering (≥0.5 decrease in height-for-age z-score [HAZ]) in children 0–23 months of age presenting for acute diarrhea in the MAL-ED (the Etiology, Risk Factors, and Interactions of Enteric Infections and Malnutrition and the Consequences for Child Health and Development) study.
Figure 3—figure supplement 4
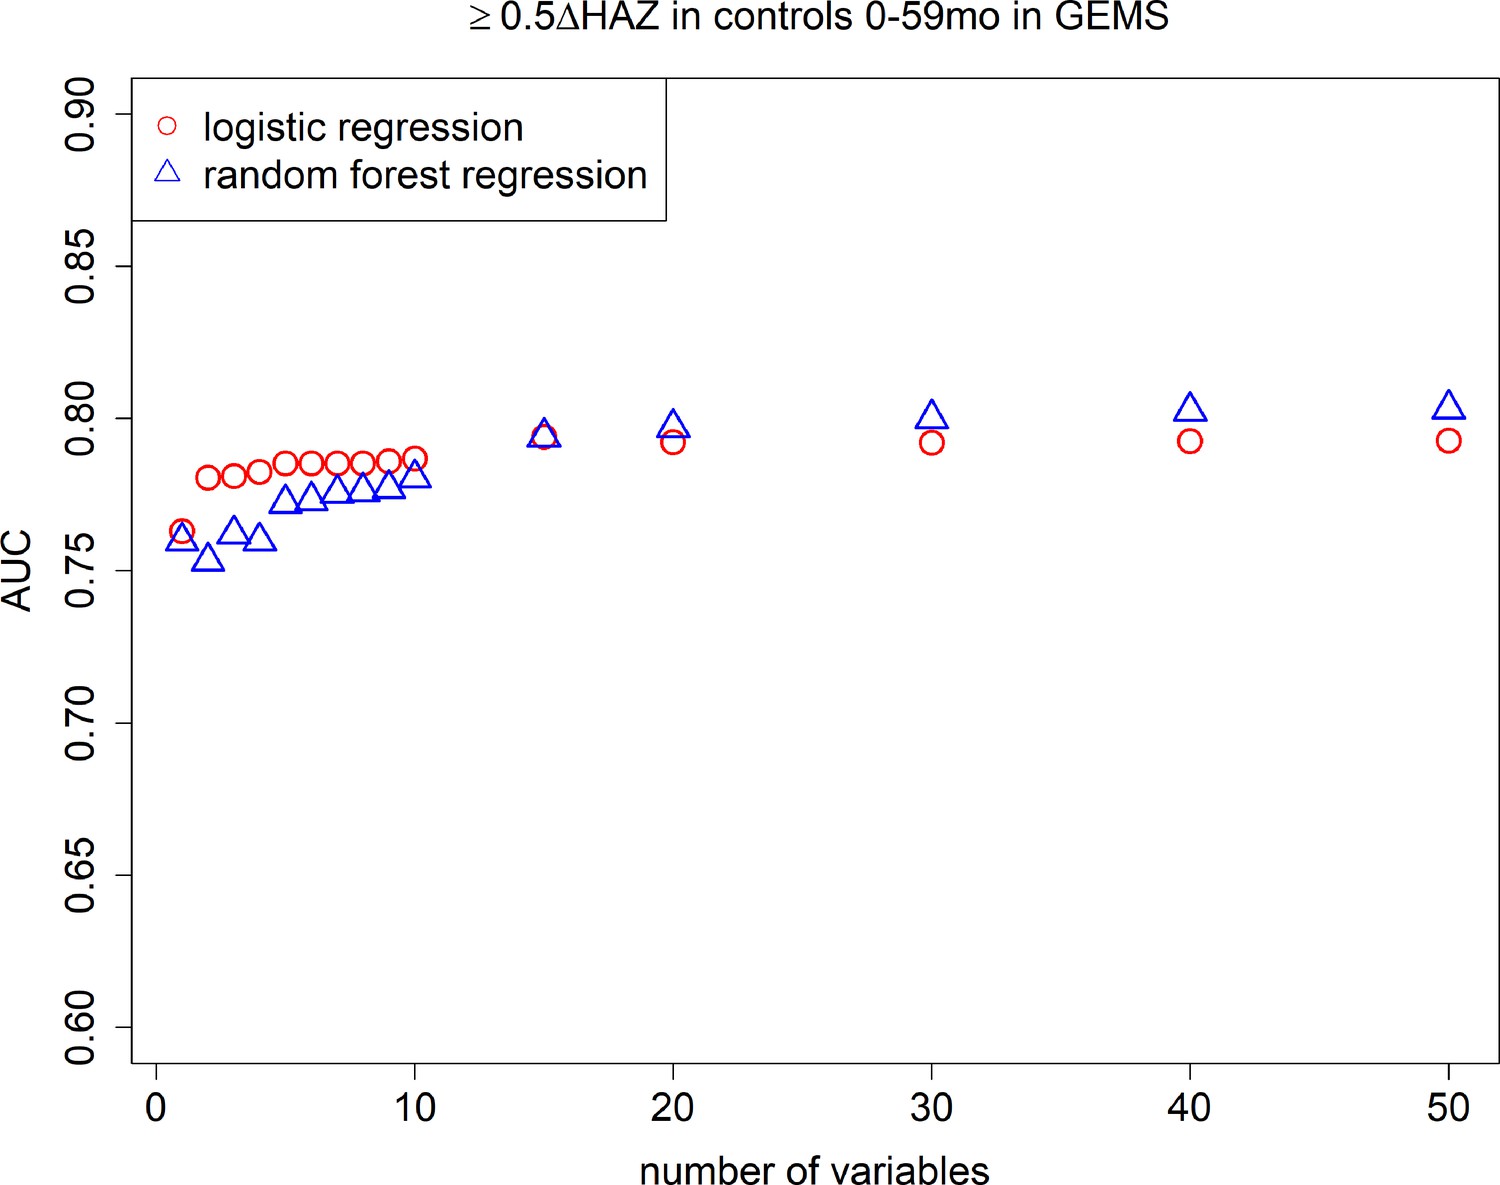
Area under the curves (AUCs): cross-validated AUC achieved by number of predictive variables included in random forest regression and logistic regression models predicting growth faltering (≥0.5 decrease in height-for-age z-score [HAZ]) in children 0–59 months of age without diarrhea in the Global Enteric Multicenter Study (GEMS).
Figure 3—figure supplement 5
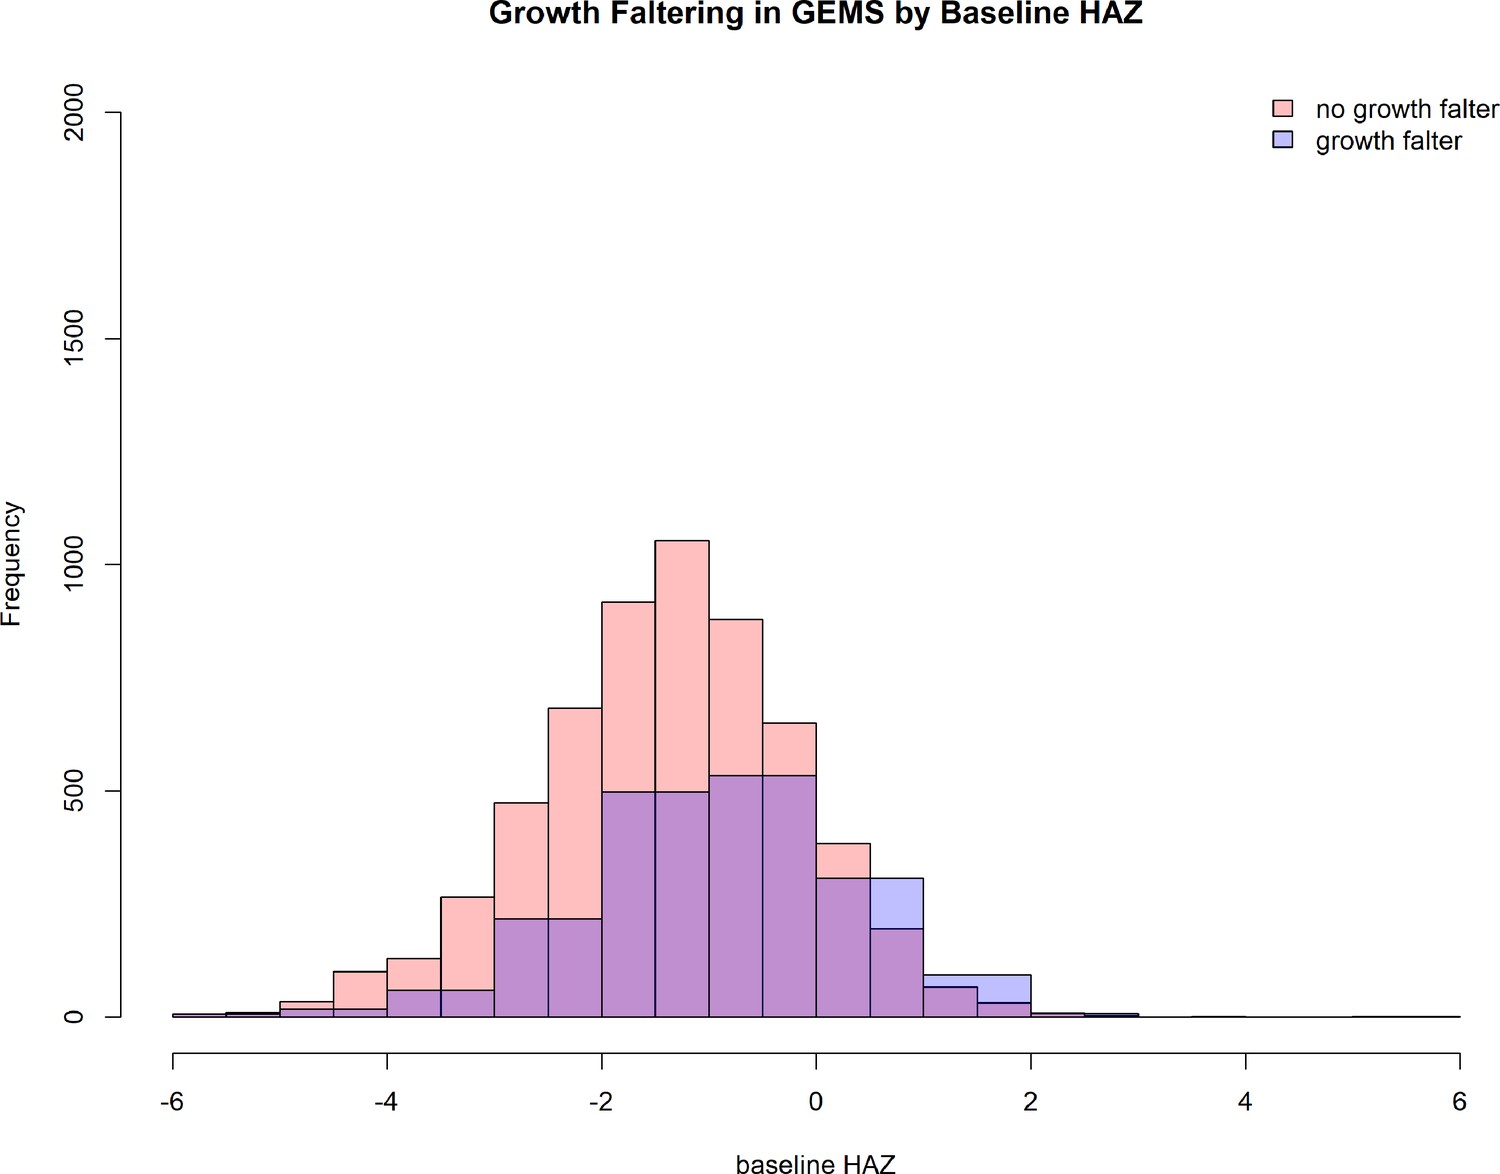
Histogram comparing baseline height-for-age z-score (HAZ) between children who did and did not experience growth faltering (≥0.5 decrease in HAZ) in Global Enteric Multicenter Study (GEMS) data.
Tables
Table 1
Growth faltering.
Variable importance ordering and cross-validated average overall area under the curve (AUC) and AUC by patient subset and 95% confidence intervals for a 5 (bold) and 10 (italicized) variable logistic regression model for predicting growth faltering in children in 7 LMICs(Low- and middle-income countries) derived from Global Enteric Multicenter Study (GEMS) data (≥0.5 decrease in height-for-age z-score [HAZ] in children with acute diarrhea).
| GEMS | MAL-ED | |||||
|---|---|---|---|---|---|---|
| Patient subset | 0–59 months (main text model) | 0–59 months (limit to only those NOT stunted at beginning (HAZ ≥−2) 5659/7639 (74.1%)) | 0–59 months limited to only those NOT stunted at beginning outcome is ANY stunting at follow-up (HAZ <−2) | 0–23 months (for external validation) | Healthy controls | 0–23 months |
| AUCs | 0.72 (0.72, 0.72) | 0.71 (0.70, 0.72) | 0.90 (0.89, 0.91) | 0.64 (0.63, 0.65) | 0.79 (0.78, 0.79) | 0.67 (0.67, 0.68) |
| 0.72 (0.72, 0.72) | 0.71 (0.70, 0.72) | 0.90 (0.89, 0.90) | 0.64 (0.64, 0.64) | 0.79 (0.79, 0.79) | 0.68 (0.67, 0.69) | |
| 1 | Age (months) | Age (months) | HAZ | HAZ | Age (months) | HAZ |
| 2 | HAZ | HAZ | Age | Age (months) | HAZ | Age (days) |
| 3 | Respiratory rate | Respiratory rate | Respiratory rate | Temperature | Respiratory rate | Total days breastfeeding |
| 4 | Temperature | Temperature | Temperature | Respiratory rate | Temperature | Total days in all diarrheal episodes to date |
| 5 | Num. people living in household | Num. people living in household | Num. people living in household | Num. people living in household | Num. people living in household | Mean number of people per room |
| 6 | Num. rooms used for sleeping | Num. rooms used for sleeping | Num. days of diarrhea at presentation | Num. rooms used for sleeping | Breastfed | Days with diarrhea so far in this episode |
| 7 | Num. days of diarrhea at presentation | Num. days of diarrhea at presentation | Num. other households that share same fecal waste facility | Num. days of diarrhea at presentation | Num. rooms used for sleeping | Maternal education (years) |
| 8 | Num. other households that share same fecal waste facility | Breastfed | Num. rooms used for sleeping | Num. other households that share same fecal waste facility | Num. children <60 months live in household | Days since last diarrhea episode |
| 9 | Breastfed | Num. other households that share same fecal waste facility | Num. children <60 months live in household | Num. children <60 months live in household | Caregiver education | People sleeping in house |
| 10 | Num. children <60 months live in household | Num. children <60 months live in household | Caregiver education | Caregiver education | Num. other households share latrine | Max loose stools in this episode |
Table 2
Calibration intercept and slope.
| Number of predictor variables | GEMS 0–59 monthsIntercept (95% CI) | Slope (95% CI) | GEMS 0–23 months (for external validation)Intercept (95% CI) | Slope (95% CI) | MAL-ED 0–23 months Rederivationintercept (95% CI) | Slope (95% CI) | GEMS-derived model applied to MAL-ED dataIntercept (95% CI) | Slope (95% CI) |
|---|---|---|---|---|---|---|---|---|
| 1 | 2.9 × 10⁻³ (−1.2 × 10⁻¹, 1.3 × 10⁻¹) | 1.0 (0.82, 1.2) | −1.0 × 10⁻² (−0.14, 0.12) | 0.97 (0.62, 1.3) | 9.6 × 10⁻³ (−0.32, 0.32) | 1.0 (0.35, 1.7) | ||
| 2 | 3.6 × 10⁻³ (−1.2 × 10⁻¹, 1.3 × 10⁻¹) | 1.0 (0.84, 1.2) | −1.1 × 10⁻² (−0.14, 0.12) | 0.98 (0.70, 1.3) | 1.1 × 10⁻² (−0.33, 0.33) | 1.0 (0.51, 1.5) | −0.32 (−0.54, −0.11) | 1.5 (1.0, 2.1) |
| 3 | 3.6 × 10⁻³ (−1.2 × 10⁻¹, 1.3 × 10⁻¹) | 1.0 (0.84, 1.2) | −1.2 × 10⁻² (−0.14, 0.12) | 0.97 (0.70, 1.2) | 1.1 × 10⁻² (−0.33, 0.33) | 0.99 (0.51, 1.5) | ||
| 4 | 4.1 × 10⁻³ (−1.2 × 10⁻¹, 1.3 × 10⁻¹) | 1.0 (0.84, 1.2) | −1.2 × 10⁻² (−0.14, 0.12) | 0.97 (0.71, 1.2) | 1.1 × 10⁻² (−0.33, 0.33) | 0.97 (0.49, 1.5) | ||
| 5 | 4.2 × 10⁻³ (−1.2 × 10⁻¹, 1.3 × 10⁻¹) | 1.0 (0.83, 1.2) | −1.2 × 10⁻² (−0.14, 0.12) | 0.96 (0.70, 1.2) | 1.1 × 10⁻² (−0.33, 0.33) | 0.95 (0.48, 1.5) | ||
| 6 | 4.2 × 10⁻³ (−1.2 × 10⁻¹, 1.3 × 10⁻¹) | 1.0 (0.83, 1.2) | −1.2 × 10⁻² (−0.14, 0.12) | 0.96 (0.70, 1.2) | 1.2 × 10⁻² (−0.33, 0.33) | 0.94 (0.47, 1.5) | ||
| 7 | 4.3 × 10⁻³ (−1.2 × 10⁻¹, 1.3 × 10⁻¹) | 1.0 (0.83, 1.2) | −1.2 × 10⁻² (−0.14, 0.12) | 0.96 (0.70, 1.2) | 1.2 × 10⁻² (−0.33, 0.33) | 0.92 (0.47, 1.4) | ||
| 8 | 4.4 × 10⁻³ (−1.2 × 10⁻¹, 1.3 × 10⁻¹) | 1.0 (0.83, 1.2) | −1.2 × 10⁻² (−0.14, 0.12) | 0.95 (0.69, 1.2) | 1.2 × 10⁻² (−0.33, 0.33) | 0.92 (0.47, 1.4) | ||
| 9 | 4.7 × 10⁻³ (−1.2 × 10⁻¹, 1.3 × 10⁻¹) | 1.0 (0.83, 1.2) | −1.2 × 10⁻² (−0.14, 0.12) | 0.95 (0.69, 1.2) | 1.2 × 10⁻² (−0.33, 0.33) | 0.91 (0.47, 1.4) | ||
| 10 | 4.8 × 10⁻³ (−1.2 × 10⁻¹, 1.3 × 10⁻¹) | 1.0 (0.83, 1.2) | −1.2 × 10⁻² (−0.14, 0.12) | 0.93 (0.69, 1.2) | 1.2 × 10⁻² (−0.33, 0.33) | 0.89 (0.46, 1.4) |
Additional files
-
MDAR checklist
- https://cdn.elifesciences.org/articles/78491/elife-78491-mdarchecklist1-v2.pdf
-
Supplementary file 1
Additional methodological details and results of sensitivity analyses.
- https://cdn.elifesciences.org/articles/78491/elife-78491-supp1-v2.pdf
Download links
A two-part list of links to download the article, or parts of the article, in various formats.
Downloads (link to download the article as PDF)
Open citations (links to open the citations from this article in various online reference manager services)
Cite this article (links to download the citations from this article in formats compatible with various reference manager tools)
Derivation and external validation of clinical prediction rules identifying children at risk of linear growth faltering
eLife 12:e78491.
https://doi.org/10.7554/eLife.78491


