Single-cell transcriptome profiles of Drosophila fruitless-expressing neurons from both sexes
- Department of Biomedical Sciences, Florida State University, College of Medicine, United States
- Program of Neuroscience, Florida State University, United States
Figures
Figure 1 with 8 supplements
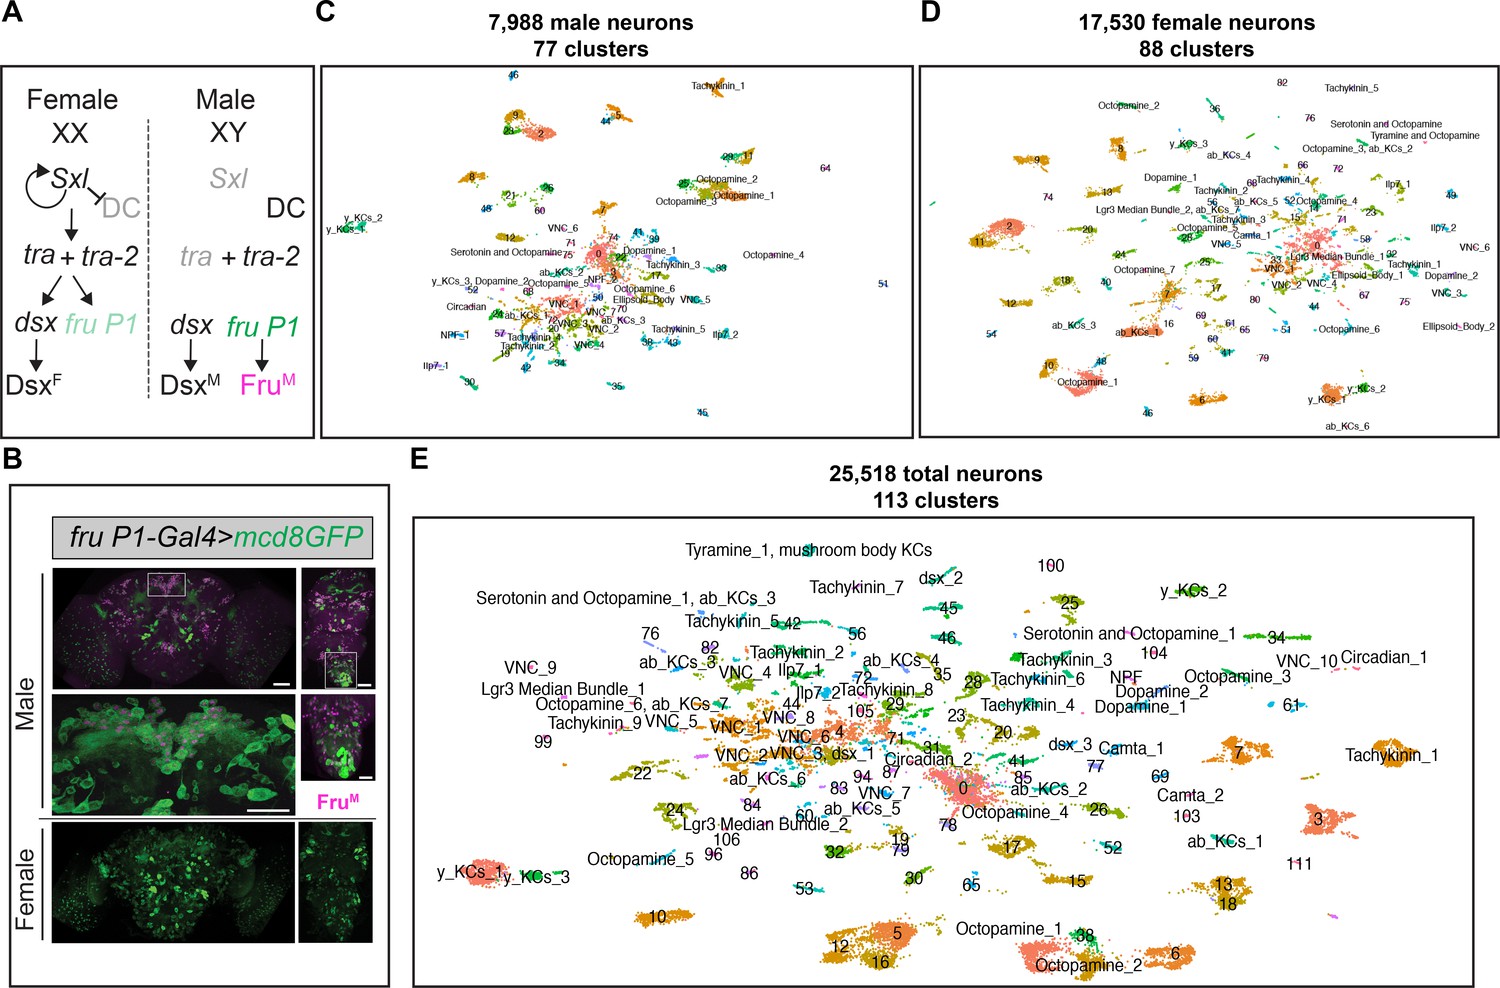
scRNA-sequencing of fru P1 neurons from males and females at 48-hr after puparium formation (APF).
(A) The Drosophila sex determination hierarchy is an alternative pre-mRNA splicing cascade that generates sex-specific transcription factors that regulate somatic sexual differentiation. The pre-mRNA splicing regulators are encoded by sxl, tra, and tra-2. Early production of Sxl in females results in continued production of functional Sxl and Tra in females. Tra and Tra-2 regulate the sex-specific splicing of doublesex (dsx) and fruitless transcripts from the P1 promoter (fru P1). In females, female-specific Dsx (DsxF) is produced. In males, male-specific (DsxM) and male-specific Fru (FruM) are produced due to default pre-mRNA splicing. Sxl also regulates dosage compensation (DC) (reviewed in Andrew et al., 2019; Cline and Meyer, 1996). (B) Confocal maximum projections of 48-hr APF male (top) and female (bottom) brains and ventral nerve cords (VNCs) expressing membrane-bound GFP (mcd8::GFP) in fru P1-expressing neurons (green). Male tissues are immunostained for male-specific FruM (magenta). Magnification of the boxed regions in male brain and VNC are below the male tissues (×40). Scale bars = 50 μm. (C) Uniform Manifold Approximation and Projection (UMAP) plot of 7988 fru P1 cells, from male central nervous system (CNS) at 48-hr APF, grouped into 77 clusters (male data analysis). (D) UMAP plot of 17,530 fru P1 cells, from female CNS at 48-hr APF, grouped into 88 clusters (female data analysis). (E) UMAP plot of 25,518 total fru P1 neurons, from both sexes (full data set), grouped into 113 clusters. For all UMAP plots, the annotations shown were determined using marker gene expression (Source data 3). Clusters with numbers have additional annotations listed in Source data 3.
Figure 1—figure supplement 1
Data filtering and replicate overlap in Uniform Manifold Approximation and Projection (UMAP) space.
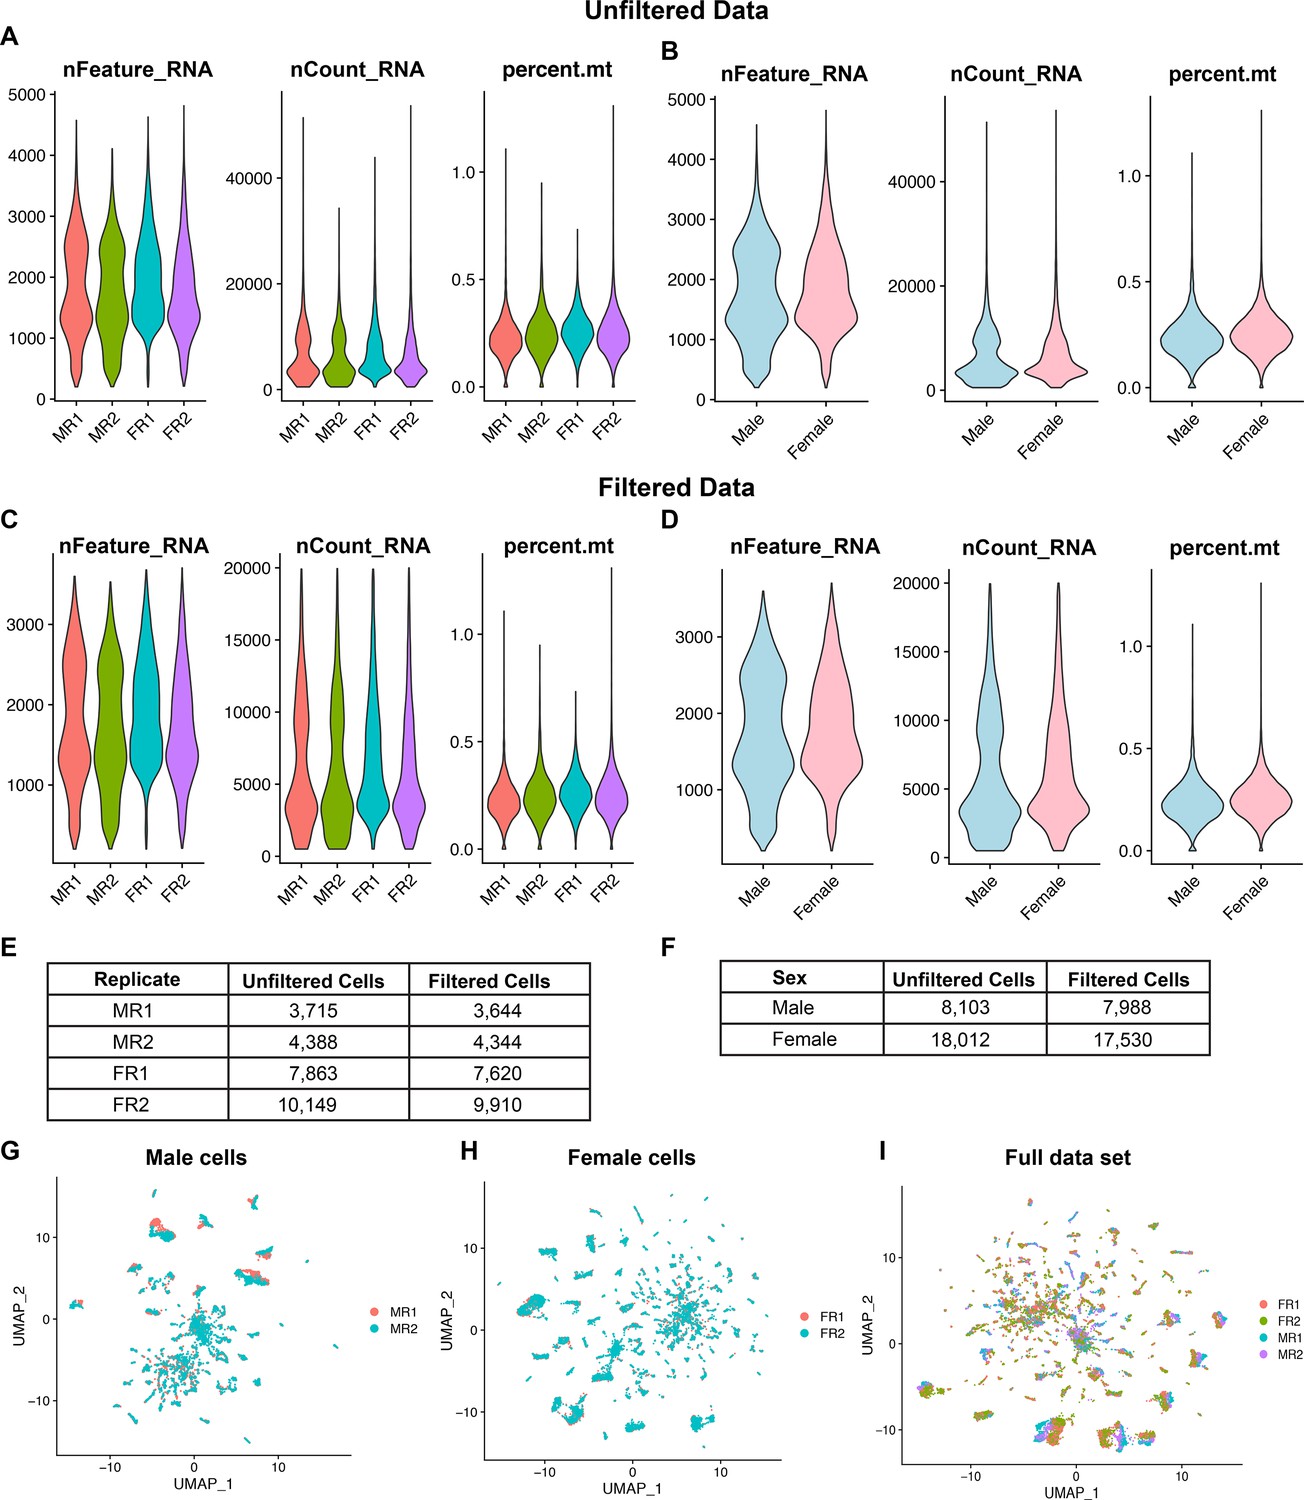
(A) Violin plots with the number of total expressed genes (nFeature_RNA), number of transcripts (nCount_RNA), and percentage of mitochondrial transcripts expressed (percent.mt) in each replicate from both sexes in the unfiltered data. MR1 and MR2 indicate male replicates 1 and 2. FR1 and FR2 indicate female replicates 1 and 2. (B) Violin plots of unfiltered cell data with replicates combined by sex. (C) Violin plots with the filtered cell data from each replicate for the number of expressed genes (nFeature_RNA), number of transcripts (nCount_RNA), and percentage of mitochondrial transcripts expressed (percent.mt). Each replicate was filtered for cells that met the following criteria: >200 nFeature_RNA, >4000 and >20,000 nCount_RNA, and <5% percent.mt. (D) Violin plots of cells meeting filtering criteria data for each replicate combined by sex. (E) Table with total numbers of cells per replicate prior to filtering (unfiltered cells) and the number meeting filtering criteria (filtered cells). (F) Table with total numbers of cells per sex prior to filtering (unfiltered cells) and the number meeting filtering criteria (filtered cells). (G) UMAP plot of the male data set presented in Figure 1D with male cells labeled by replicate. Male replicates 1 and 2 are indicated (MR1 and MR2). (H) UMAP plot of the female data set presented in Figure 1E with female cells labeled by replicate. Female replicates 1 and 2 are indicated (FR1 and FR2). (I) UMAP plot of the full data set presented in Figure 1F with all cells labeled by replicate (MR1, MR2, FR1, and FR2).
Figure 1—figure supplement 2
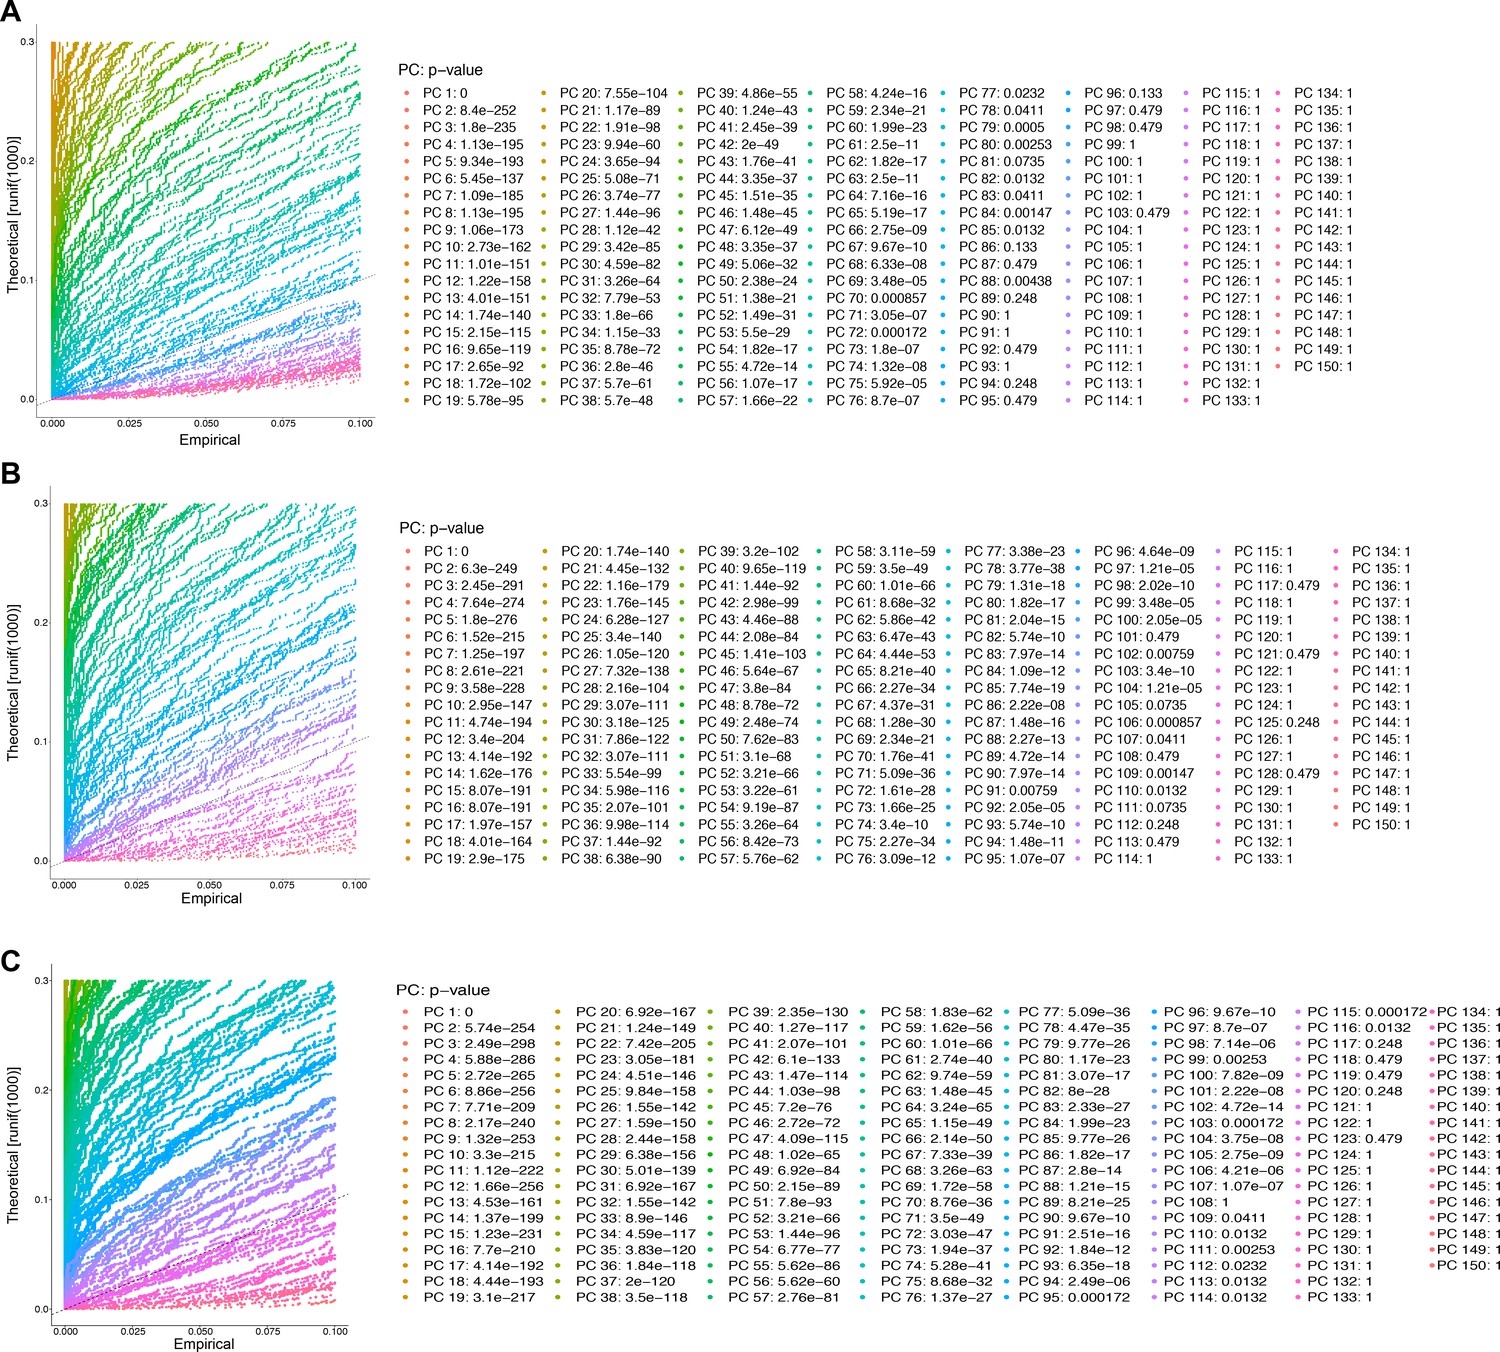
Jackstraw plots used to determine number of significant principal components (PCs) to use for dimensional reduction and clustering.
(A) Jackstraw plot for the number of PCs for the male data set. 80 PCs were used for the male data set. (B) Jackstraw plot for the number of PCs for the female data set. 104 PCs were used for the female data set. (C) Jackstraw plot for the number of PCs for the full data set. 107 PCs were used for the full data set. For all three analyses, the number was chosen up to where the first non-significant PC was identified.
Figure 1—figure supplement 3
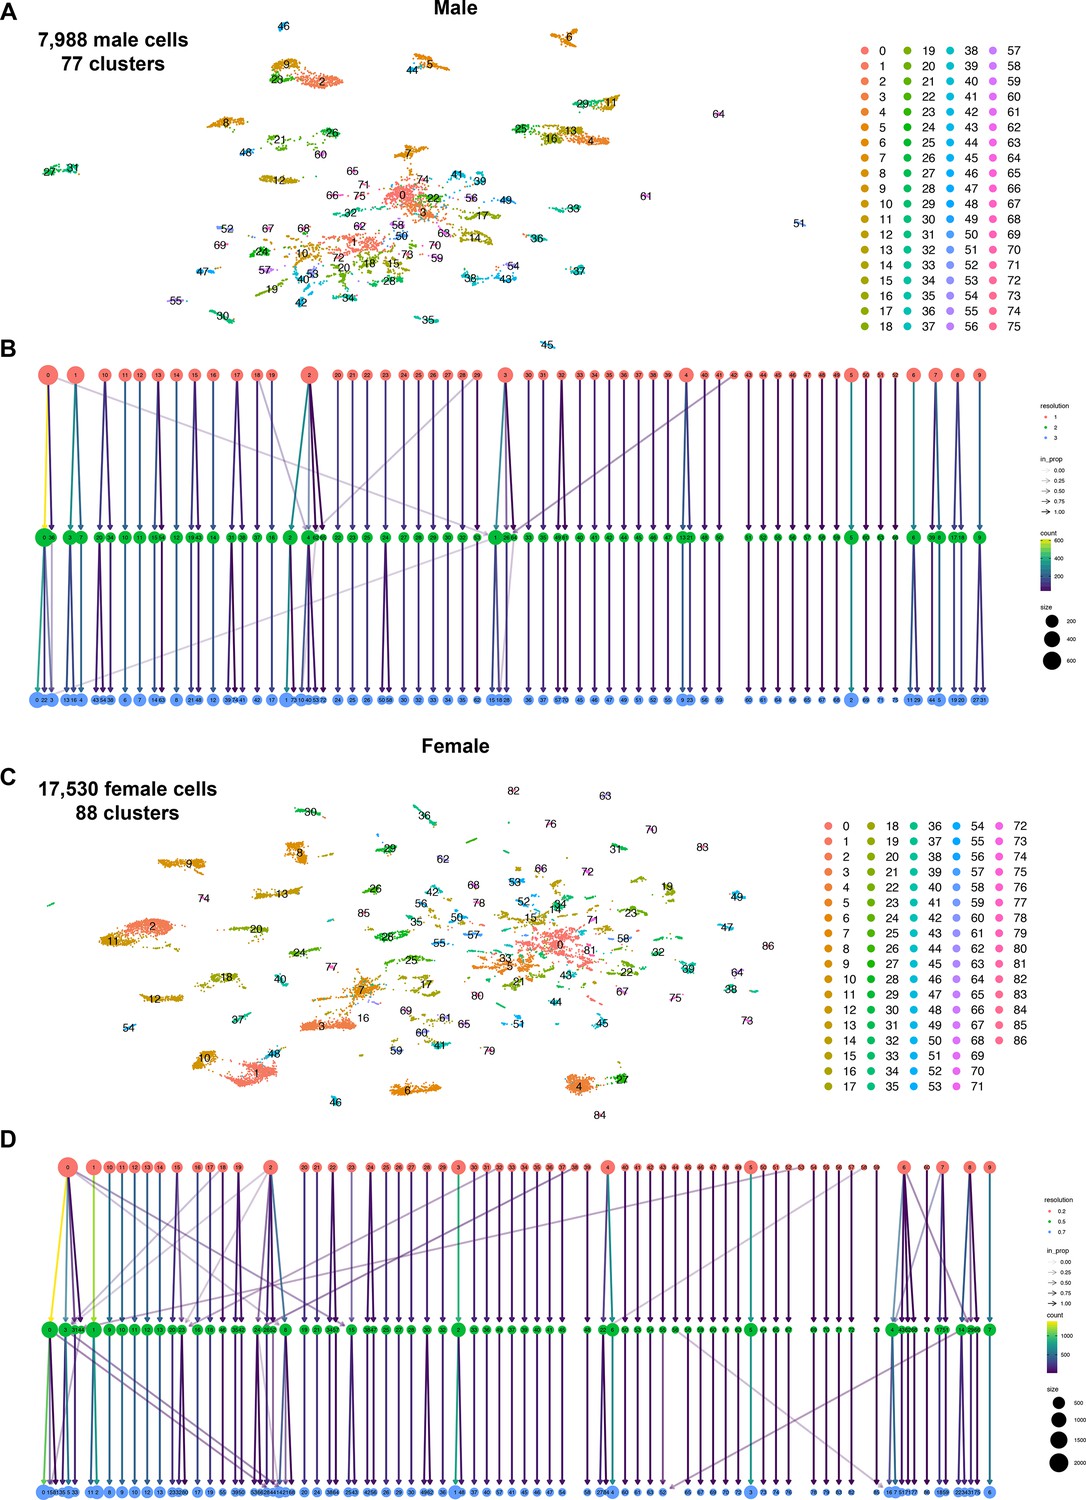
Test of differing cluster resolutions for male and female fru P1 neuron data sets.
(A) Uniform Manifold Approximation and Projection (UMAP) plot of 7988 male fru P1 neurons at cluster resolution of 3, defining 76 clusters, used throughout the study. (B) Relationship between male data set clusters at different cluster resolutions. This analysis was performed at three resolutions. The color of the circles indicates cluster resolution, with red circles indicating resolution of 1, green circles indicating resolution of 2, and blue circles indicating resolution of 3. (C) UMAP plot of 17,530 female fru P1 neurons at cluster resolution of 0.7, defining 87 clusters, used throughout the study. (D) Relationship between female data set clusters at different cluster resolutions. This analysis was performed at three resolutions. The color of the circles indicates cluster resolution, with red circles indicating resolution of 0.2, green circles indicating resolution of 0.5, and blue circles indicating resolution of 0.7. For (B) and (D), the shade of the color of the arrows between the different cluster resolutions represent the proportion of the cluster present at the next highest resolution (in_prop). The color of the arrow indicates the count of cells within each cluster, between resolutions (count). The size of the circle indicates the number of cells in each cluster (size).
Figure 1—figure supplement 4
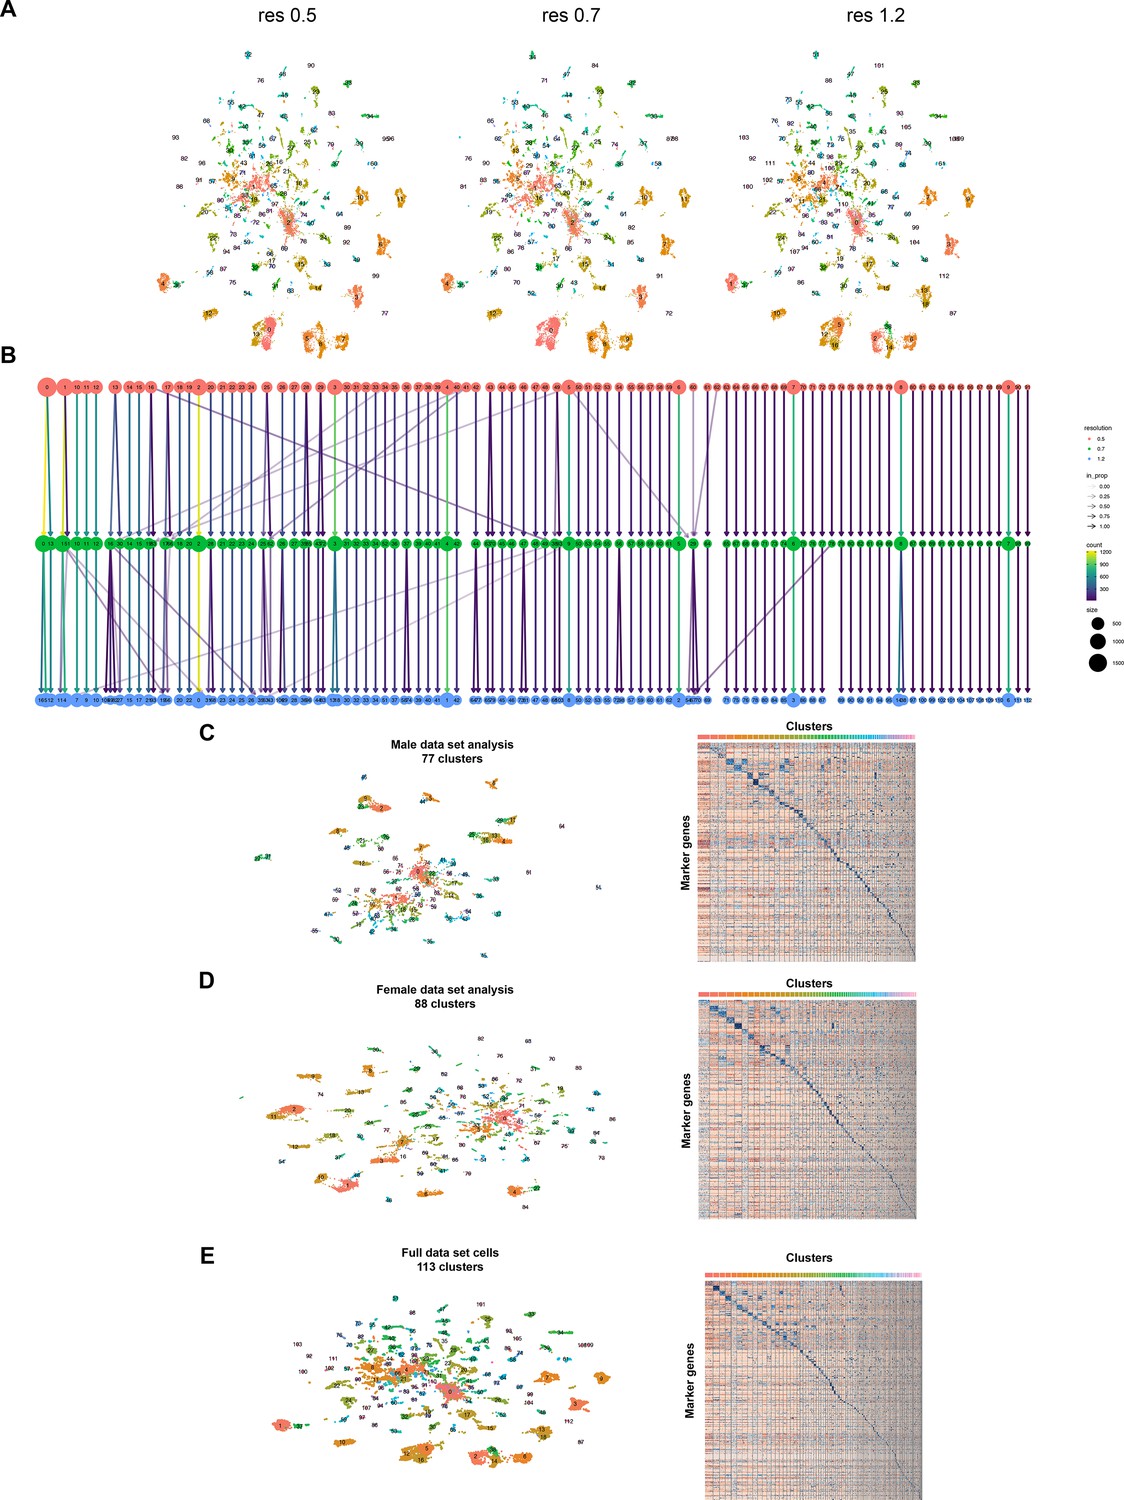
Test of differing cluster resolutions for full fru P1 neuron data set and cluster defining marker gene expression for all data sets.
(A) Uniform Manifold Approximation and Projection (UMAP) plot of 25,518 fru P1 neurons at cluster resolution (res) of 0.5, 0.7, and 1.2, each defining a different number of clusters. In the study we used resolution of 1.2, defining 113 clusters. (B) Relationship between data set clusters at different cluster resolutions. This analysis was performed at three resolutions. The color of the circles indicates cluster resolution, with red circles indicating resolution of 0.5, green circles indicating resolution of 0.7, and blue circles indicating resolution of 1.2. The shade of the color of the arrows between the different cluster resolutions represent the proportion of the cluster present at the next highest resolution (in_prop). The color of the arrow indicates the count of cells within each cluster, between resolutions (count). The size of the circle indicates the number of cells in each cluster (size). (C) UMAP plot of 77 clusters of male fru P1 neurons and heatmap showing scaled and log-normalized expression of top 10 cluster marker genes in male cell clusters. (D) UMAP plot of 88 clusters of female fru P1 neurons and heatmap showing scaled and log-normalized expression of top 10 cluster marker genes in female cell clusters. (E) UMAP plot of 113 clusters from full fru P1 neuron data set analysis and heatmap showing scaled and log-normalized expression of top 10 cluster marker genes. Marker genes for all analyses are listed in Source data 3.
Figure 1—figure supplement 5
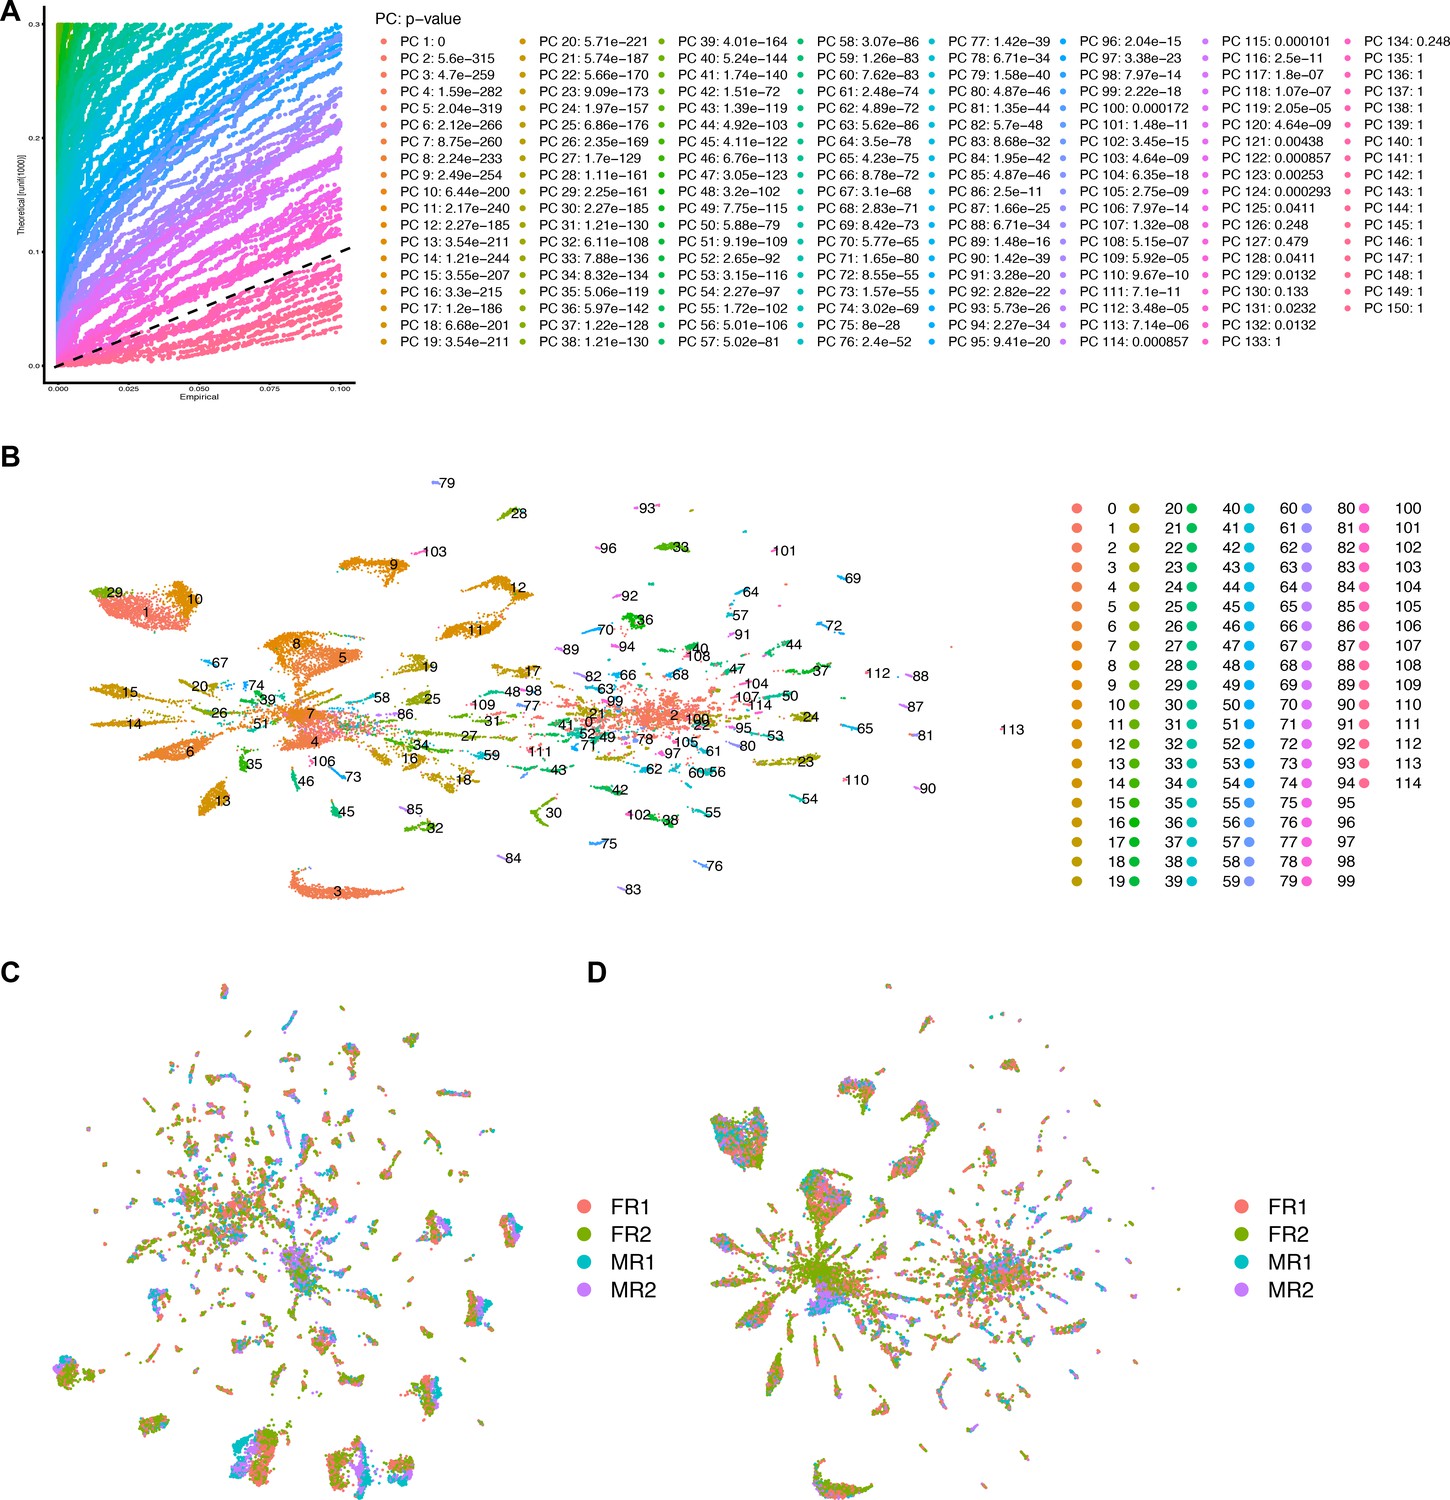
Seurat data integration of full data set and comparison to merged analysis.
(A) Jackstraw plot for the number of principal components (PCs) for the the full data set after undergoing data integration. 125 PCs were used for the integrated analysis. (B) Uniform Manifold Approximation and Projection (UMAP) plot of 25,518 fru P1 neurons at cluster resolution of 1.8, defining 115 clusters. (C) UMAP plot of all four replicates, n = 2 per sex, for the merged full data set used in this study. (D) UMAP plot of all four replicates, n = 2 per sex, for the integrated analysis.
Figure 1—figure supplement 6
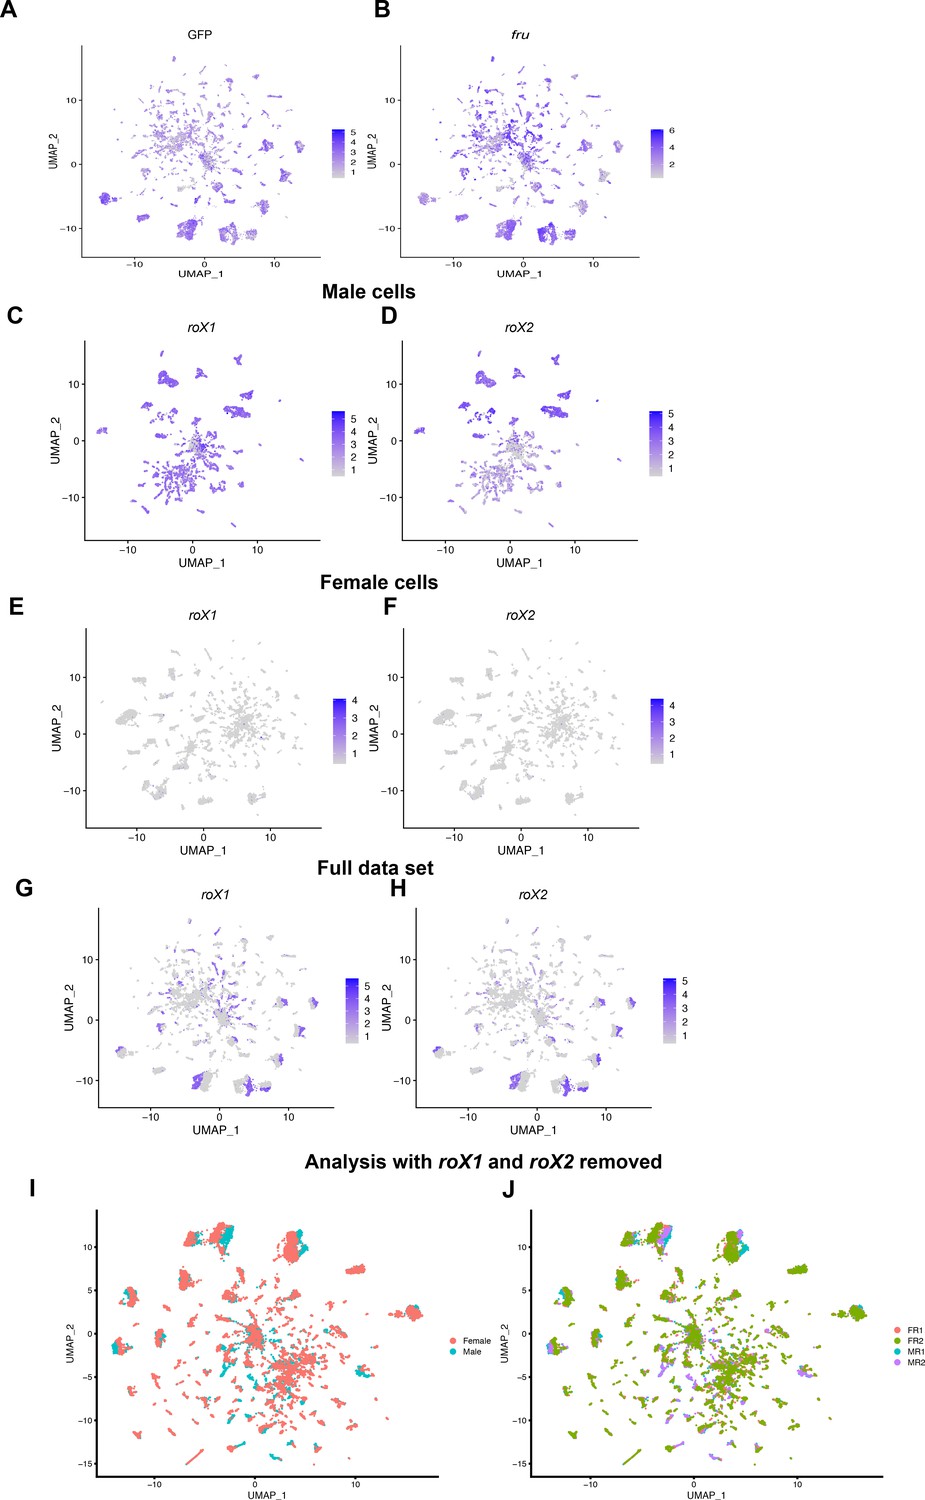
Visualization of GFP, fru, roX1, and roX2 expression.
(A) Gene expression features plots of GFP and (B) fru expression in the full data set Uniform Manifold Approximation and Projection (UMAP). roX1 and roX2 expression in the male data set UMAP (C, D), female data set UMAP (E, F), and full data set UMAP (G, H). The gene expression feature plots show gene expression levels in purple in the UMAP, with color intensity proportional to the log-normalized expression levels. (I, J) UMAP plot of the full data set after removal of roX1 and roX2 expression data, with all cells labeled by sex (I) and (J) replicate (see methods).
Figure 1—figure supplement 7
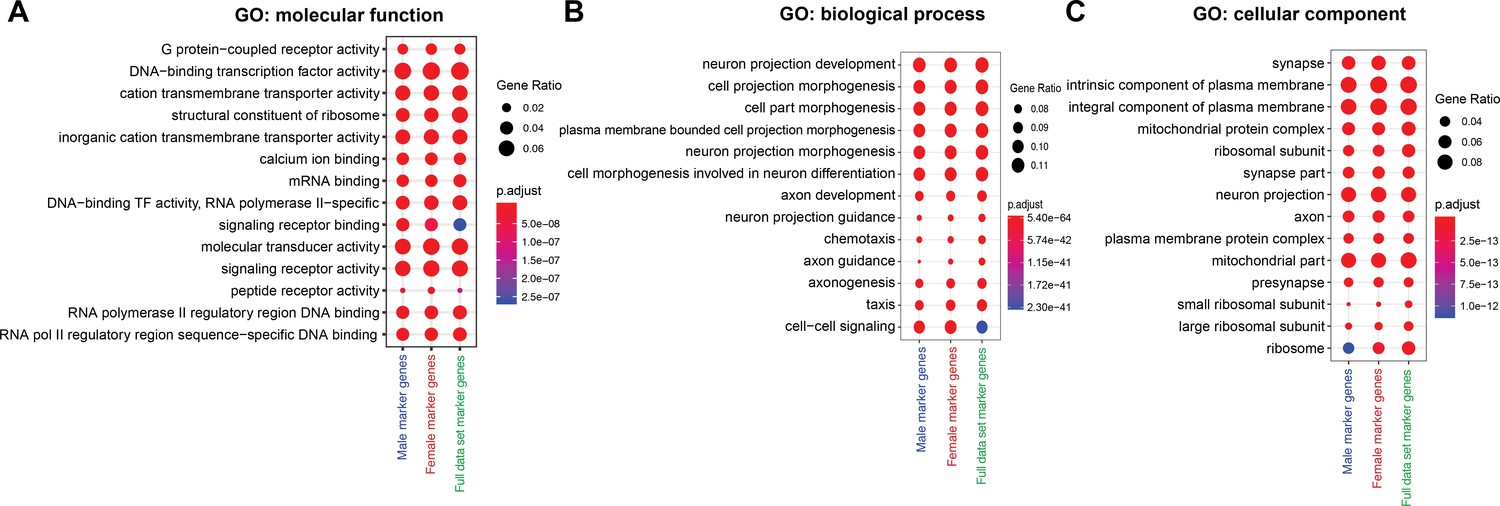
Gene ontology (GO) enrichment analysis for marker genes lists.
(A–C) GO enrichment analysis for male, female, and full data set marker gene lists. The GO categories are (A) molecular function, (B) biological process, and (C) cellular component. The GO terms shown in the plots are the top ten most significantly enriched terms for each marker gene list (Benjamini–Hochberg, p < 0.05). The size of each dot indicates the number of genes in our marker gene list divided by the total number of genes belonging to the GO category (GeneRatio). The color indicates the p value (p.adjust). All GO information is listed in Source data 4.
Figure 1—figure supplement 8
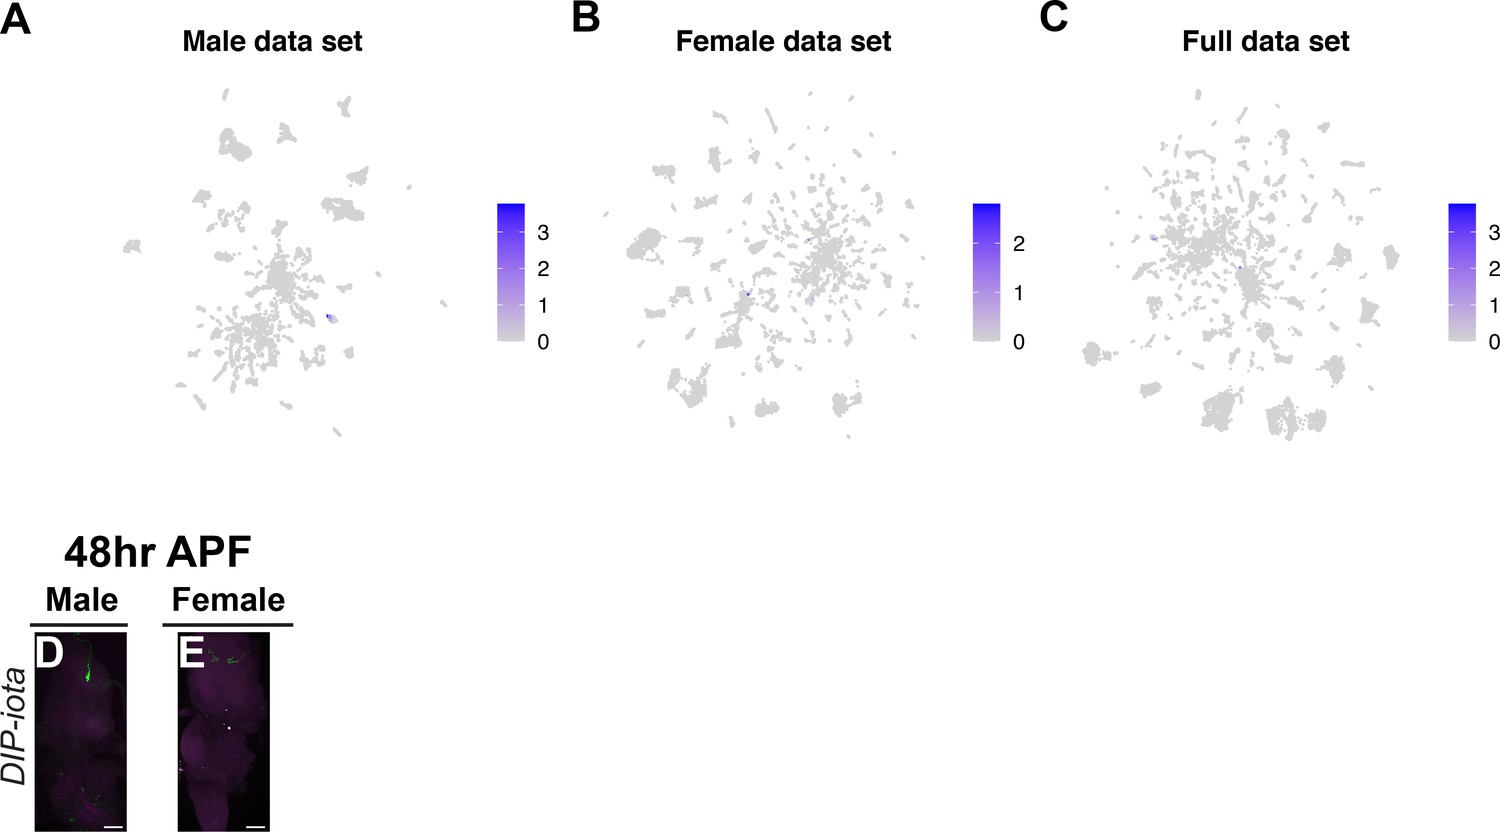
Visualization of DIP-iota expression.
(A–C) Gene expression feature plots showing expression of DIP-iota, in male, female, and full data set Uniform Manifold Approximation and Projection (UMAP). (D, E) Ventral nerve cord (VNC) confocal maximum projections showing intersecting expression patterns of DIP-iota ∩ fru P1 (in green), for males and females, as indicated. Scale bars = 50 μm.
Figure 2 with 2 supplements
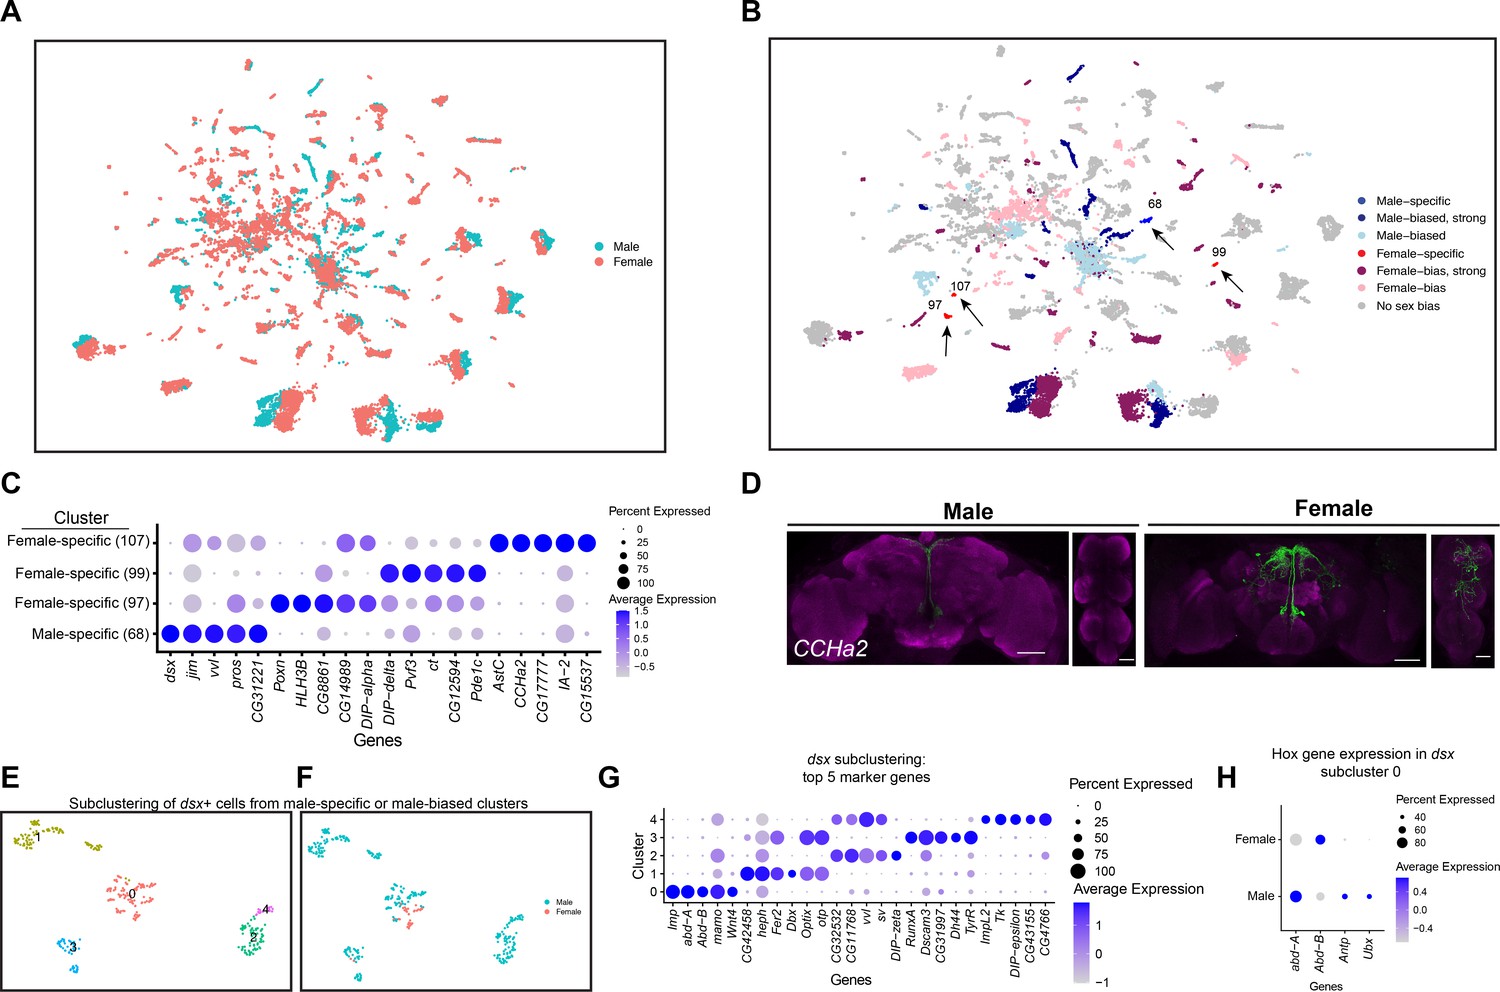
Sex differences in single-cell clustering.
(A–B) Uniform Manifold Approximation and Projection (UMAP) plots of the 25,518 fru P1 neurons from males and females (full data set) with all cells labeled by sex (A) and by sex bias in cell number (B) (Source data 5). (B) Sex-biased classification is based on normalized number of female cells (legend on right, Source data 5). Cluster numbers and black arrows indicate female-specific clusters (red) and the male-specific clusters (blue). Female- (light pink) and male biased (light blue) have two-fold more neurons compared to the other sex. Female- (purple) and male-biased, strong (dark blue) have four-fold more neurons compared to the other sex. (C) Dot plot of top 5 marker genes in each sex-specific cluster based on log fold-change in expression (Source data 3). (D) Brain and ventral nerve cord (VNC) confocal maximum projections from 0- to 24-hr adults for CCHa2 ∩ fru P1-expressing neurons, with intersecting expression shown in green for males (left) and females (right). Scale bars = 50 μm. (E, F) Subclustering analyses of neurons from male-specific and male-biased clusters that express dsx defines five subclusters (clusters are indicated by color and number). (F) The five subclusters are shown with sex indicated by color, with male cells in blue and female cells in pink. Female cells are present only in subclusters 0 and 3. (G) Dot plot of top 5 marker genes in each dsx subcluster based on log fold-change in expression (Source data 3). (H) Dot plot of Hox genes with known VNC expression in dsx subcluster 0, for both sexes. For all dot plot (C, G, H) panels the dot size indicates the percentage of neurons expressing each gene per cluster (Percent Expressed). Average normalized expression level is shown by color intensity (Average Expression).
Figure 2—figure supplement 1
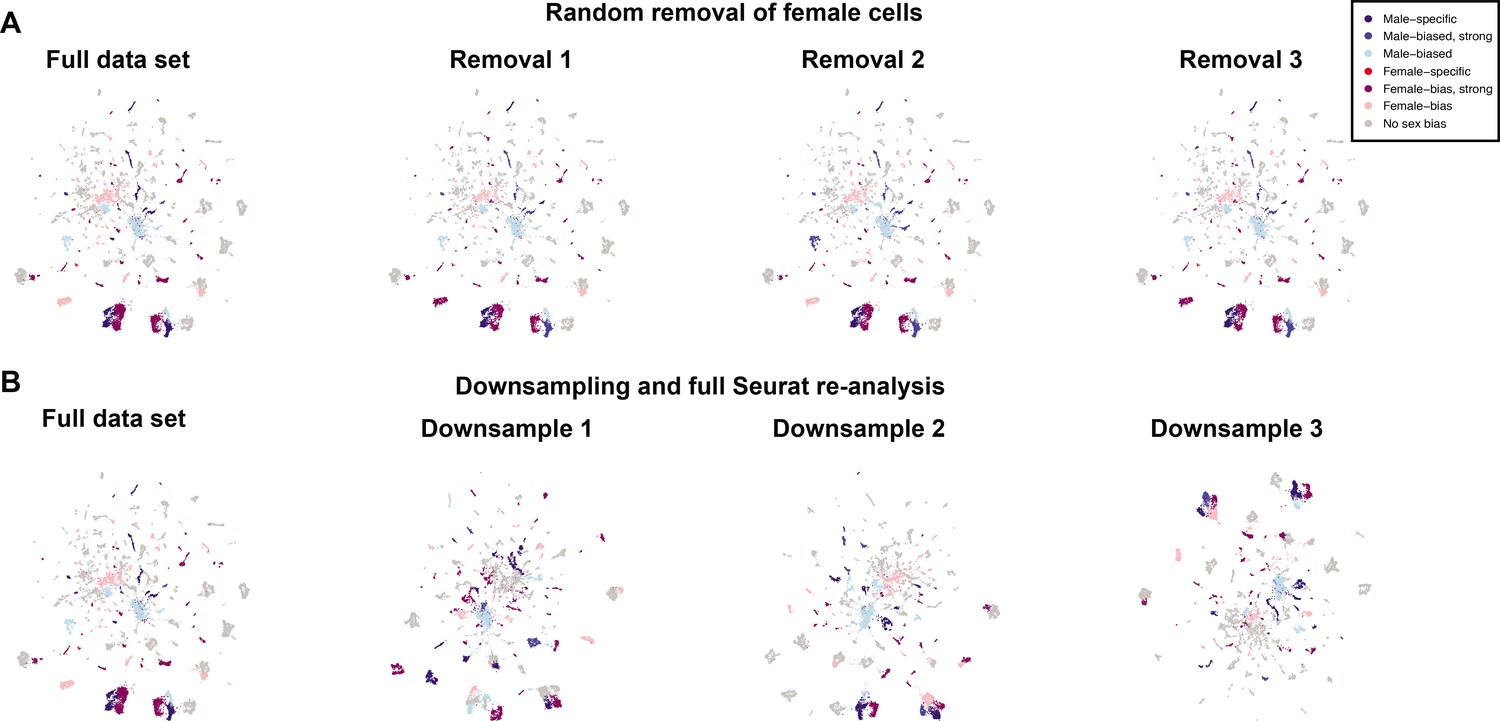
Random removal and downsampling of female cells.
(A) From the full data set Uniform Manifold Approximation and Projection (UMAP), a random set of 7988 female cells were kept and the clusters were analyzed. This was performed three independent times. (B) A full reanalysis, using the standard Seurat workflow, of the filtered cells was performed three times after downsampling the female data to 7988 female cells. The UMAPs are shown. Comparisons across clusters are in Source data 5.
Figure 2—figure supplement 2
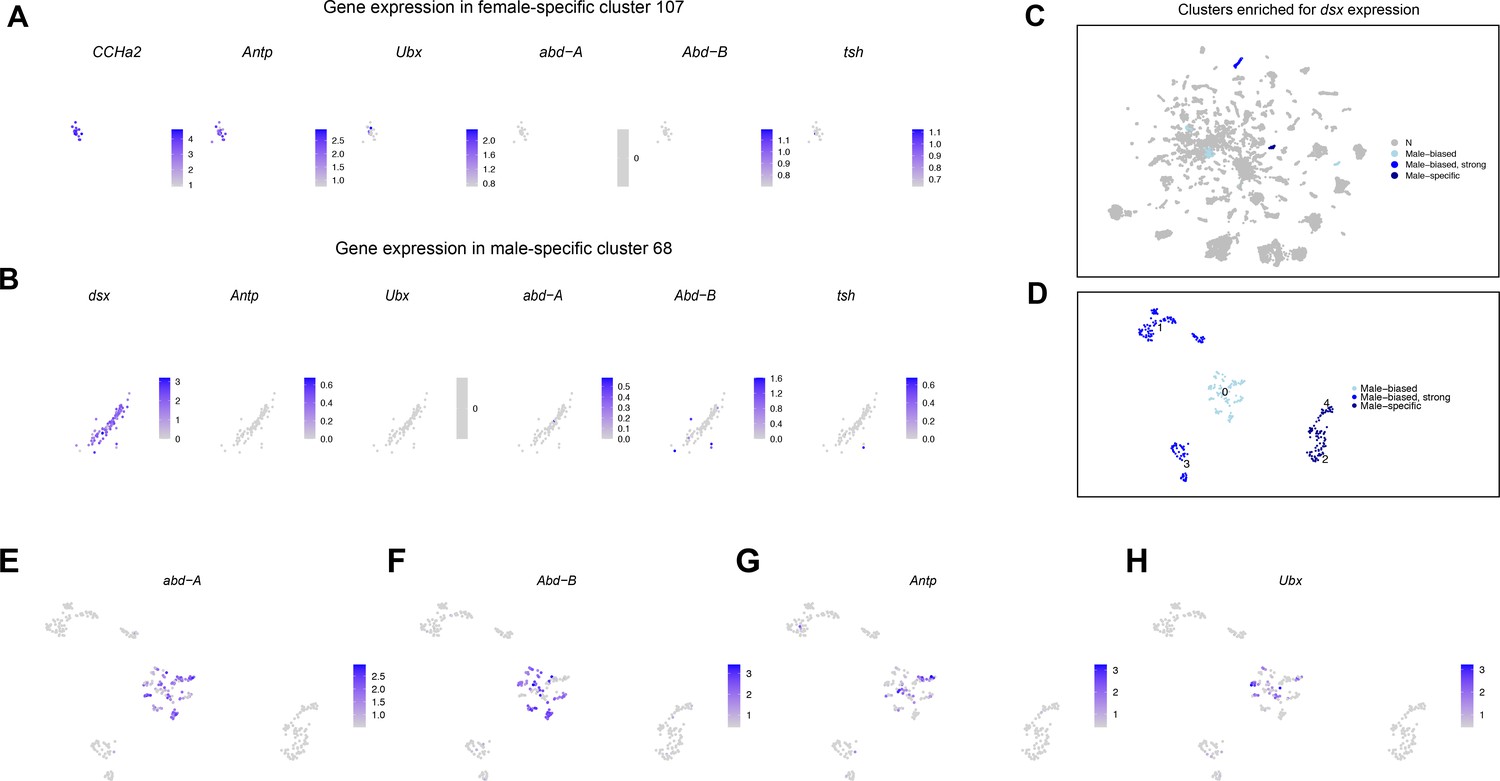
Gene expression in sex-specific and sex-biased clusters.
(A) Gene expression feature plots showing gene expression in neurons from female-specific cluster 107. CCHa2 and genes with known expression in the ventral nerve cord (VNC) are shown. (B) Feature plots showing gene expression in neurons from male-specific cluster 68. dsx and genes with known expression in the VNC are shown. (C) The full data set Uniform Manifold Approximation and Projection (UMAP) plot showing dsx-expressing clusters that are male-specific (dark blue), strongly male-biased (purple), or male-biased (light blue) in cell number. (D) A UMAP showing the clustering of five dsx subclusters, with the subclusters colorized by original sex-biased or sex-specific cluster assignment shown in (C). (E–H) Gene expression feature plots for dsx subclusters showing genes with known expression in the VNC. The gene expression feature plots show gene expression levels in purple in the UMAP, with color intensity proportional to the log-normalized expression levels. The color legend is to the right in each panel.
Figure 3 with 1 supplement

Ventral nerve cord (VNC) cluster annotations based on Hox gene expression.
(A) Gene expression feature plots showing neurons that express Hox genes with known expression in the VNC (Antp, Ubx, abd-A, and Abd-B), in the full data set Uniform Manifold Approximation and Projection (UMAP). The gene expression feature plots show gene expression levels in purple in the UMAP, with color intensity proportional to the log-normalized expression levels. (B) UMAP plot showing annotated VNC clusters in the full data set analysis. The VNC clusters are numbered and highlighted in green (Source data 3). (C) Heatmap of correlation of Hox gene expression in single neurons in the full data set. Pearson’s r values denoted on heatmap with color, according to legend (right).
Figure 3—figure supplement 1
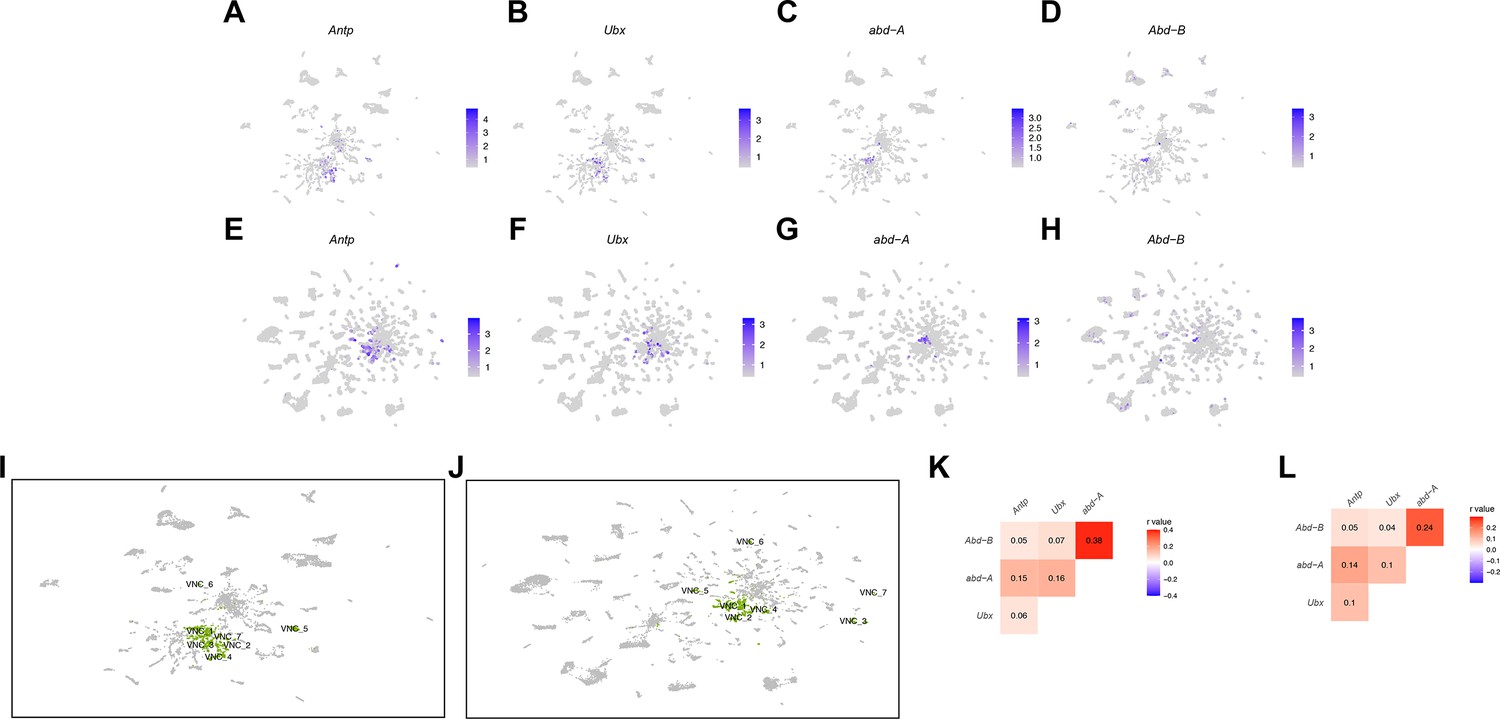
Ventral nerve cord (VNC) cluster annotations based on Hox expression for male and female data sets.
(A–H) Gene expression feature plots showing expression of Hox genes that have known expression in the VNC, in male Uniform Manifold Approximation and Projection (UMAP) (A–D) and female UMAP (E–H) data sets. (I–J) UMAP plot showing clusters annotated as having neurons from the VNC (highlight in green), in the male (I) and female (J) data set analyses. The cluster number is shown and corresponds to the annotation in Source data 3. (K–L) Pearson correlation heatmap of Hox gene expression, at the single neuron level, in the male (K) and female (L) data set analyses. Pearson’s r value denoted on heatmap and colorized according to legend (right). The gene expression feature plots show gene expression levels in purple in the UMAP, with color intensity proportional to the log-normalized expression levels. The color legend is to the right in each panel.
Figure 4 with 1 supplement

Annotation of mushroom body Kenyon cells (KCs).
(A) Uniform Manifold Approximation and Projection (UMAP) plot highlighting KC cluster annotations in the full data set analysis (Source data 3). N (gray) indicates clusters not meeting marker gene criteria used to annotate KC clusters (see methods and Figure 4—figure supplement 1A). (B) Subclustering analysis of neurons from mushroom body KC clusters (colored clusters from panel A), creating 13 subclusters. (C) The 13 subclusters are shown with sex indicated by color, with male cells in blue and female cells in pink. (D) Dot plot of top 5 marker genes in each mushroom body KC subcluster based on log fold-change in expression (Source data 3). Dot size indicates the percentage of neurons expressing each gene per cluster (Percent Expressed). Average normalized expression level is shown by color intensity (Average Expression).
Figure 4—figure supplement 1
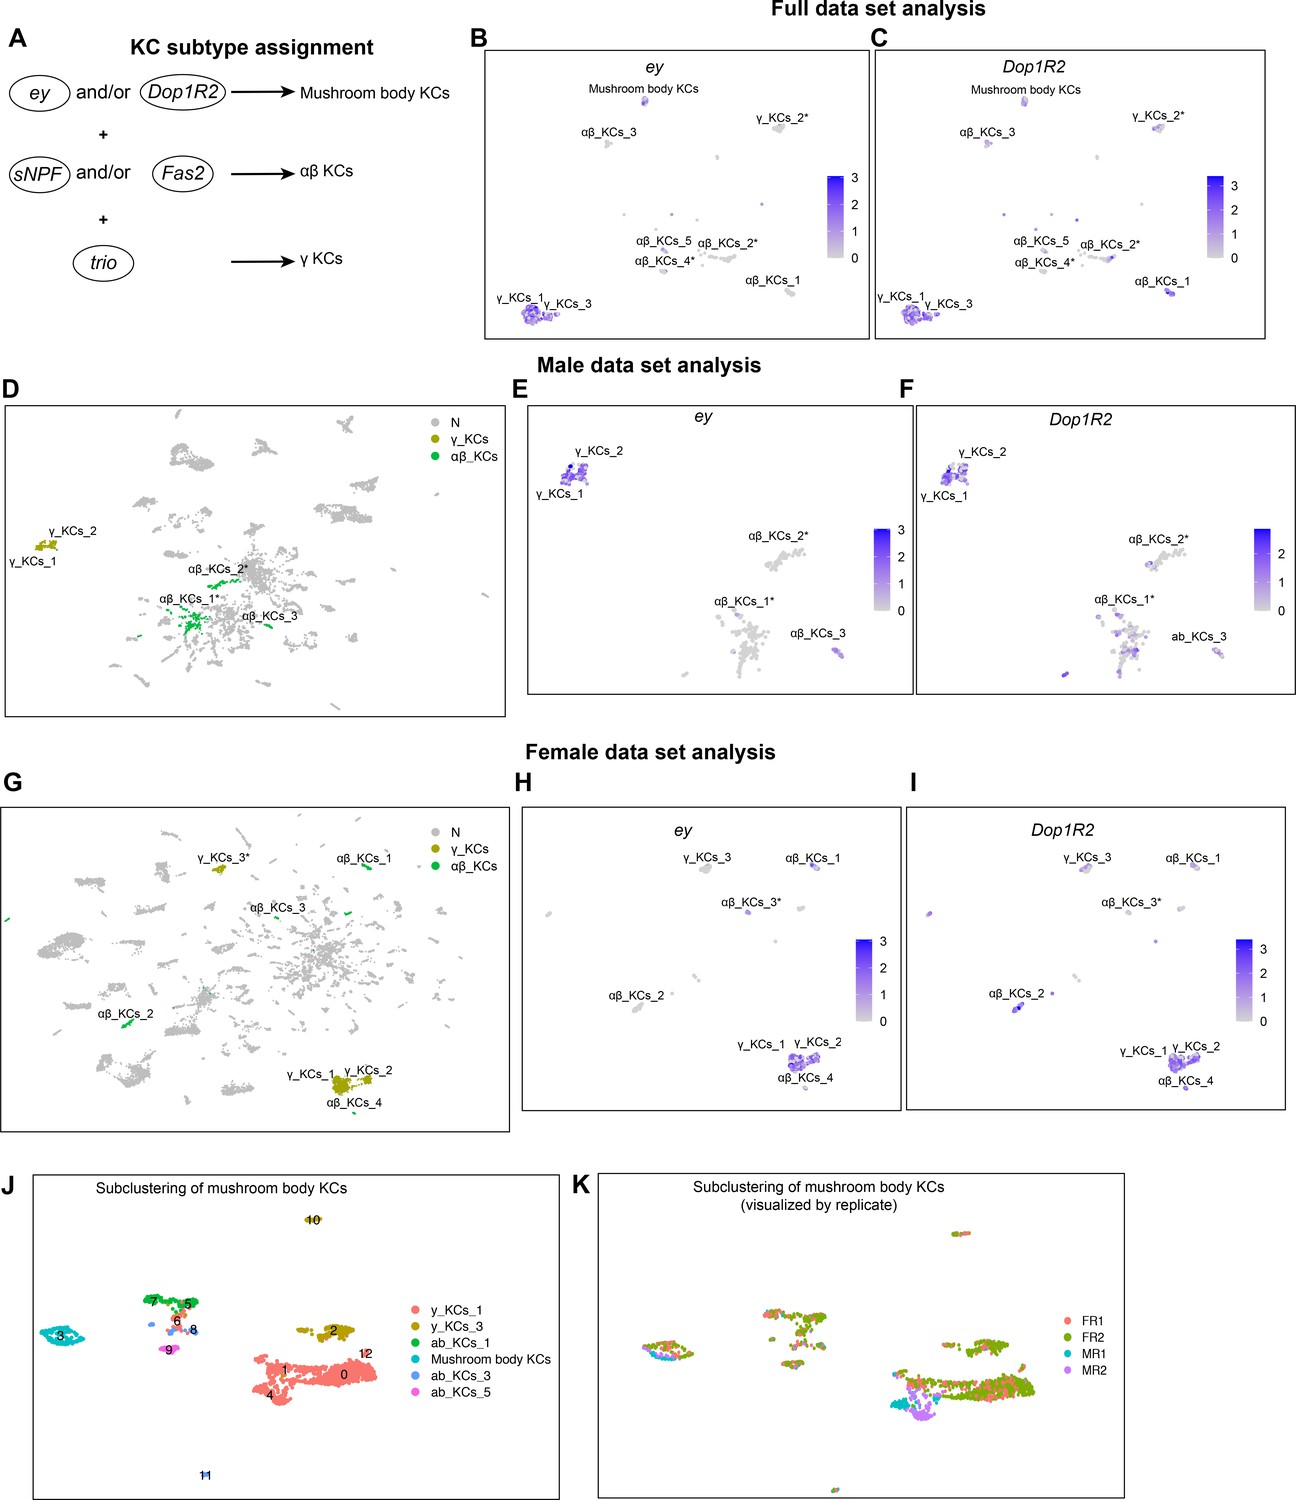
Mushroom body Kenyon cell (KC) annotations.
(A) Schematic of criteria defining mushroom body KC subtypes, based on gene expression of ey, Dop1R2, sNPF, Fas2, and trio. (B–C) Gene expression feature plots showing expression of ey (B) and Dop1R2 (C) in KC annotated clusters from the full data set analysis. (D) Uniform Manifold Approximation and Projection (UMAP) plot showing KC cluster annotations in the male data set analysis. The green and mustard highlight mushroom body clusters, and gray (N) indicates all other clusters (Source data 3). (E–F) Gene expression feature plots showing expression of ey (E) and Dop1R2 (F) in KC annotated clusters from the male data set analyses. (G) UMAP plot showing KC cluster annotations in the female data set analysis. The green and mustard highlight mushroom body clusters, and gray (N) indicates all other clusters (Source data 3). (H–I) Gene expression feature plots showing expression of ey (H) and Dop1R2 (I) in KC annotated clusters from the female data set analyses. The gene expression feature plots show gene expression levels in purple in the UMAP, with color intensity proportional to the log-normalized expression levels. The color legend is to the right in each panel. (J) UMAP of 13 mushroom body subclusters, with the subclusters colorized by original full data set analysis cluster assignment, shown in Figure 4A (legend on right). (K) UMAP plot of the mushroom body subclusters, the subclusters colorized by library replicate (MR1, MR2, FR1, and FR2).
Figure 5 with 1 supplement

Annotation of neurons that produce fast-acting neurotransmitters (FANs).
(A) Uniform Manifold Approximation and Projection (UMAP) plot showing annotated clusters with neurons that produce FANs, in the full data set analysis (Source data 3). In the color legend on right, N (gray) indicates clusters with no FAN marker gene expression. (B) Size proportional Euler diagram showing the percentage of cells with overlapping expression of genes indicative of cholinergic (VAChT), GABAergic (Gad1), and glutamatergic (VGlut) neurons, in the full data set. (C–G) Gene expression feature plots showing neurons that express genes indicative of FAN production: acetylcholine (ChAT and VAChT), GABA (Gad1 and VGAT), and glutamate (VGlut), in the full data set UMAP. (H–S) Brain and ventral nerve cord (VNC) confocal maximum projections for FAN-producing ∩ fru P1-expressing neurons, with intersecting expression shown in green for males and females, as indicated. ChAT ∩ fru P1 neurons, VGAT ∩ fru P1 neurons, and VGlut ∩ fru P1 neurons in 48-hr after puparium formation (APF) and 0- to 24-hr adult are shown. Arrows point to regions with sexually dimorphic projections or cell bodies. Scale bars = 50μm.
Figure 5—figure supplement 1
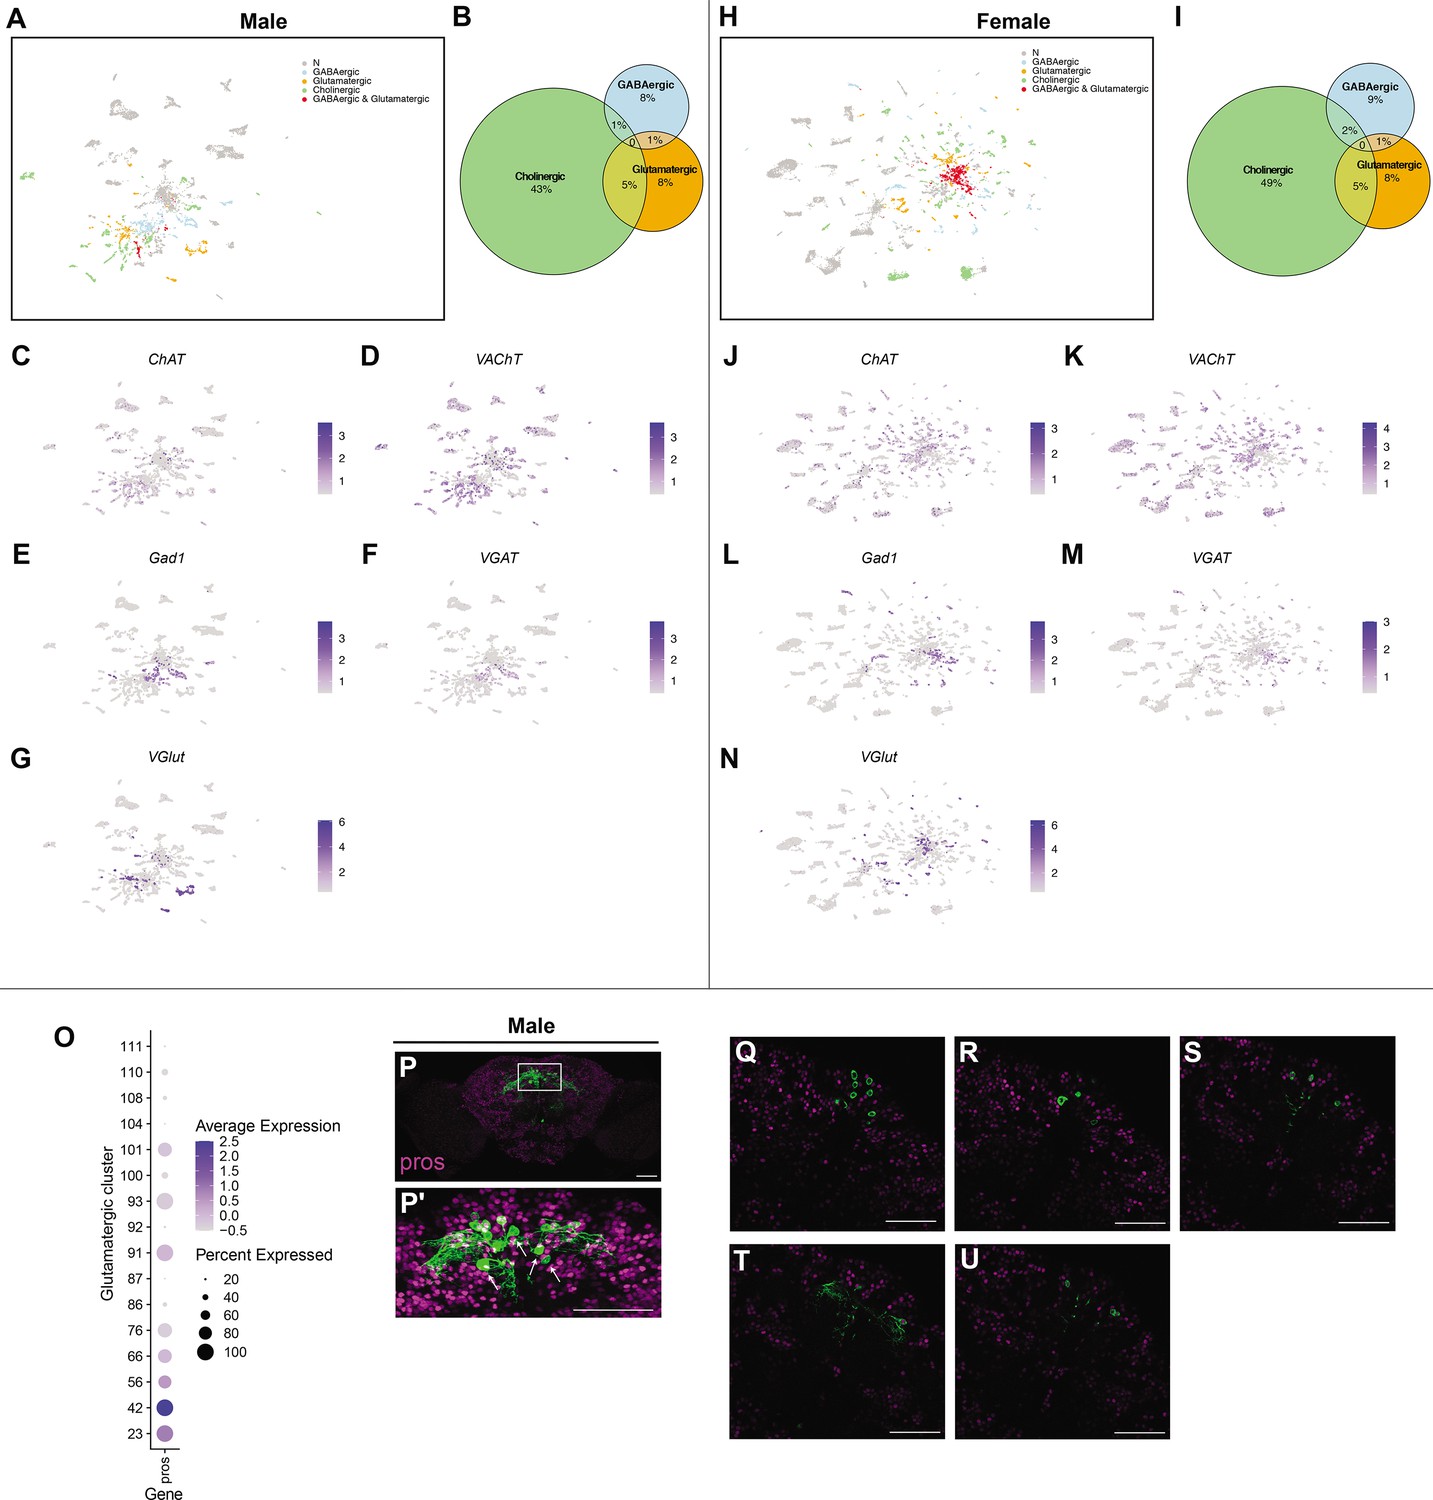
Expression of genes consistent with production of fast-acting neurotransmitters (FANs).
(A) Uniform Manifold Approximation and Projection (UMAP) plot showing clusters annotated as producing FANs, in the male data set (Source data 3). Color legend on right indicates clusters with FAN marker gene expression, or no expression (gray, N). (B) Size proportional Euler diagram showing the percentage of cells with overlapping expression of genes indicative of cholinergic (VAChT), GABAergic (Gad1), and glutamatergic (VGlut) neurons in the male data set. (C–G) Gene expression feature plots showing distribution of neurons expressing genes indicative of FAN production: acetylcholine (ChAT and VAChT), GABA (Gad1 and VGAT), and glutamate (VGlut), in the male data set. (H) UMAP plot showing clusters annotated as producing FANs, in the female data set (Source data 3). Color legend on right indicates clusters with FAN marker gene expression, or no expression (gray, N). (I) Size proportional Euler diagram showing the percentage of cells with overlapping expression of genes indicative of cholinergic (VAChT), GABAergic (Gad1), and glutamatergic (VGlut) neurons in the male data set. (J–N) Gene expression feature plots showing distribution of neurons expressing genes indicative of FAN production: acetylcholine (ChAT and VAChT), GABA (Gad1 and VGAT), and glutamate (VGlut), in the female data set. The gene expression feature plots show gene expression levels in purple in the UMAP, with color intensity proportional to the log-normalized expression levels. The color legend is to the right in each panel. (O) Dot plot of prospero (pros) expression in glutamatergic clusters from the full data set (Source data 3). Dot size indicates the percentage of neurons expressing each gene per cluster (Percent Expressed). Average normalized expression level is shown by color intensity (Average Expression). (P) Maximum confocal projection of male brain showing VGlut ∩ fru P1 neurons (green) and anti-Prospero staining (magenta), imaged with ×20 objective. (P’) The Pars Intercerebralis (PI) reigon of the brain in white box in (P) imaged with a ×40 objective. White arrows point of VGlut ∩ fru P1 cell bodies in PI that do not show Prospero staining. (Q-U) Individual confocal of the Pars Intercerebralis (PI) reigon of the brain in white box in (P). Scale bars = 50μm.
Figure 6 with 1 supplement

Annotation of neurons that produce aminergic neurotransmitters.
(A) Uniform Manifold Approximation and Projection (UMAP) plot showing clusters where Vmat is a marker gene. (B) UMAP plot showing clusters of neurons that produce aminergic neurotransmitters are identified based on marker gene expression: Tyramine and Octopamine (Tdc2), Dopamine (Dat and/or ple), Serotonin (SerT), in the full data set (Source data 3). The N (gray) indicates clusters with no aminergic marker genes expression. (C–D) Dot plots of top 5 genes for the three dopaminergic clusters (C) and three serotonergic clusters (D), based on log fold-change in gene expression. Dot size indicates the percentage of neurons expressing each gene per cluster (Percent Expressed). Average normalized expression level is shown by color intensity (Average Expression). (E) Violin plots showing expression of abd-A, Abd-B, and dsx in male and female serotonergic cells predicted to be from the abdominal ganglion ventral nerve cord (VNC) neurons. These cells were identified by SerT, abd-A, and/or Abd-B expression, resulting in 41 neurons (17 males and 24 females). (F–H) Proportion of fru P1 dopaminergic neurons (DAT and/or ple-expressing) (F) serotonergic neurons (SerT-expressing) (G), and octopaminergic neurons (Tdc2-expressing) (H) that co-express genes indicative of fast-acting neurotransmitter (FAN) expression in males and females. The proportion that are aminergic and cholinergic (ChAT and VAChT) are shown with green bars, GABAergic (Gad1 and VGAT) are shown with blue bars, and glutamatergic (VGlut) are shown by orange bars. Legend to right of each plot.
Figure 6—figure supplement 1
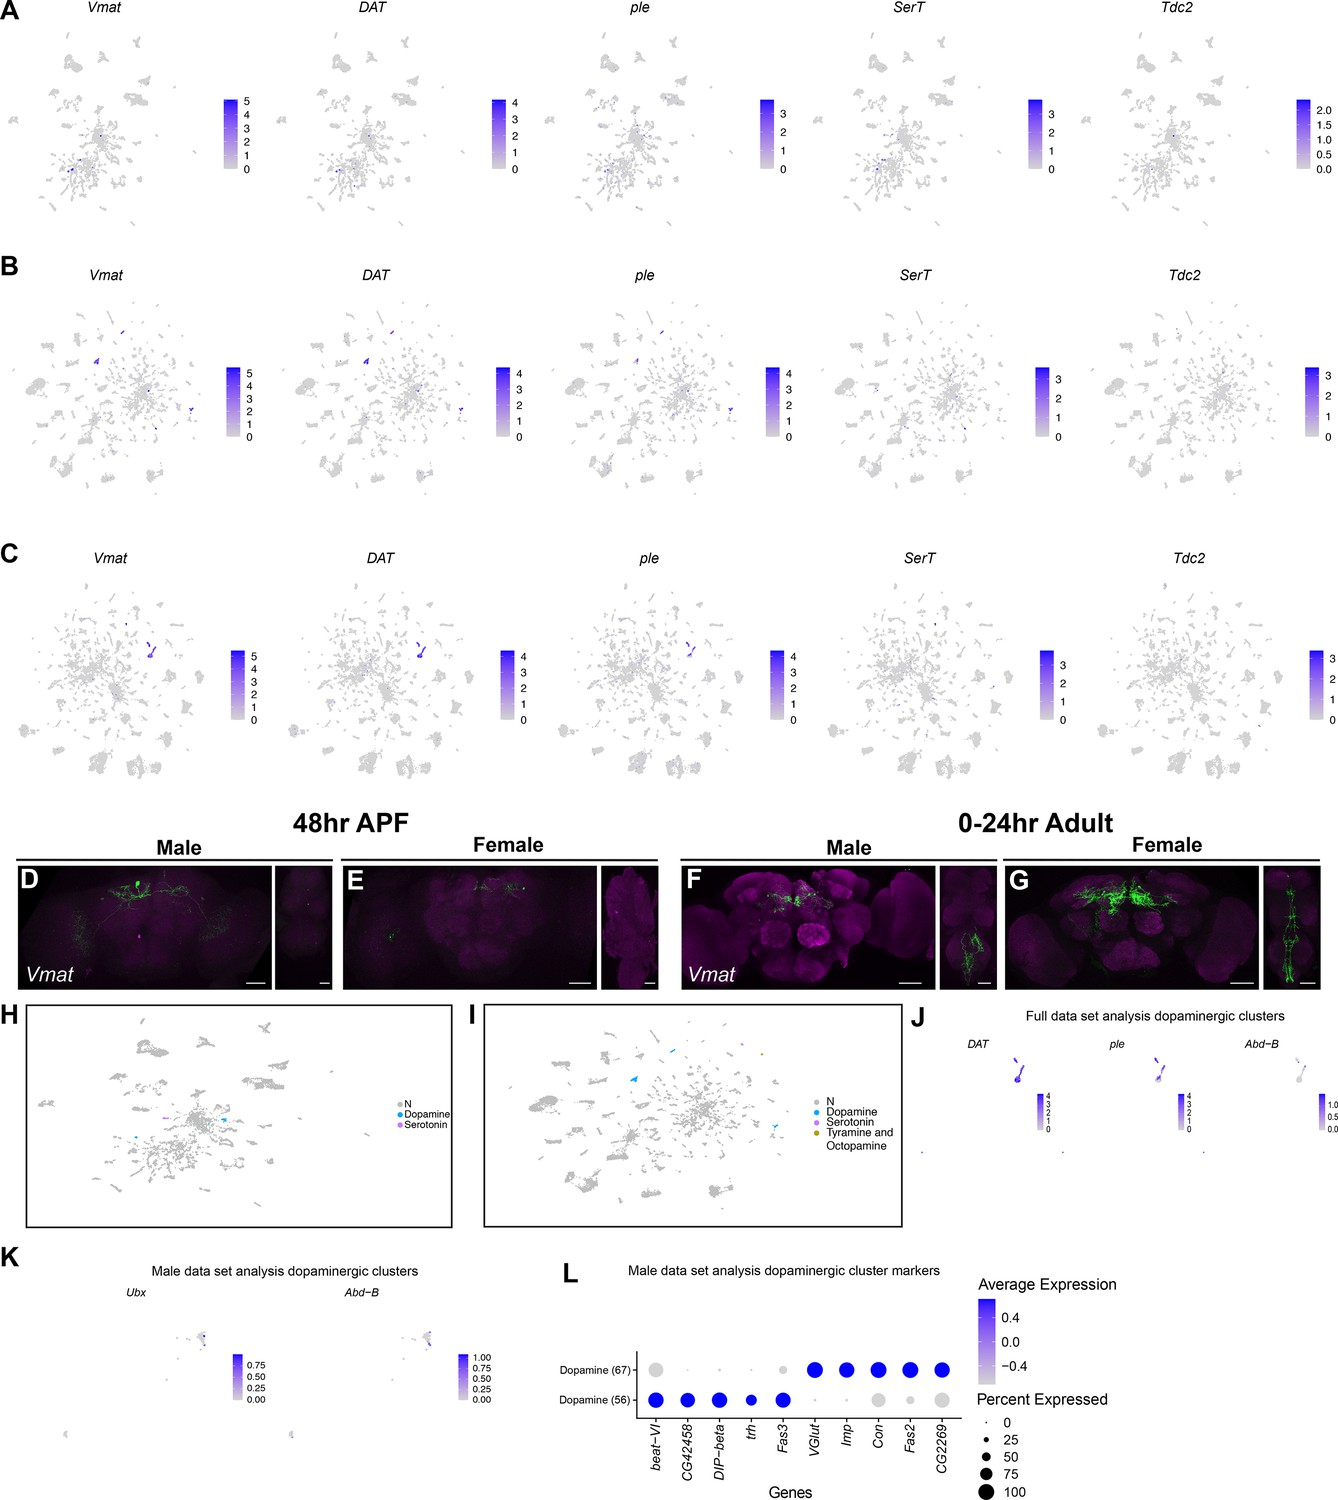
Expression of genes consistent with production of aminergic neurotransmitters.
(A–C) Gene expression feature plots for (A) full, (B) male, and (C) female data set Uniform Manifold Approximation and Projections (UMAPs) showing gene expression of Vmat (aminergic neurons) and biosynthetic enzymes or transporters for specific aminergic transmitters: dopamine (DAT and ple), serotonin (SerT), and octopamine (Tdc2). (D–G) Confocal maximum projections for Vmat ∩ fru P1 co-expressing neurons from males and females. Brain is on left and ventral nerve cord (VNC) is on right in each panel. (D, E) The images are from animals at 48-hr after puparium formation (APF) and (F, G) 0- to 24-hr adults. Scale bars = 50 μm. (H–I) UMAP plot showing aminergic cluster annotations in the male (H) and female (I) data sets (Source data 3). Color legend on right indicates clusters with aminergic marker gene expression, or no expression (gray, N). (J) Gene expression feature plots for dopaminergic neurons showing expression of DAT, ple, and Abd-B, in the full data set. (K) Gene expression feature plots for dopaminergic neurons showing expression of Ubx and Abd-B, in the male data set UMAP. The gene expression feature plots show gene expression levels in purple in the UMAP, with color intensity proportional to the log-normalized expression levels. (L) Dot plots of top 5 expressed genes in dopaminergic clusters, based on log fold-change in gene expression, in the male data set. Dot size indicates the percentage of neurons expressing each gene per cluster (Percent Expressed). Average normalized expression level is shown by color intensity (Average Expression).
Figure 7 with 3 supplements

Annotation of neurons that express circadian clock genes.
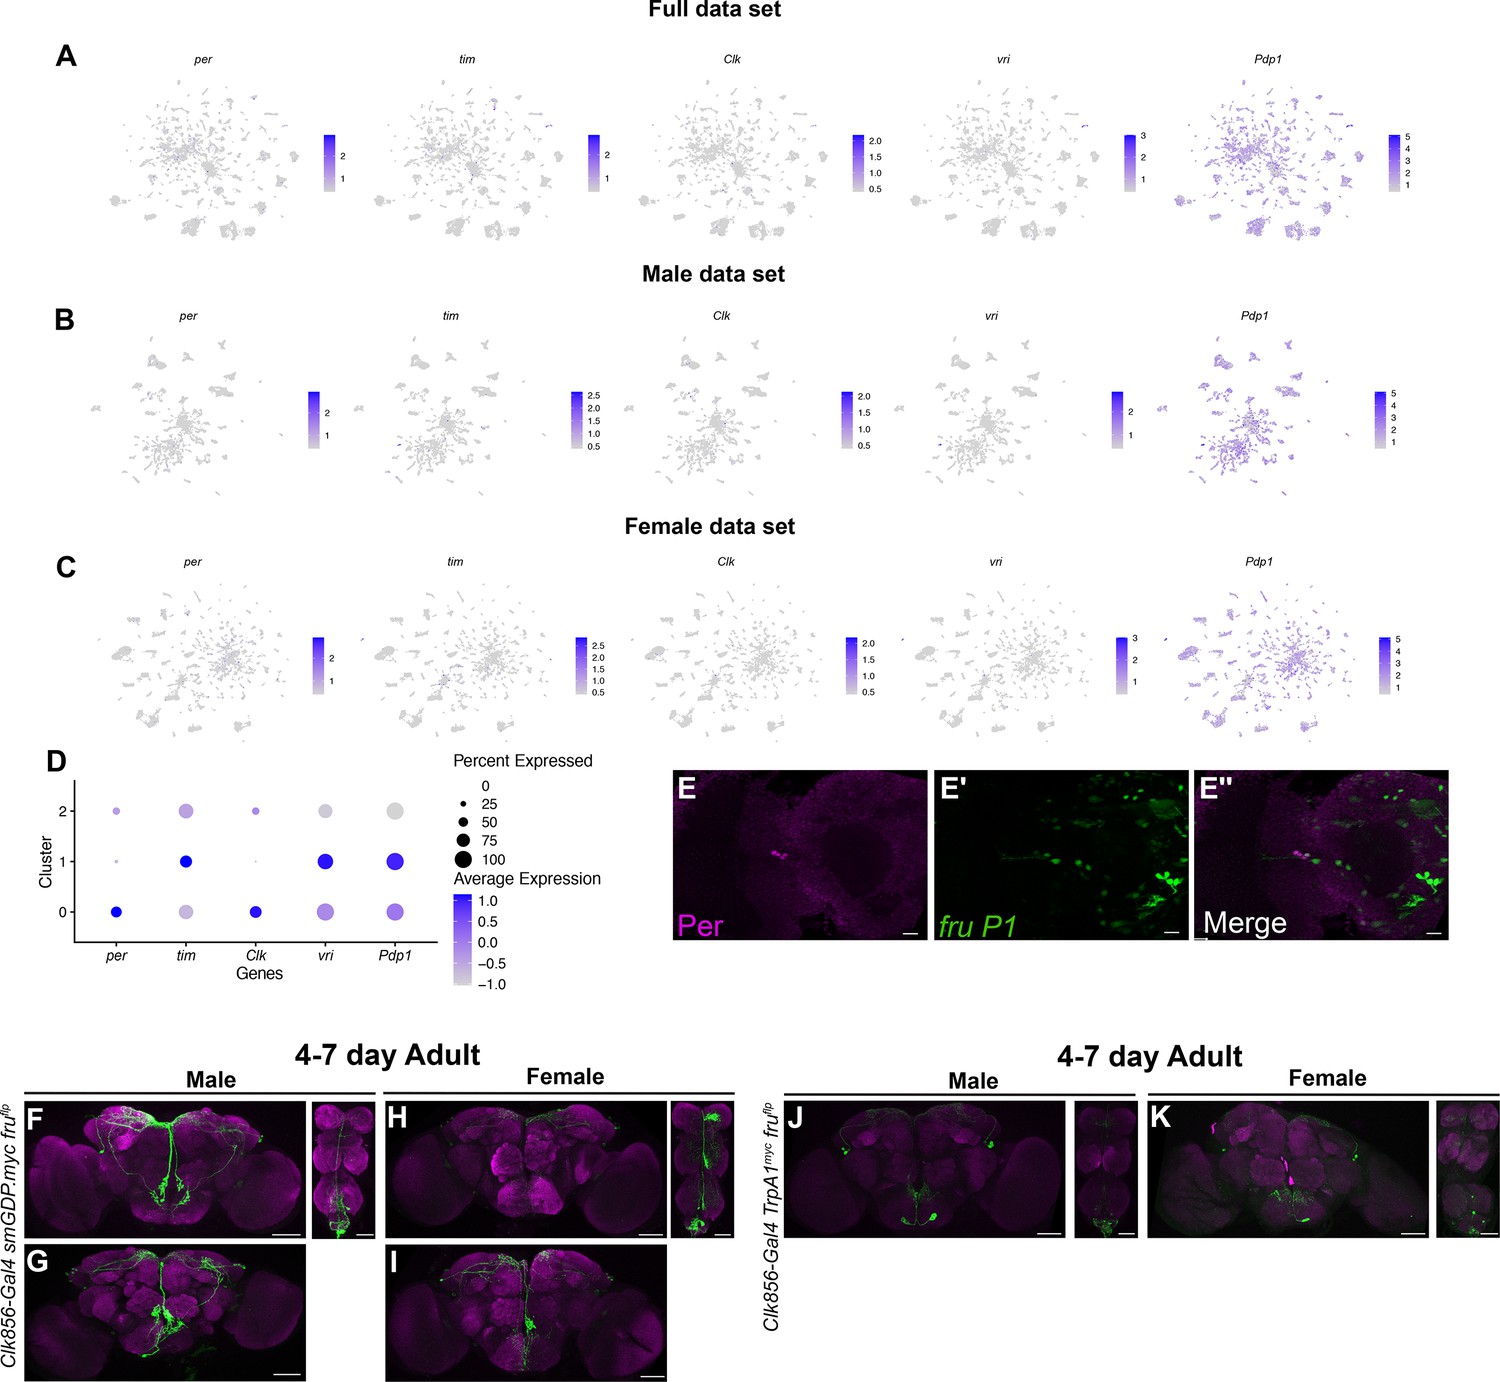
(A) Uniform Manifold Approximation and Projection (UMAP) plot showing clusters annotated as circadian clock neurons (blue), in full data set (Source data 3). (B) Subclustering analysis of neurons from annotated circadian clusters (colored clusters from panel A), defining three subclusters. (C) The three subclusters are shown with sex indicated by color. The male cells are in blue and female cells are in pink. (D) Dot plot of top 5 marker genes in each circadian subcluster based on log fold-change gene expression (Source data 3). Dot size indicates the percentage of neurons expressing each gene per cluster (Percent Expressed). Average normalized expression level is shown by color intensity (Average Expression). (E–E″) Confocal maximum projections of brains immunostained for Per (magenta) and fru P1>mcd8::GFP neurons, from 48-hr after puparium formation (APF) male pupae, at ×40 magnification. (E″) contains zoomed inset of fru P1>mcd8::GFP and Per (magenta) neurons in upper right. The right brain hemisphere is shown. (F) Brain and ventral nerve cord (VNC) confocal maximum projections for Clk856 ∩ fru P1 expression in 0- to 24-hr adult males (left) and females (right). Scale bars = 50 μm.
Figure 7—figure supplement 1
Visualization of circadian clock gene expression.
(A–C) Gene expression feature plots for full (A), male (B), and female (C) data set Uniform Manifold Approximation and Projections (UMAPs) showing expression of circadian genes (per, tim, Clk, vri, and Pdp1). The gene expression feature plots show gene expression levels in purple in the UMAP, with color intensity proportional to the log-normalized expression levels. (D) Dot plot of expression levels of genes with functions in the circadian molecular clock, in the circadian subclusters. Dot size indicates the percentage of neurons expressing each gene per cluster (Percent Expressed). Average normalized expression level is shown by color intensity (Average Expression). (E–E″) Confocal maximum projections of brains immunostained for Per (magenta) and fru P1>mcd8::GFP neurons, from 48-hr after puparium formation (APF) female pupae, at ×40 magnification. The left brain hemisphere is shown. (F–I) Confocal maximum projections of Clk856 ∩ fru P1 neurons in 4- to 7-day adult male (F, G) and female (H, I) brains and ventral nerve cords (VNCs) with UAS<stop<smGDP.myc transgene. Additional brains in G and I show the variation in expression. (J, K) Confocal maximum projections of Clk856 ∩ fru P1 neurons expressing UAS<stop<TrpA1Myc, immunostained for Myc, in 4- to 7-day adult male (F, G) and female (H, I) brains and VNCs. Scale bars = 50 μm.
Figure 7—figure supplement 2
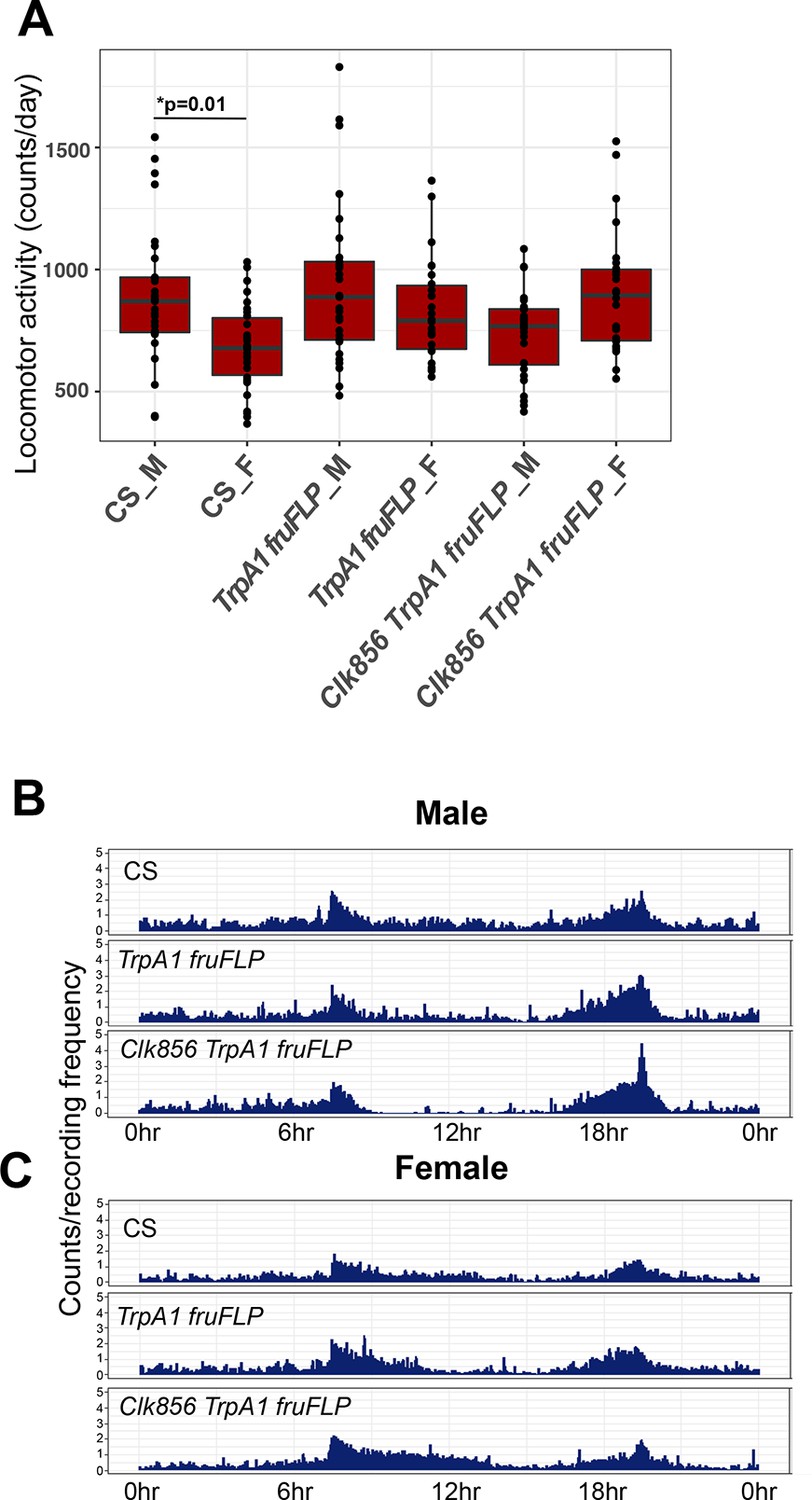
Activating Clk856 ∩ fru P1 neurons effects locomotor activity in light:dark (LD).
(A) Boxplots showing average locomotor activity per individual (beam crosses), per day, for each genotype and sex (n = 26–30). The top and bottom of the box in the boxplot indicate 25th and 75th percentiles. (B, C) Actograms showing average locomotor activity, over 24 hr, during day 6 of the 10 days analyzed for males (B) and females (C). Lights on is at 8 hr (ZT0) and lights off is at 20 hr (ZT12), in the light–dark cycle. The genotypes of the flies assayed are: Canton S (CS), w; UAS <stop < TrpA1Myc; fruFLP/+ (TrpA1 fruFLP), and w; UAS <stop < TrpA1Myc/Clk856-Gal4; fruFLP/+ (Clk856 TrpA1 fruFLP). Sex is indicated after genotype by ‘M’ for male or ‘F’ for female. One-way analysis of variance (ANOVA) with Tukey-HSD post hoc tests were used for statistical analyses for comparisons across genotype in panel A. *p < 0.05.
Figure 7—figure supplement 3
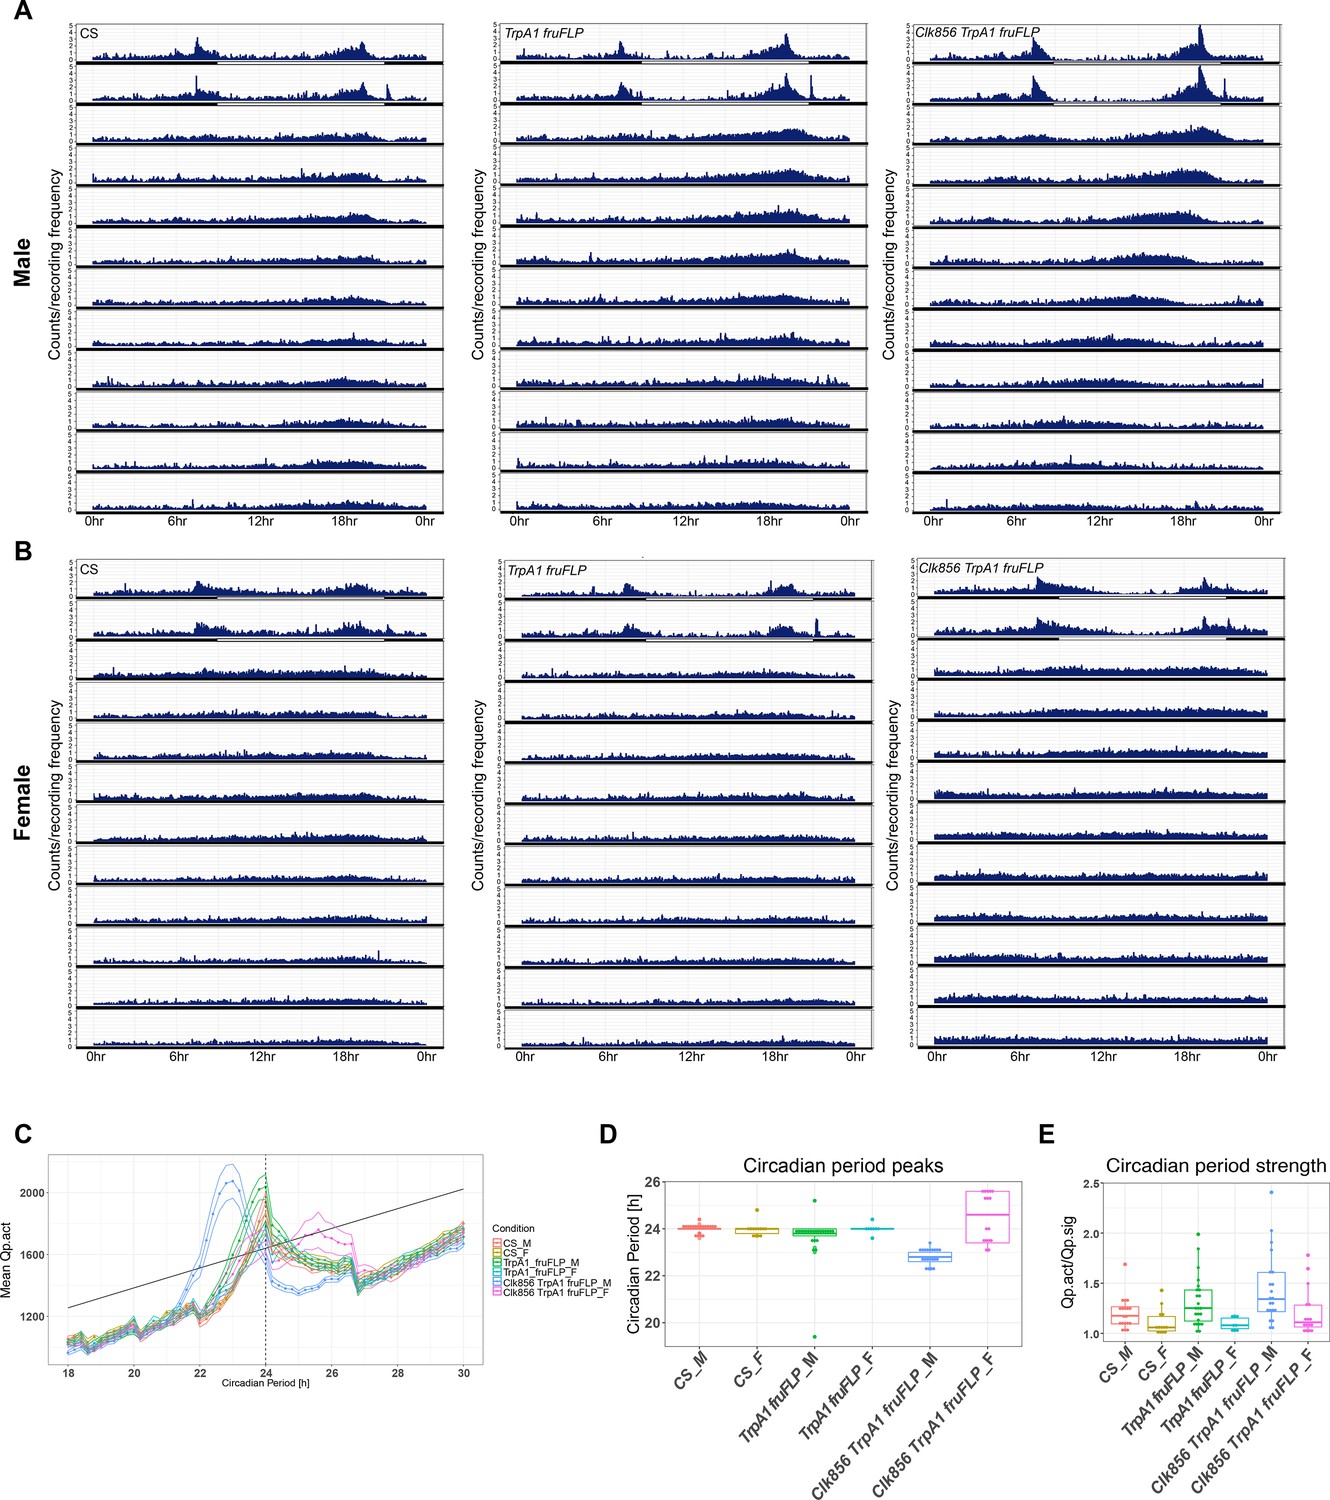
Activating Clk856 ∩ fru P1 neurons impacts circadian period length and strength in DD.
(A–B) Actograms showing average locomotor activity across all flies for each genotype, over 24 hr, during 2 days of light:dark (LD) followed by 10 days of DD for males (A) and females (B). Lights on is at 8 hr (ZT0) and lights off is at 20 hr (ZT12), in the light–dark cycle. (C) Chi-square periodogram for all genotypes. Lines above and below the dotted line indicate standard error of the mean (SEM). (D) Circadian period peaks for individual flies of each genotype (indicated by a dot). (E) Circadian period strength for individual flies of each genotype. The genotypes of the flies assayed are: Canton S (CS), w; UAS <stop < TrpA1Myc; fruFLP/+ (TrpA1 fruFLP), and w; UAS <stop < TrpA1Myc/Clk856-Gal4; fruFLP/+ (Clk856 TrpA1 fruFLP). Sex is indicated after genotype by ‘M’ for male or ‘F’ for female.
Figure 8 with 1 supplement
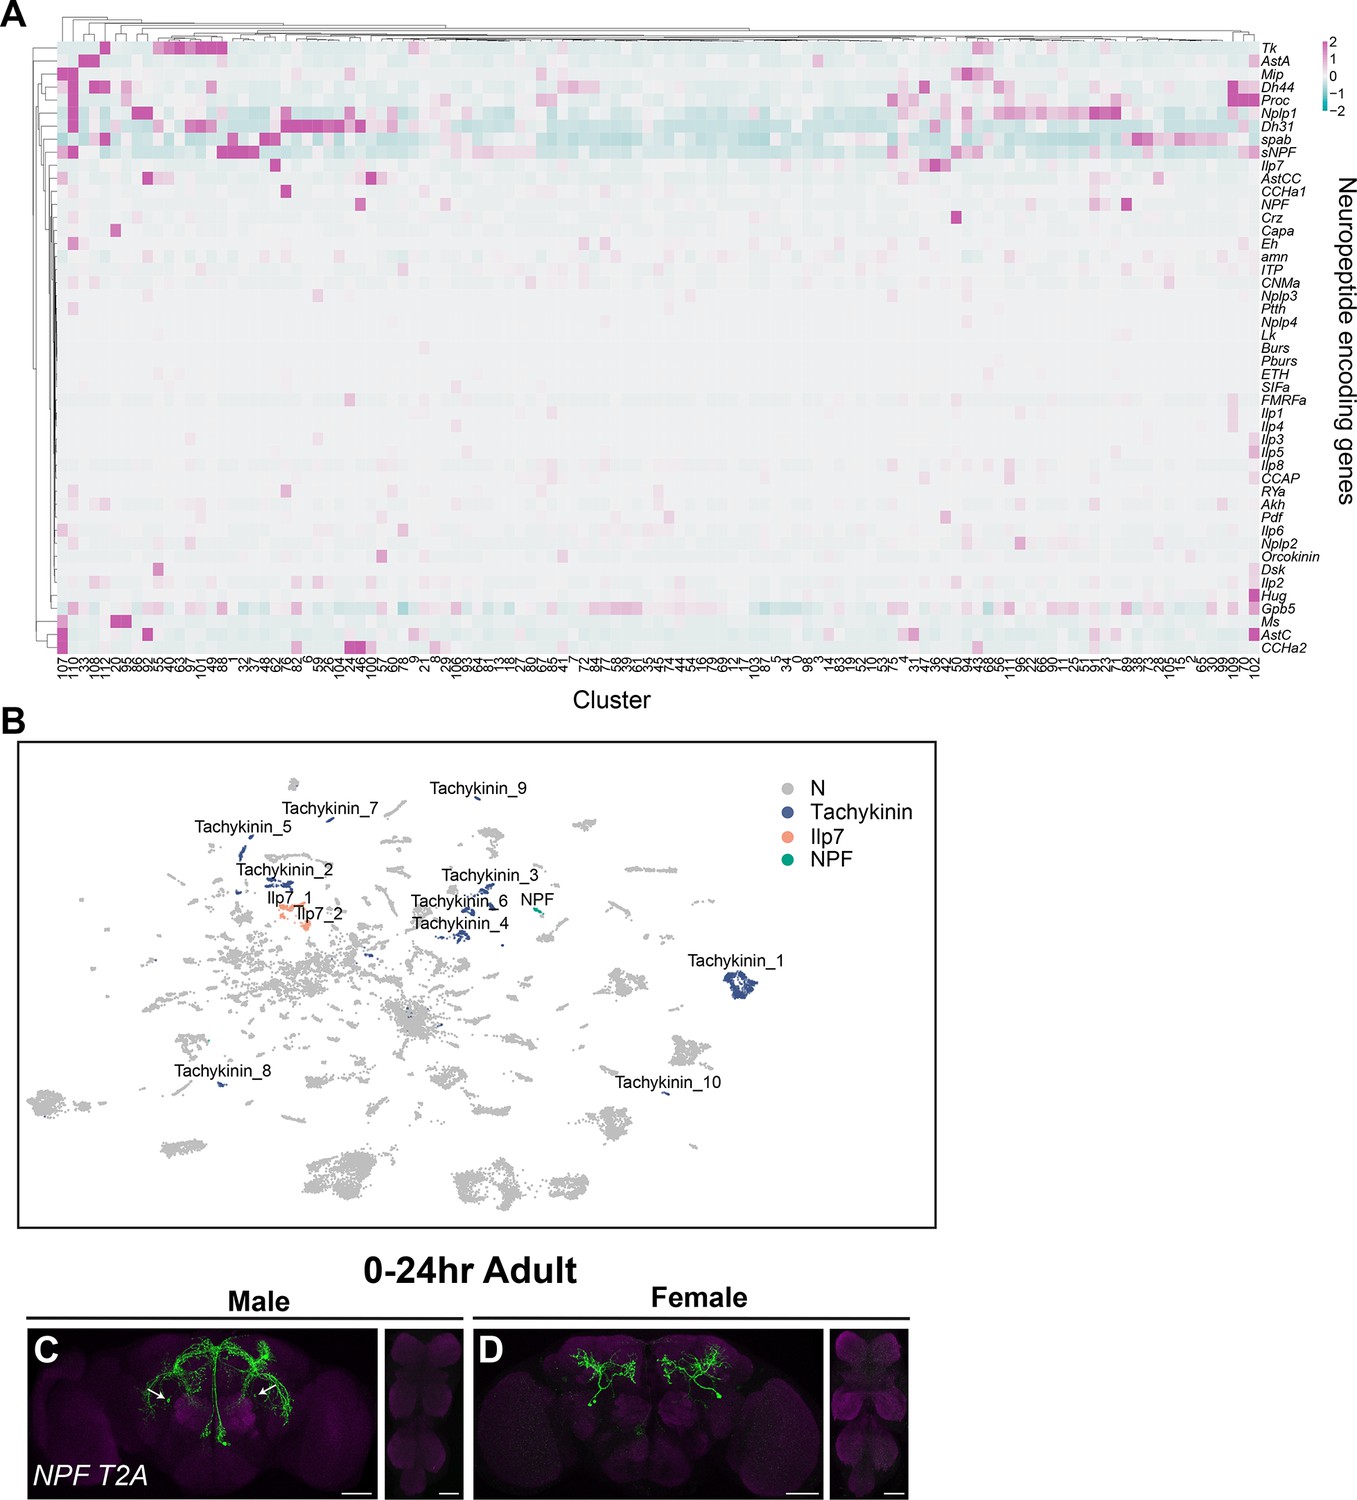
Annotation of neurons that express neuropeptides.
(A) Heatmap of log-normalized gene expression for neuropeptide-encoding genes. Gene expression values were mean scaled and log normalized. (B) Uniform Manifold Approximation and Projection (UMAP) plot showing annotated clusters with neurons that produce neuropeptides with known roles in fru P1 neurons for directing reproductive behavior, in the full data set (Source data 3). (C, D) Confocal maximum projections of brains and ventral nerve cord (VNC) showing NPF ∩ fru P1 expression in 0- to 24-hr adult males and females, using an NPF-T2A-Gal4 driver (Deng et al., 2019). White arrows on male brain indicate male-specific NPF ∩ fru P1 neurons that have been previously identified (Liu et al., 2019). Scale bars = 50 μm.
Figure 8—figure supplement 1
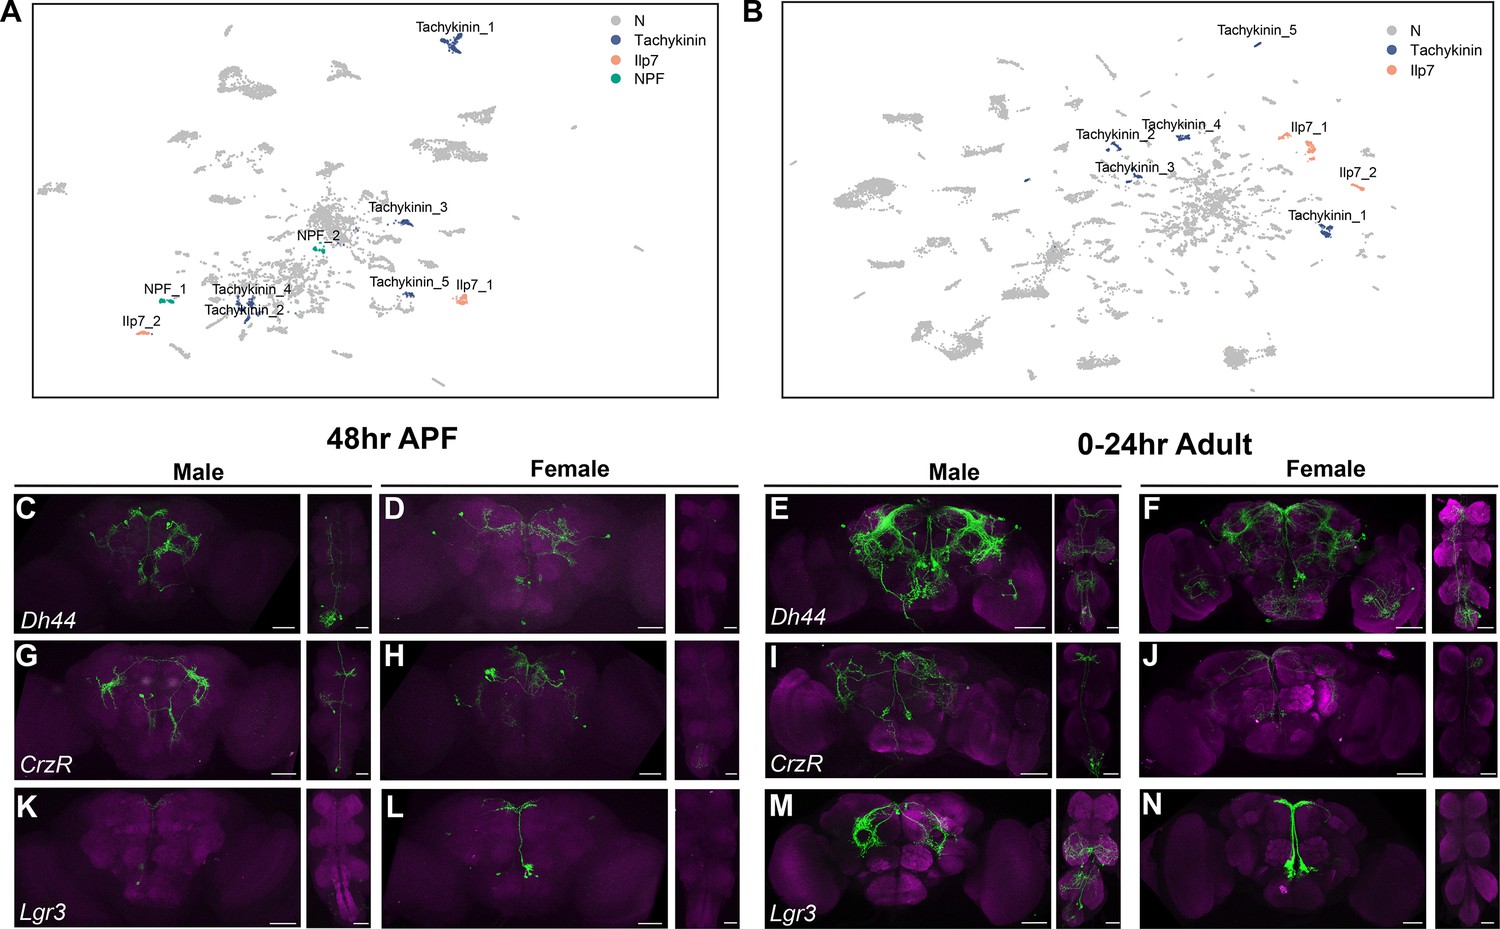
Annotation of neurons that express neuropeptides in males and females.
(A–B) Uniform Manifold Approximation and Projection (UMAP) plot showing annotated clusters with neurons that produce neuropeptides with known roles in fru P1 neurons for directing reproductive behavior, in the male data set UMAP (A) and female data set UMAP (B) (Source data 3). (C–N) Brain and ventral nerve cord (VNC) confocal maximum projections showing intersecting expression patterns (in green), for males and females, as indicated. The patterns of Dh44 ∩ fru P1, CrzR ∩ fru P1, and Lgr3 ∩ fru P1 neurons are shown. Scale bars = 50 μm.
Figure 9

nAChR subunit gene expression in fru P1 neurons.
Heatmap showing correlation of nAChR subunit gene expression in neurons in the male data set (A), female data set (B), and full data set (C). Pearson’s r values denoted on heatmap with color, according to legends. (D–S) Confocal maximum projections of brain and ventral nerve cord (VNC) for nAChRα ∩ fru P1-expressing neurons, with intersecting expression shown in green for males and females, as indicated. Male and female animals from 48-hr after puparium formation (APF) and 0- to 24-hr adults are shown, as indicated. Scale bars = 50 μm.
Figure 10
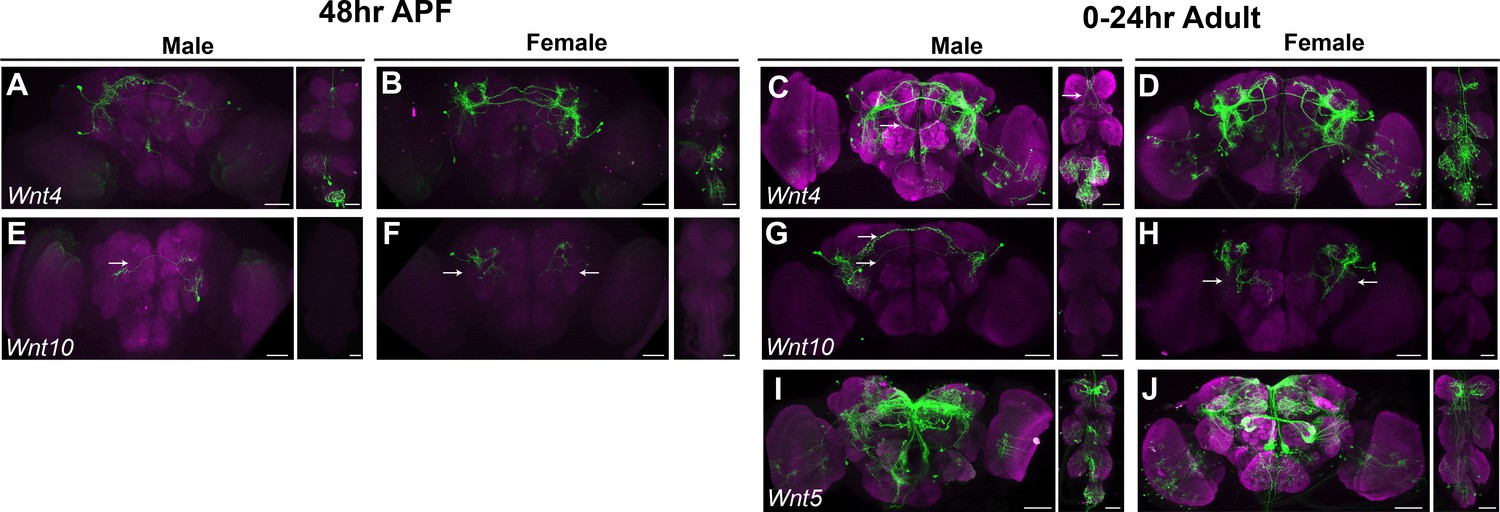
Wnt ∩ fru P1 expression patterns.
(A–J) Brain and ventral nerve cord (VNC) confocal maximum projections showing intersecting expression patterns (in green), for males and females, as indicated. The patterns of Wnt4 ∩ fru P1, Wnt10 ∩ fru P1, and Wnt5 ∩ fru P1 neurons are shown. Scale bars = 50 μm. The Wnt5 stock was not available to perform expression analyses at 48-hr after puparium formation (APF) due to the stock being unhealthy.
Figure 11 with 1 supplement
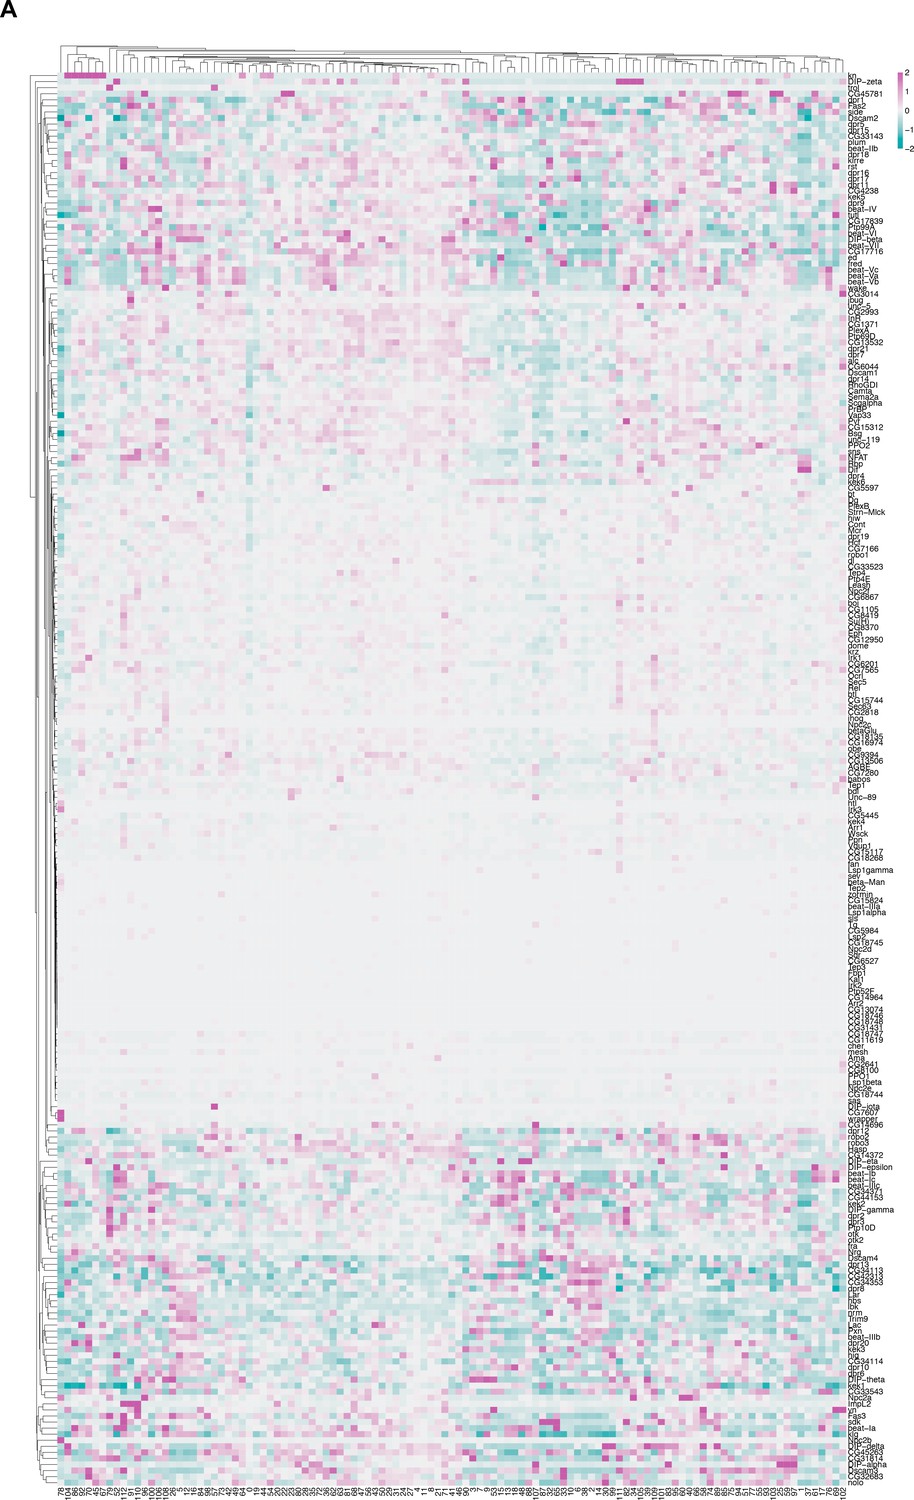
IgSF gene expression in fru P1 neurons.
(A) Heatmap of log-normalized gene expression for IgSF-encoding genes. Gene expression values were mean scaled and log normalized.
Figure 11—figure supplement 1
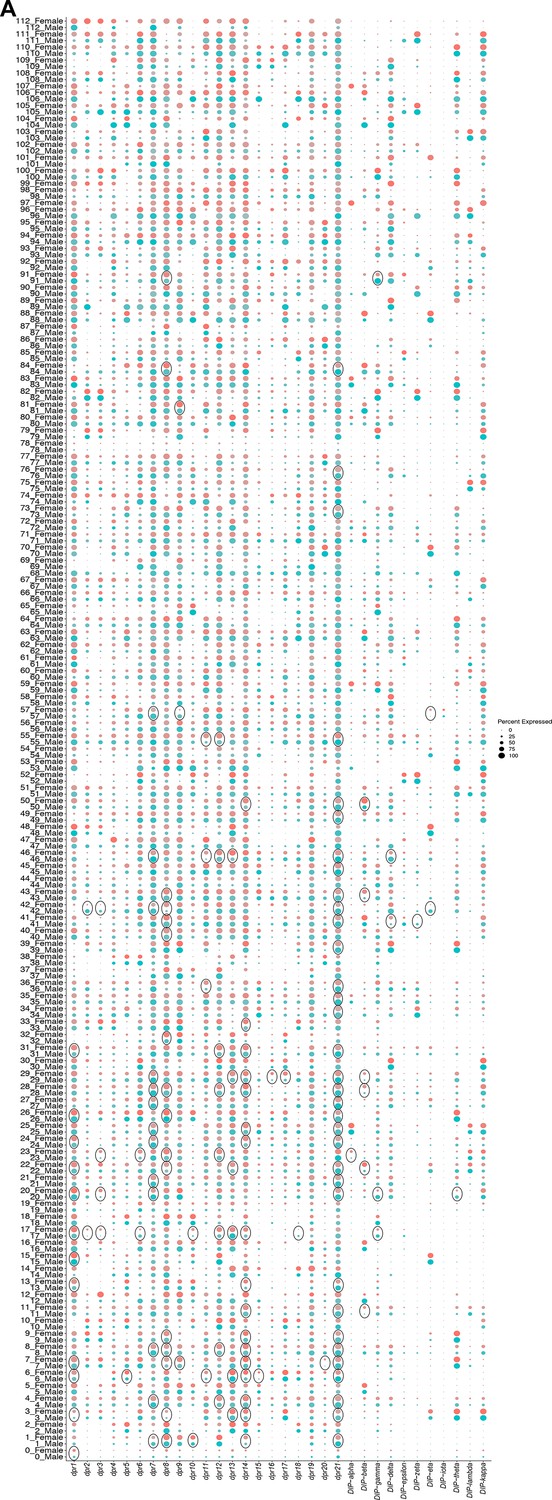
Sex differences in dpr/DIP gene expression in fru P1 neurons.
(A) Dot plot split by sex for all dpr and DIP genes. Dot size indicates the percentage of neurons expressing each gene per cluster (Percent Expressed). Male expression is shown in blue and female expression is shown in pink. Black circles indicate clusters where dpr/DIP genes are sex-differentially expressed (Source data 9).
Figure 12 with 4 supplements
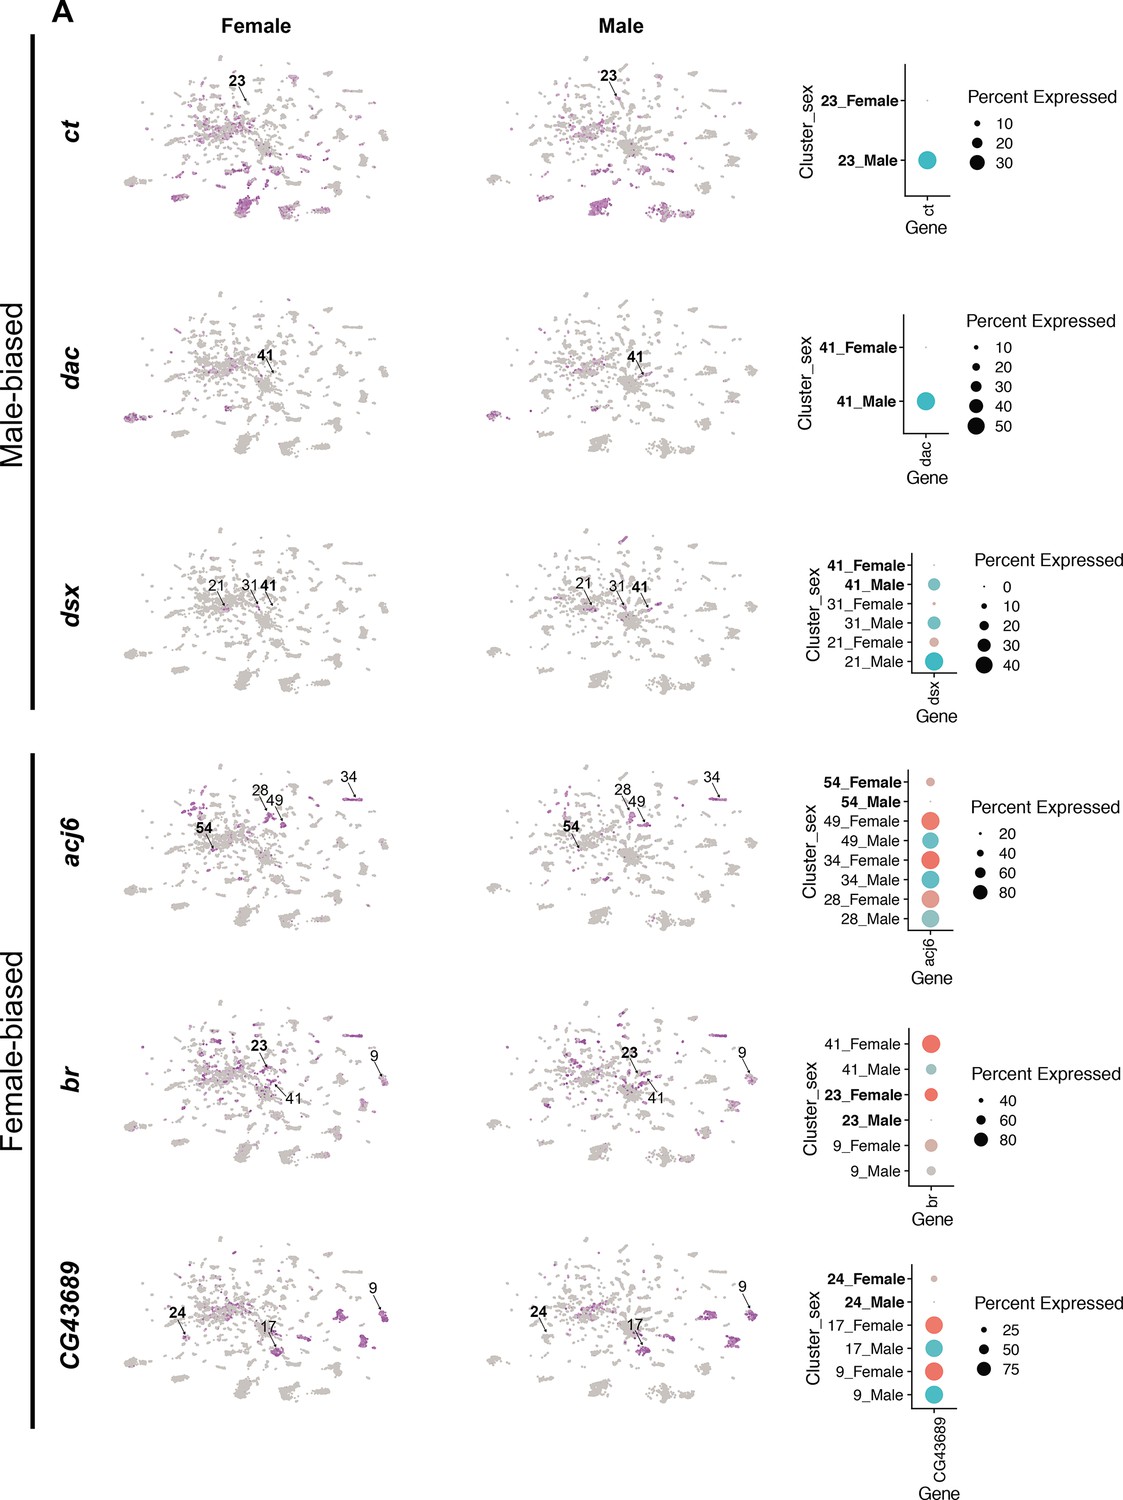
Sex differences in transcription factor (TF) expression in fru P1 neurons.
(A) Gene expression feature plots showing gene expression in neurons for TFs that have significant sex-biased gene expression within single-cell clusters between female (left; top three) and male (right; top three). Top sex-biased TFs determined by log FC in Source data 9. The top three male-biased TFs shown are: ct, dac, and dsx. The top three female-biased TFs shown are: acj6, br, and CG43689. Bold cluster numbers in the dot plot indicate the cluster where the gene had the sex-differential expression detection in the top three for each sex. A dot plot representation for all TF genes that have cluster-specific sex-biased marker gene expression is shown in Figure 12—figure supplement 4.
Figure 12—figure supplement 1
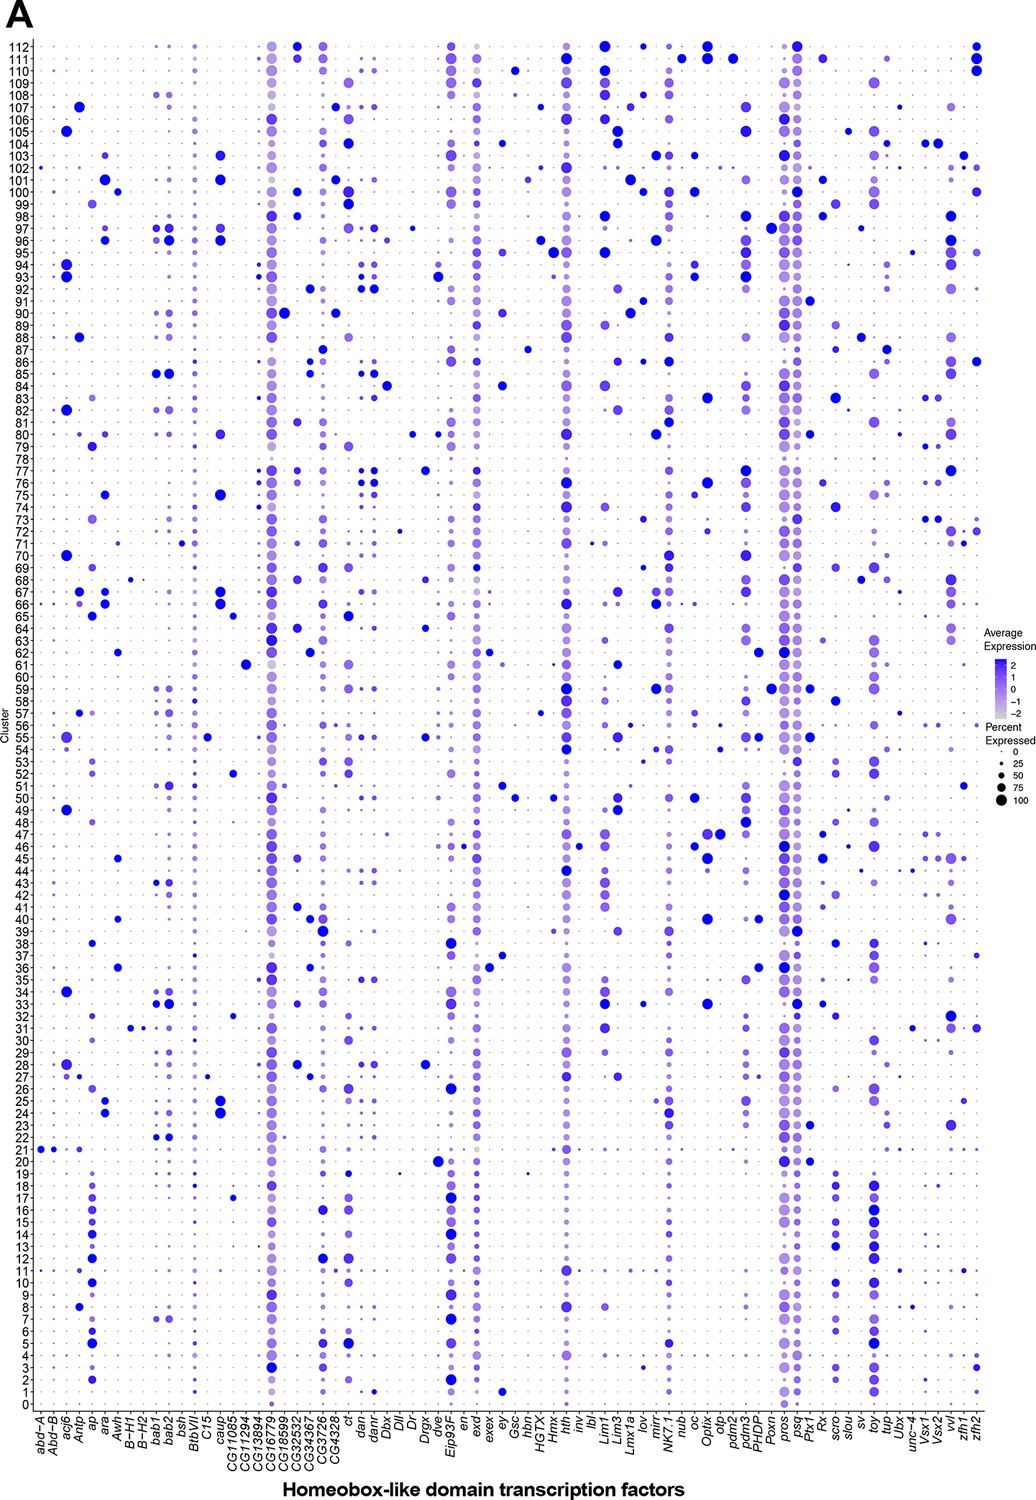
Homeobox-like domain superfamily transcription factor (TF) expression in fru P1 neurons.
(A) Dot plot of homeobox-like domain superfamily TF-encoding marker gene expression in full data set analysis clusters. Dot size indicates the percentage of neurons expressing each gene per cluster (Percent Expressed). Average normalized expression level is shown by color intensity (Average Expression).
Figure 12—figure supplement 2
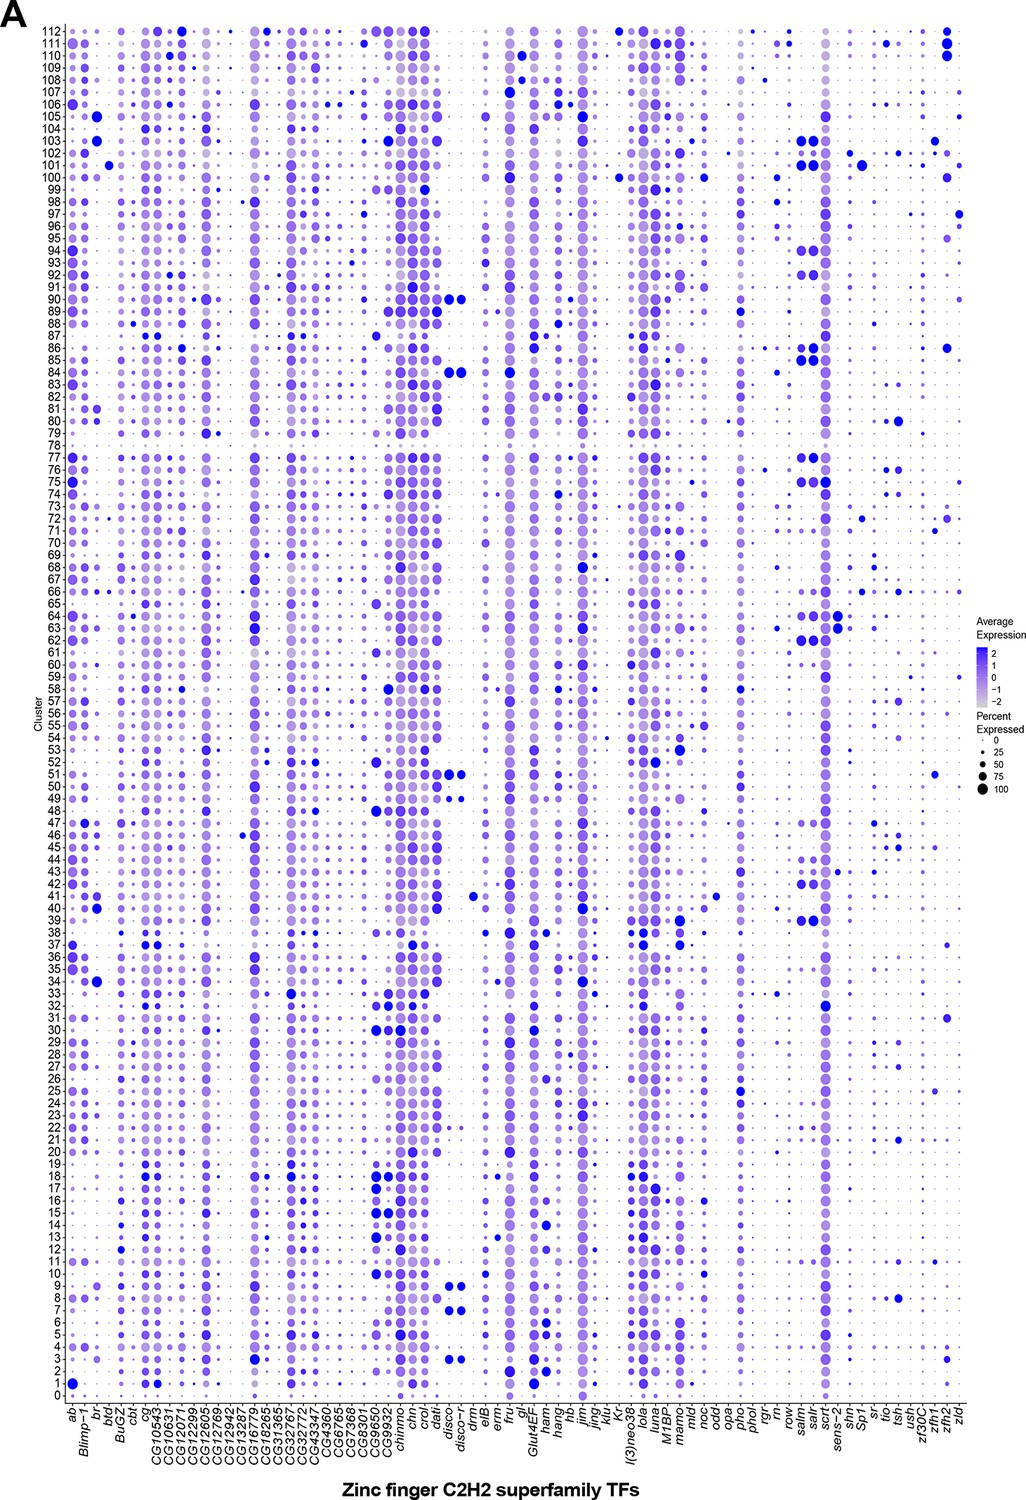
Zinc finger C2H2 transcription factor (TF) expression in fru P1 neurons.
A) Dot plot of homeobox domain TF-encoding marker gene expression in full data set analysis clusters. Dot size indicates the percentage of neurons expressing each gene per cluster (Percent Expressed). Average normalized expression level is shown by color intensity (Average Expression).
Figure 12—figure supplement 3
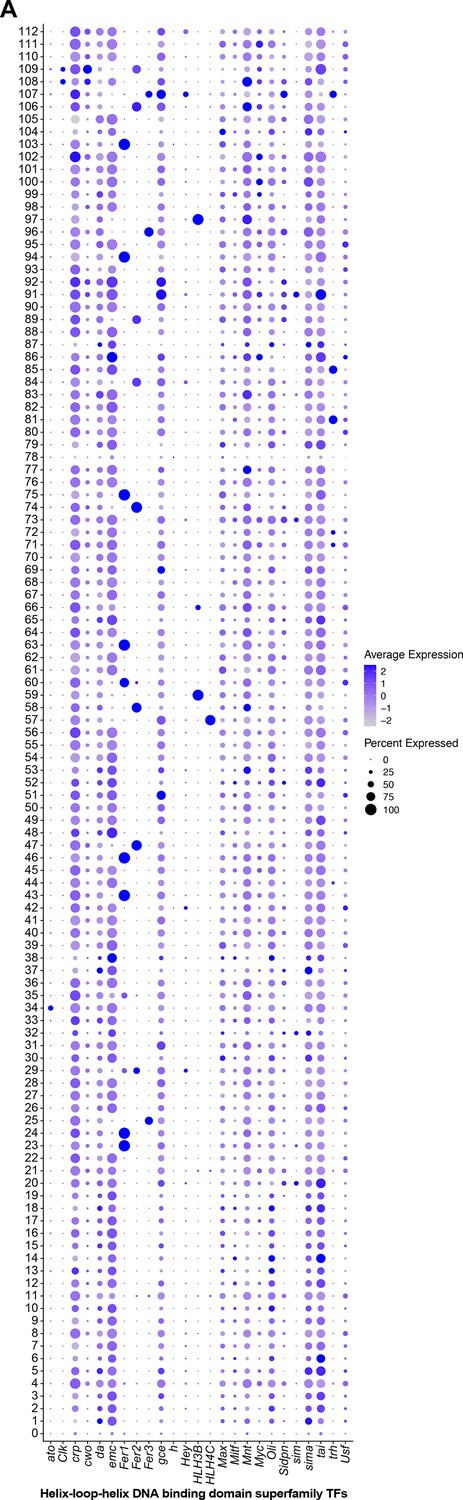
Helix–loop–helix (HLH) DNA-binding domain superfamily expression in fru P1 neurons.
(A) Dot plot of HLH DNA-binding domain transcription factor (TF)-encoding marker gene expression in full data set analysis clusters. Dot size indicates the percentage of neurons expressing each gene per cluster (Percent Expressed). Average normalized expression level is shown by color intensity (Average Expression).
Figure 12—figure supplement 4
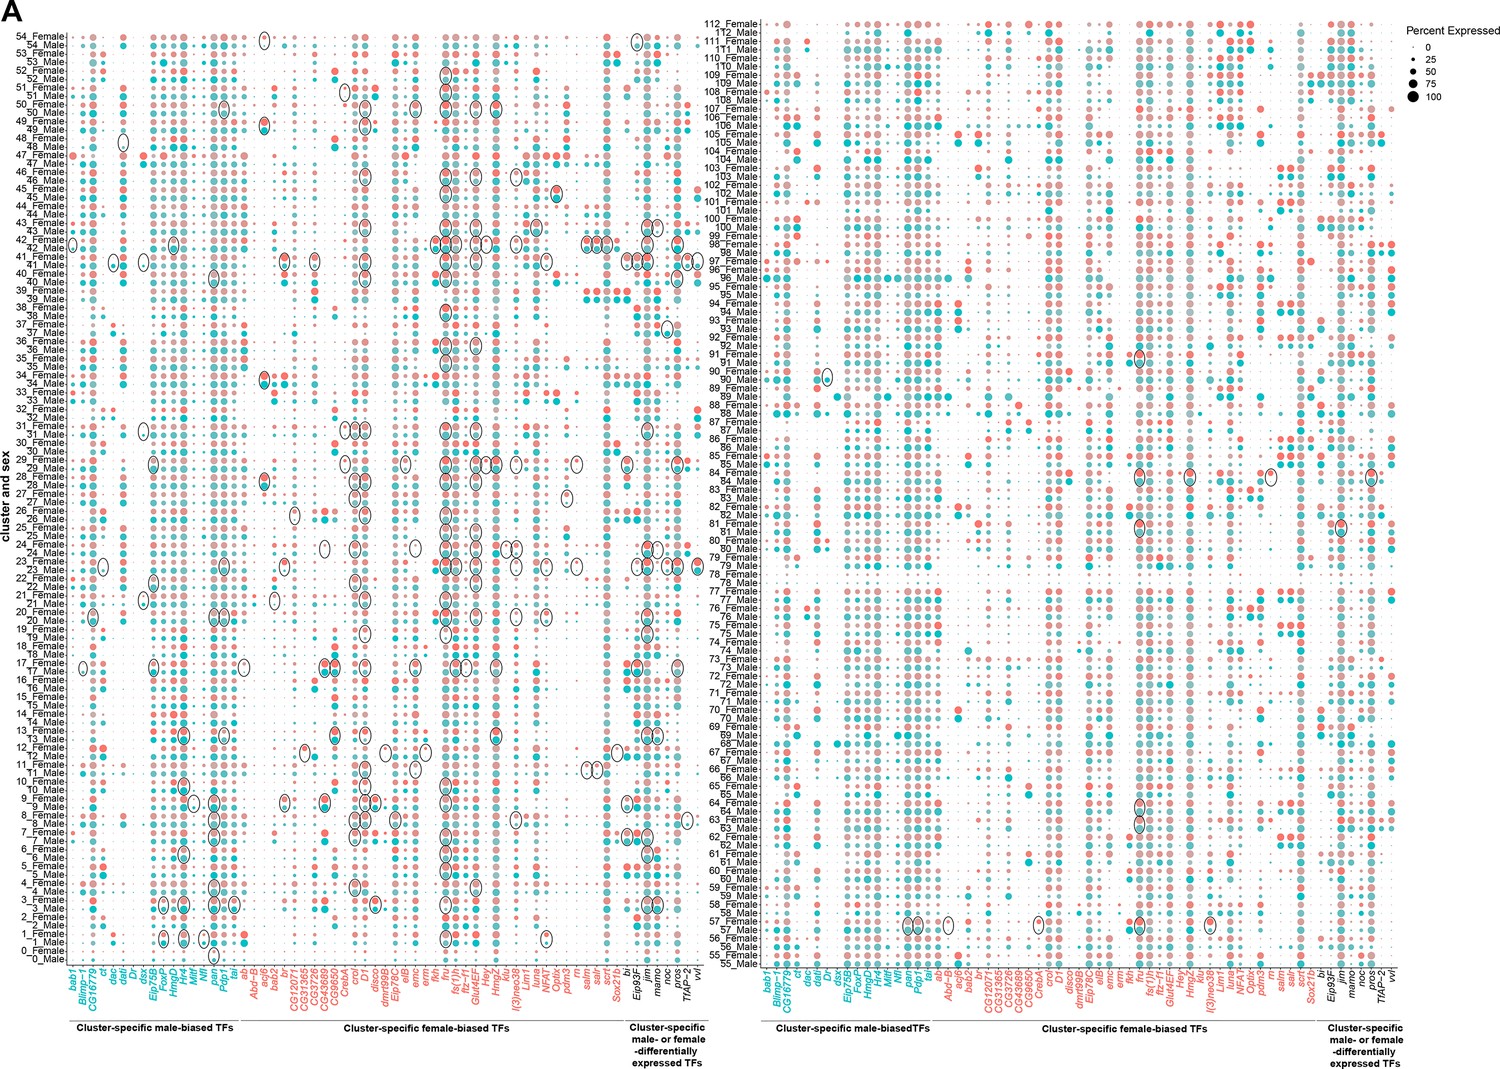
Sex differences in transcription factor (TF) expression in fru P1 neurons.
(A) Dot plot split by sex for TF genes that have cluster-specific sex-biased marker gene expression. On the X-axis, marker genes in blue only have male-biased, cluster-specific expression (17 genes). On the X-axis, marker genes in red only have female-biased, cluster-specific expression (38 genes). On the X-axis, marker genes in black have either male-biased expression in some cluster(s) and female-biased expression in other cluster(s) (8 genes). Dot size indicates the percentage of neurons expressing each gene per cluster (Percent Expressed). Male expression is shown in blue and female expression is shown in pink. Black circles indicate clusters where TFs are sex-differentially expressed (Source data 9).
Tables
Key resources table
| Reagent type (species) or resource | Designation | Source or reference | Identifiers | Additional information |
|---|---|---|---|---|
| Genetic reagent (D. melanogaster) | fru P1-Gal4 | Provided by Baker lab PMID:15959468 | fruP1-GAL4 | |
| Genetic reagent (D. melanogaster) | Canton S | Ulrike Heberlein | Wild type | +/+;+/+;+/+ (Canton S) |
| Genetic reagent (D. melanogaster) | fru P1FLP | Donor: Barry Dickson, Howard Hughes Medical Institute, Janelia Research Campus | RRID:BDSC66870 | w[*]; TI{FLP}fru[FLP]/T+D6:D27+D6:D18M3, Sb[1] |
| Genetic reagent (D. melanogaster) | 10XUAS-IVS-mCD8::GFP | Donor: Gerald M. Rubin & Barret Pfeiffer, Howard Hughes Medical Institute, Janelia Research Campus | RRID:BDSC_32186 | w[*]; P{y[+t7.7] w[+mC]=10XUAS-IVS-mCD8::GFP}attP40 |
| Genetic reagent (D. melanogaster) | 10xUAS >stop > myr::smGdP-cMyc | Pfeiffer, B., Rubin, G. (2014.4.16). Recombinase and tester constructs and insertions. | RRID:BDSC_62125 | w[1118]; P{y[+t7.7] w[+mC]=10xUAS(FRT.stop)myr::smGdP-cMyc}attP40 |
| Genetic reagent (D. melanogaster) | UAS >stop > TrpA1Myc | Barry Dickson Stocks. Flybase ID: FBrf0234603 | RRID:BDSC_66871 | P{UAS(FRT.stop)TrpA1myc}VIE-260B |
| Genetic reagent (D. melanogaster) | Lgr3-Gal4 | Donor: Bruce Baker, Howard Hughes Medical Institute, Janelia Research Campus; Donor's Source: James Truman, Howard Hughes Medical Institute, Janelia Research Campus | RRID:BDSC_66683 | w[*]; P{y[+t7.7] w[+mC]=Lgr3-GAL4::VP16}attP40/CyO |
| Genetic reagent (D. melanogaster) | NPF-Gal4 | Donor: Paul Garrity, Brandeis University & Bowen Deng, National Institute of Biological Sciences; Donor's Source: Yi Rao, National Institute of Biological Sciences | RRID:BDSC_84671 | w[*]; TI{2 A-GAL4}NPF[2 A-GAL4]/TM6B, Tb[1] |
| Genetic reagent (D. melanogaster) | Wnt10-Gal4 | Donor: Hugo J. Bellen, Baylor College of Medicine; Donor's Source: Gene Disruption Project | RRID:BDSC_86484 | y[1] w[*]; TI{GFP[3xP3.cLa]=CRIMIC.TG4.2}Wnt10[CR01661-TG4.2]/SM6a |
| Genetic reagent (D. melanogaster) | Wnt4-Gal4 | Donor: Gene Disruption Project; Donor's Source: Hugo J. Bellen, Baylor College of Medicine | RRID:BDSC_67449 | y[1] w[*]; Mi{Trojan-GAL4.2}Wnt4[MI03717-TG4.2] |
| Genetic reagent (D. melanogaster) | Wnt5-Gal4 | Donor: Huey Hing, State University of New York, Brockport | RRID:BDSC_59034 | w[*] TI{w[+mC]=GAL4}Wnt5[Gal4] |
| Genetic reagent (D. melanogaster) | Vmat-Gal4 | Donor: Gene Disruption Project; Donor's Source: Hugo J. Bellen, Baylor College of Medicine | RRID:BDSC_66806 | y[1] w[*]; Mi{Trojan-GAL4.0}Vmat[MI07680-TG4.0] |
| Genetic reagent (D. melanogaster) | ChAT-Gal4 | Donor: Paul Garrity, Brandeis University & Bowen Deng, National Institute of Biological Sciences; Donor's Source: Yi Rao, National Institute of Biological Sciences | RRID:BDSC_84618 | TI{2 A-GAL4}ChAT[2 A-GAL4]/TM3, Sb[1] |
| Genetic reagent (D. melanogaster) | CrzR-Gal4 | Donor: Paul Garrity, Brandeis University & Bowen Deng, National Institute of Biological Sciences; Donor's Source: Yi Rao, National Institute of Biological Sciences | RRID:BDSC_84621 | w[*]; TI{2 A-GAL4}CrzR[2A-B.GAL4]/TM3, Sb[1] |
| Genetic reagent (D. melanogaster) | CCHa2-Gal4 | Donor: Paul Garrity, Brandeis University & Bowen Deng, National Institute of Biological Sciences; Donor's Source: Yi Rao, National Institute of Biological Sciences | RRID:BDSC_84602 | w[*]; TI{2 A-GAL4}CCHa2[2 A-GAL4]/TM3, Sb[1] |
| Genetic reagent (D. melanogaster) | Dh44-Gal4 | Donor: Paul Garrity, Brandeis University & Bowen Deng, National Institute of Biological Sciences; Donor's Source: Yi Rao, National Institute of Biological Sciences | RRID:BDSC_84627 | w[*]; TI{2 A-GAL4}Dh44[2 A-GAL4]/TM3, Sb[1] |
| Genetic reagent (D. melanogaster) | nAChR⍺1 Gal4 | Donor: Paul Garrity, Brandeis University & Bowen Deng, National Institute of Biological Sciences; Donor's Source: Yi Rao, National Institute of Biological Sciences | RRID:BDSC_84662 | TI{2 A-GAL4}nAChRalpha1[2A-AC.GAL4]/TM6B, Tb[1] |
| Genetic reagent (D. melanogaster) | nAChR⍺2 Gal4 | Donor: Paul Garrity, Brandeis University & Bowen Deng, National Institute of Biological Sciences; Donor's Source: Yi Rao, National Institute of Biological Sciences | RRID:BDSC_84663 | w[*]; TI{2 A-GAL4}nAChRalpha2[2 A-GAL4]/TM3, Sb[1] |
| Genetic reagent (D. melanogaster) | nAChR⍺3 Gal4 | Donor: Paul Garrity, Brandeis University & Bowen Deng, National Institute of Biological Sciences; Donor's Source: Yi Rao, National Institute of Biological Sciences | RRID:BDSC_84664 | w[*] TI{2 A-GAL4}nAChRalpha3[2 A-GAL4] |
| Genetic reagent (D. melanogaster) | nAChR⍺6 Gal4 | Donor: Paul Garrity, Brandeis University & Bowen Deng, National Institute of Biological Sciences; Donor's Source: Yi Rao, National Institute of Biological Sciences | RRID:BDSC_84665 | TI{2 A-GAL4}nAChRalpha6[2 A-GAL4]/CyO |
| Genetic reagent (D. melanogaster) | VGAT-Gal4 | Donor: Paul Garrity, Brandeis University & Bowen Deng, National Institute of Biological Sciences; Donor's Source: Yi Rao, National Institute of Biological Sciences | RRID:BDSC_84696 | TI{2 A-GAL4}VGAT[2 A-GAL4]/CyO |
| Genetic reagent (D. melanogaster) | VGlut-Gal4 | Donor: Paul Garrity, Brandeis University & Bowen Deng, National Institute of Biological Sciences; Donor's Source: Yi Rao, National Institute of Biological Sciences | RRID:BDSC_84697 | TI{2 A-GAL4}VGlut[2 A-GAL4]/CyO |
| Genetic reagent (D. melanogaster) | Clk856-Gal4 | Obtained from Michael Rosbash | w; CLK856-Gal4/Cyo; MKRS/TM6B | |
| Antibody | Rat polyclonal | Sanders and Arbeitman, 2008 | RRID:AB_2569440 | anti-FruM; 1:200 in TNT |
| Antibody | Rabbit polyclonal | Obtained from Michael Rosbash | RRID:AB_2315101 | anti-Per; 1:500 in TNT |
| Antibody | Rabbit polyclonal | Abcam | RRID:AB_307014 | anti-Myc; 1:6050 in TNT |
| Antibody | Mouse monoclonal | Developmental Studies Hybridoma Bank | RRID:AB_2314866 | anti-NC82; 1:20 in TNT |
| Antibody | Mouse monoclonal | Developmental Studies Hybridoma Bank | RRID:AB_528440 | anti-Prospero(MR1A); 1:100 in TNT |
| Antibody | Rabbit polyclonal | Invitrogen | RRID:AB_221477 | anti-GFP 488; 1:600 in TNT |
| Antibody | Goat polyclonal | Invitrogen | RRID:AB_141373 | anti-rat 488; 1:1000 in TNT |
| Antibody | Goat polyclonal | Invitrogen | RRID:AB_10563566 | anti-rabbit 568; 1:500 in TNT |
| Antibody | Goat polyclonal | Invitrogen | RRID:AB_2535719 | anti-mouse 633; 1:500 in TNT |
| Software, algorithm | Zen | Carl Zeiss | RRID:SCR_013672 | |
| Software, algorithm | Illustrator | Adobe | RRID:SCR_010279 | |
| Software, algorithm | Seurat | Stuart et al., 2019 | RRID:SCR_016341 | |
| Software, algorithm | Cell Ranger | 10 x Genomics | RRID:SCR_017344 | |
| Software, algorithm | GraphPad Prism | GraphPad | RRID:SCR_002798 | |
| Software, algorithm | ShinyR-DAM | Cichewicz and Hirsh, 2018 | ||
Additional files
-
MDAR checklist
- https://cdn.elifesciences.org/articles/78511/elife-78511-mdarchecklist1-v1.pdf
-
Source data 1
Sequencing metrics and barcode-rank plots for all replicates.
Excel data table containing CellRanger barcode-rank plots and sequencing metrics for all replicates. After quality control filtering, the median number of genes per cell and median UMI counts per cell are presented.
- https://cdn.elifesciences.org/articles/78511/elife-78511-data1-v1.xlsx
-
Source data 2
Distribution of cells per replicate and sex in Uniform Manifold Approximation and Projections (UMAPs) and select gene expression metrics.
Excel data table containing cell number contributions of each individual replicate to clusters. This table contains the Seurat integration analysis. The table contains the number of cells and percent of total cells expressing GFP, fru, roX1, roX2, elav, nSyb, noe, stg, and genes indicative of fast-acting neurotransmitter (FAN) expression. The table includes DoubletFinder analyses.
- https://cdn.elifesciences.org/articles/78511/elife-78511-data2-v1.xlsx
-
Source data 3
Marker genes and annotations.
Excel data table containing marker gene lists and cluster annotations for all analyses. Statistical tests of marker gene list overlaps with lists of genes shown to be enriched or differentially expressed at 48-hr after puparium formation (APF) in previous fru P1 Translating Ribosome Affinity Profiling (TRAP study Palmateer et al., 2021). This table also contains the Seurat integration analysis marker gene list.
- https://cdn.elifesciences.org/articles/78511/elife-78511-data3-v1.xlsx
-
Source data 4
Gene ontology (GO) enrichment analyses.
Excel data table containing GO enrichment results.
- https://cdn.elifesciences.org/articles/78511/elife-78511-data4-v1.xlsx
-
Source data 5
Assigning sex bias to clusters in full and downsampled data sets.
Excel data table containing cell number contributions by each sex per cluster. A scaling factor to normalize the number of male and female cells was applied to determine the sex bias in cell number. The table includes assessments of cluster data with random female cells removed, and a full Seurat re-analyses of data with downsampled female cell numbers. The table includes the cluster comparisons of downsampled analyses using clustifyr matching.
- https://cdn.elifesciences.org/articles/78511/elife-78511-data5-v1.xlsx
-
Source data 6
Marker genes for subclustering analyses.
Excel data table containing marker genes for dsx, Kenyon cell, and circadian clock neuron subclustering.
- https://cdn.elifesciences.org/articles/78511/elife-78511-data6-v1.xlsx
-
Source data 7
Clk856 ∩ fru P1 cell body counts in the adult brain and Drosophila activity monitor (DAM) data.
Excel data table containing the number of Clk856 ∩ fru P1 cell bodies per region in adult male and female brains. The DAM data underlying graphs and plots in Figure 7—figure supplement 2.
- https://cdn.elifesciences.org/articles/78511/elife-78511-data7-v1.xlsx
-
Source data 8
nAChR expression.
Excel data table containing the proportion of total neurons expressing nAChRs in all data sets.
- https://cdn.elifesciences.org/articles/78511/elife-78511-data8-v1.xlsx
-
Source data 9
Sex differences in gene expression within cluster.
Excel data table containing the differentially expressed genes between the sexes per cluster.
- https://cdn.elifesciences.org/articles/78511/elife-78511-data9-v1.xlsx
Download links
A two-part list of links to download the article, or parts of the article, in various formats.
Downloads (link to download the article as PDF)
Open citations (links to open the citations from this article in various online reference manager services)
Cite this article (links to download the citations from this article in formats compatible with various reference manager tools)
Single-cell transcriptome profiles of Drosophila fruitless-expressing neurons from both sexes
eLife 12:e78511.
https://doi.org/10.7554/eLife.78511


