Neuron-associated macrophage proliferation in the sensory ganglia is associated with peripheral nerve injury-induced neuropathic pain involving CX3CR1 signaling
- Center for Research in Inflammatory Diseases (CRID), Department of Pharmacology, Ribeirão Preto Medical School, University of São Paulo, Brazil
- Graduate Program in Basic and Applied Immunology, Ribeirão Preto Medical School, University of São Paulo, Brazil
- Department of Physiology and Pharmacology, Snyder Institute for Chronic Diseases, Cumming School of Medicine, University of Calgary, Canada
- Department of Anesthesiology, Pain Mechanisms Laboratory, Wake Forest University School of Medicine, United States
- Department of Pathology and Immunology, Washington University School of Medicine in Saint Louis, United States
- Univ Montpellier, Montpellier, France; Inserm U-1298, Institut des Neurosciences de Montpellier, France
Figures
Figure 1
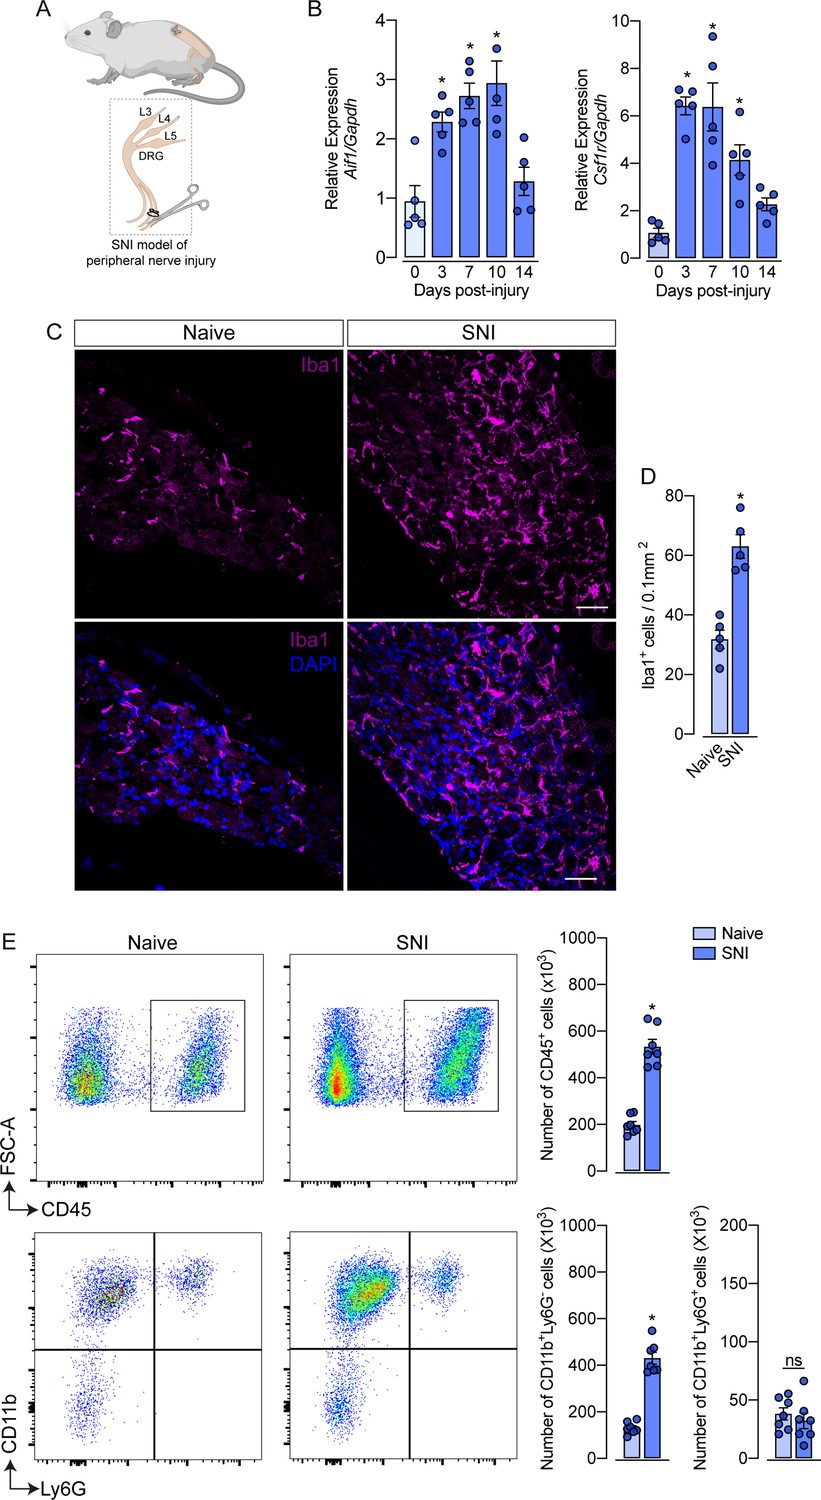
Spared nerve injury (SNI) model induced an increase in the number of macrophages in the dorsal root ganglia (DRG).
(A) Schematic representation of the experimental design of SNI induction in mice, showing the sciatic nerve, its branches and the dorsal root ganglia (DRG; L3, L4 and L5) harvested. (B) Time course of Csf1r and Aif1 mRNA expression relative to Gapdh in the DRGs from naïve WT mice (day 0) or 3, 7, 10, and 14 days post-injury (n=4–5). (C) Representative confocal images of L4 DRG from WT mice at 7 days after SNI. Scale bars: 50 μm. (D) Quantification of macrophages (Iba1 + cells) in DRGs at 7 days after SNI (n=5). (E) Representative dot plots and absolute number of CD45+, CD11b+Ly6G−, and CD11b+Ly6G+ cells in the DRGs (L3–L5) at 7 days after SNI by flow cytometry (n=7). Results are shown as the mean ± SEM. p-values were determined by one-way ANOVA followed by Bonferroni’s post hoc test. *p<0.05; ns, not significant. Data are representative of at least three independent experiments.
Figure 2 with 3 supplements
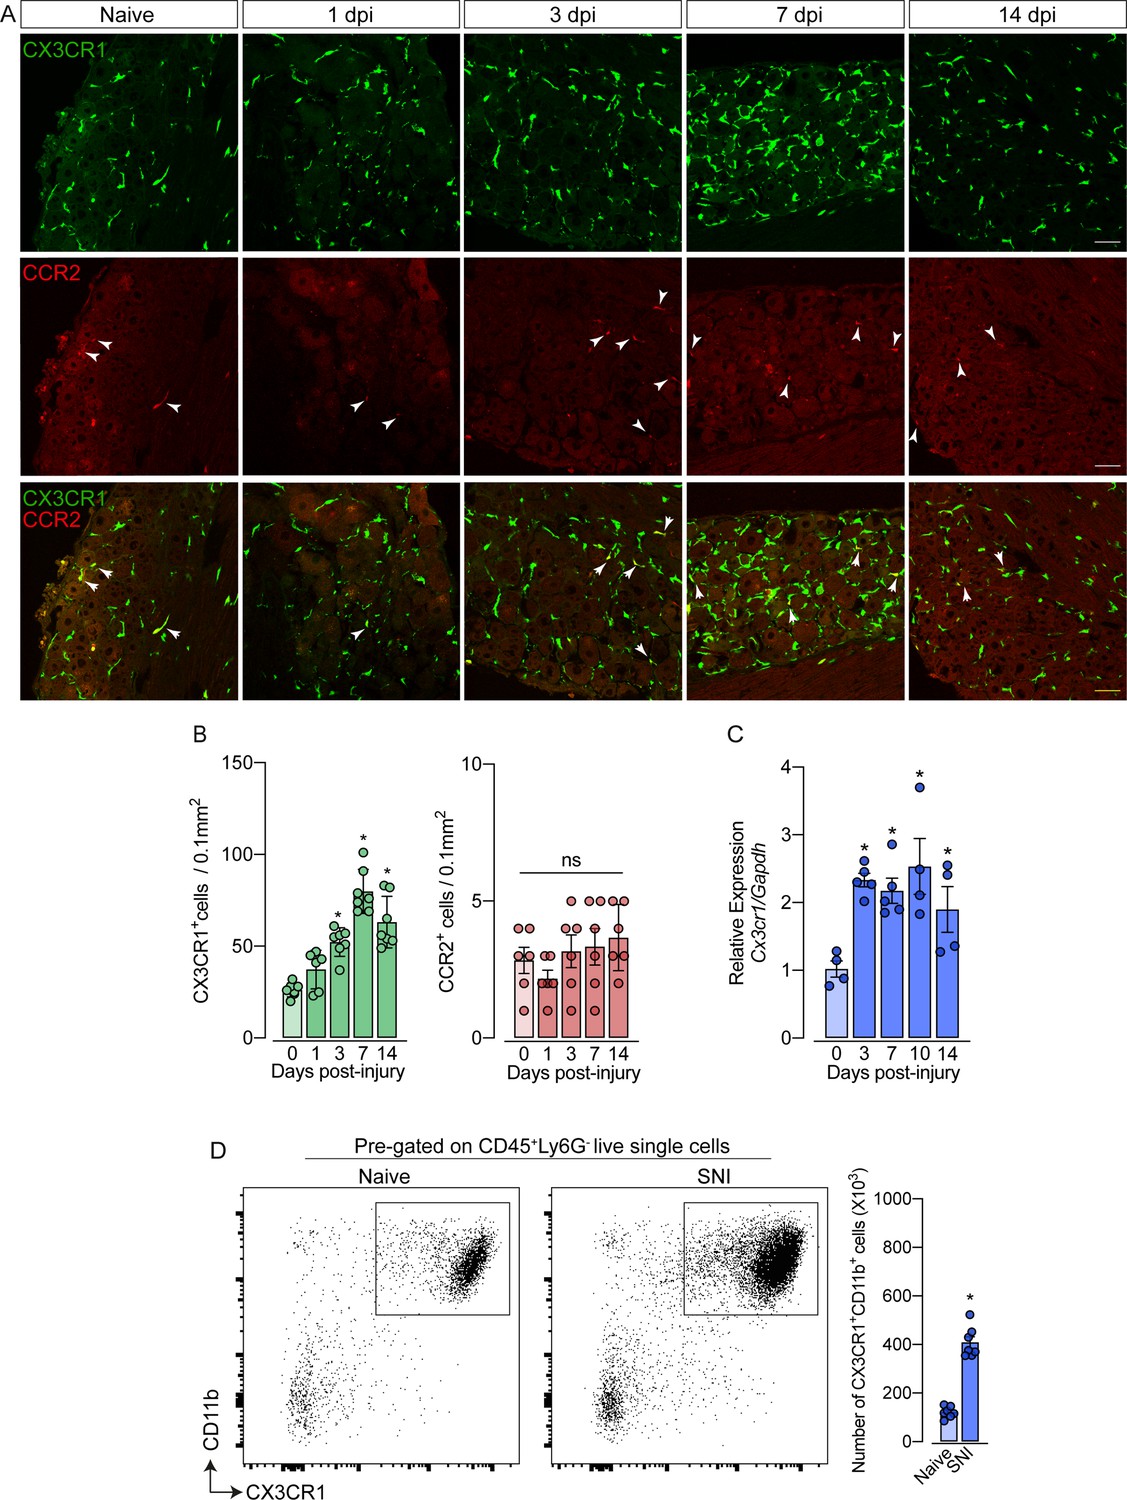
Spared nerve injury (SNI) induced an increase of CX3CR1+ macrophages, but not of CCR2+ monocytes in the dorsal root ganglias (DRGs).
(A) Representative confocal images of L4 DRG from naive Cx3cr1GFP/+/Ccr2RFP/+ mice or 1, 3, 7, and 14 days post-injury (dpi). CX3CR1-GFP+macrophages are shown in green and CCR2-RFP+monocytes are shown in red (indicated with white arrows). Scale bars: 50 μm. (B) Quantification of macrophages (CX3CR1-GFP+ cells) and monocytes (CCR2-RFP+ cells) in DRGs naive (day 0) or 1, 3, 7, and 14 days post-injury (n=6–7). (C) Time course of Cx3cr1 mRNA expression relative to Gapdh in the DRGs from naïve WT mice (day 0) or after 3, 7, 10, and 14 days post-injury (n=4–5). (D) Representative dot plots and absolute number of CX3CR1+CD11b+ cells in the DRGs (L3–L5) from Cx3cr1GFP/+ mice at 7 days after SNI by flow cytometry (n=7). Dots represent individual mice. Results are shown as the mean ± SEM. p-values were determined by (A–C) one-way ANOVA followed by Bonferroni’s post hoc test and (D) two-tailed Student’s t-test. *, p<0.05; ns, not significant. Data are representative of at least three independent experiments.
Figure 2—figure supplement 1
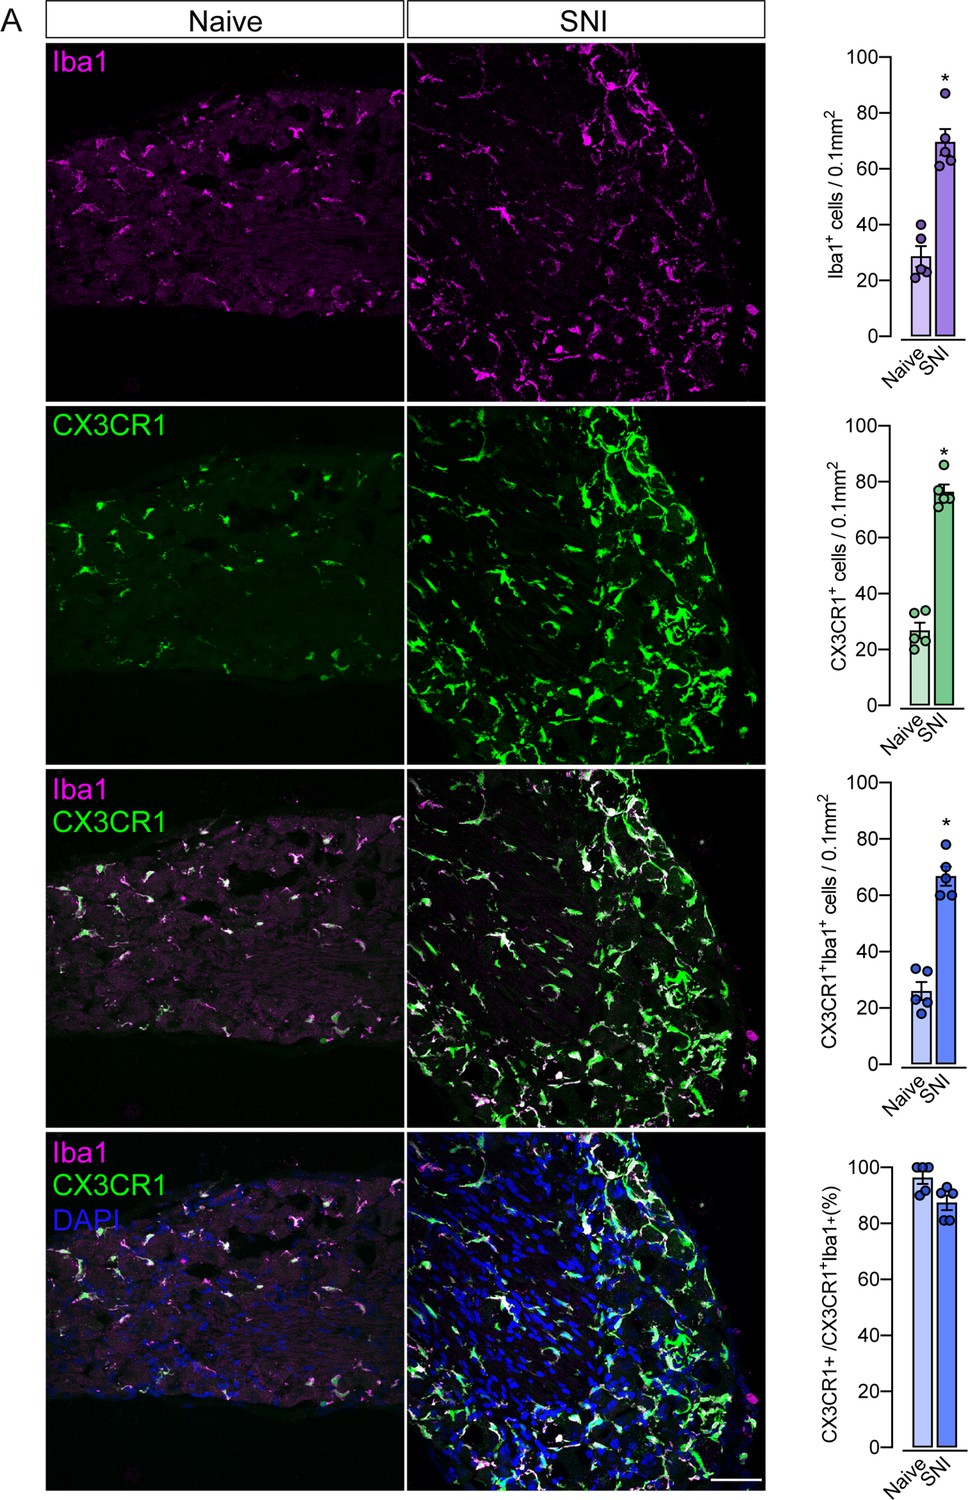
CX3CR1+ and Iba1+ cells increased in dorsal root ganglias (DRGs) after spared nerve injury (SNI).
(A) Representative confocal images of L4 DRG from Cx3cr1GFP/+ mice after 7 days of SNI. CX3CR1+ cells are shown in green and Iba1 + cells are shown in magenta. Scale bars: 50 μm. Quantification of CX3CR1+ and Iba1+ cells DRGs after 7 days of SNI (n=5). Results are shown as the mean ± SEM. p-values were determined by two-tailed Student’s t-test. *p<0.05; ns, not significant. Data are representative of at least three independent experiments.
Figure 2—figure supplement 2
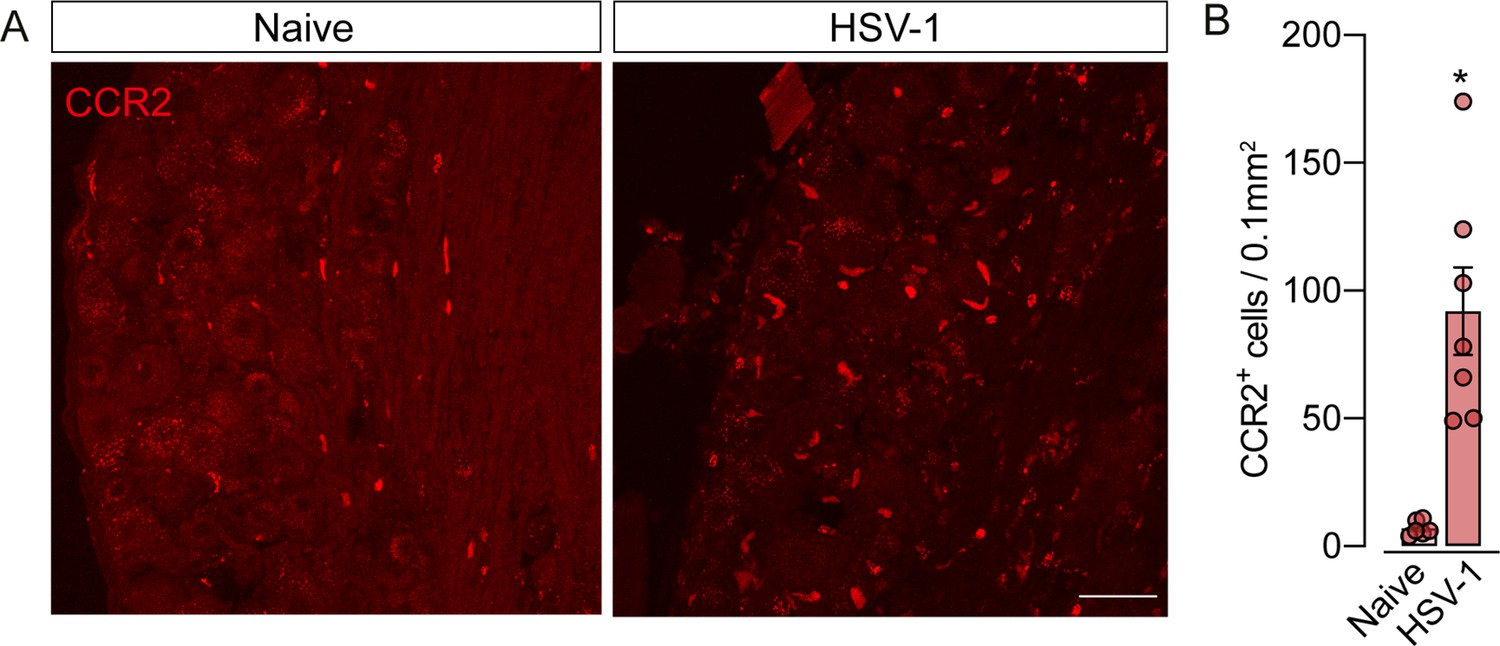
CCR2+ monocytes increase in the dorsal root ganglias (DRGs) after HSV-1 peripheral infection.
(A) Representative confocal images of DRGs from Ccr2RFP/+ mice at 7 days after HSV-1 infection. CCR2+ cells are shown in red. Scale bars: 50 μm. (B) Quantification of CCR2+ cells in DRGs at 7 days after infection (n=7). Results are shown as the mean ± SEM. p-values were determined by two-tailed Student’s t-test. *p<0.05. Data are representative of at least two independent experiments.
Figure 2—figure supplement 3
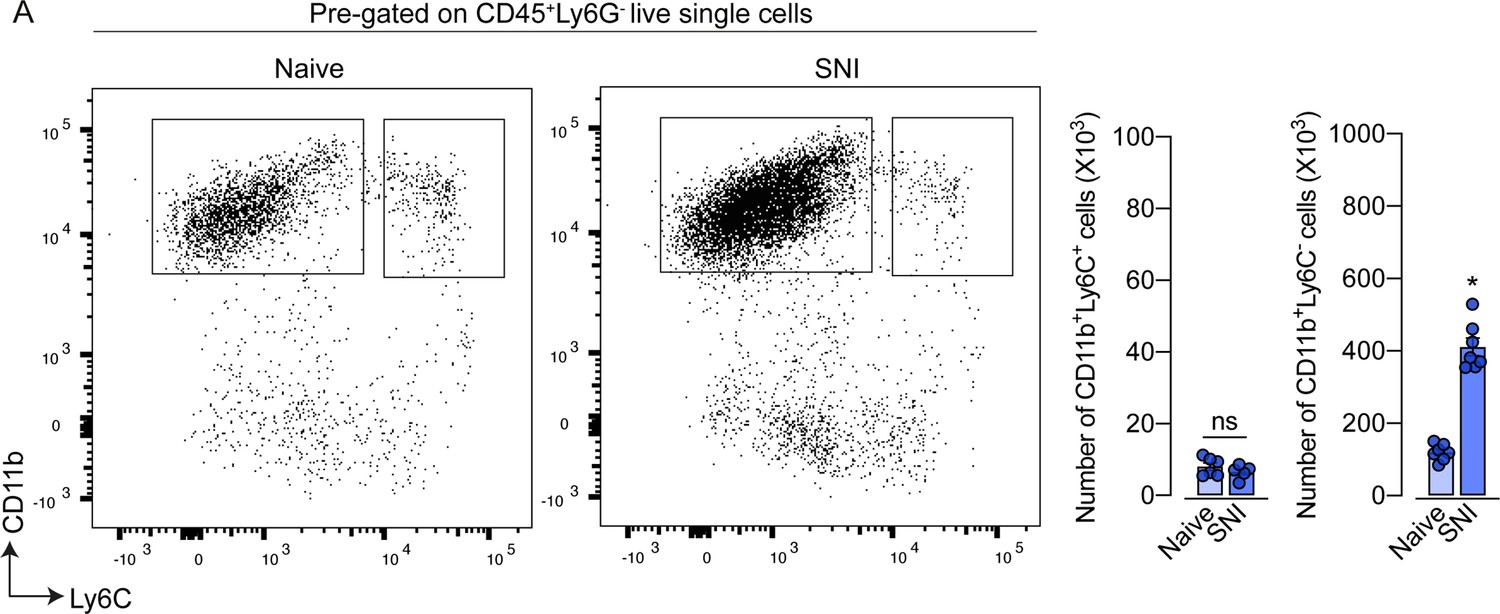
There is no increase in the number of inflammatory monocytes in the dorsal root ganglias (DRGs) after spared nerve injury (SNI).
(A) Representative dot plots and the absolute number of CD11b+Ly6C+ and CD11b+Ly6C− cells in the DRGs at 7 days after SNI, analyzed by flow cytometry (n=7). Results are shown as the mean ± SEM. p-values were determined by two-tailed Student’s t-test. *p<0.05; ns, not significant. Data are representative of at least two independent experiments.
Figure 3
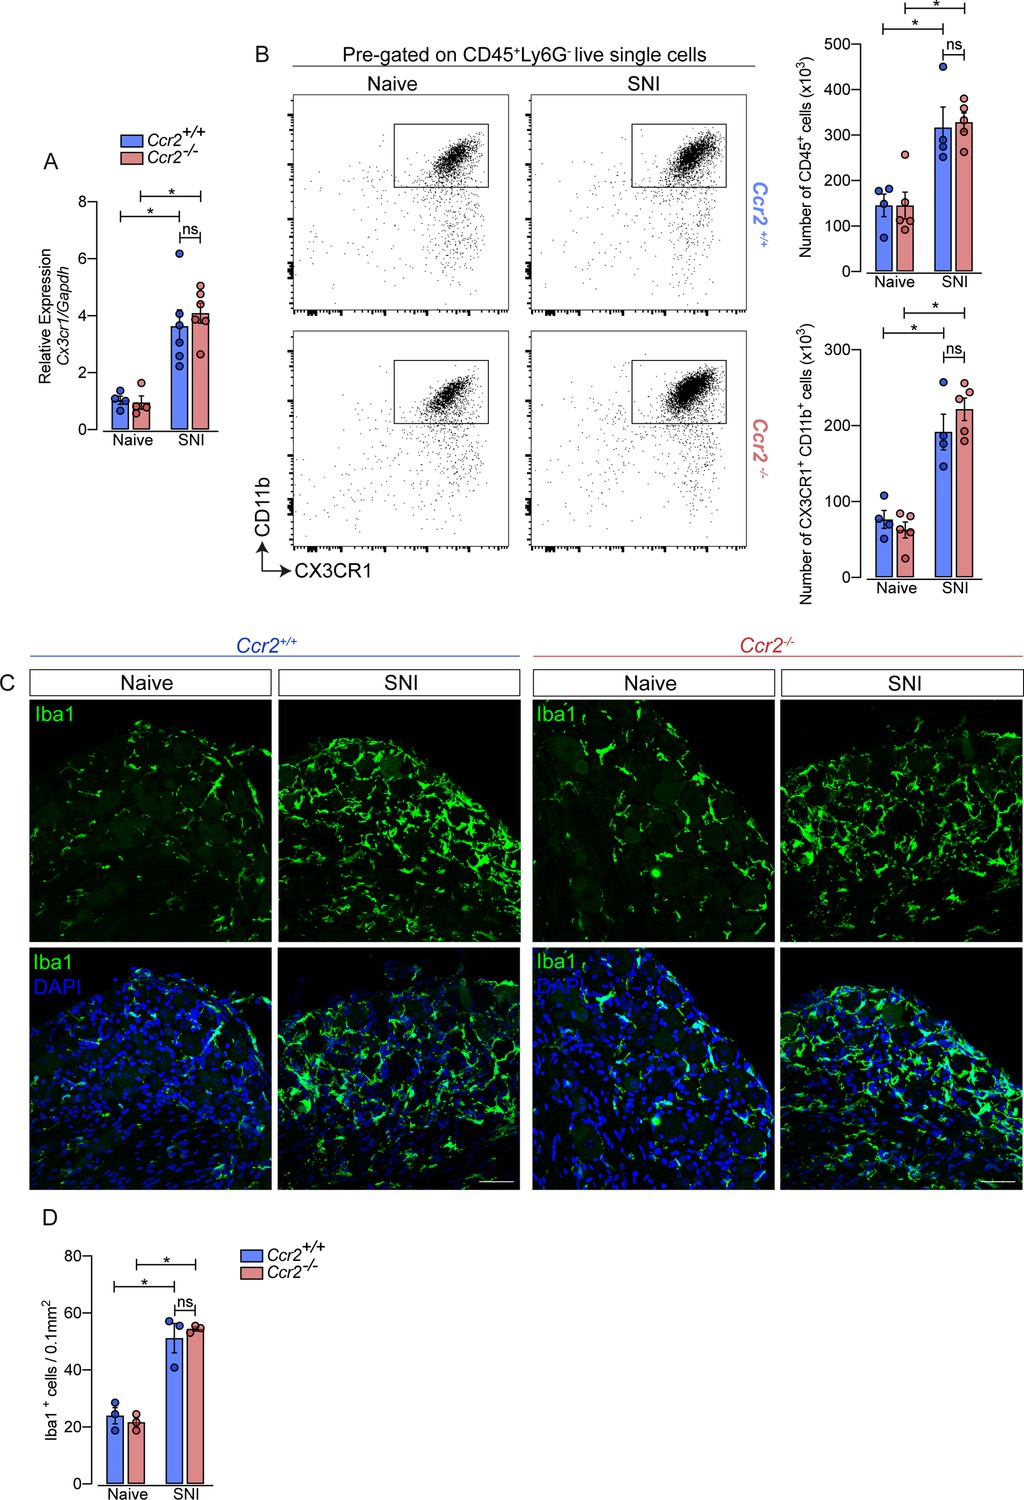
Macrophages increased in the sensory ganglia after spared nerve injury (SNI) independent of CCR2 signaling.
(A) RT-qPCR analysis of Cx3cr1 mRNA expression relative to Gapdh in the DRGs from Ccr2-/- and Ccr2+/+ mice after 7 days of SNI (n=4–6). (B) Representative dot plots and absolute number of CD45+ and CX3CR1+CD11b+ cells in the dorsal root ganglias (DRGs) (L3–L5) from Ccr2-/- and Ccr2+/+ mice 7 days after SNI by flow cytometry (n=4–5). (C) Representative confocal images of L4 DRG from Ccr2-/- and Ccr2+/+ mice 7 days after SNI. Scale bars: 50 μm. (D) Quantification of macrophages (Iba1+ cells) in DRGs at 7 days after SNI (n=3). Results are shown as the mean ± SEM. p-values were determined by one-way ANOVA followed by Bonferroni’s post hoc test. *p<0.05; ns, not significant. Data are representative of at least two independent experiments.
Figure 4 with 1 supplement
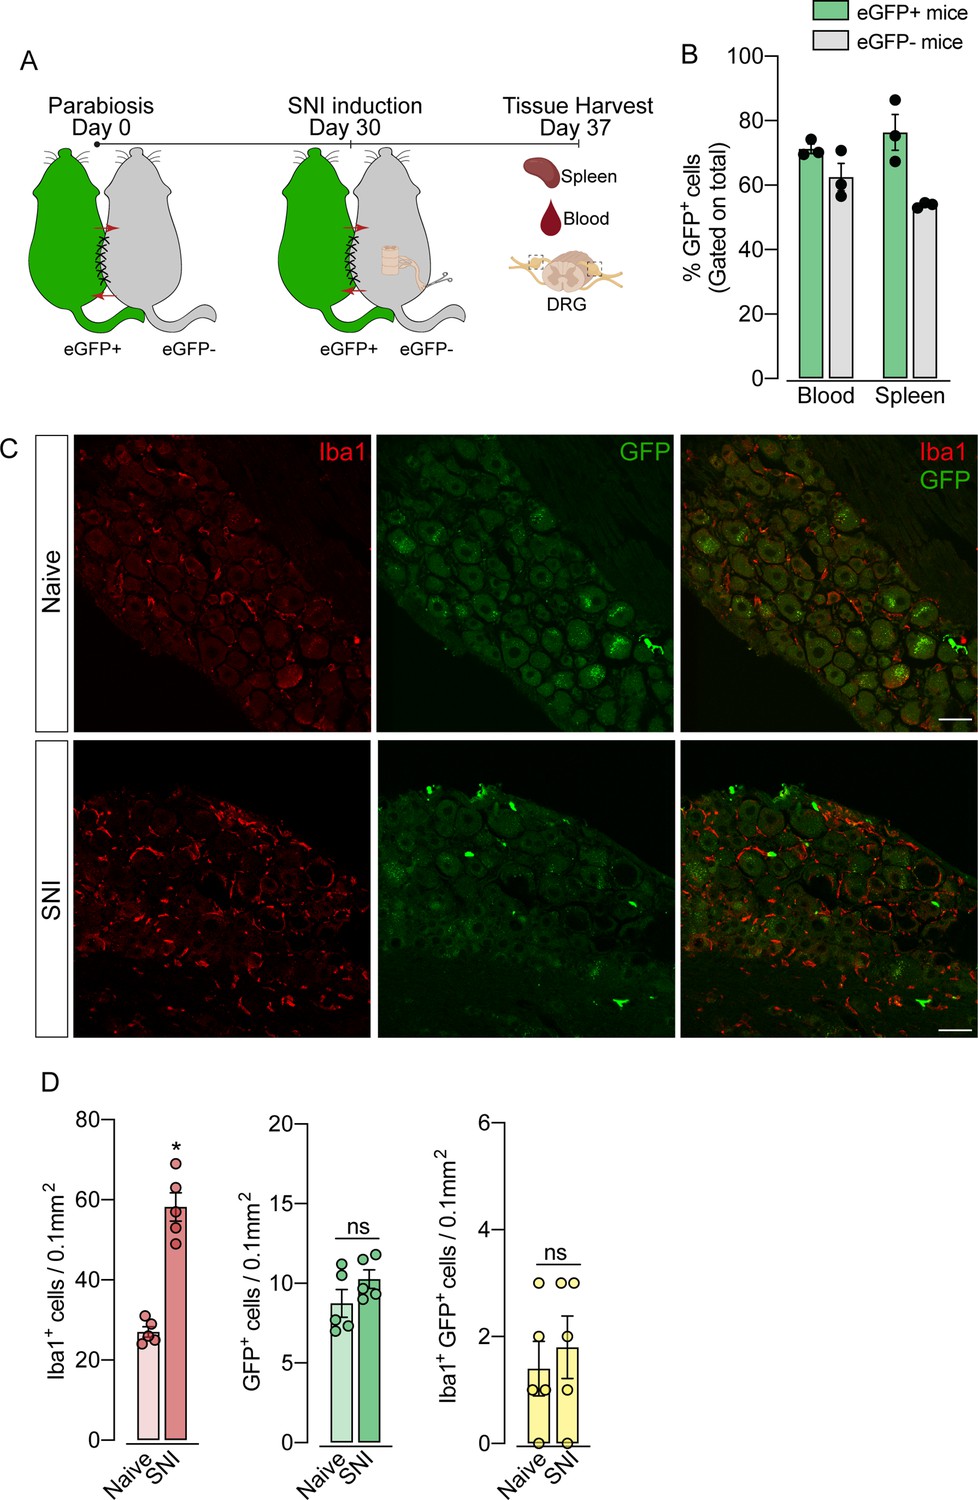
Blood leukocytes did not infiltrate the dorsal root ganglias (DRGs) after spared nerve injury (SNI).
(A) Schematic representation of parabiotic mouse pairs: eGFP+ (C57BL/6-(Tg[CAG-EGFP])) and eGFP− (C57BL/6 J) mice. After 30 days, SNI was induced in eGFP− mice and maintained for 7 days, then spleen, blood, and DRGs were harvested. (B) Frequency of GFP+ cells in the blood and spleen from eGFP+ and eGFP− mice after 37 days of parabiosis. (C) Representative confocal images of L4 DRG from naive or SNI eGFP− parabionts mice. GFP+ cells are shown in green and Iba1+ cells are shown in red. Scale bars: 50 μm. (D) Quantification of GFP+, Iba1+, and GFP+ Iba1+ cells in DRGs naive or ipsilateral (SNI) (n=5 pairs of mice). Data are representative of two independent experiments. Results are shown as the mean ± SEM. p-values were determined by two-tailed Student’s t-test. *, p<0.05; ns, not significant. Data are representative of at least two independent experiments.
Figure 4—figure supplement 1
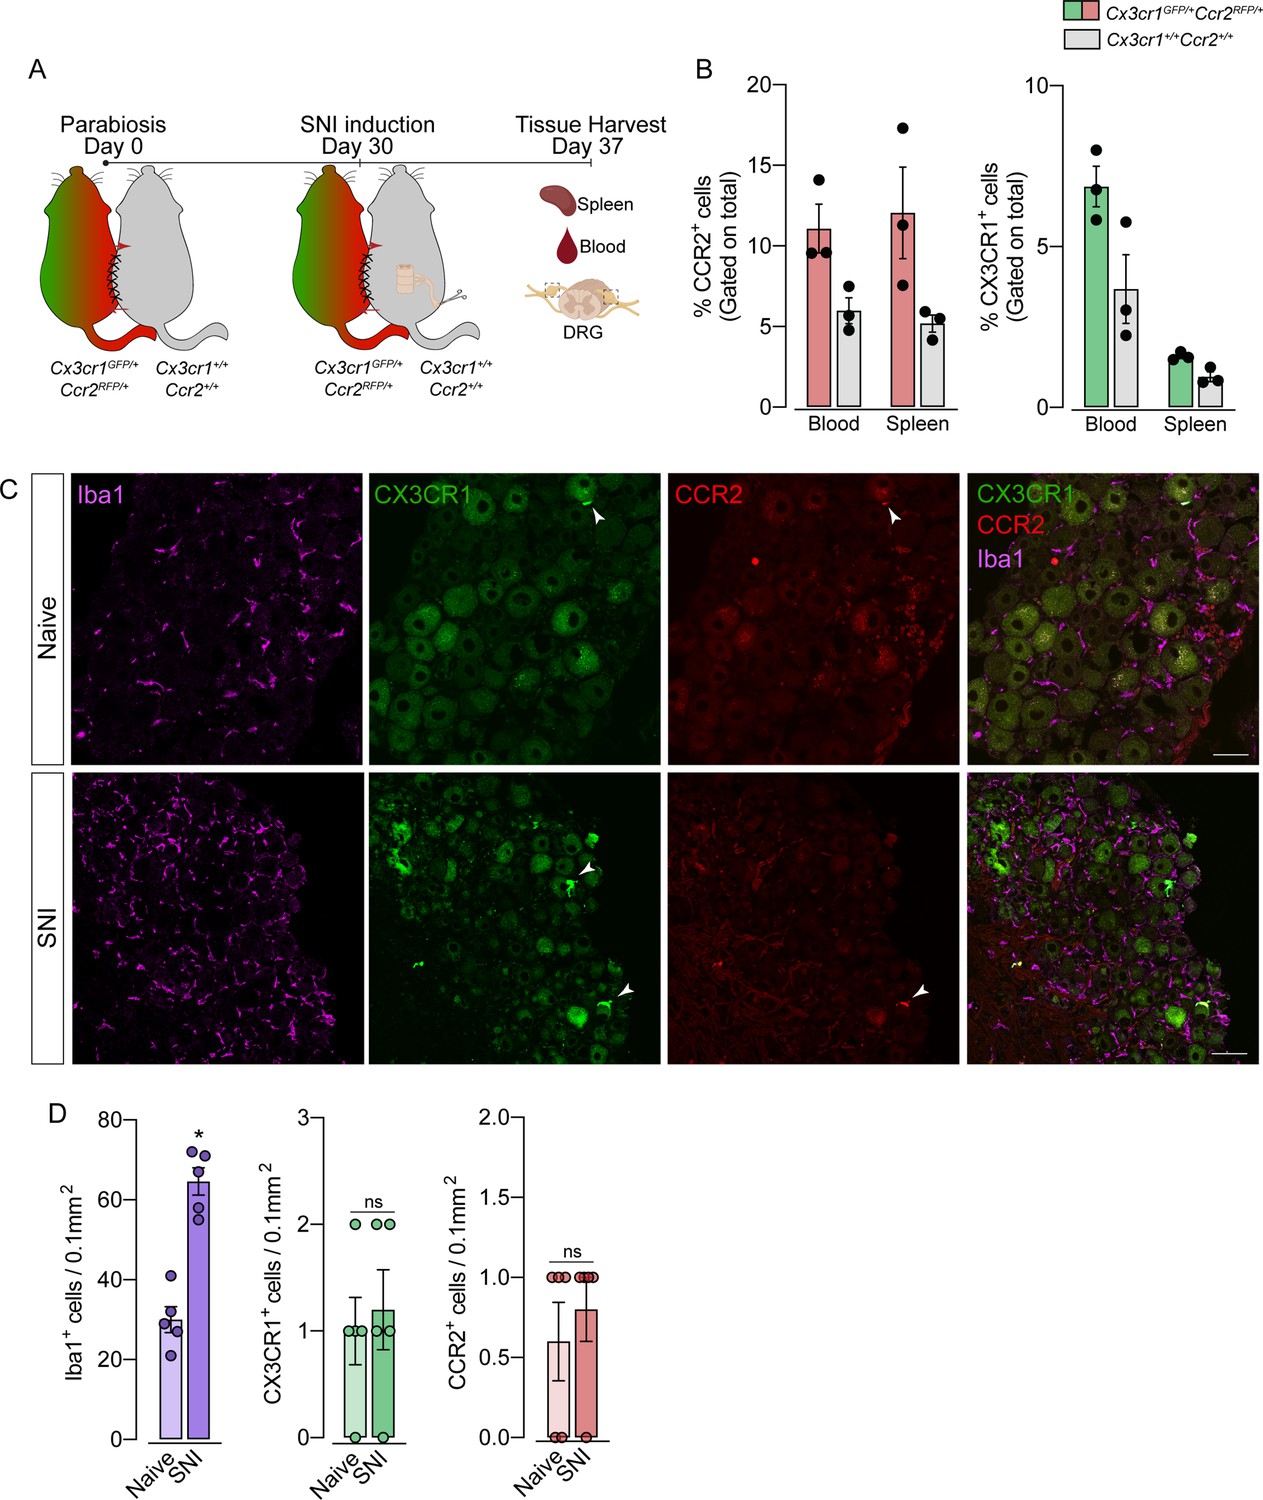
Parabiosis reveals no infiltration of circulating CX3CR1+ or CCR2+ cells in the dorsal root ganglia (DRG) after spared nerve injury (SNI).
(A) Schematic representation of parabiotic mouse pairs Cx3cr1GFP/+/Ccr2RFP/+ and Cx3cr1+/+/Ccr2+/+ mice joined for 37 days. After 30 days, the SNI model was induced in Cx3cr1+/+/Ccr2+/+ mice and maintained for 7 days, and then, spleen, blood, and DRGs were harvested. (B) Frequency of CX3CR1+ cells and CCR2+ cells in the blood and spleen from parabiotic mice. (C) Representative confocal images of L4 DRG from naive or SNI Cx3cr1+/+/Ccr2+/+ parabionts mice. CX3CR1+ cells are shown in green, CCR2 + cells are shown in red and IBA1+ cells are shown in magenta. Scale bars: 50 μm. (D) Quantification of Iba1+, CCR2+, and CX3CR1+ cells in DRGs naive or ipsilateral (SNI) (n=5 pairs of mice). Results are shown as the mean ± SEM. p-values were determined by two-tailed Student’s t-test. *p<0.05; ns, not significant. Data are representative of at least two independent experiments.
Figure 5
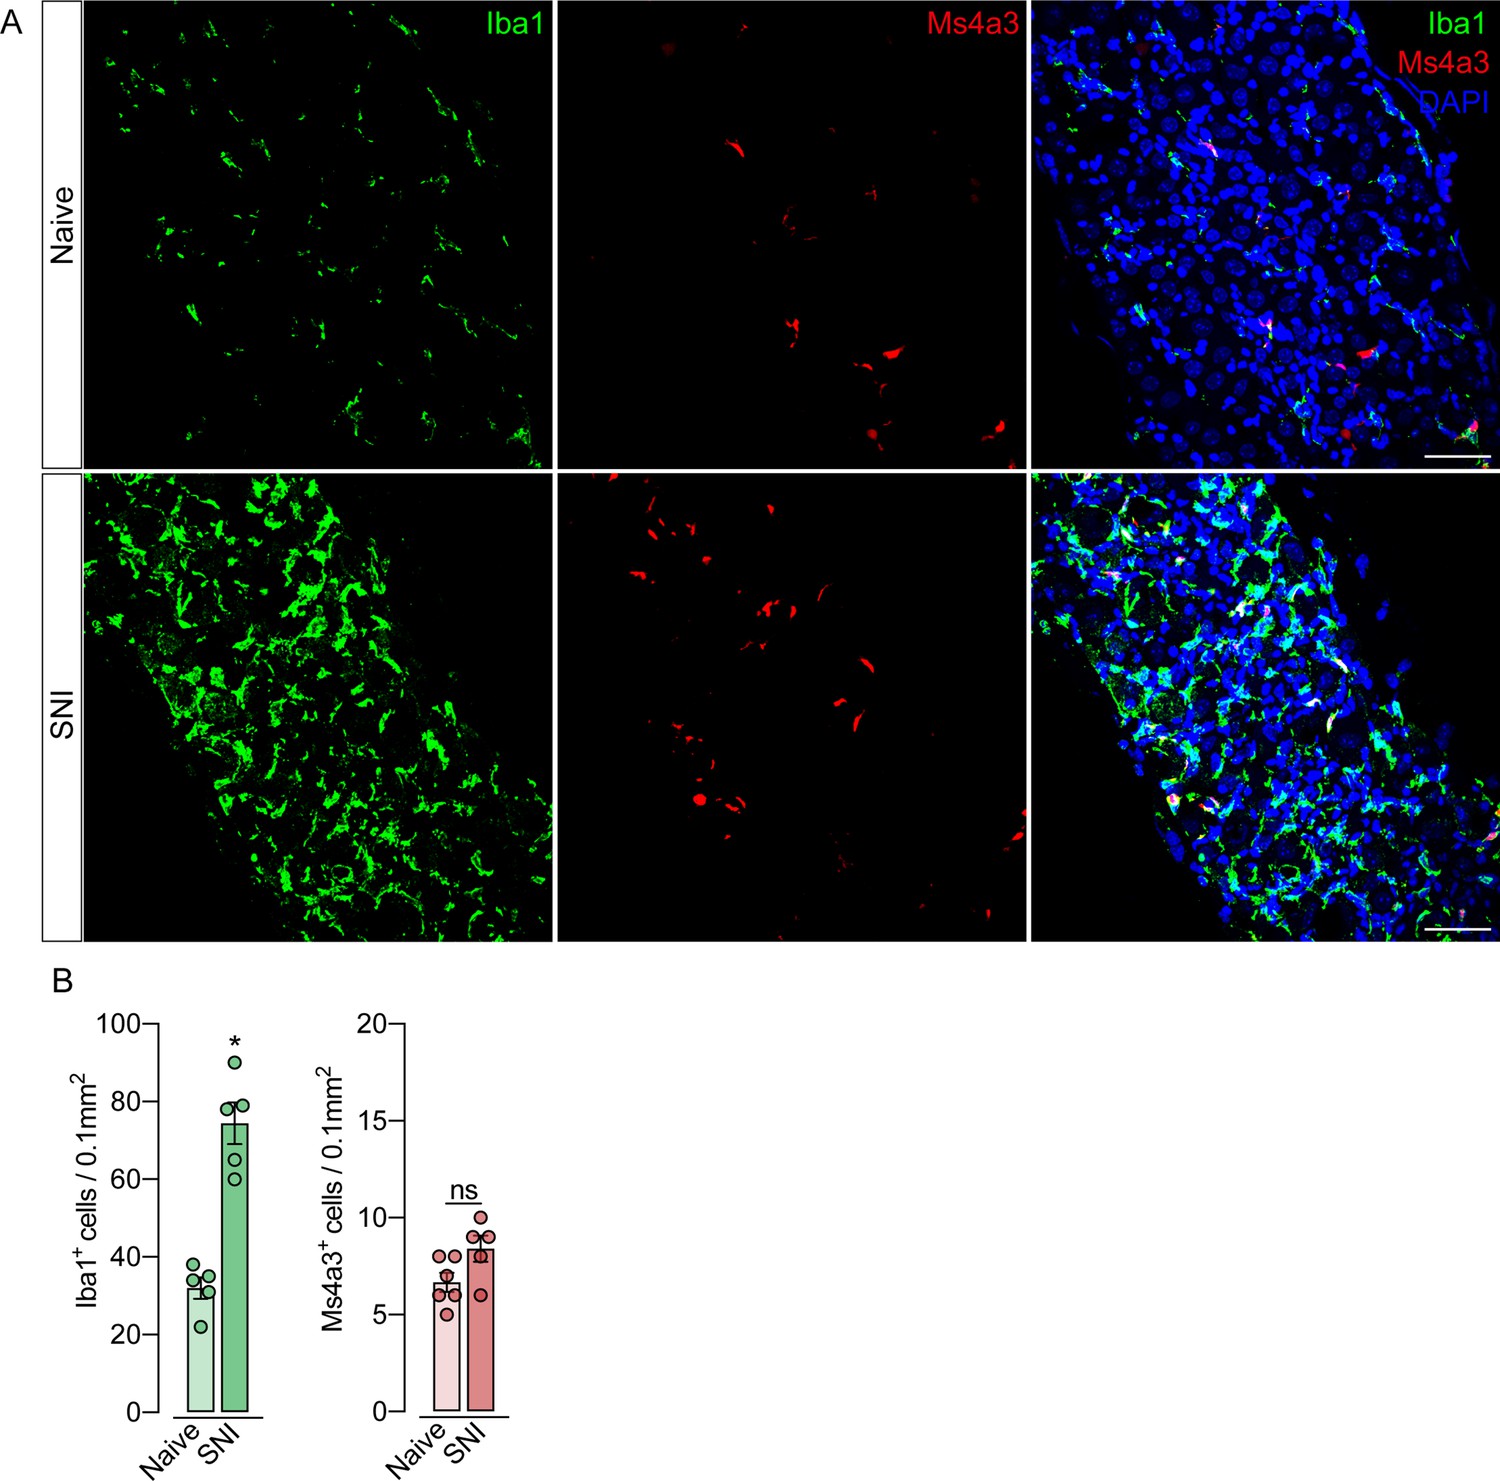
Monocytes or monocyte-derived cells did not infiltrate the dorsal root ganglias (DRGs) after spared nerve injury (SNI).
(A) Representative confocal images of L4 DRG from Ms4a3Cre-tdTomato mice after 7 days of SNI. Iba1+ cells are shown in green and Ms4a3+ cells are shown in red. Scale bars: 50 μm. (B) Quantification of Iba1+ and Ms4a3+ cells in DRGs 7 days after SNI (n=5–6). Results are shown as the mean ± SEM. p-values were determined by two-tailed Student’s t-test. *p<0.05; ns, not significant. Data are representative of at least two independent experiments.
Figure 6 with 1 supplement
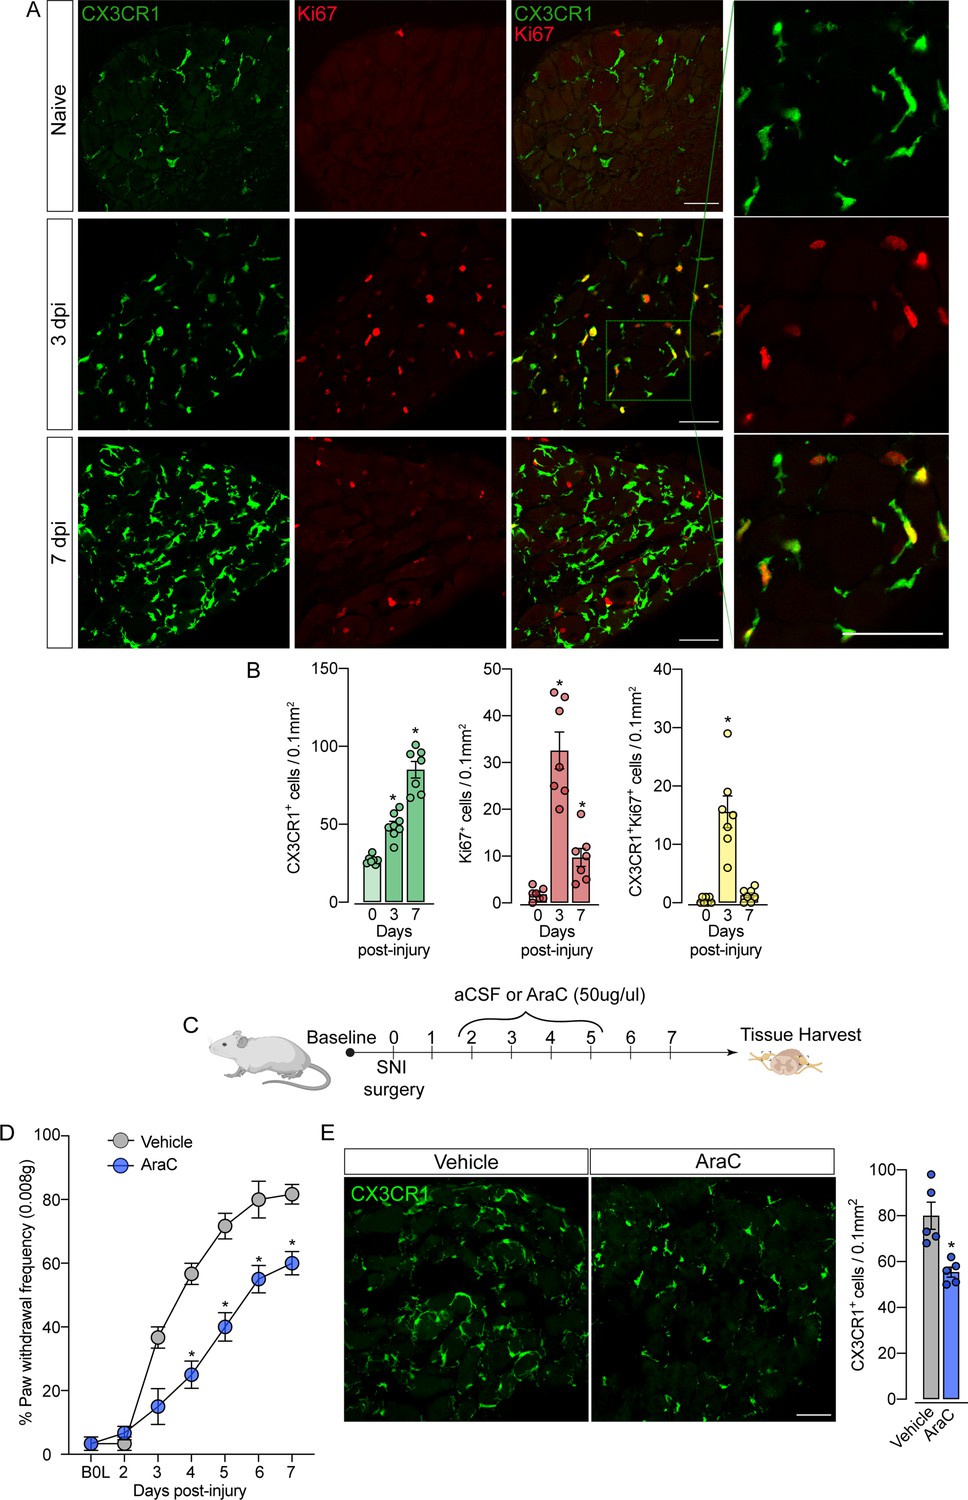
Sensory neuron-associated macrophages (sNAMs) proliferate in the sensory ganglia after peripheral nerve injury: role in mechanical allodynia.
(A) Representative confocal images of L4 DRG from naive Cx3cr1GFP/+ mice or 3 and 7 days post-injury (dpi). CX3CR1+ cells are shown in green and Ki67+ cells are shown in red. Dotted boxes show regions of higher magnification in the dorsal root ganglia (DRG). Scale bars: 50 μm. (B) Quantification of CX3CR1+, Ki67+, and CX3CR1+Ki67+ cells in DRGs naive (day 0) or 3 and 7 dpi (n=7–8). (C) Schematic representation of intrathecal treatment in Cx3cr1GFP/+ mice with AraC (Cytarabine) or aCSF (vehicle) for 4 consecutive days starting 2 days after spared nerve injury (SNI) induction. 7 days post-injury the L4 DRGs were harvested. (D) Mechanical nociception was evaluated (for 7 days) by paw withdrawal frequency using 0.008 g of von Frey filament. (E) Representative confocal images of L4 DRG from Cx3cr1GFP/+ mice after AraC or aCSF treatment. CX3CR1+ cells are shown in green. Scale bars: 50 μm. Quantification of CX3CR1+ cells in DRGs after injections (n=5). Results are shown as the mean ± SEM. p-values were determined by one-way ANOVA followed by Bonferroni’s post hoc test. *p<0.05. Data are representative of at least three independent experiments.
Figure 6—figure supplement 1
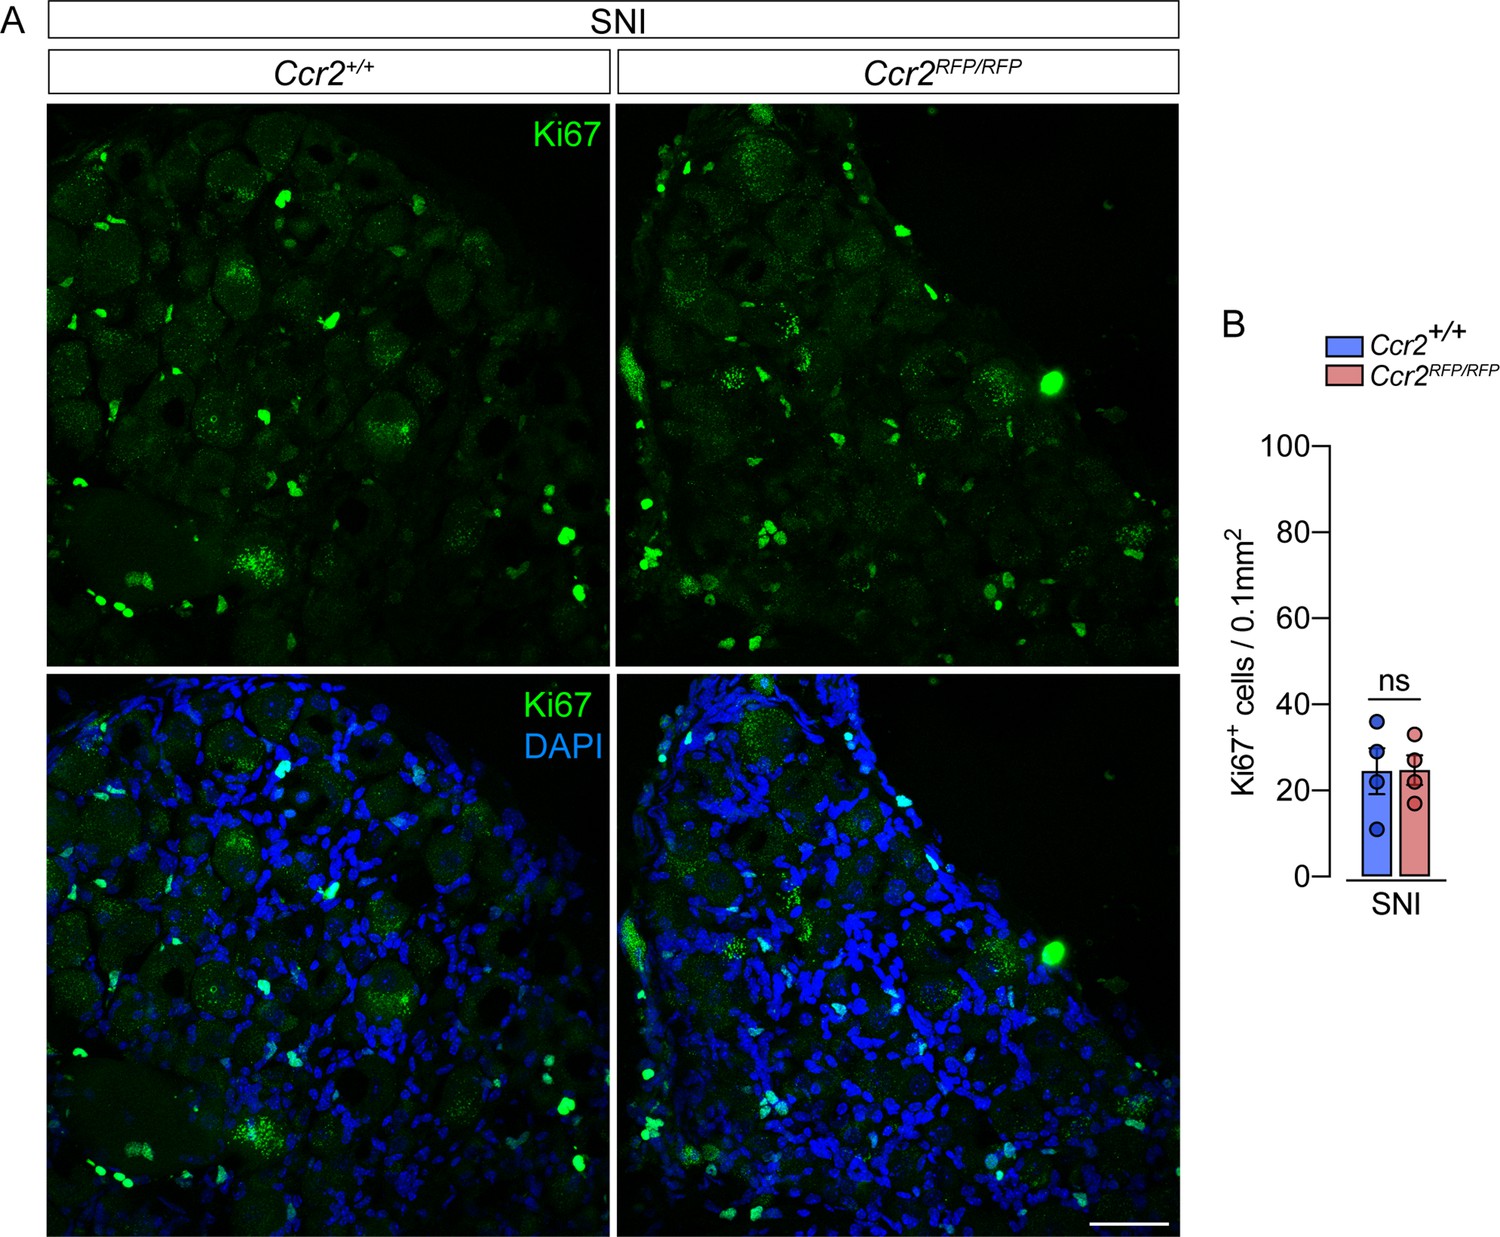
Macrophage proliferation in the sensory ganglia did not change in the absence of CCR2 signaling.
(A) Representative confocal images of L4 DRG from Ccr2+/+ and Ccr2RFP/RFP mice 3 days after spared nerve injury (SNI). Scale bars: 50 μm. (B) Quantification of proliferating cells (Ki67+ cells) in dorsal root ganglias (DRGs) at 3 days after SNI (n=4). Results are shown as the mean ± SEM. p-values were determined by two-tailed Student’s t-test. ns, not significant. Data are representative of two independent experiments.
Figure 7 with 1 supplement
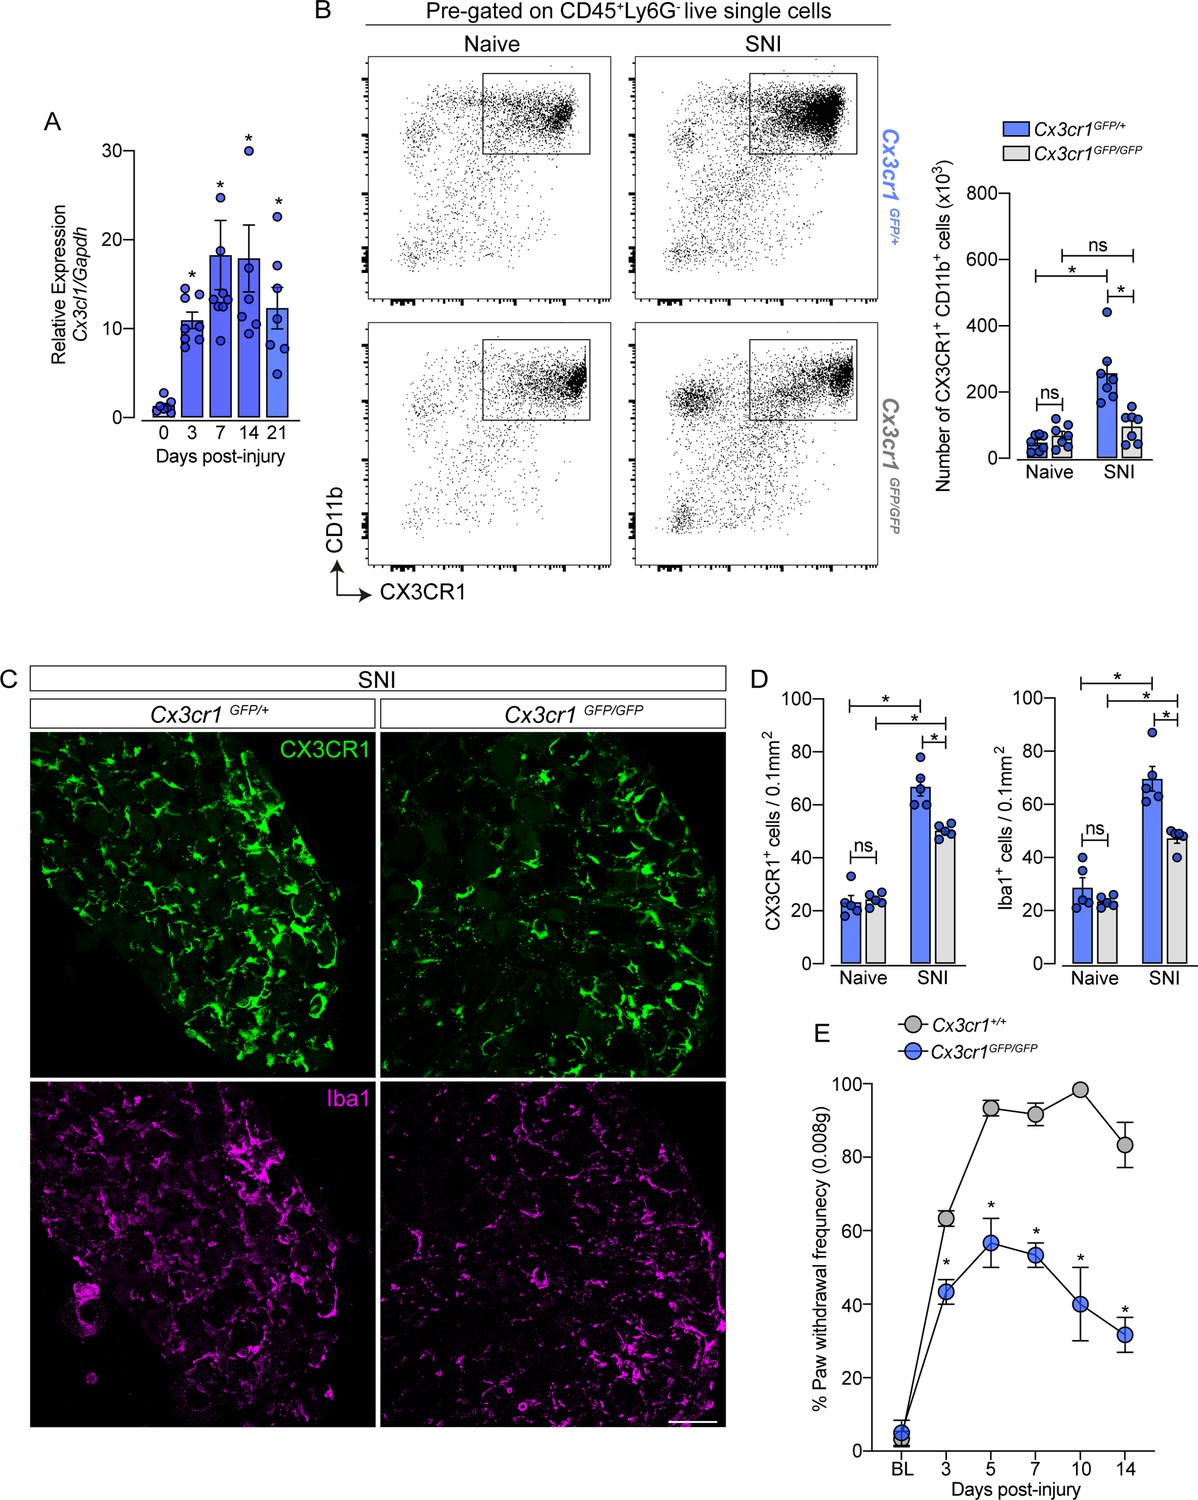
CX3CR1 signaling is involved in macrophage expansion in the dorsal root ganglia (DRG) after peripheral nerve injury.
(A) Time course of Cx3cl1 mRNA expression relative to Gapdh in the DRGs from naive (day 0) or after 3, 7, 14, and 21 days post-injury (n=7–8). (B) Representative dot plots and absolute number of CX3CR1+CD11b+ cells in the DRGs from Cx3cr1GFP/+ or Cx3cr1GFP/GFP mice at 7 days after spared nerve injury (SNI) analyzed by flow cytometry (n=7). (C) Representative confocal images of L4 DRG from Cx3cr1GFP/+ or Cx3cr1GFP/GFP mice after 7 days of SNI. CX3CR1+ cells are shown in green and Iba1+ cells are shown in magenta. Scale bars: 50 μm. (D) Quantification of CX3CR1+ and Iba1+ cells in DRGs at 7 days after SNI (n=5). (E) Mechanical allodynia was evaluated by paw withdrawal frequency using 0.008 g von Frey filament in Cx3cr1+/+ or Cx3cr1GFP/GFP mice. Results are shown as the mean ± SEM. p-values were determined by one-way ANOVA followed by Bonferroni’s post hoc test. *p<0.05; ns, not significant. Data are representative of at least two independent experiments.
Figure 7—figure supplement 1
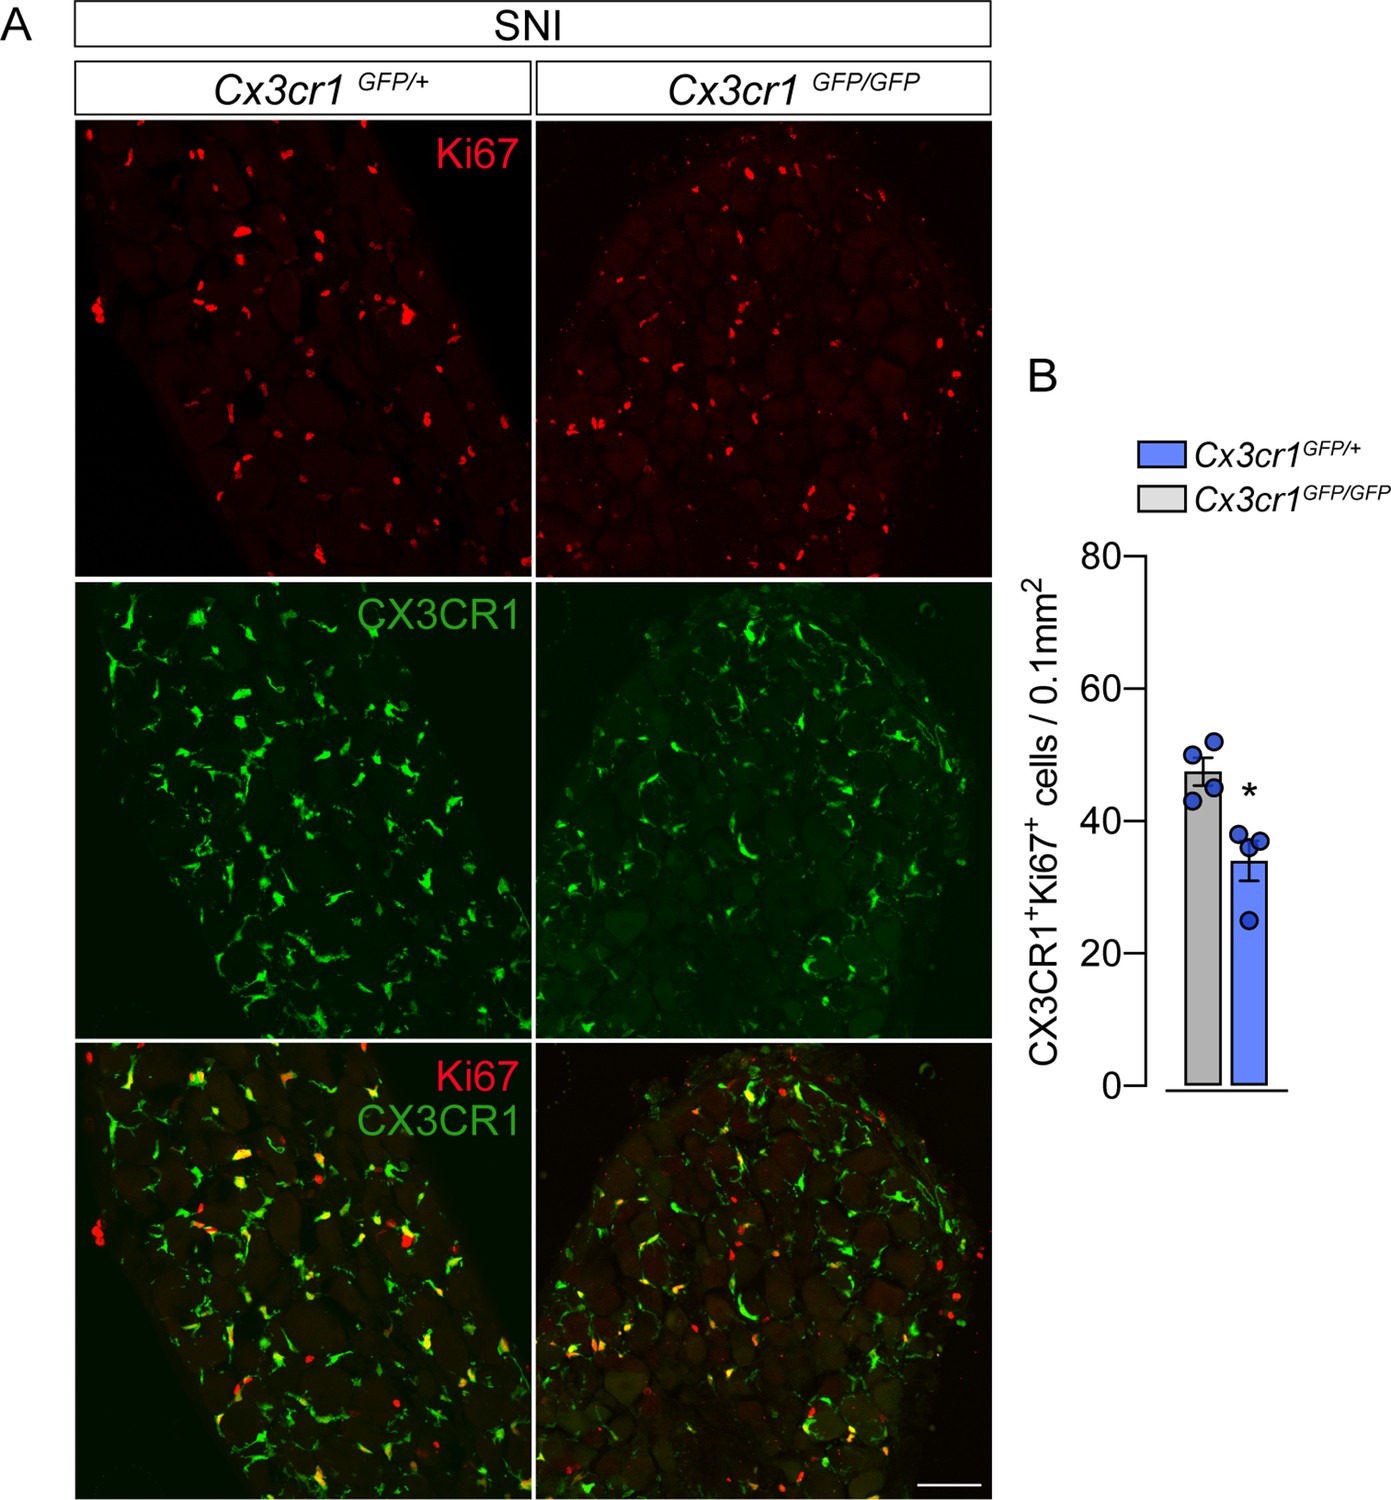
Macrophage proliferation is impaired in the absence of CX3CR1 signaling.
(A) Representative confocal images of L4 DRG from Cx3cr1GFP/+ or Cx3cr1GFP/GFP mice 3 days after spared nerve injury (SNI). Scale bars: 50 μm. (B) Quantification of proliferating cells (Ki67+ cells) in dorsal root ganglias (DRGs) at 3 days after SNI (n=4). Results are shown as the mean ± SEM. p-values were determined by two-tailed Student’s t-test. *p<0.05. Data are representative of two independent experiments.
Figure 8 with 1 supplement
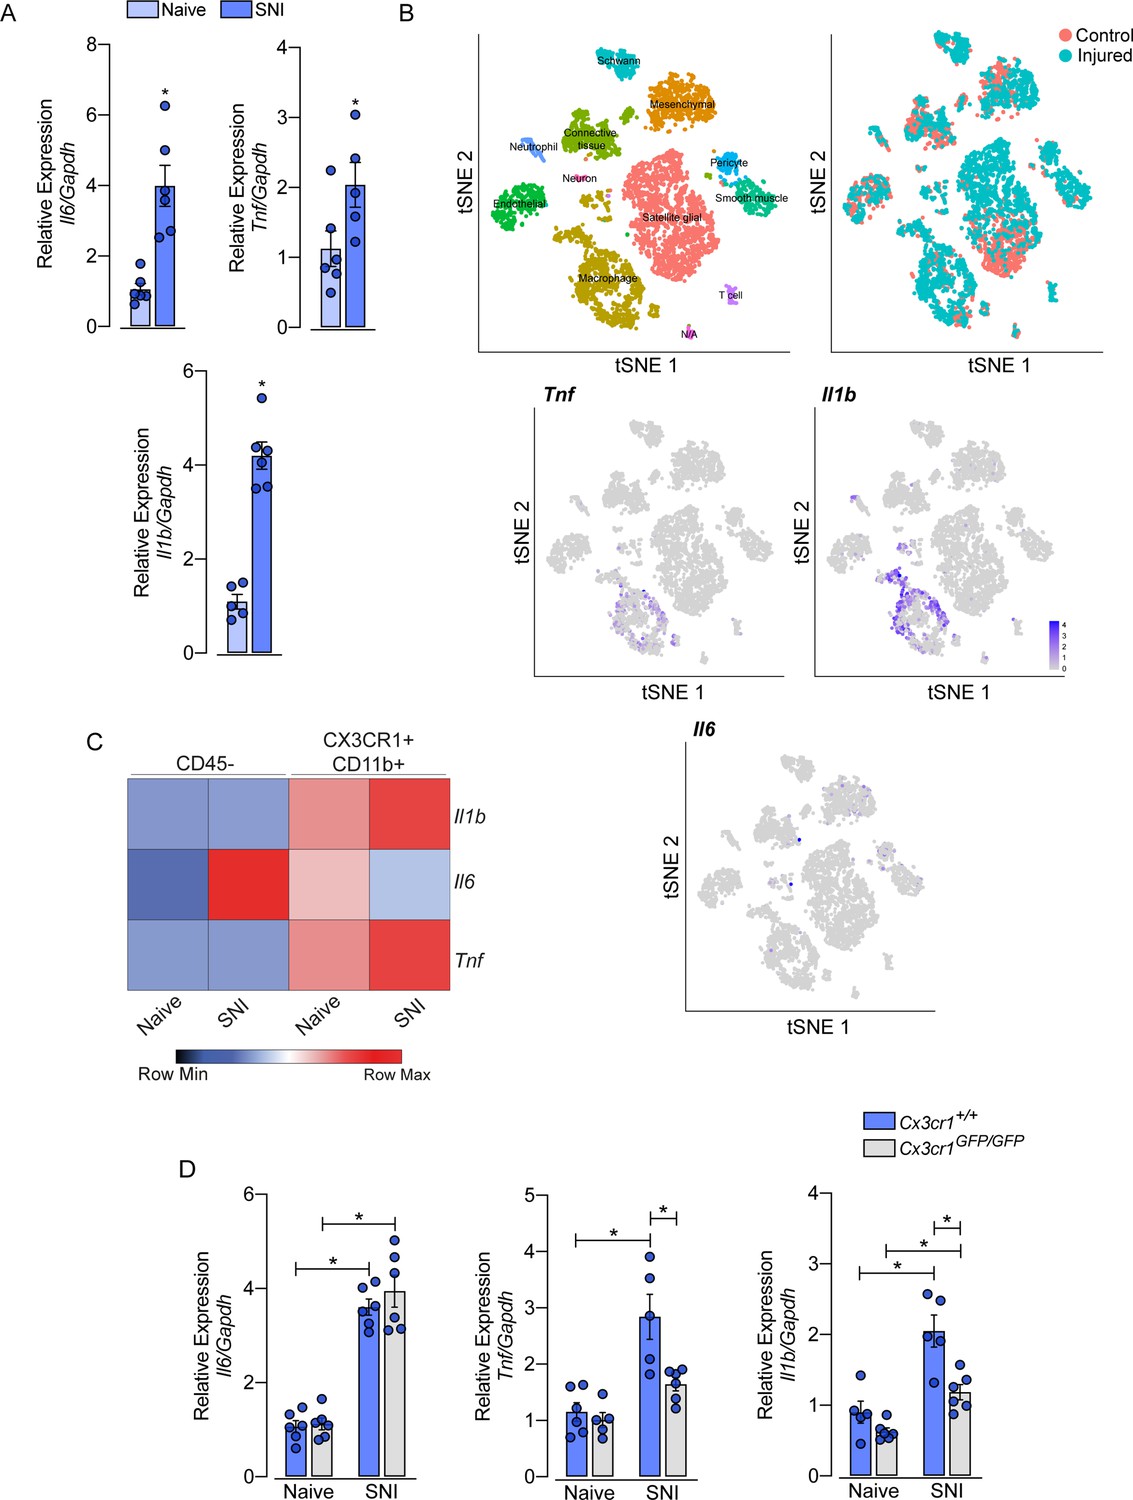
Role of sensory neuron-associated macrophages (sNAMs) in the production of pro-inflammatory cytokines in the sensory ganglia after spared nerve injury (SNI).
(A) RT-qPCR analysis of Il6, Il1b, and Tnf mRNA expression relative to Gapdh in the dorsal root ganglia (DRG) from WT mice naive or 7 days after SNI (n=5–6). (B) t-SNE plot analysis showing clusters of cell populations (GSE139103) and expression profile of Tnf, Il1b, and Il6 in the DRGs after peripheral nerve injured or naive mice. (C) RT-qPCR analysis of Il6, Il1b, and Tnf mRNA expression relative to Gapdh in CD45− or CX3CR1+CD11b+ cells isolated from Cx3cr1GFP/+ mice DRGs at 7 days after SNI or naive (n=8 pooled). (D) RT-qPCR analysis of Il6, Il1b, and Tnf mRNA expression relative to Gapdh in the DRGs from Cx3cr1+/+ or Cx3cr1GFP/GFP mice after 7 days after SNI (n=5–6). Results are shown as the mean ± SEM. p-values were determined by (A) two-tailed Student’s t-test and (D) one-way ANOVA followed by Bonferroni’s post hoc test. *p<0.05. Data are representative of at least two independent experiments.
Figure 8—figure supplement 1
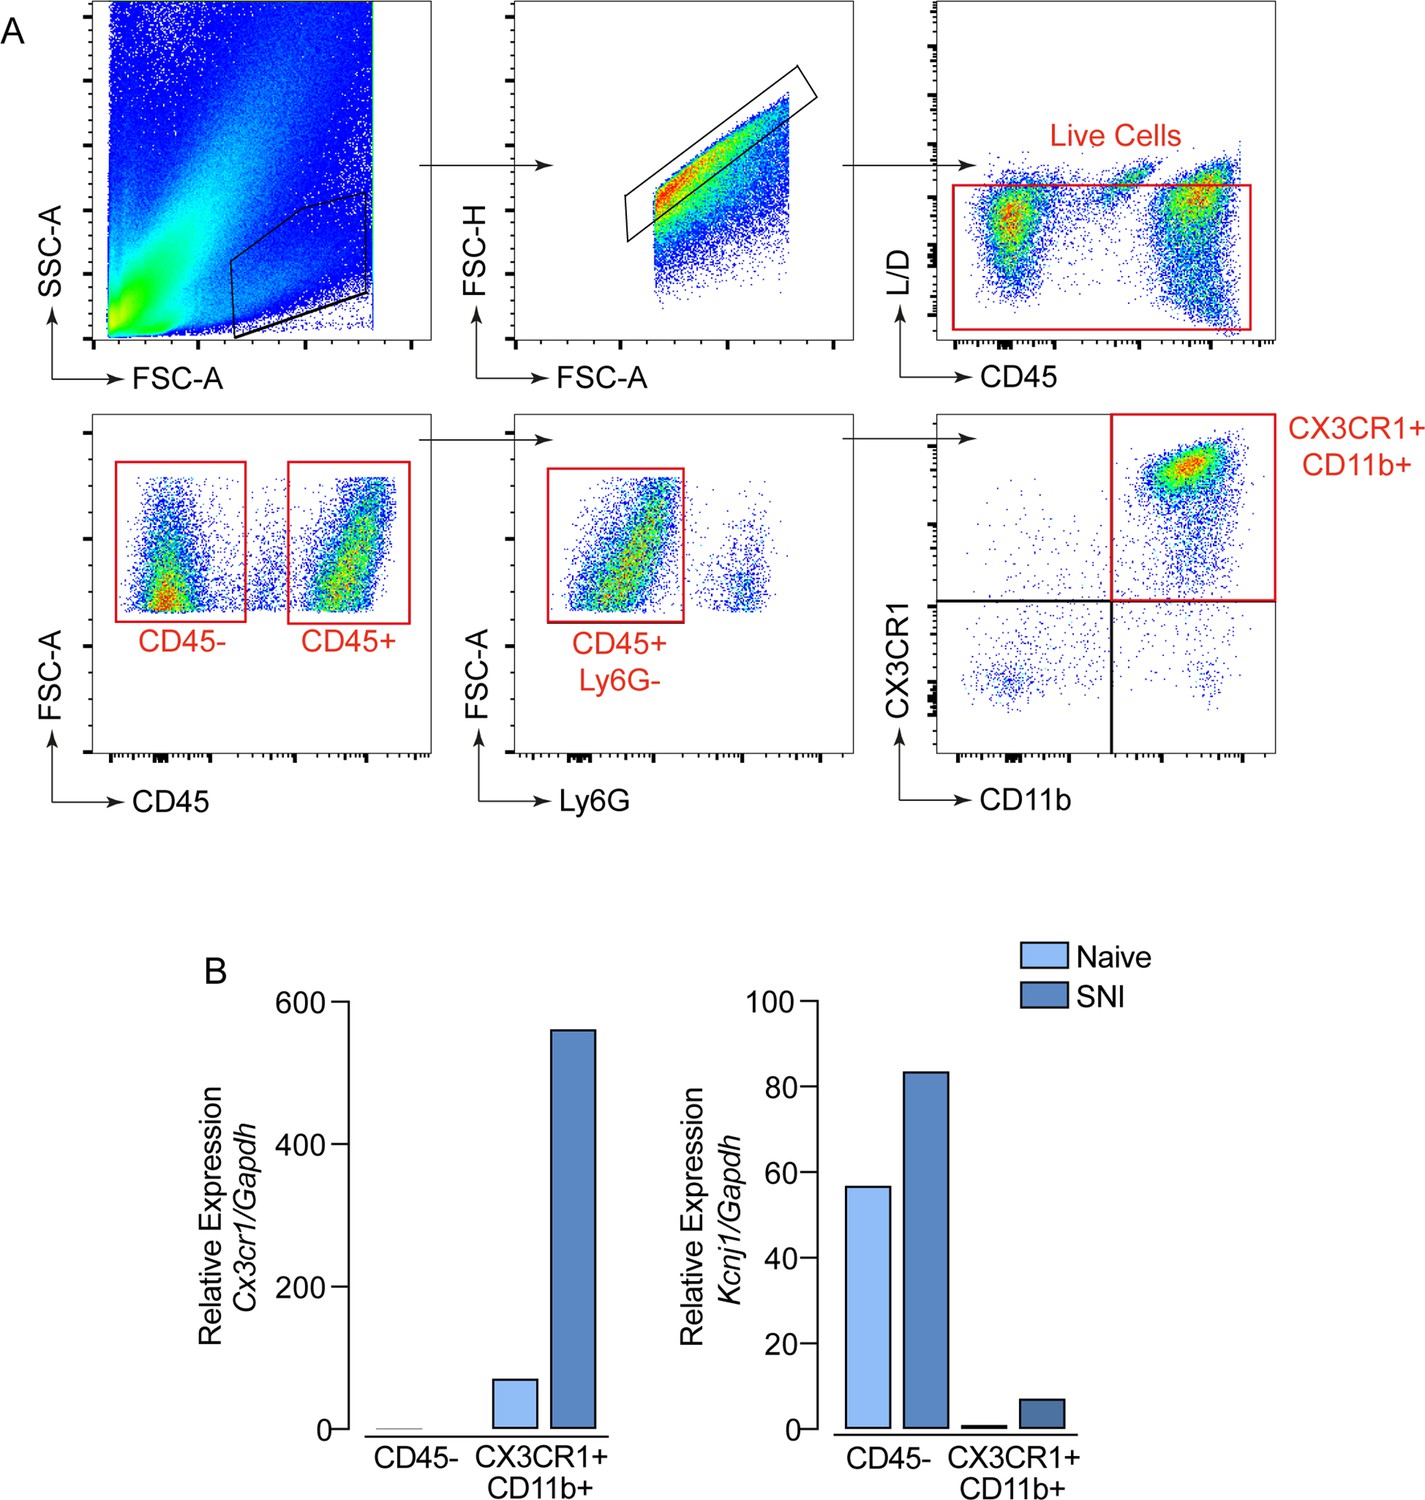
Representative gating strategies for flow cytometry analysis and cell sorting.
(A) Cells suspension isolated from (L3–L5) dorsal root ganglias (DRGs) of Cx3cr1GFP/+ mice (Naive and 7 days after spared nerve injury (SNI); n=8 pooled) were used for cell sorting strategy. Cx3cr1GFP/+ within CD11b+ were sorted as well as CD45− cells. (B) RT-qPCR analysis of Cx3cr1 and Kcnj1 mRNA expression relative to Gapdh in CX3CR1+CD11b+ or CD45− sorted cells. Data are representative of at least two independent experiments.
Tables
Key resources table
| Reagent type (species) or resource | Designation | Source or reference | Identifiers | Additional information |
|---|---|---|---|---|
| Antibody | Iba1 (Rabbit polyclonal) | Wako Chemicals | 019–19,741 | 1:400 |
| Antibody | Ki-67 (Rabbit monoclonal) | Abcam | ab16667 | 1:400 |
| Antibody | Anti-Rabbit IgG Alexa Fluor 594 (Goat-polyclonal) | Invitrogen | A11012 | 1:800 |
| Antibody | Anti-Rabbit IgG Alexa Fluor 647 (Chicken-polyclonal) | Invitrogen | A21443 | 1:800 |
| Antibody | CD45-BV421 (Rat-IgG2b monoclonal) | eBiosciences | 563890 | 1:350 |
| Antibody | CD11b-FITC (Rat-IgG2b monoclonal) | eBiosciences | 553310 | 1:250 |
| Antibody | CX3CR1-PE (Rat-IgG2a-K monoclonal) | Biolegend | 14906 | 1:250 |
| Antibody | Ly6G-APC (Rat-IgG2b monoclonal) | eBiosciences | 17-9668-82 | 1:250 |
| Antibody | Ly6C-PERCP (Rat-IgG2b monoclonal) | eBiosciences | 45-5932-82 | 1:250 |
| Chemical Compound | PBS, pH 7.4 (1x) | Sigma-Aldrich | 10010023 | |
| Chemical Compound | Xylazine | Akorn | NDC59399-110-20 | |
| Chemical Compound | Ketamine | Par Pharmaceutical | NDC42023-115-10 | |
| Chemical Compound | Isoflurane | Cristália | 667940172 | |
| Chemical Compound | TRIzol | Thermo Fischer Scientific | 15596026 | |
| Chemical Compound | High-Capacity cDNA | Thermo Fischer Scientific | 4368814 | |
| Chemical Compound | SYBR Green Master Mix | Thermo Fischer Scientific | ||
| Chemical Compound | RPMI 1640 Medium | Gibco | 11875093 | |
| Chemical Compound | Ara-C | Sigma-Aldrich | 69-74-9 | |
| Chemical Compound | aCSF | Tocris | 3525 | |
| Chemical Compound | Collagenase type 2 | Worthington Biochemical Corporation | 9001-12-1 | |
| Chemical Compound | Fixable Viability Dye eF780 | Thermo Fischer Scientific | 65-0865-14 | |
| Chemical Compound | Triton X-100 | Sigma-Aldrich | T8787 | |
| Chemical Compound | Bovine Seruim Albumin (BSA) | Sigma-Aldrich | A7906-100G | |
| Chemical Compound | Sucrose | Fisher Scientific | S5-500 | |
| Chemical Compound | Tissue Tek | Electron Microscopy Sciences | 62550–01 | |
| Chemical Compound | Veet Hair Remover | Reckitt Benckiser | ||
| Software, algorithm | StepOne Real-Time PCR System | Thermo Fischer Scientific | 4376357 | |
| Software, algorithm | FACSAria III Cell Sorter | BD Biosciences | ||
| Software, algorithm | FACSVerse | BD Biosciences | ||
| Software | Prism | GraphPad | Version 8 | |
| Software | FlowJo | FlowJo | V10.8.1 | |
| Genetic Reagent (Mus musculus C57BL/6) | Cx3cr1GFP | Jackson Laboratories | Strain# 005582 | PMID:17944871 |
| Genetic Reagent (Mus musculus C57BL/6) | Ccr2RFP | Jackson Laboratories | Strain# 017586 | PMID:21060874 |
| Genetic Reagent (Mus musculus C57BL/6) | eGFP C57BL/6-(Tg[CAG-EGFP]) | Jackson Laboratories | Strain# 006567 | PMID:9175875 |
| Genetic Reagent (Mus musculus C57BL/6) | Ms4a3Cre | Liu et al., 2019. | N/A | PMID:31491389 |
| Genetic Reagent (Mus musculus C57BL/6) | Rosa26tdTomato | Jackson Laboratories | Strain# 007914 | PMID:20023653 |
| Sequence-based reagent | Gapdh_F | Sigma-Aldrich (This paper) | PCR primers | GGGTGTGAACCACGAGAAAT |
| Sequence-based reagent | Gapdh_R | Sigma-Aldrich (This paper) | PCR primers | CCTTCCACAATGCCAAAGTT |
| Sequence-based reagent | Aif1_F | Sigma-Aldrich (This paper) | PCR primers | GCTTCAAGTTTGGACGGCAG |
| Sequence-based reagent | Aif1_R | Sigma-Aldrich (This paper) | PCR primers | TGAGGAGCCATGAGCCAAAG |
| Sequence-based reagent | Cx3cr1_F | Sigma-Aldrich (This paper) | PCR primers | GCCTCTGGTGGAGTCTGCGTG |
| Sequence-based reagent | Cx3cr1_R | Sigma-Aldrich (This paper) | PCR primers | CGCCCAAATAACAGGCCTCAGCA |
| Sequence-based reagent | Cx3cl1_F | Sigma-Aldrich (This paper) | PCR primers | CGCGTTCTTCCATTTGTGTA |
| Sequence-based reagent | Cx3cl1_R | Sigma-Aldrich (This paper) | PCR primers | CTGTGTCGTCTCCAGGACAA |
| Sequence-based reagent | Il6_F | Sigma-Aldrich (This paper) | PCR primers | TTCCTACCCCAATTTCCAAT |
| Sequence-based reagent | Il6_R | Sigma-Aldrich (This paper) | PCR primers | CCTTCTGTGACTCCAGCTTATC |
| Sequence-based reagent | Tnf_F | Sigma-Aldrich (This paper) | PCR primers | GCCACAAGCAGGAATGAGAAG |
| Sequence-based reagent | Tnf_R | Sigma-Aldrich (This paper) | PCR primers | AGCAAGCAGCCAACCAGG |
| Sequence-based reagent | Kcnj1_F | Sigma-Aldrich (This paper) | PCR primers | GGGCTATCAGAGGCTGTGTC |
| Sequence-based reagent | Kcnj1_R | Sigma-Aldrich (This paper) | PCR primers | GTGACAGGCAAACTGCTTCA |
| Sequence-based reagent | Il1b_F | Sigma-Aldrich (This paper) | PCR primers | TGACAGTGATGATGAGAATGACCTGTTC |
| Sequence-based reagent | Il1b_R | Sigma-Aldrich (This paper) | PCR primers | TTGGAAGCAGCCCTTCATCT |
| Sequence-based reagent | Cfs1r_F | Sigma-Aldrich (This paper) | PCR primers | ACACGCACGGCCACCATGAA |
| Sequence-based reagent | Cfs1r_R | Sigma-Aldrich (This paper) | PCR primers | GCATGGACCGTGAGGATGAGGC |
Additional files
Download links
A two-part list of links to download the article, or parts of the article, in various formats.
Downloads (link to download the article as PDF)
Open citations (links to open the citations from this article in various online reference manager services)
Cite this article (links to download the citations from this article in formats compatible with various reference manager tools)
Neuron-associated macrophage proliferation in the sensory ganglia is associated with peripheral nerve injury-induced neuropathic pain involving CX3CR1 signaling
eLife 12:e78515.
https://doi.org/10.7554/eLife.78515


